Abstract
Cardiovascular diseases are the leading cause of death globally. The ECG is the most commonly used tool for diagnosing cardiovascular diseases, and, recently, there are a number of attempts to use deep learning to analyze ECG. In this study, we propose a method for performing multi-label classification on standard ECG (12-lead with duration of 10 s) data. We used the ResNet model that can perform residual learning as a base model for classification in this work, and we tried to improve performance through SE-ResNet, which added squeeze and excitation blocks on the plain ResNet. As a result of the experiment, it was possible to induce overall performance improvement through squeeze and excitation blocks. In addition, the random k-labelsets (RAKEL) algorithm was applied to improve the performance in multi-label classification problems. As a result, the model that applied soft voting through the RAKEL algorithm to SE-ResNet-34 represented the best performance, and the average performances according to the number of label divisions k were achieved 0.99%, 88.49%, 92.43%, 90.54%, and 93.40% in exact match, accuracy, F1-score, precision, and recall, respectively.
1. Introduction
Cardiovascular diseases (CVDs) are the leading cause of mortality and morbidity worldwide, and are a generic term for disorders of the heart or blood vessels. According to the World Health Organization (WHO), approximately 17.9 million people died from CVDs in 2019, accounting for 32% of global deaths [1]. In particular, about 80% of these sudden cardiac deaths are the result of ventricular arrhythmias [2,3]. Arrhythmias are when the electrical signals that control the heart’s rhythm are out of sequence. In other words, arrhythmia is an abnormality in the rhythm of the heart, which can be slow, fast, or irregular [3]. Arrhythmias are accompanied by various symptoms and have various risks ranging from mild fluttering to death. Because of the high mortality rates of CVDs, early detection and accurate identification of arrhythmias are essential for treatment of patient [4]. The electrocardiogram (ECG), which records the electrical activity of the heart, is the most commonly used tool to detect arrhythmias due to its low cost and non-invasive characteristics.
The standard ECG refers to the 12-lead ECG with a short duration of 10 s, which can provide sufficient information for the diagnosis of various disease [5]. Therefore, a method that allows for an accurate interpretation of the ECG is required. However, the diagnosing of arrhythmias through ECG records requires a time-consuming process by an experienced physician. Furthermore, there may be subtle changes in the ECG that have not been detected. To overcome these problems, computer-aided diagnosis (CAD) algorithms have been used to automate the diagnosis of arrhythmias. Traditional CAD methods require the use of manually processed features, which are the most important step for classification [6]. Kernel-based [7,8,9], wavelet transform [10,11,12], and Fourier transform [13,14] methods were used to perform feature extraction, such as signal preprocessing and waveform detection. This feature extraction step is generally designed by experience and requires specific expertise [6]. However, recent advances in deep learning can perform tasks more efficiently than traditional methods without the need to feature extraction.
Deep learning can be used to classify patterns, extract features to identify meaningful hidden information from data. In analyzing ECG, deep learning methods demonstrated better classification performance than previous traditional methods when trained with sufficient data [6]. There are many studies to use deep learning to analyze ECG [15]. However, most attempts were designed using single lead ECG, which remains the possibility of using more information from raw ECG data [16]. Clearly, there are investigations that performed the desired tasks with 12-lead (or multi-lead) ECG as inputs [17,18]. Their common purpose is to predict and classify a single label, yet the PTB-XL ECG dataset [19] used in this study has a total of 5 superclasses, and since it can have various classes simultaneously, multi-label prediction is required. We used the k-label set method [20] to solve this problem, and convolutional neural network (CNN)-based model was used as a deep learning architecture for classification.
CNN is deep learning architecture designed to learn topological information and patterns appearing in adjacent spaces, and has demonstrated impressive performance in computer vision [21,22,23,24], natural language processing [24,25], medical fields [15,26], and many other tasks. CNN has been continuously evolving since LeNet [27], and has become the most prioritized model in image-related tasks. Over the past decade, various CNN-based models, such as VGGNet [28] and GooLeNet [29] have shown good classification performance since the advent of the first large-scale CNN, AlexNet [21]. However, due to the gradient vanishing problem, as the layer of the model deepened, it was revealed that the performance deteriorated, and a problem occurred that the training was not performed properly. ResNet [30] overcomes this problem through residual learning using skip connection.
In summary, we propose a method to solve the multi-label classification problem of ECG signals based on SE-ResNet, which applies the squeeze and excitation method [31] to ResNet. The squeeze and excitation method consists of two steps. Through the squeeze step, the entire information corresponding to the channel can be expressed as a channel descriptor. Then, in excitation step, the relative importance of each channel is calculated using the information obtained in the previous step and used as weights. Using squeeze and excitation method, we recalibrate the feature information in ResNet, and use this model for multi-label classification. The remainder of this paper is summarized as follows: In Section 2, we explain the dataset and methods used in our experiment. We describe experimental results in Section 3, and in Section 4, we present our evaluations of the findings.
2. Materials and Methods
2.1. Dataset
The PTB-XL ECG dataset [19] is composed of open data that can be obtained from the Physionet [32] site managed by the MIT Laboratory for Computational Physiology. The dataset included waveform data collected from October 1989 to June 1996 with a Schiller AG device and was created so that individual patients could not be identified. Waveform data are provided in waveform database (WFDB) format in 100 Hz and 500 Hz, and 100 Hz data were used in this study. The structured data consisted of 21,837 clinical 12-lead ECGs of 18,885 patients. In total, 71 ECG descriptions conforming to SCP-ECG standards, prepared by two cardiologists, have been documented, along with demographic items, such as age, gender, and height. One ECG datum was excluded because the measurement was interrupted in the middle, and a total of 21,836 data were used. Therefore, the format of the input data we used is equal to 21,386 × 12 × 1000. Diagnosis of ECG data is classified into five superclasses: normal ECG (NORM), myocardial infarction (MI), ST/T change (STTC), conduction disturbance (CD), and Hypertrophy (HYP). This superclass is further subclassed into subclasses, and the description of each class can be found in Table 1 [19]. The entire dataset was split into 60:20:20 ratio and used as training (13,101), validation (4367), and test sets (4368), respectively.

Table 1.
SCP-ECG acronym descriptions for super- and subclasses [19].
2.2. ResNet and Squeeze and Excitation Network
2.2.1. ResNet
The purpose of neural networks classifier was to find a function that maps the input x to the label y. This approach causes gradient vanishing problems when layers become deeper. In other words, as the layers get deeper, the gradient gradually decreases as the backpropagation process returns to the input layer. Therefore, the weights are not updated in the layer close to the input layer, making it difficult to find the mapping function that want to find. The advent of ResNet [30] made it possible to deal these issues. The gradient vanishing problem was solved by adding a shortcut that skips over the middle, rather than consecutively in the order of the connections between the layers. The shortcut connection calculates the residuals based on how much it has changed from the previous value, which ensures that the gradient delivered is at least 1. Figure 1 shows the structure of the residual block in ResNet architecture. It can be confirmed that is output by adding the input feature map X with and the feature map that X passed through the residual block. When C, H, and W mean the number of channel, height, and width in feature map X, respectively. Additionally, the details and variants of the network structure according to the number of layers used in this work can be found in Table 2.
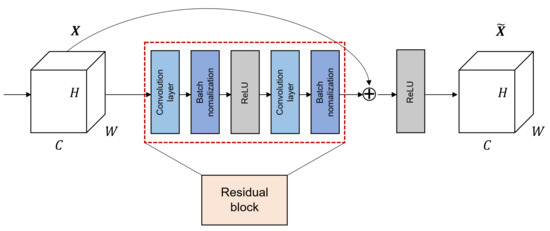
Figure 1.
The structure of residual block in ResNet when the block is composed of two convolution layers.
Table 2.
Architectural configurations for ResNet. Building blocks are shown in brackets, with the numbers of blocks stacked.
2.2.2. Squeeze and Excitation Network
The squeeze and excitation network (SENet) [31] is designed to train the importance of convoluted features in the CNN training process. The goal of SENet is to recalibrate interaction between channels in the feature representation via CNN through each squeeze and excitation phase. Based on the obtained information, new weights were given for each channel to improve performance. In other words, the squeeze and excitation block (SE block) overcomes the limitations of a traditional CNN, which learned only information corresponding to a local receptive fields, and collects and delivers information on all fields. The networks can be flexibly expanded with additional SE blocks, and performance improvements can be achieved with little additional calculations.
This method consists of two phases: squeeze and excitation. The squeeze step extracts the entire information corresponding to the channels. When a feature map X with dimensions becomes a feature map U of size through convolution layer, the size of the feature map corresponding to one channel in U is . Feature maps for each channel are squeezed into 1 × 1 feature maps using channel descriptor function, such as global average pooling (GAP) [33]. In this phase, a scalar value representing global information about the channel is created. The squeeze process represented in Equation (1), where denotes a feature map corresponding to channel c after X has passed convolution layer. represents the channel descriptor function, and GAP was used in this study.
In the excitation step, the channel-wise dependencies are considered by using the descriptor for each channel obtained through the squeeze step. This task can be achieved through fully-connected and non-linear functions. The excitation step is shown in Equation (2), where z is the value obtained by squeeze, are the FC layers, and is the sigmoid function. Due to the sigmoid, the output value of the excitation step has a value between 0 and 1, and it can be used as a weight for calibration. A new weight s obtained by excitation is multiplied by the existing feature map U. Figure 2 shows how SE-ResNet used in this study works, and represent the structure of the squeeze and excitation phases in the SE block.
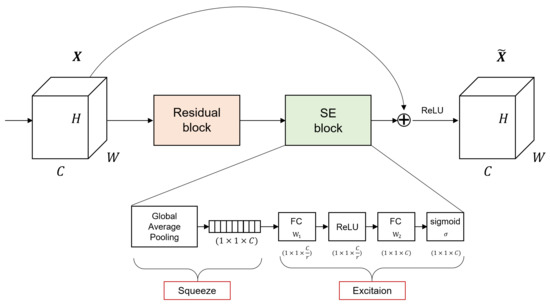
Figure 2.
The SE-ResNet structure is configured by adding SE block to ResNet used in this study.
2.3. Proposed Model Architecture
The architecture of the model proposed in this study is shown in the Figure 3 and is basically based on the RAKEL algorithm [20]. In RAKEL algorithm, let L be a set of l labels in a multi-label classification problems. In the ECG signal classification problem in this study, . The RAKEL method creates mk-subsets of L, such as , . The existing RAKEL model randomly selects m subsets, but since this study uses all subsets, . Original labels on all samples were translated into new labels based on labels in a set, resulting in one new label for each sample. Then, using samples with new labels, a single-label classifier is constructed. In this study, the SE-ResNet-34 model, which showed the best performance among 8 ResNet and SE-ResNet models, was used as a single-label classifier. All developed m SE-ResNet-34 models were put into the RAKEL model. The label set for a query sample is determined by combining the outputs of m classifiers. The method of combining outputs uses a soft voting method that sums all output values and passes through the sigmoid activation function.
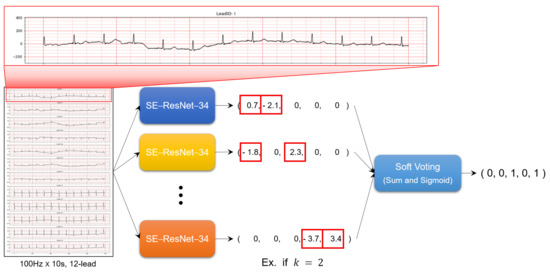
Figure 3.
The overall framework for multi-label ECG classification based on SE-Resnet.
2.4. Evaluation Metrics
Since the superclass classification problem of the PTB-XL ECG dataset is multi-label classification, we used the following five evaluation metrics to evaluate the model performance.
- Accuracy: The percentage of correctly classified exampleswhere , , , represent the number of true positives, true negatives, false positives, and false negatives, respectively;
- Precision: The fraction of true positives among all predictions of a given class
- Recall: the percentage of examples in a given class that the model correctly predicts as belonging to that class
- The F1-score: The harmonic mean of precision and recall is the F1-score, which is an overall assessment of the quality of a classifier’s predictions
- Exact match (subset accuracy): This is a metric of indicating the correct ratio for all labels. There is a disadvantage of ignoring partially correct predictions because they must all be matched. Additionally, because of this, the dependency on the label is taken into account.where N, , represent the total number of samples in test dataset, classifier’s prediction, and true label, respectively.
3. Experimental Results
3.1. Multi-Label Classification Results Based on Superclass
Table 3 shows the classification result of the ResNet, SE-ResNet, and the proposed model with k-labelsets. In the case of ResNet and SE-ResNet models, the respective results using 18, 34, 50, and 101 layers are presented for comparison. In the case of plain ResNet, when 18 layers were used, exact match, F1-score, and recall showed the best at 60.67%, 92.06%, and 93.81%, respectively, and when 34 layers were used, accuracy showed the best at 88.02%. Additionally, the ResNet-50 model showed the highest precision at 91.06%. Meanwhile, in the case of SE-ResNet, when 34 layers were used, exact match, accuracy, and F1-score were the highest at 61.42%, 88.48%, and 92.40%. Furthermore, in order to compare the performance of the overall models, the performance of each model was presented as an average value. When comparing the averages, the results of using the squeeze-and-excitation network in all metrics were better than the results of plain ResNet. However, the increase in all metrics was less than 1% except exact match. In particular, SE-ResNet using 34 layers showed the best performance in all metrics except precision and recall. Therefore, in this study, the k-labelsets method was applied to the SE-ResNet-34 model, and the results were calculated by changing . When , F1-score and recall were the highest at 92.84% and 94.87%, and when , exact match, accuracy, and precision showed the best results at 63.76%, 89.16%, and 91.62%. In order to compare the results of all models, the highest value for each metric is shown in bold. Comparing the averages of plain ResNet, SE-ResNet, and the proposed models, the proposed model showed the best performance in all measures.
Table 3.
Classification performance for each model based on superclass (the proposed model with k-labelsets uses SE-ResNet-34 as a classifier).
Figure 4 shows the confusion matrices generated by the proposed model with 4-labelsets that showed the best accuracy performance. Figure 4a illustrates the confusion matrix on the classification of ‘MI’ ECG records. The figure demonstrates that the proposed model with 3-labelsets has correctly classified 3095 instances as absence of ‘MI’ and 1162 instances as presence of ‘MI’. Similarly, Figure 4b shows the confusion matrix on the classification of ‘STTC’ ECG records. The figure exhibits that the proposed model has effectively classified 3041 instances as absence of ‘STTC’ and 802 instances as presence of ‘STTC’. Likewise, Figure 4c displays the confusion matrix on the classification of ‘CD’ ECG records. The figure showcases that 3300 cases correctly classified the absence of ‘CD’ and 657 cases correctly classified the presence of ‘CD’. Followed by, Figure 4d shows the confusion matrix on the classification of ‘HYP’ ECG records. The figure outperformed that the proposed method has effectively classified 3762 instances as absence of ‘HYP’ and 230 instances as presence of ‘HYP’. In line with this, Figure 4e portrays the confusion matrix on the classification of ‘NORM’ ECG records. The figure demonstrates that 2113 cases correctly classified the absence of ‘NORM’ and 1722 cases correctly classified the presence of ‘NORM’.

Figure 4.
The confusion matrices generated by the proposed model with 3-labelsets.
3.2. Multi-Label Classification Results Based on Subclass
Table 4 shows the multi-label classification results of the proposed model with k-labelsets based on the subclass. When classifying using subclasses, the number of subclass labels is 23, so if all k-labelsets are used, it takes too long to train the model. Therefore, like the original RAKEL algorithm, we randomly selected 23 k-labelsets and observed the model performance while changing the k value. As with the superclass results, the highest value of each metric is bolded to compare the results of all models. Comparing the performance of the proposed model with k-labelsets based on the superclass and the subclass, it can be seen that the performance of the subclass is greatly degraded with the exact match 88.94% and 62.50%, respectively. However, since the number of labels in the subclass is 23, it seems reasonable in that it is difficult to accurately match all the labels. Looking at the performance of the model according to k, exact match was the best at 58.01% when , and accuracy was the highest at 83.82% at , , and . For F1-score, when , and , the performance of the proposed model was the highest at 90.15%. Additionally, precision showed the best performance with 89.60% when , and recall was the highest with 90.90% when .
Table 4.
Classification performance for the proposed model with k-labelsets based on subclass (The proposed model with k-labelsets uses SE-ResNet-34 as a classifier).
3.3. Comparison between Existing Studies and the Proposed Model
In this subsection, we conducted performance comparisons with existing methods. Strodthoff et al. [34] performed various tasks using the PTB-XL ECG dataset based on deep learning. For classification tasks, CNN-based methods and ensemble methods demonstrated superior performance. They obtained classification AUC and F1-score of 93.4% and 82.5% for superclass, 93.0% and 76.6% for subclass, respectively. Zhang et al. [35] performed classification for NORMAL, AF, I-AVC, LBBB, and PAC classes in the PTB-XL ECG dataset. The inception-ResNet-v2 model [36] was used, and classification was performed by converting the ECG signal into a 2-dimensional texture image. As a result of classification using 5 classes, a F1-score of 88.62% was obtained. Zhaowei et al. [37] performed classification using 6 public ECG data. Classification was performed on 27 classes using SE-ResNet, and 0.885 was achieved in the challenge score, the evaluation criterion of the PhysioNet/Computing in Cardiology Challenge 2020 [38]. Although there are various ECG classification results, it is difficult to compare directly due to labeling methods and evaluation metrics are different, in addition, there is a difference in the purpose of classification. Nevertheless, our method has been found to be superior in terms of F1-score.
4. Discussion
This paper has proposed a model applying the k-labelsets methodology to SE-ResNet-34 to solve the multi-label ECG signal classification problem. Although the existing RAKEL algorithm randomly selected k-subsets, this study used all k-subsets and observed the performance of the model while changing the value of k. In addition, the proposed model uses a soft voting method that sums the outputs of classifiers and passes through sigmoid activation, unlike the existing algorithm using majority voting. SE-ResNet-34 was used as a classifier to apply the k-labelsets methodology because this model showed the best performance while changing the depth of plain ResNet and SE-ResNet models. In both the plain ResNet model and the SE-ResNet model, even if the deep model was used, it did not show better performance. Although the residual block is structured so that the performance does not deteriorate even if the depth of the model is deep by using the shortcut connection, the deep model did not show good performance only for the classification problem of ECG data. CNN is suitable for image classification problems, and ECG data have a very small amount of data compared to images, so it does not seem to show good performance even if the depth of the model is deep. The results of comparing plain ResNet and SE-ResNet showed that the overall performance improved when the squeeze and excitation network was used, but the performance measures were improved by less than 1% except exact match. Among plain ResNet and SE-ResNet models the SE-ResNet model using 34 layers showed the best performance, and the k-labelsets method was applied to this model. In the multi-label classification problem based on superclass, the proposed model applying the k-labelsets methodology showed good overall performance regardless of the value of k, and showed the best exact match, accuracies, and precision of 63.76%, 89.16%, and 91.62%, respectively, when . Furthermore, when , it showed the best F1-score and recall value of 92.84% and 94.87%. The performance of the proposed model in multi-label classification based on subclasses was also examined. The model with showed the highest values in exact match, Accuracy, and precision, and was the model with the best overall performance. It was helpful to increase the value of k to take into account the values of other labels, as all labels must be matched correctly for exact match to be high. On the other hand, accuracy and F1-score were highest even when and . Since these metrics do not need to consider the values of other labels, as the k increases, the values of the metrics increase and then decrease. However, since this number is not high enough to make a diagnosis, a follow-up study is needed to improve diagnosis accuracy by using not only ECG data but also demographic data, such as gender, height, and age. In addition, it is also necessary to analyze whether there are any differences between classifying 100 Hz ECG data and classifying 500 Hz ECG data.
Author Contributions
Conceptualization, M.-S.K.; methodology, B.K.; software, J.Y., Y.J.; validation, J.Y., Y.J.; formal analysis, J.Y., Y.J.; investigation, J.Y., Y.J.; resources, B.K.; data curation, J.Y.; writing—original draft preparation, J.Y.; writing—review and editing, J.Y.; visualization, Y.J.; supervision, B.K., M.-S.K. All authors have read and agreed to the published version of the manuscript.
Funding
This work was supported by the National Research Foundation of Korea (NRF) grant funded by the Korea government (MSIT) (No. 2019R1G1A1100704 and No. 2021R1F1A1060049) and also by the BK21 FOUR (Fostering Outstanding Universities for Research, No. 5120200913674) funded by the Ministry of Education (MOE, Korea) and National Research Foundation of Korea (NRF).
Institutional Review Board Statement
The PTB-XL ECG dataset was approved by the Institutional Ethics Committee for publication of anonymous data in a public access database.
Informed Consent Statement
Not applicable.
Data Availability Statement
The dataset is managed by the MIT Laboratory for Computational Physiology and is accessible at the following site: https://physionet.org/content/ptb-xl/1.0.0/ (accessed on 25 July 2021).
Acknowledgments
This work was supported by the National Research Foundation of Korea (NRF) grant funded by the Korea government (MSIT) (No. 2019R1G1A1100704 and No. 2021R1F1A1060049) and also by the BK21 Fostering Outstanding Universities for Research (FOUR, NO.5120200913674) funded by the Ministry of Education (MOE, Korea) and National Research Foundation of Korea (NRF). B.K. and M.-S.K. are co-corresponding authors of this work.
Conflicts of Interest
The authors declare no conflict of interest.
References
- World Health Organization. Cardiovascular Diseases (CVDs). 2021. Available online: https://www.who.int/en/news-room/fact-sheets/detail/cardiovascular-diseases-(cvds) (accessed on 14 July 2021).
- Mehra, R. Global public health problem of sudden cardiac death. J. Electrocardiol. 2007, 40, S118–S122. [Google Scholar] [CrossRef]
- Martin, C.A.; Matthews, G.D.K.; Huang, C.L.H. Sudden cardiac death and inherited channelopathy: The basic electrophysiology of the myocyte and myocardium in ion channel disease. Heart 2012, 98, 536–543. [Google Scholar] [CrossRef] [PubMed] [Green Version]
- Rosiek, A.; Leksowski, K. The risk factors and prevention of cardiovascular disease: The importance of electrocardiogram in the diagnosis and treatment of acute coronary syndrome. Ther. Clin. Risk Manag. 2016, 12, 1223–1229. [Google Scholar] [CrossRef] [Green Version]
- Dupre, A.; Vincent, S.; Iaizzo, P.A. Basic ECG Theory, Recordings, and Interpretation. In Handbook of Cardiac Anatomy, Physiology, and Devices; Iaizzo, P.A., Ed.; Humana Press: Totowa, NJ, USA, 2005; pp. 191–201. [Google Scholar]
- Murat, F.; Yildirim, O.; Talo, M.; Baloglu, U.B.; Demir, Y.; Acharya, U.R. Application of deep learning techniques for heartbeats detection using ECG signals-analysis and review. Comput. Biol. Med. 2020, 120, 103726. [Google Scholar] [CrossRef] [PubMed]
- Zuo, W.; Lu, W.; Wang, K.; Zhang, H. Diagnosis of cardiac arrhythmia using kernel difference weighted KNN classifier. In Proceedings of the 2008 Computers in Cardiology, Bologna, Italy, 14–17 September 2008; pp. 253–256. [Google Scholar]
- Roy, U.D.; Ghorai, S.; Mukherjee, A. Kernel-based feature extraction for patient-adaptive ECG beat classification. In Proceedings of the 2016 International Conference on Systems in Medicine and Biology (ICSMB), Kharagpur, India, 4–7 January 2016; pp. 144–147. [Google Scholar]
- Li, H.; Yuan, D.; Wang, Y.; Cui, D.; Cao, L. Arrhythmia Classification Based on Multi-Domain Feature Extraction for an ECG Recognition System. Sensors 2016, 16, 1744. [Google Scholar] [CrossRef] [Green Version]
- Martis, R.J.; Acharya, U.R.; Min, L.C. ECG beat classification using PCA, LDA, ICA and Discrete Wavelet Transform. Biomed. Signal Process. Control 2013, 8, 437–448. [Google Scholar] [CrossRef]
- Martis, R.J.; Acharya, U.R.; Adeli, H.; Prasad, H.; Tan, J.H.; Chua, K.C.; Too, C.L.; Yeo, S.W.J.; Tong, L. Computer aided diagnosis of atrial arrhythmia using dimensionality reduction methods on transform domain representation. Biomed. Signal Process. Control 2014, 13, 295–305. [Google Scholar] [CrossRef]
- Dewangan, N.K.; Shukla, S.P. ECG arrhythmia classification using discrete wavelet transform and artificial neural network. In Proceedings of the 2016 IEEE International Conference on Recent Trends in Electronics, Information Communication Technology (RTEICT), Bangalore, India, 20–21 May 2016; pp. 1892–1896. [Google Scholar]
- A. Hadhoud, M.M.; Eladawy, M.I.; Farag, A. Computer Aided Diagnosis of Cardiac Arrhythmias. In Proceedings of the 2006 International Conference on Computer Engineering and Systems, Cairo, Egypt, 5–7 November 2006; pp. 262–265. [Google Scholar]
- Tripathy, R.K.; Zamora-Mendez, A.; de la O Serna, J.A.; Paternina, M.R.A.; Arrieta, J.G.; Naik, G.R. Detection of Life Threatening Ventricular Arrhythmia Using Digital Taylor Fourier Transform. Front. Physiol. 2018, 9, 722. [Google Scholar] [CrossRef] [Green Version]
- Min, S.; Lee, B.; Yoon, S. Deep learning in bioinformatics. Brief. Bioinform. 2016, 18, 851–869. [Google Scholar] [CrossRef] [Green Version]
- Zhu, H.; Cheng, C.; Yin, H.; Li, X.; Zuo, P.; Ding, J.; Lin, F.; Wang, J.; Zhou, B.; Li, Y.; et al. Automatic multilabel electrocardiogram diagnosis of heart rhythm or conduction abnormalities with deep learning: A cohort study. Lancet Digit. Health 2020, 2, e348–e357. [Google Scholar] [CrossRef]
- Baloglu, U.B.; Talo, M.; Yildirim, O.; Tan, R.S.; Acharya, U.R. Classification of myocardial infarction with multi-lead ECG signals and deep CNN. Pattern Recognit. Lett. 2019, 122, 23–30. [Google Scholar] [CrossRef]
- Ribeiro, A.H.; Ribeiro, M.H.; Paixão, G.M.M.; Oliveira, D.M.; Gomes, P.R.; Canazart, J.A.; Ferreira, M.P.S.; Andersson, C.R.; Macfarlane, P.W.; Meira, W., Jr.; et al. Automatic diagnosis of the 12-lead ECG using a deep neural network. Nat. Commun. 2020, 11, 1760. [Google Scholar] [CrossRef] [PubMed] [Green Version]
- Wagner, P.; Strodthoff, N.; Bousseljot, R.D.; Kreiseler, D.; Lunze, F.I.; Samek, W.; Schaeffter, T. PTB-XL, a large publicly available electrocardiography dataset. Sci. Data 2020, 7, 1–15. [Google Scholar] [CrossRef] [PubMed]
- Tsoumakas, G.; Katakis, I.; Vlahavas, I. Random k-Labelsets for Multilabel Classification. IEEE Trans. Knowl. Data Eng. 2011, 23, 1079–1089. [Google Scholar] [CrossRef]
- Krizhevsky, A.; Sutskever, I.; Hinton, G.E. ImageNet Classification with Deep Convolutional Neural Networks. In Advances in Neural Information Processing Systems; Pereira, F., Burges, C.J.C., Bottou, L., Weinberger, K.Q., Eds.; Curran Associates, Inc.: Red Hook, NY, USA, 2012; Volume 25. [Google Scholar]
- Szegedy, C.; Toshev, A.; Erhan, D. Deep Neural Networks for Object Detection. In Advances in Neural Information Processing Systems; Curran Associates, Inc.: Red Hook, NY, USA, 2013; Volume 26. [Google Scholar]
- Long, J.; Shelhamer, E.; Darrell, T. Fully convolutional networks for semantic segmentation. In Proceedings of the 2015 IEEE Conference on Computer Vision and Pattern Recognition (CVPR), Boston, MA, USA, 7–12 June 2015; pp. 3431–3440. [Google Scholar]
- Young, T.; Hazarika, D.; Poria, S.; Cambria, E. Recent Trends in Deep Learning Based Natural Language Processing. arXiv 2017, arXiv:1708.02709. [Google Scholar]
- Vaswani, A.; Shazeer, N.; Parmar, N.; Uszkoreit, J.; Jones, L.; Gomez, A.N.; Kaiser, L.; Polosukhin, I. Attention Is All You Need. arXiv 2017, arXiv:1706.03762. [Google Scholar]
- Hesamian, M.H.; Jia, W.; He, X.; Kennedy, P. Deep Learning Techniques for Medical Image Segmentation: Achievements and Challenges. J. Digit. Imaging 2019, 32, 582–596. [Google Scholar] [CrossRef] [Green Version]
- Lecun, Y.; Bottou, L.; Bengio, Y.; Haffner, P. Gradient-based learning applied to document recognition. Proc. IEEE 1998, 86, 2278–2324. [Google Scholar] [CrossRef] [Green Version]
- Simonyan, K.; Zisserman, A. Very Deep Convolutional Networks for Large-Scale Image Recognition. arXiv 2014, arXiv:1409.1556. [Google Scholar]
- Szegedy, C.; Liu, W.; Jia, Y.; Sermanet, P.; Reed, S.; Anguelov, D.; Erhan, D.; Vanhoucke, V.; Rabinovich, A. Going deeper with convolutions. In Proceedings of the 2015 IEEE Conference on Computer Vision and Pattern Recognition (CVPR), Boston, MA, USA, 7–12 June 2015; pp. 1–9. [Google Scholar]
- He, K.; Zhang, X.; Ren, S.; Sun, J. Deep Residual Learning for Image Recognition. In Proceedings of the 2016 IEEE Conference on Computer Vision and Pattern Recognition (CVPR), Las Vegas, NV, USA, 27–30 June 2016; pp. 770–778. [Google Scholar]
- Hu, J.; Shen, L.; Sun, G. Squeeze-and-Excitation Networks. In Proceedings of the IEEE Conference on Computer Vision and Pattern Recognition (CVPR), Salt Lake City, UT, USA, 18–23 June 2018. [Google Scholar]
- Goldberger, A.L.; Amaral, L.A.; Glass, L.; Hausdorff, J.M.; Ivanov, P.C.; Mark, R.G.; Mietus, J.E.; Moody, G.B.; Peng, C.K.; Stanley, H.E. PhysioBank, PhysioToolkit, and PhysioNet: Components of a new research resource for complex physiologic signals. Circulation 2000, 101, e215–e220. [Google Scholar] [CrossRef] [Green Version]
- Lin, M.; Chen, Q.; Yan, S. Network In Network. arXiv 2014, arXiv:1312.4400. [Google Scholar]
- Strodthoff, N.; Wagner, P.; Schaeffter, T.; Samek, W. Deep Learning for ECG Analysis: Benchmarks and Insights from PTB-XL. IEEE J. Biomed. Health Inform. 2021, 25, 1519–1528. [Google Scholar] [CrossRef] [PubMed]
- Zhang, H.; Liu, C.; Zhang, Z.; Xing, Y.; Liu, X.; Dong, R.; He, Y.; Xia, L.; Liu, F. Recurrence Plot-Based Approach for Cardiac Arrhythmia Classification Using Inception-ResNet-v2. Front. Physiol. 2021, 12, 558. [Google Scholar] [CrossRef] [PubMed]
- Szegedy, C.; Ioffe, S.; Vanhoucke, V. Inception-v4, Inception-ResNet and the Impact of Residual Connections on Learning. arXiv 2016, arXiv:1602.07261. [Google Scholar]
- Zhu, Z.; Wang, H.; Zhao, T.; Guo, Y.; Xu, Z.; Liu, Z.; Liu, S.; Lan, X.; Sun, X.; Feng, M. Classification of Cardiac Abnormalities From ECG Signals Using SE-ResNet. In Proceedings of the 2020 Computing in Cardiology, Rimini, Italy, 13–16 September 2020; pp. 1–4. [Google Scholar]
- Alday, E.A.P.; Gu, A.; Shah, A.J.; Robichaux, C.; Wong, A.K.I.; Liu, C.; Liu, F.; Rad, A.B.; Elola, A.; Seyedi, S.; et al. Classification of 12-lead ECGs: The PhysioNet/Computing in Cardiology Challenge 2020. Physiol. Meas. 2021, 41, 124003. [Google Scholar] [CrossRef]
Publisher’s Note: MDPI stays neutral with regard to jurisdictional claims in published maps and institutional affiliations. |
© 2021 by the authors. Licensee MDPI, Basel, Switzerland. This article is an open access article distributed under the terms and conditions of the Creative Commons Attribution (CC BY) license (https://creativecommons.org/licenses/by/4.0/).