
Cascade Network with Deformable Composite Backbone for Formula Detection in Scanned Document Images

 ,
, 
 ,
, 
Abstract
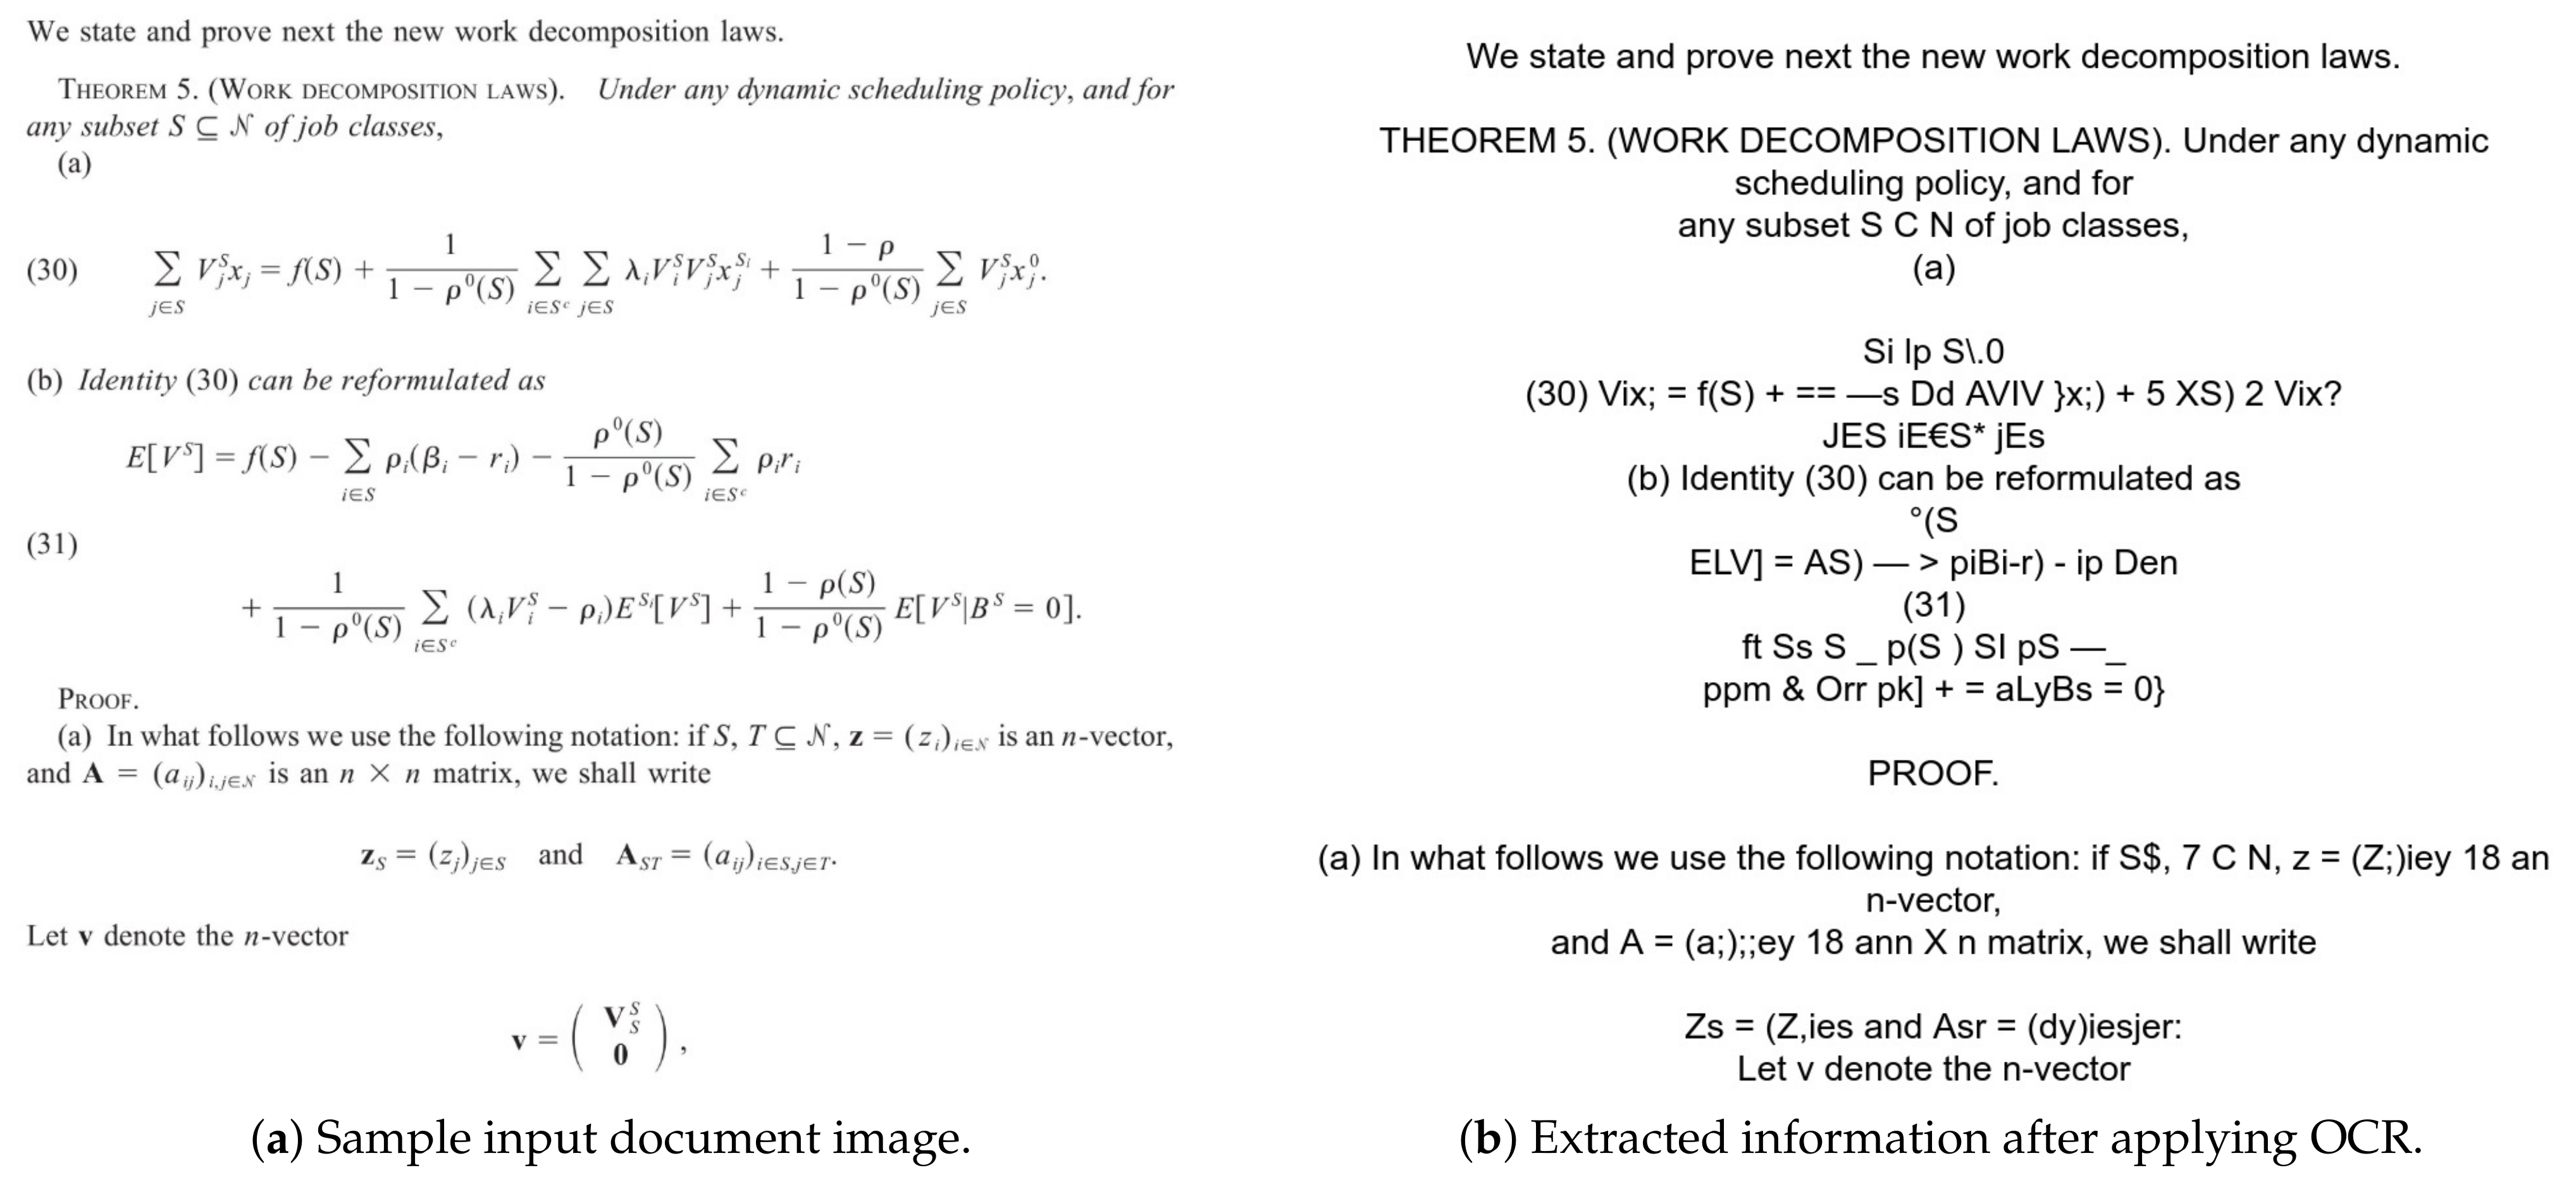
:1. Introduction
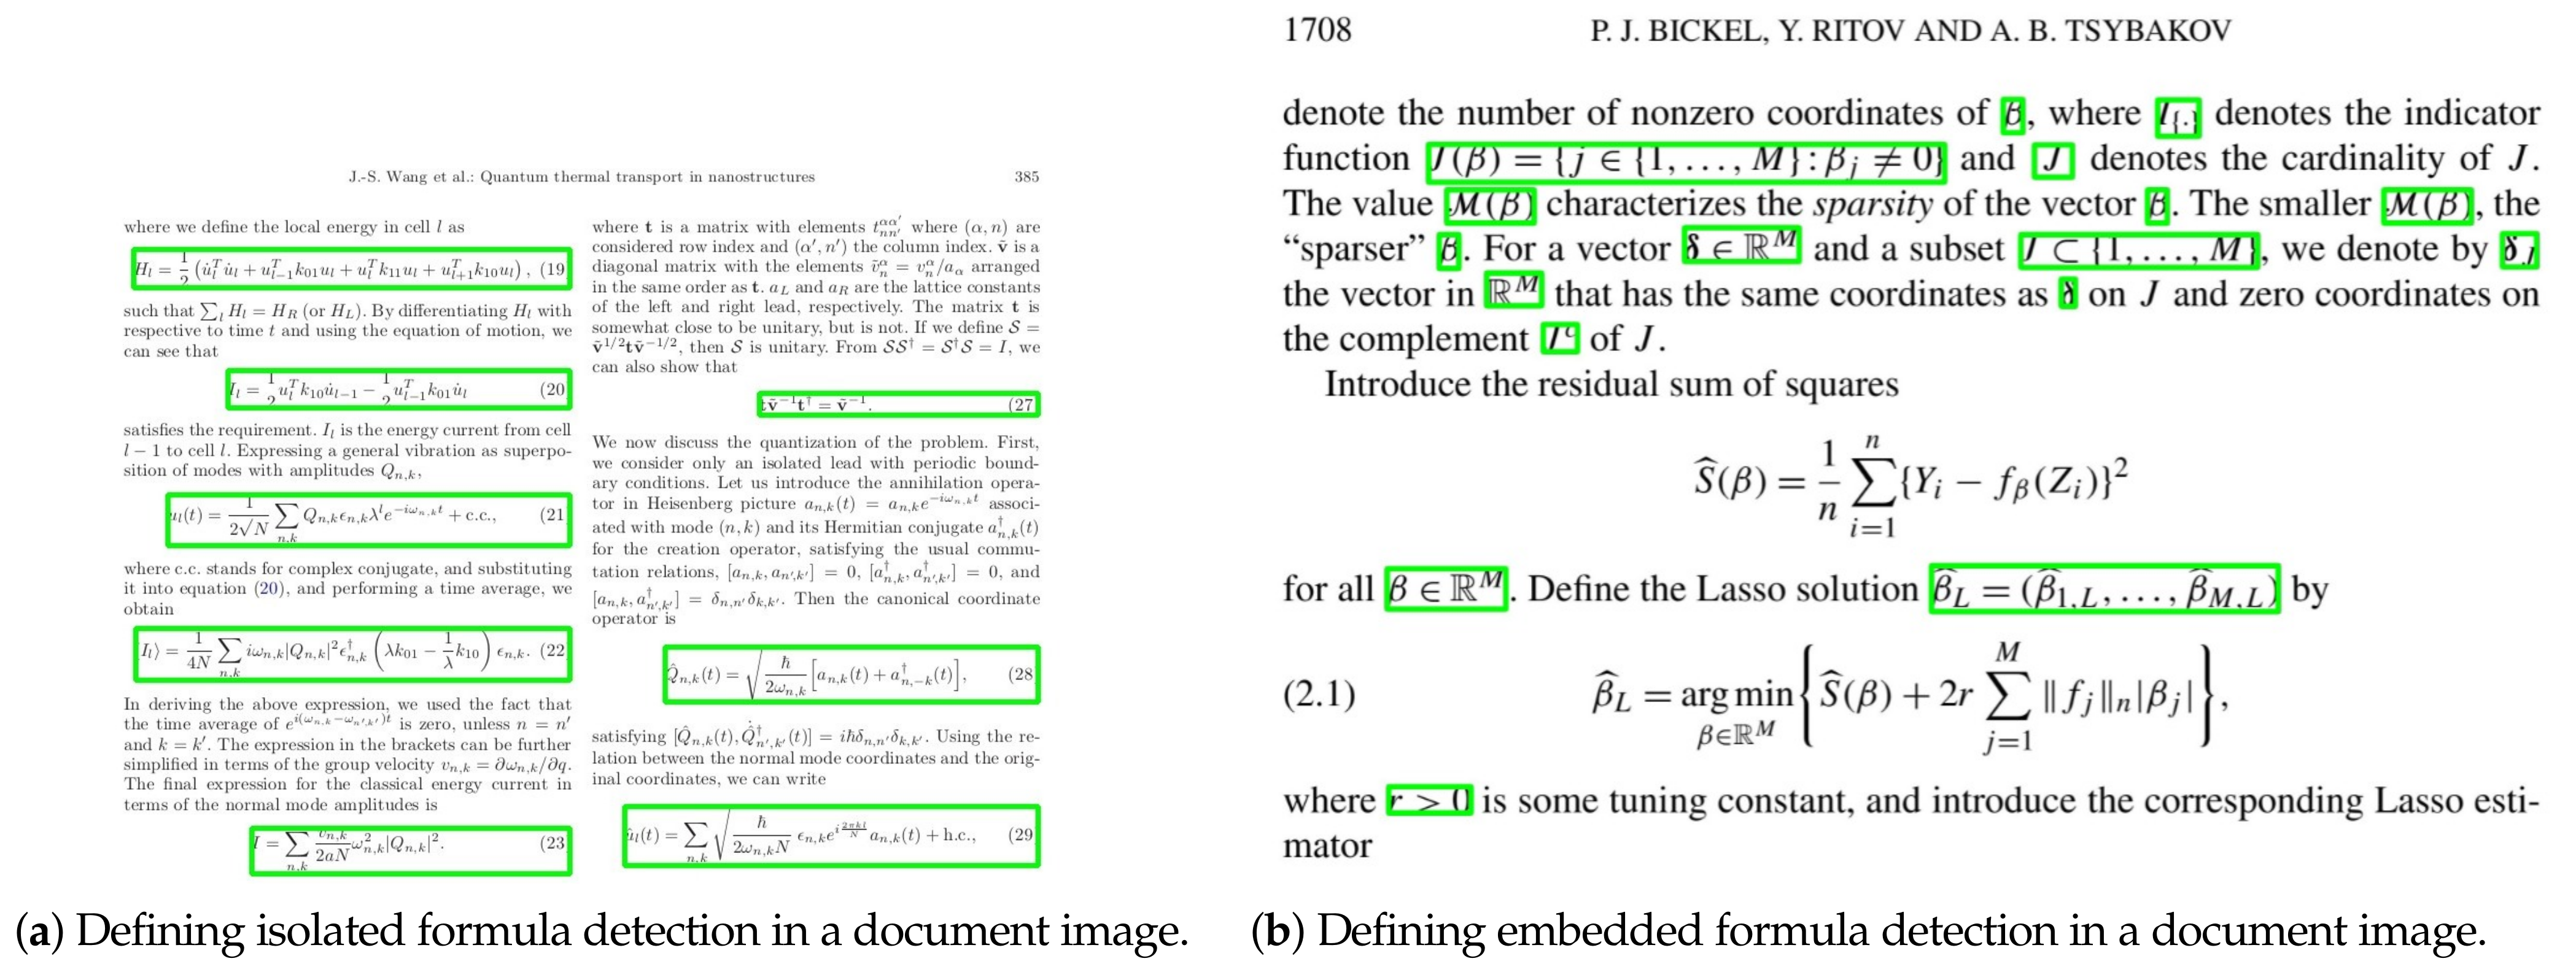
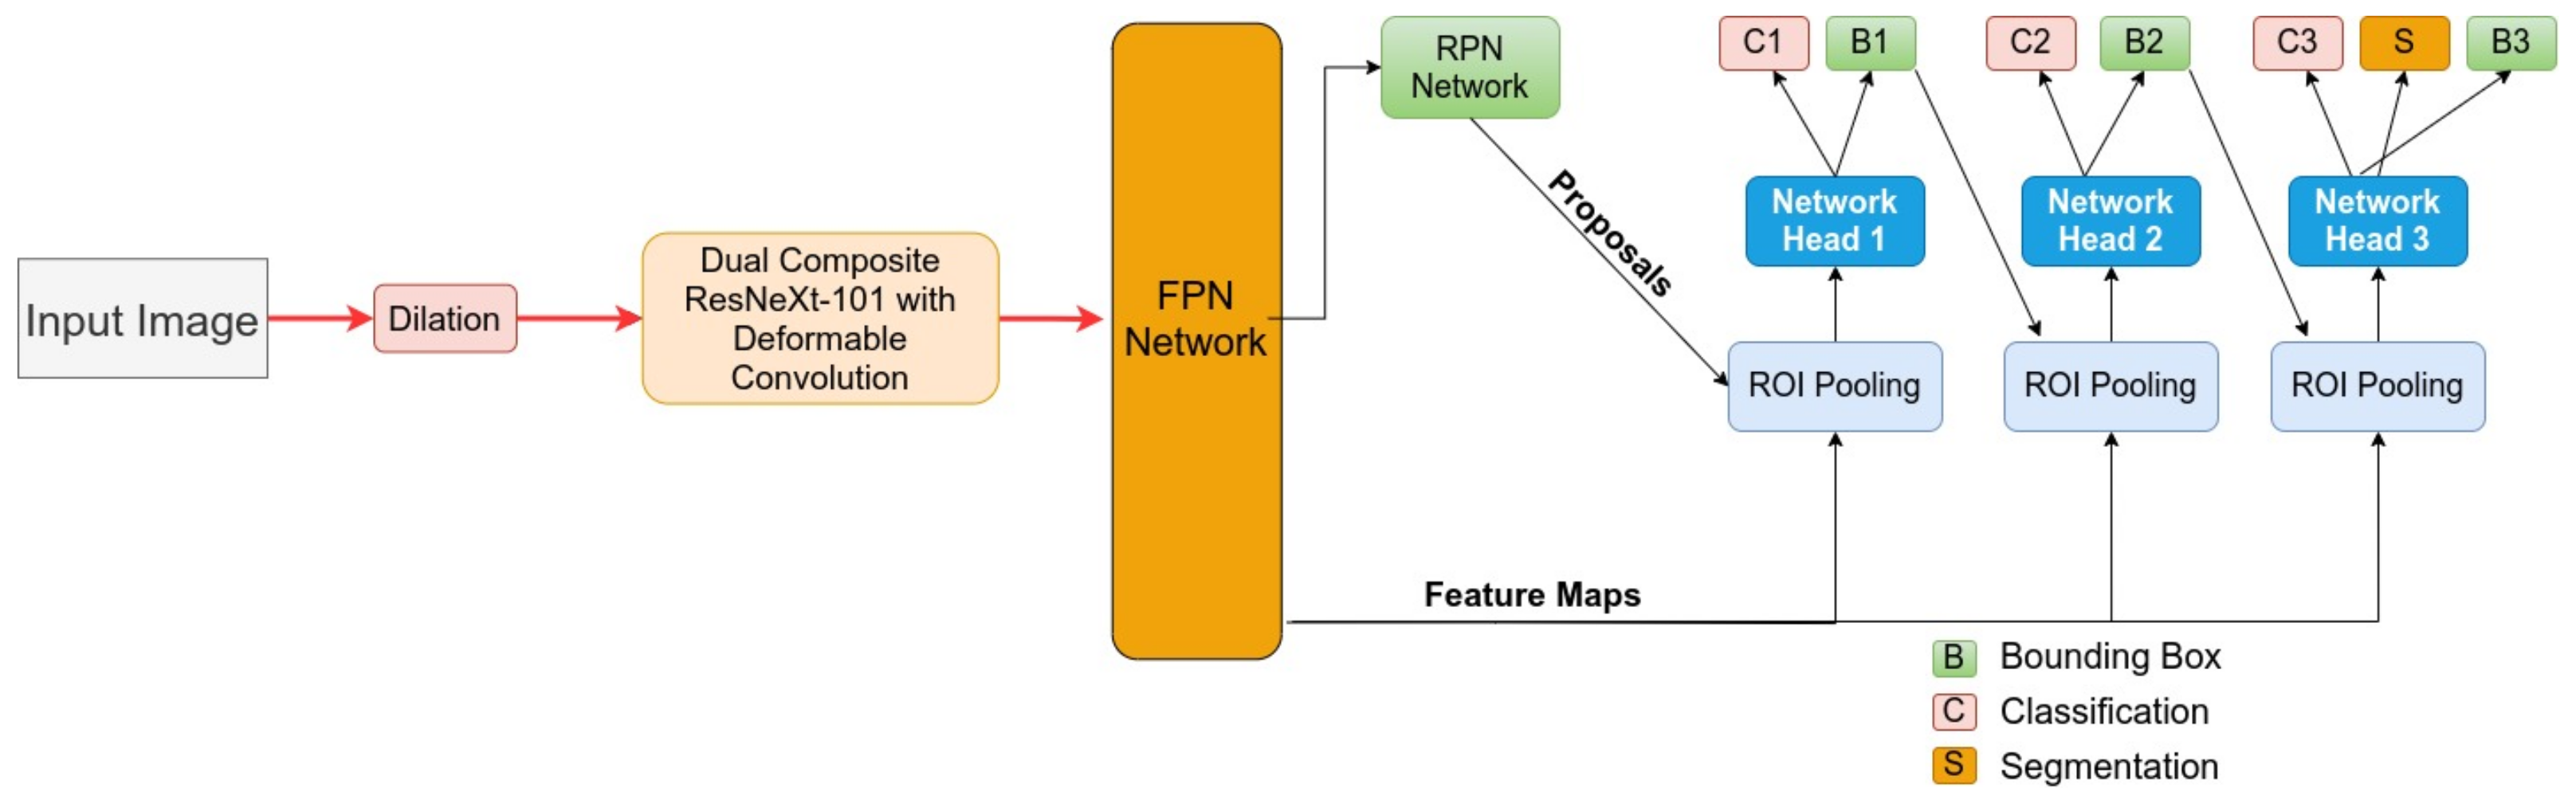
- We present an end-to-end trainable framework that operates on a Cascade Mask R-CNN equipped with a deformable composite backbone to detect both isolated and embedded formulas in document images.
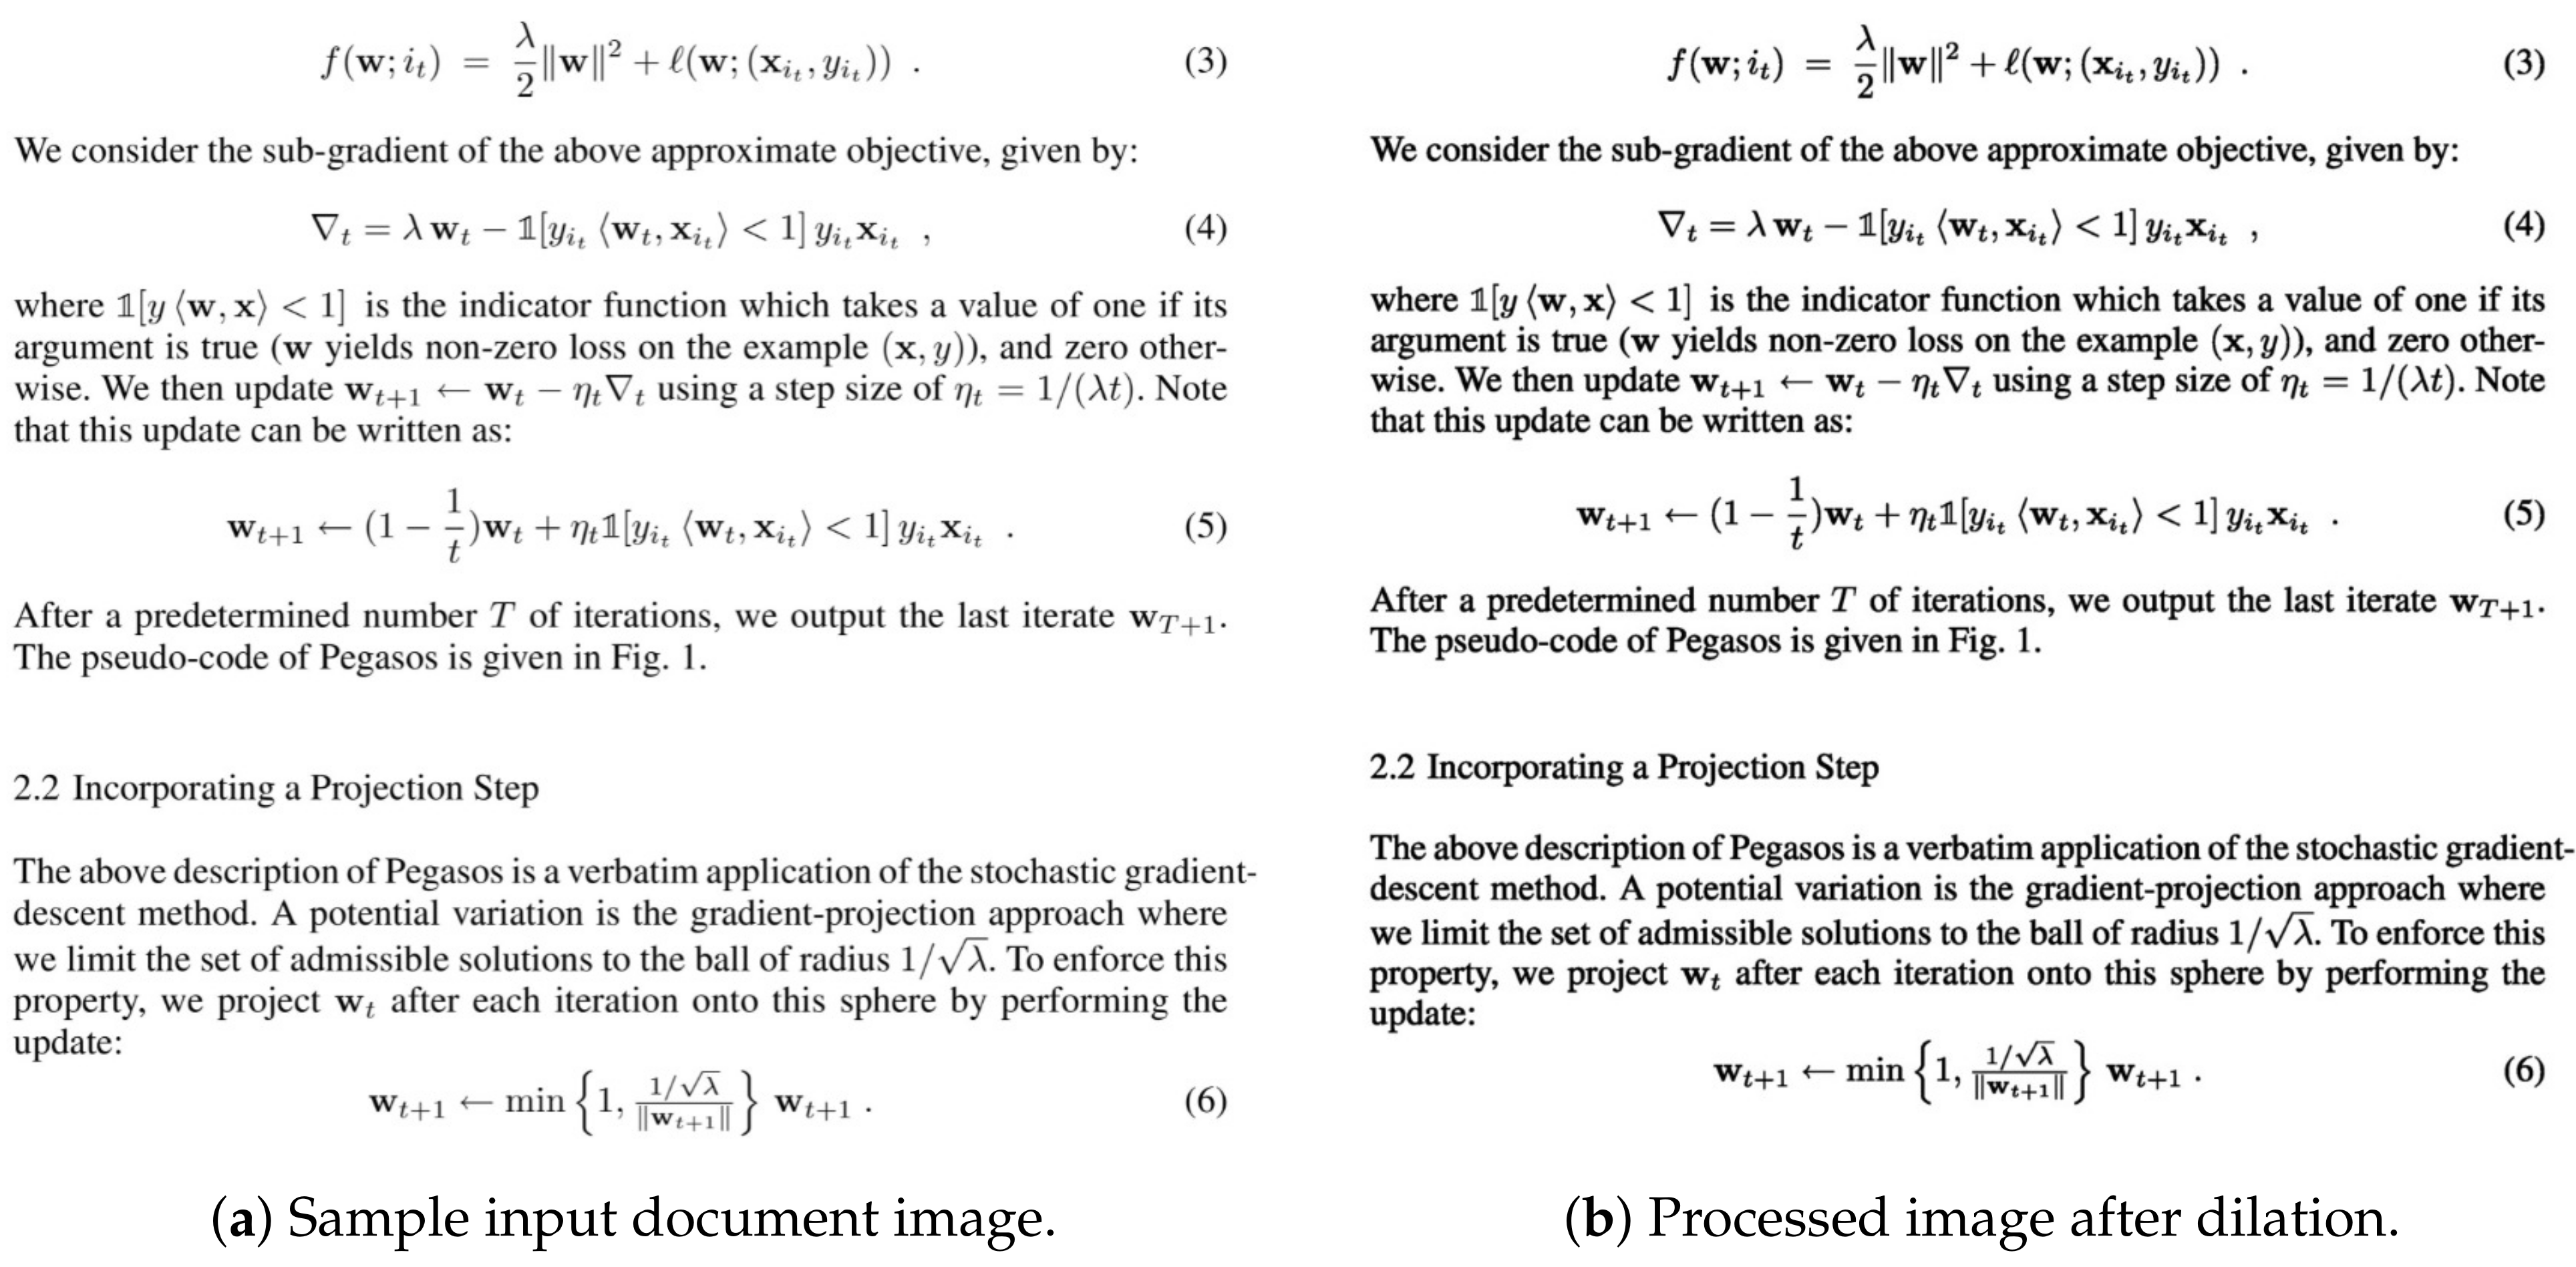
- Unlike prior work, our formula detection pipeline operates on a lightweight dilation method as a pre-processing step.
- We accomplish state-of-the-art results in detecting isolated formulas on a higher IoU threshold in the ICDAR-2017 POD dataset [27]. Furthermore, on the Marmot dataset [9], we surpass previous state-of-the-art results on embedded formulas with a huge margin and achieve identical results with prior state-of-the-art on isolated formulas.
2. Related Work
3. Method
3.1. Cascade Mask R-CNN
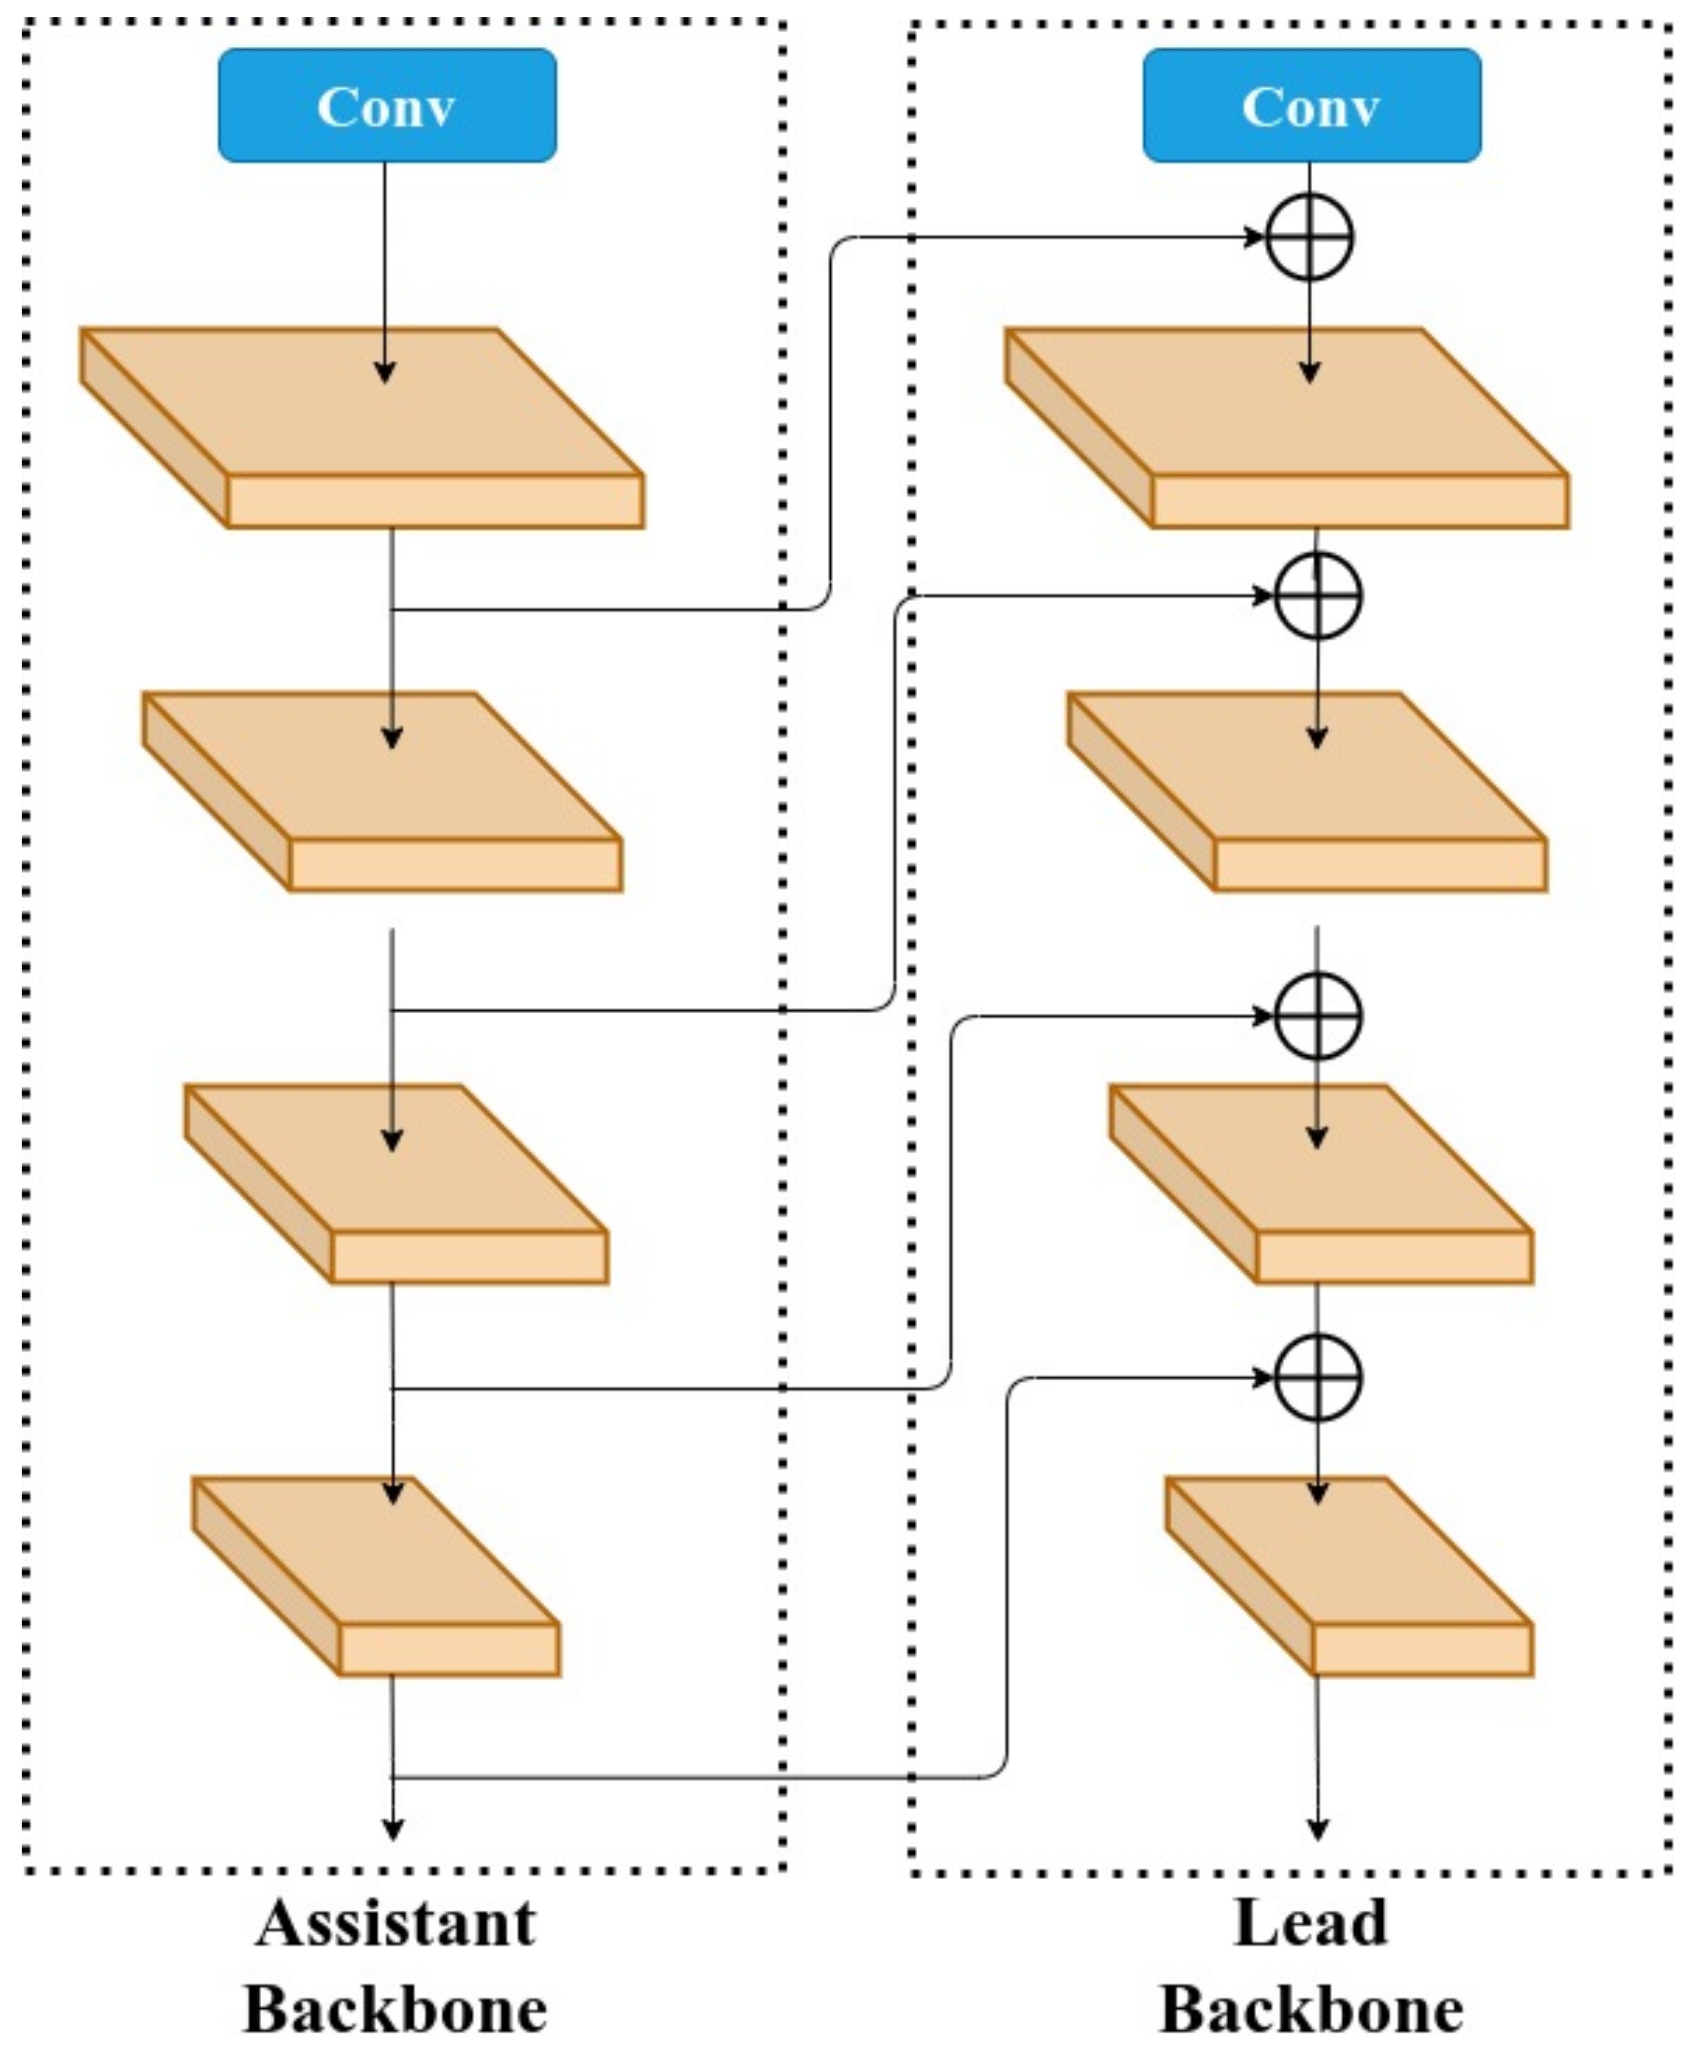
3.2. Composite Backbone
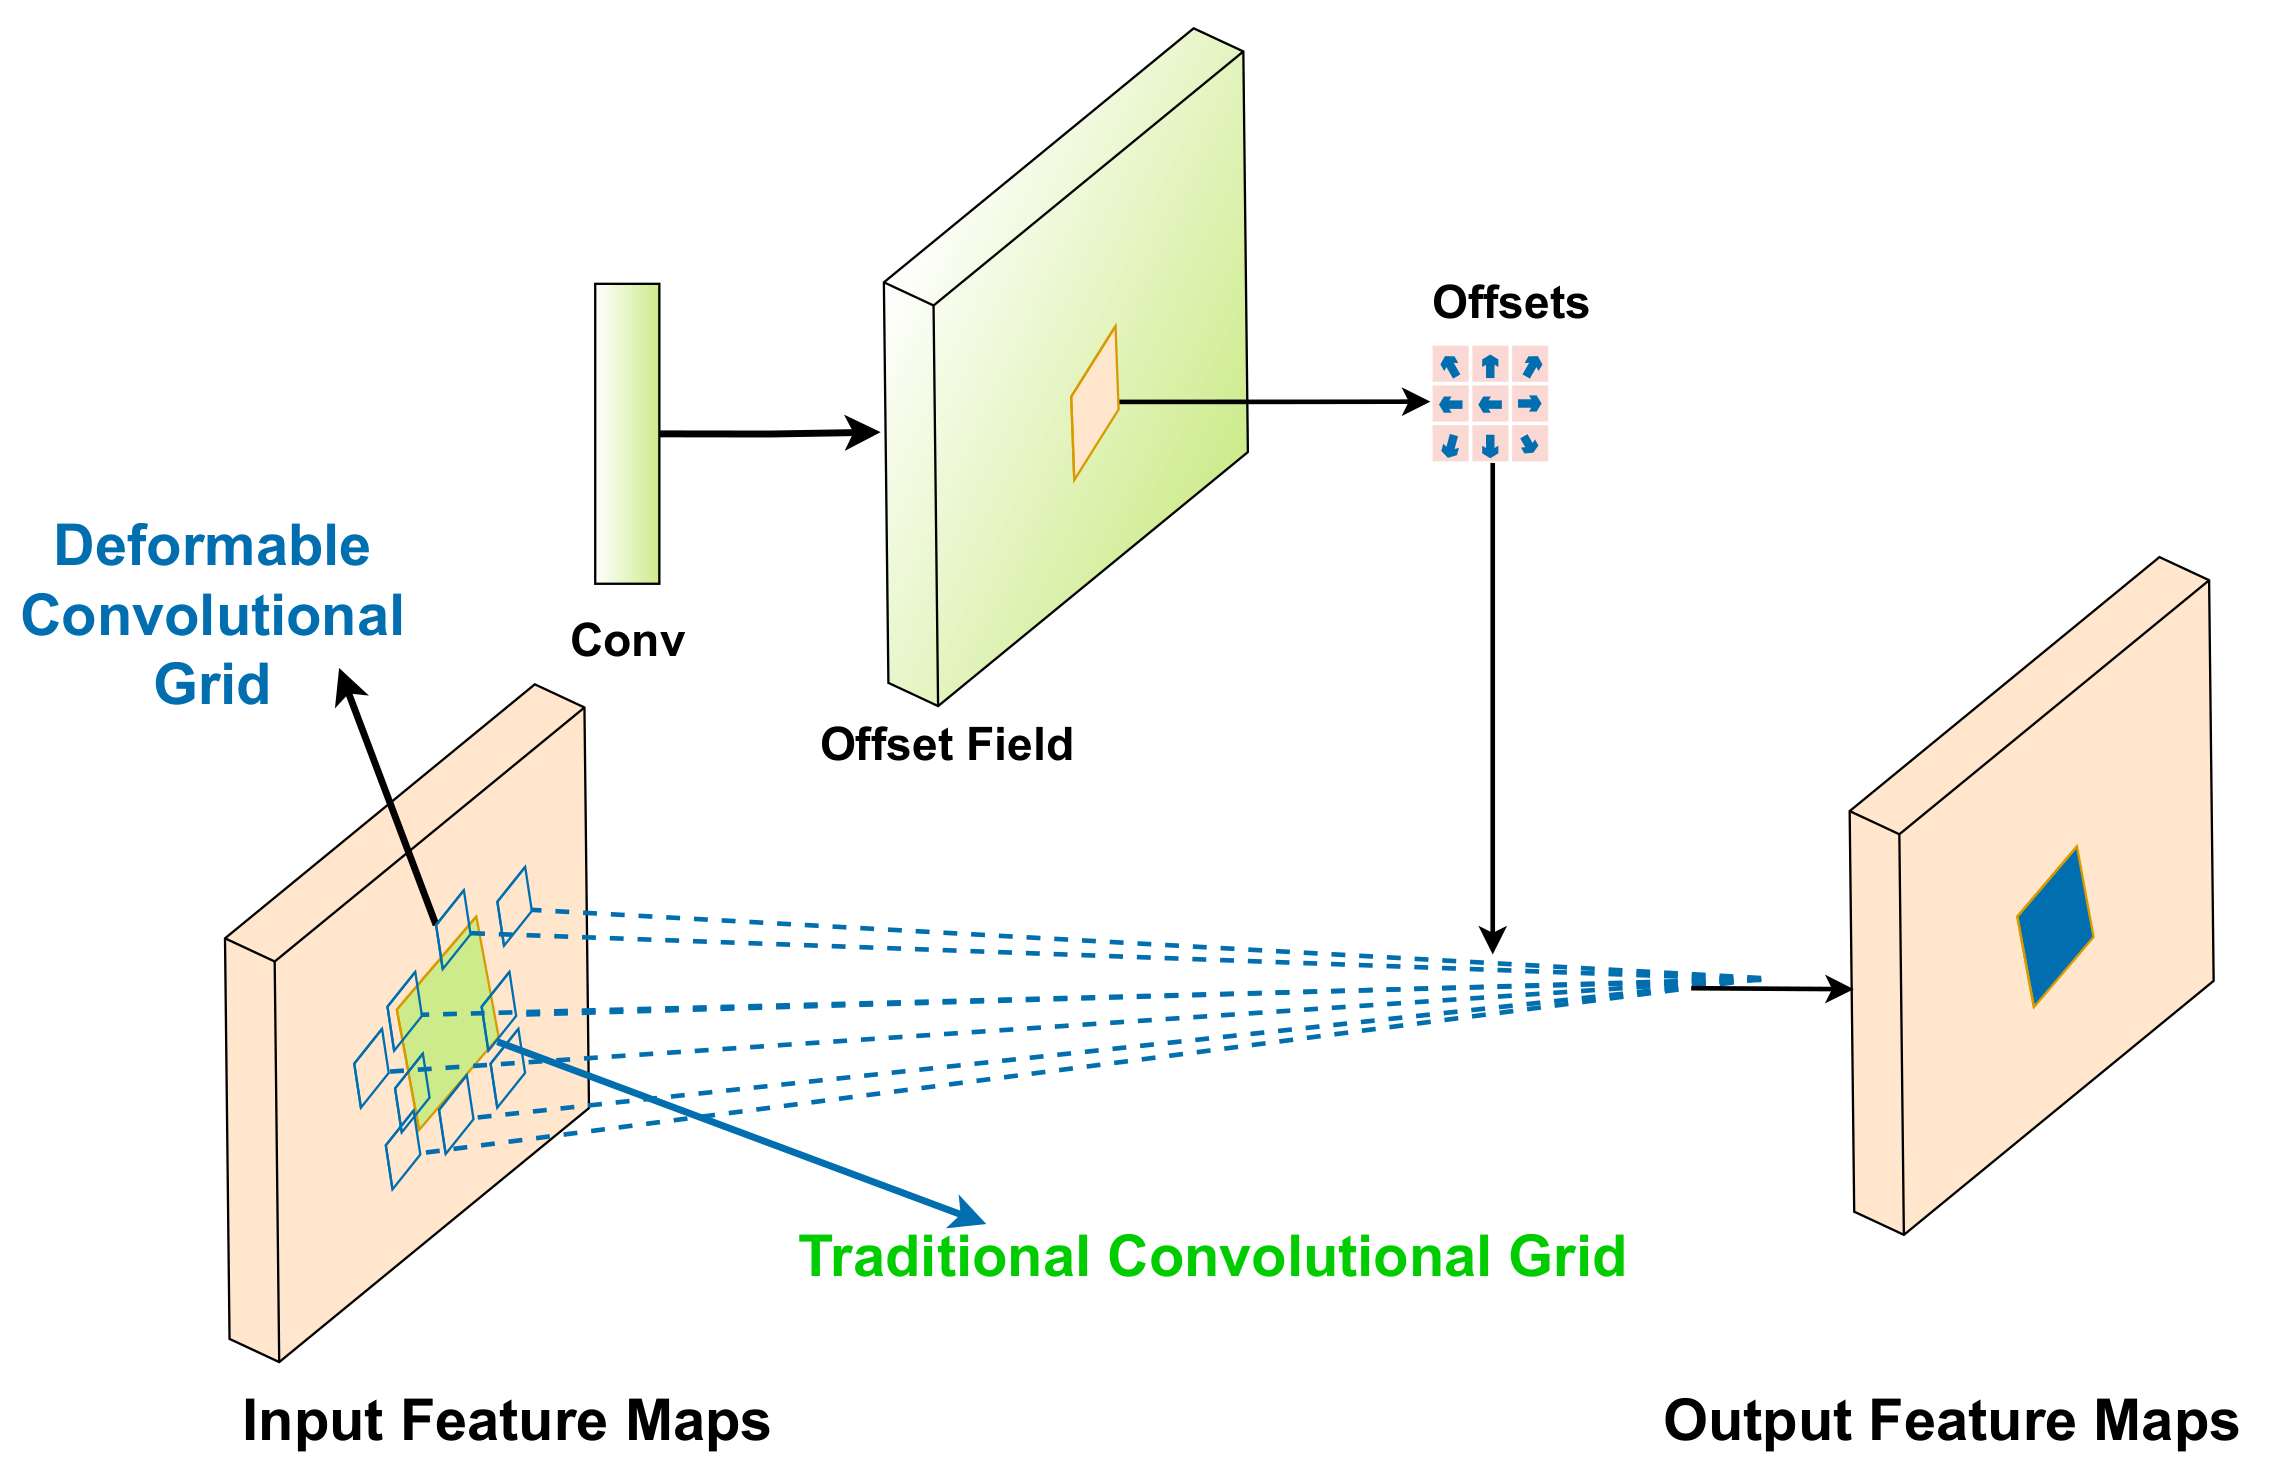
3.3. Deformable Convolution
3.4. Image Transformation and Prepossessing
Dilation Transformation
3.5. Datasets
3.5.1. ICDAR-17
3.5.2. Marmot
4. Experimental Results
4.1. Model Configuration
4.2. Evaluation Metrics
4.2.1. Precision
4.2.2. Recall
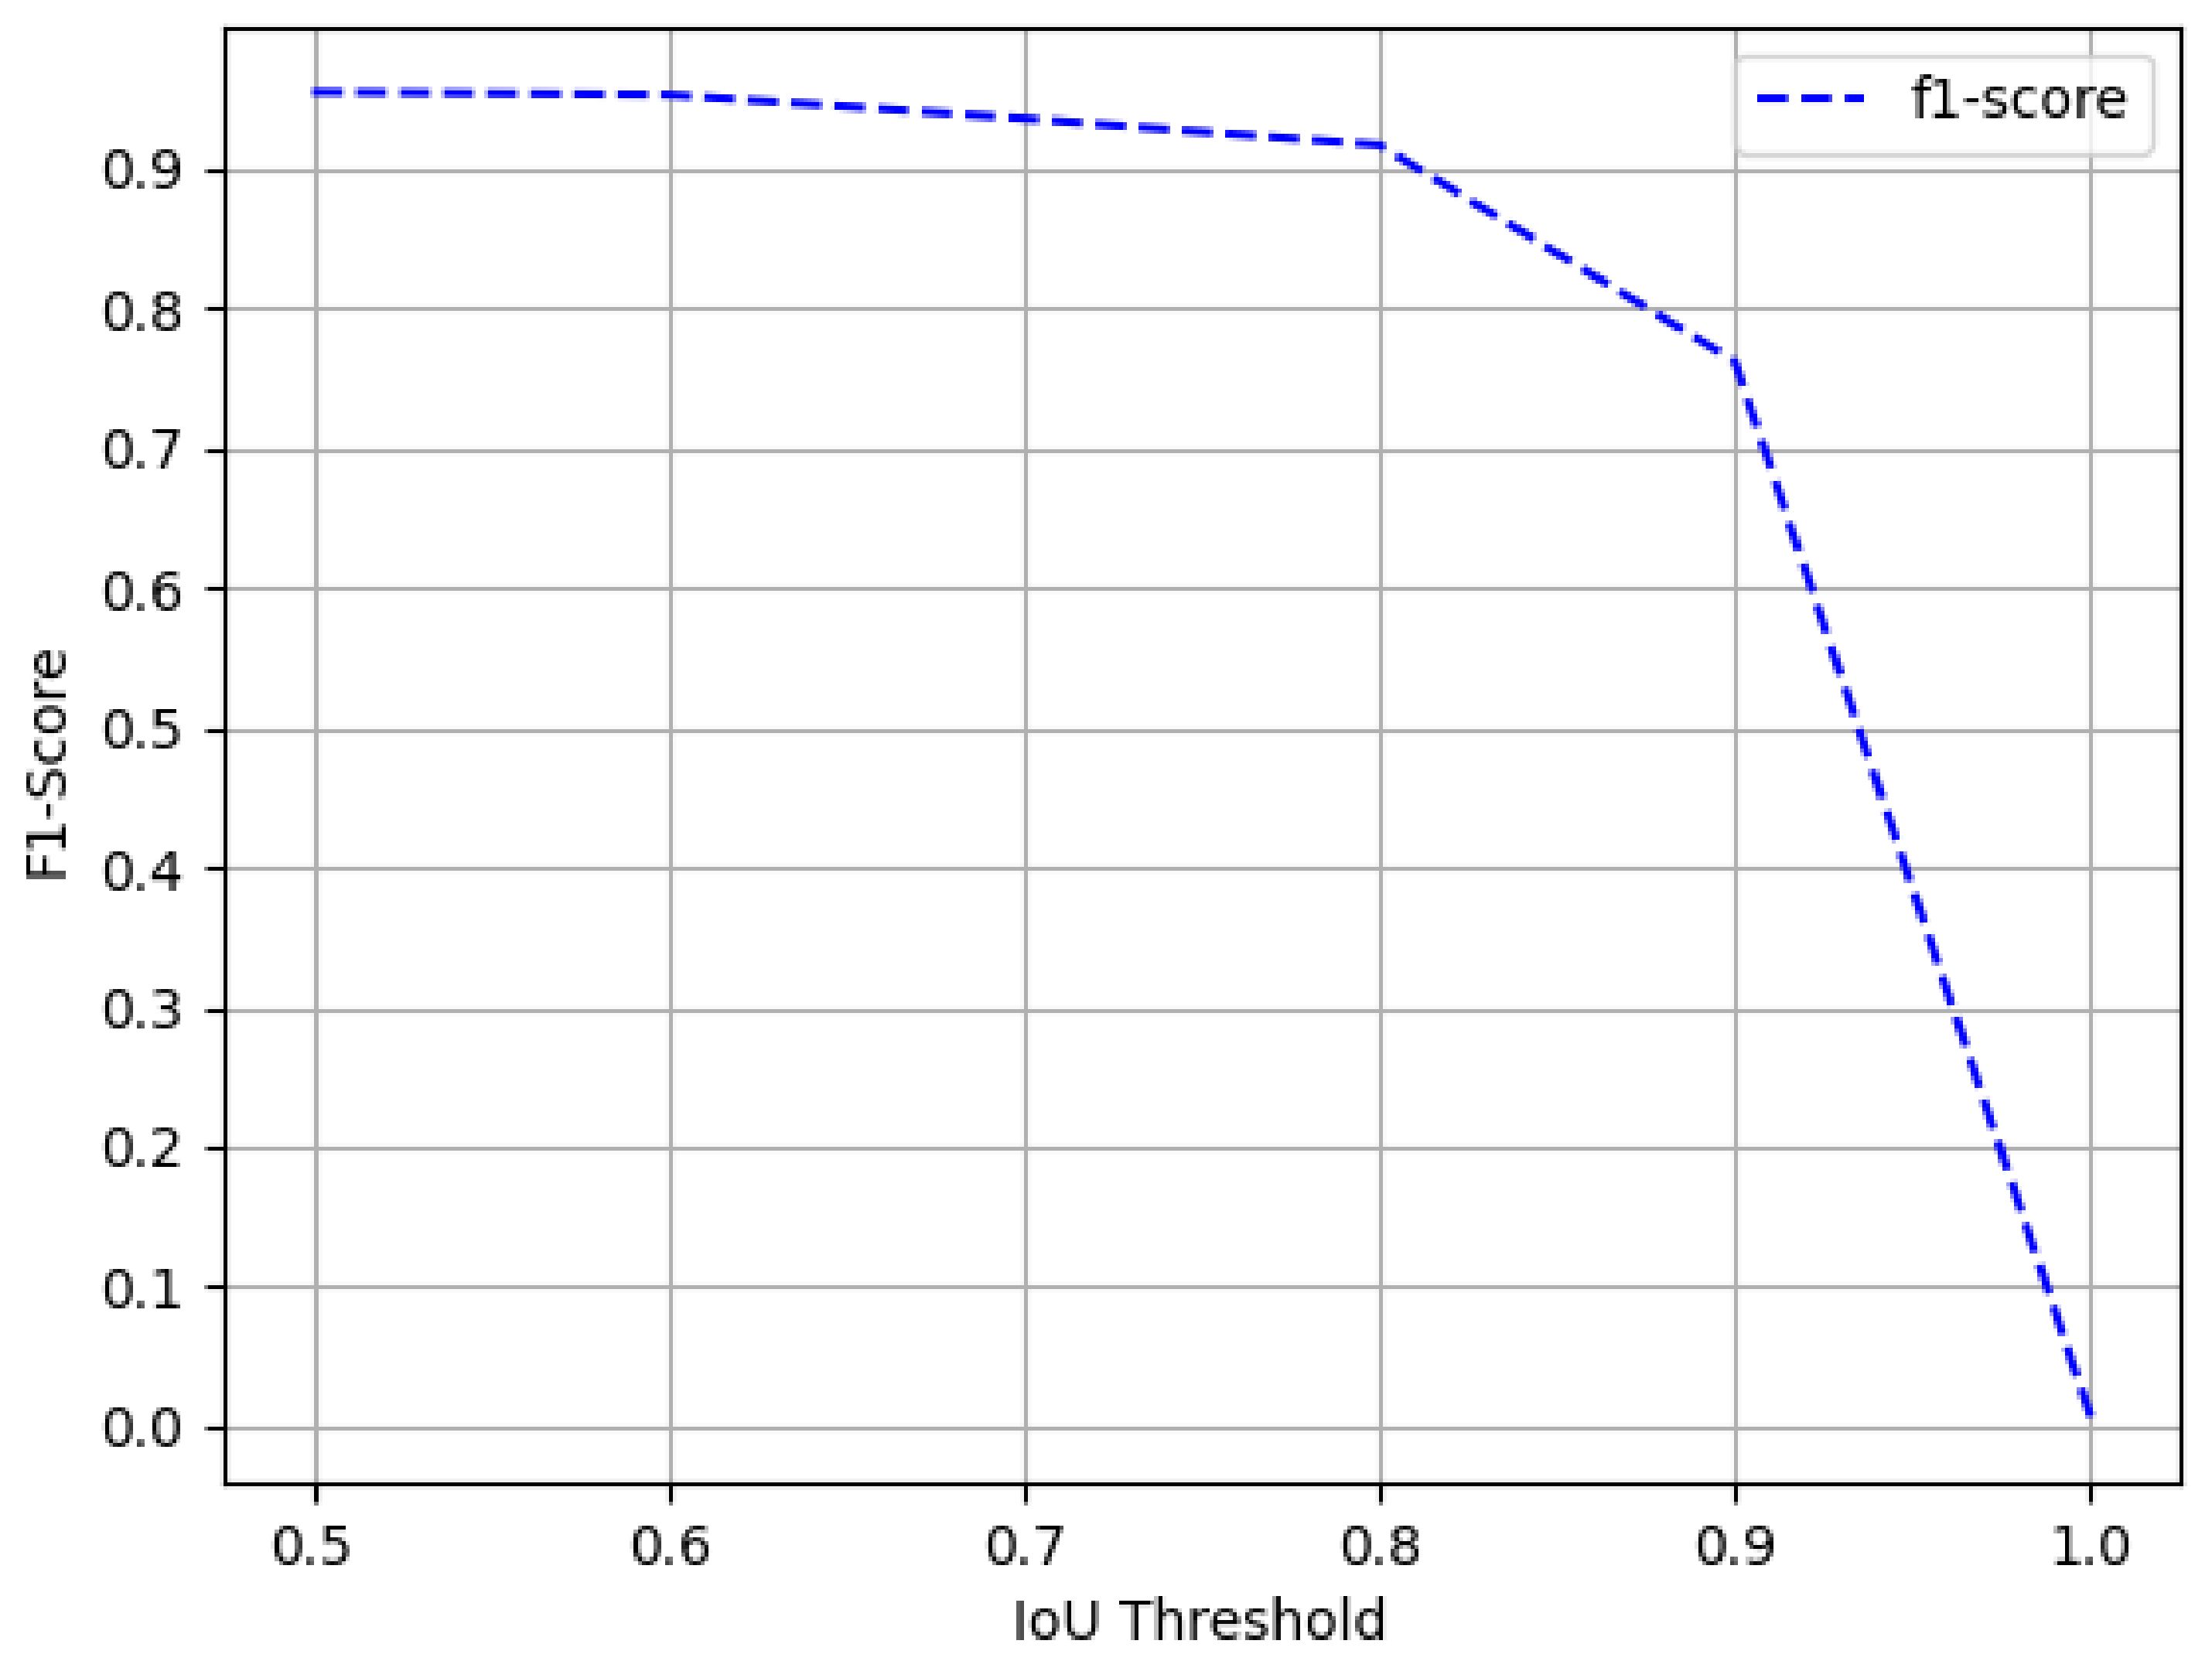
4.2.3. F1-Score
4.2.4. Mean Average Precision (mAP)
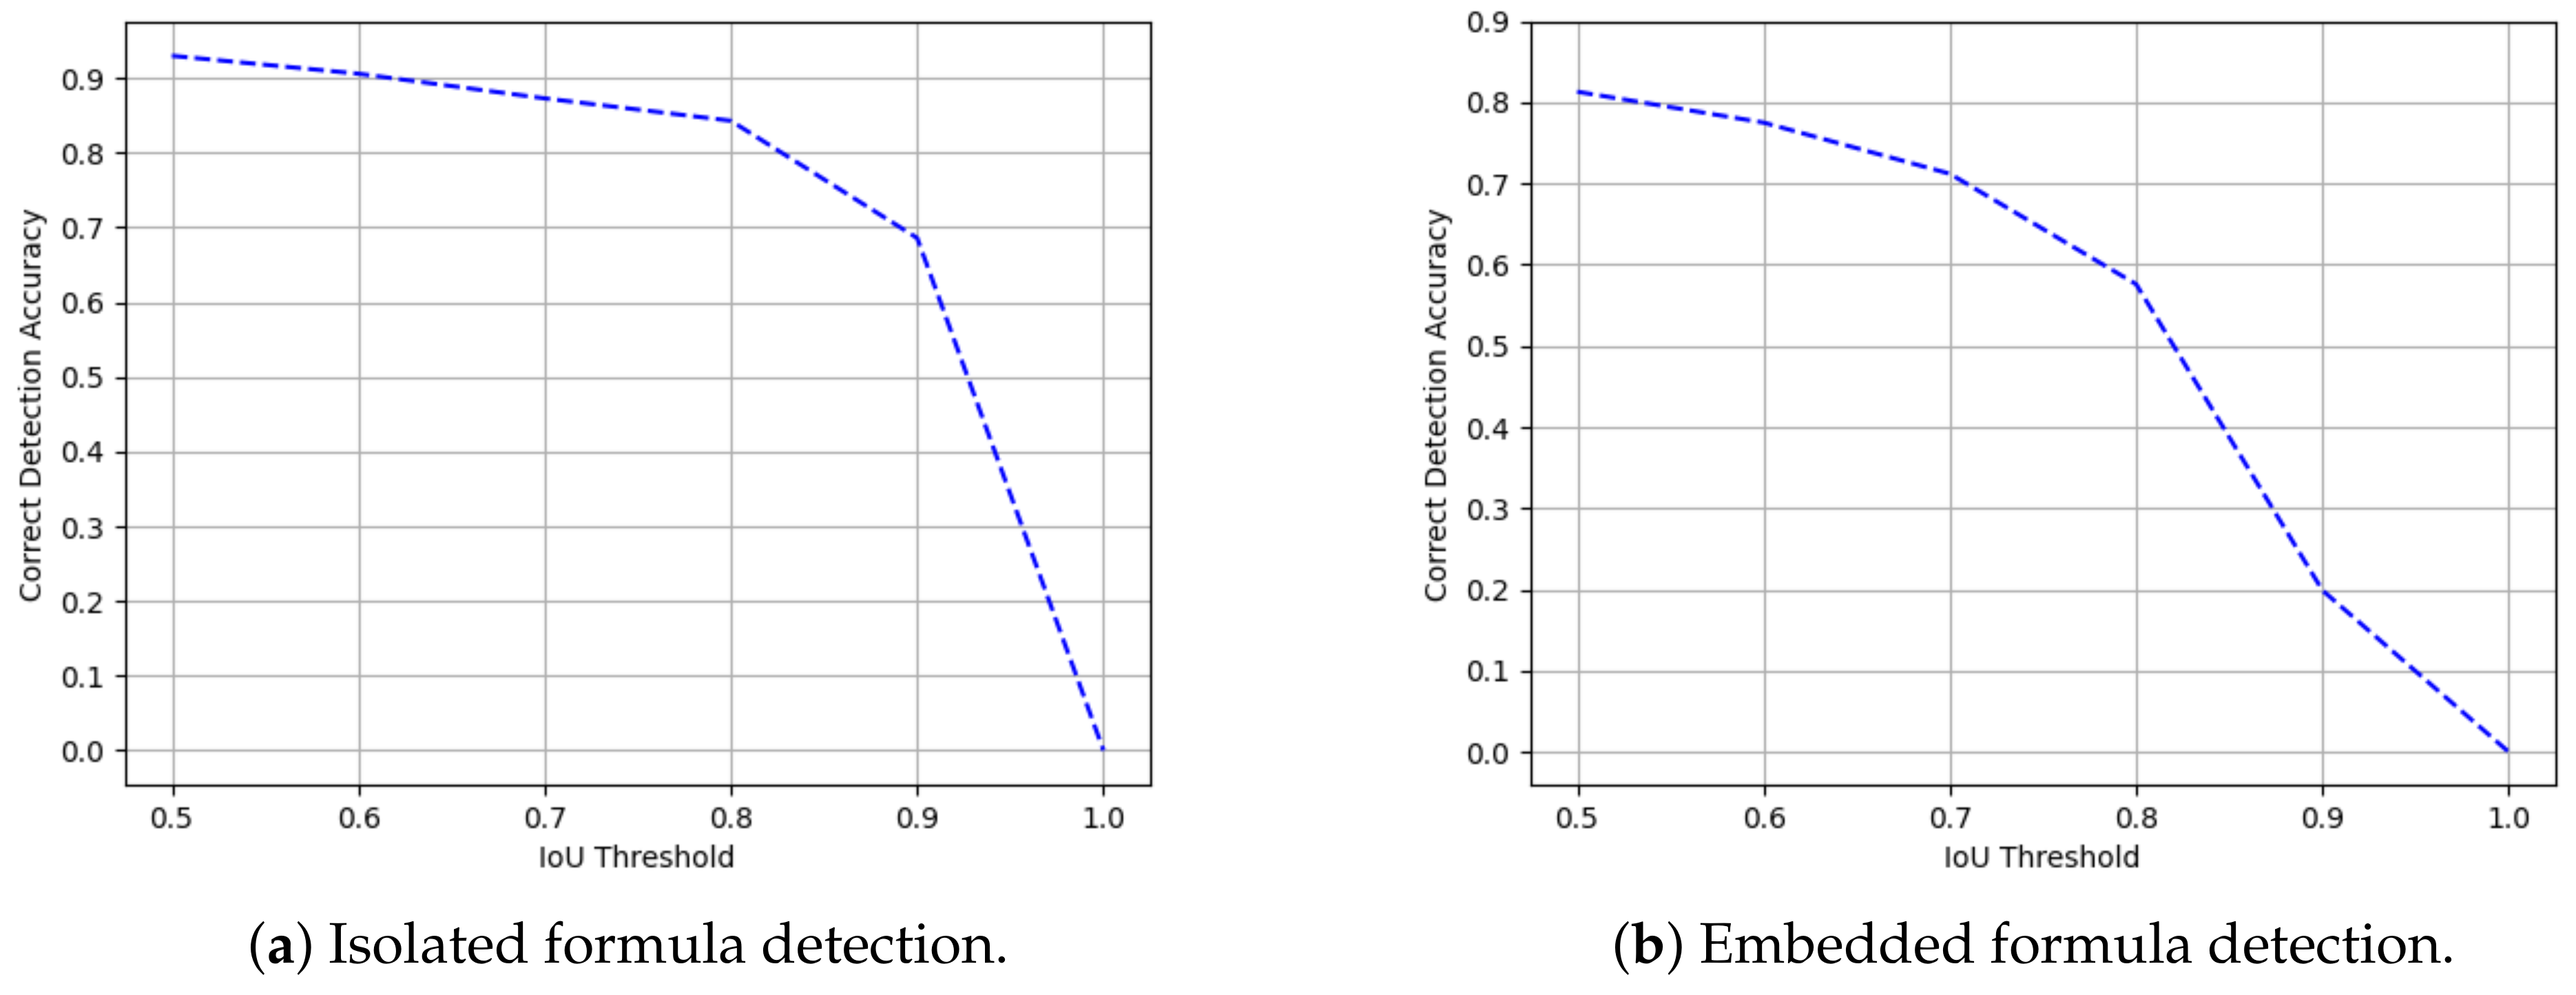
4.2.5. Intersection over Union (IOU)
4.2.6. Detection Accuracy
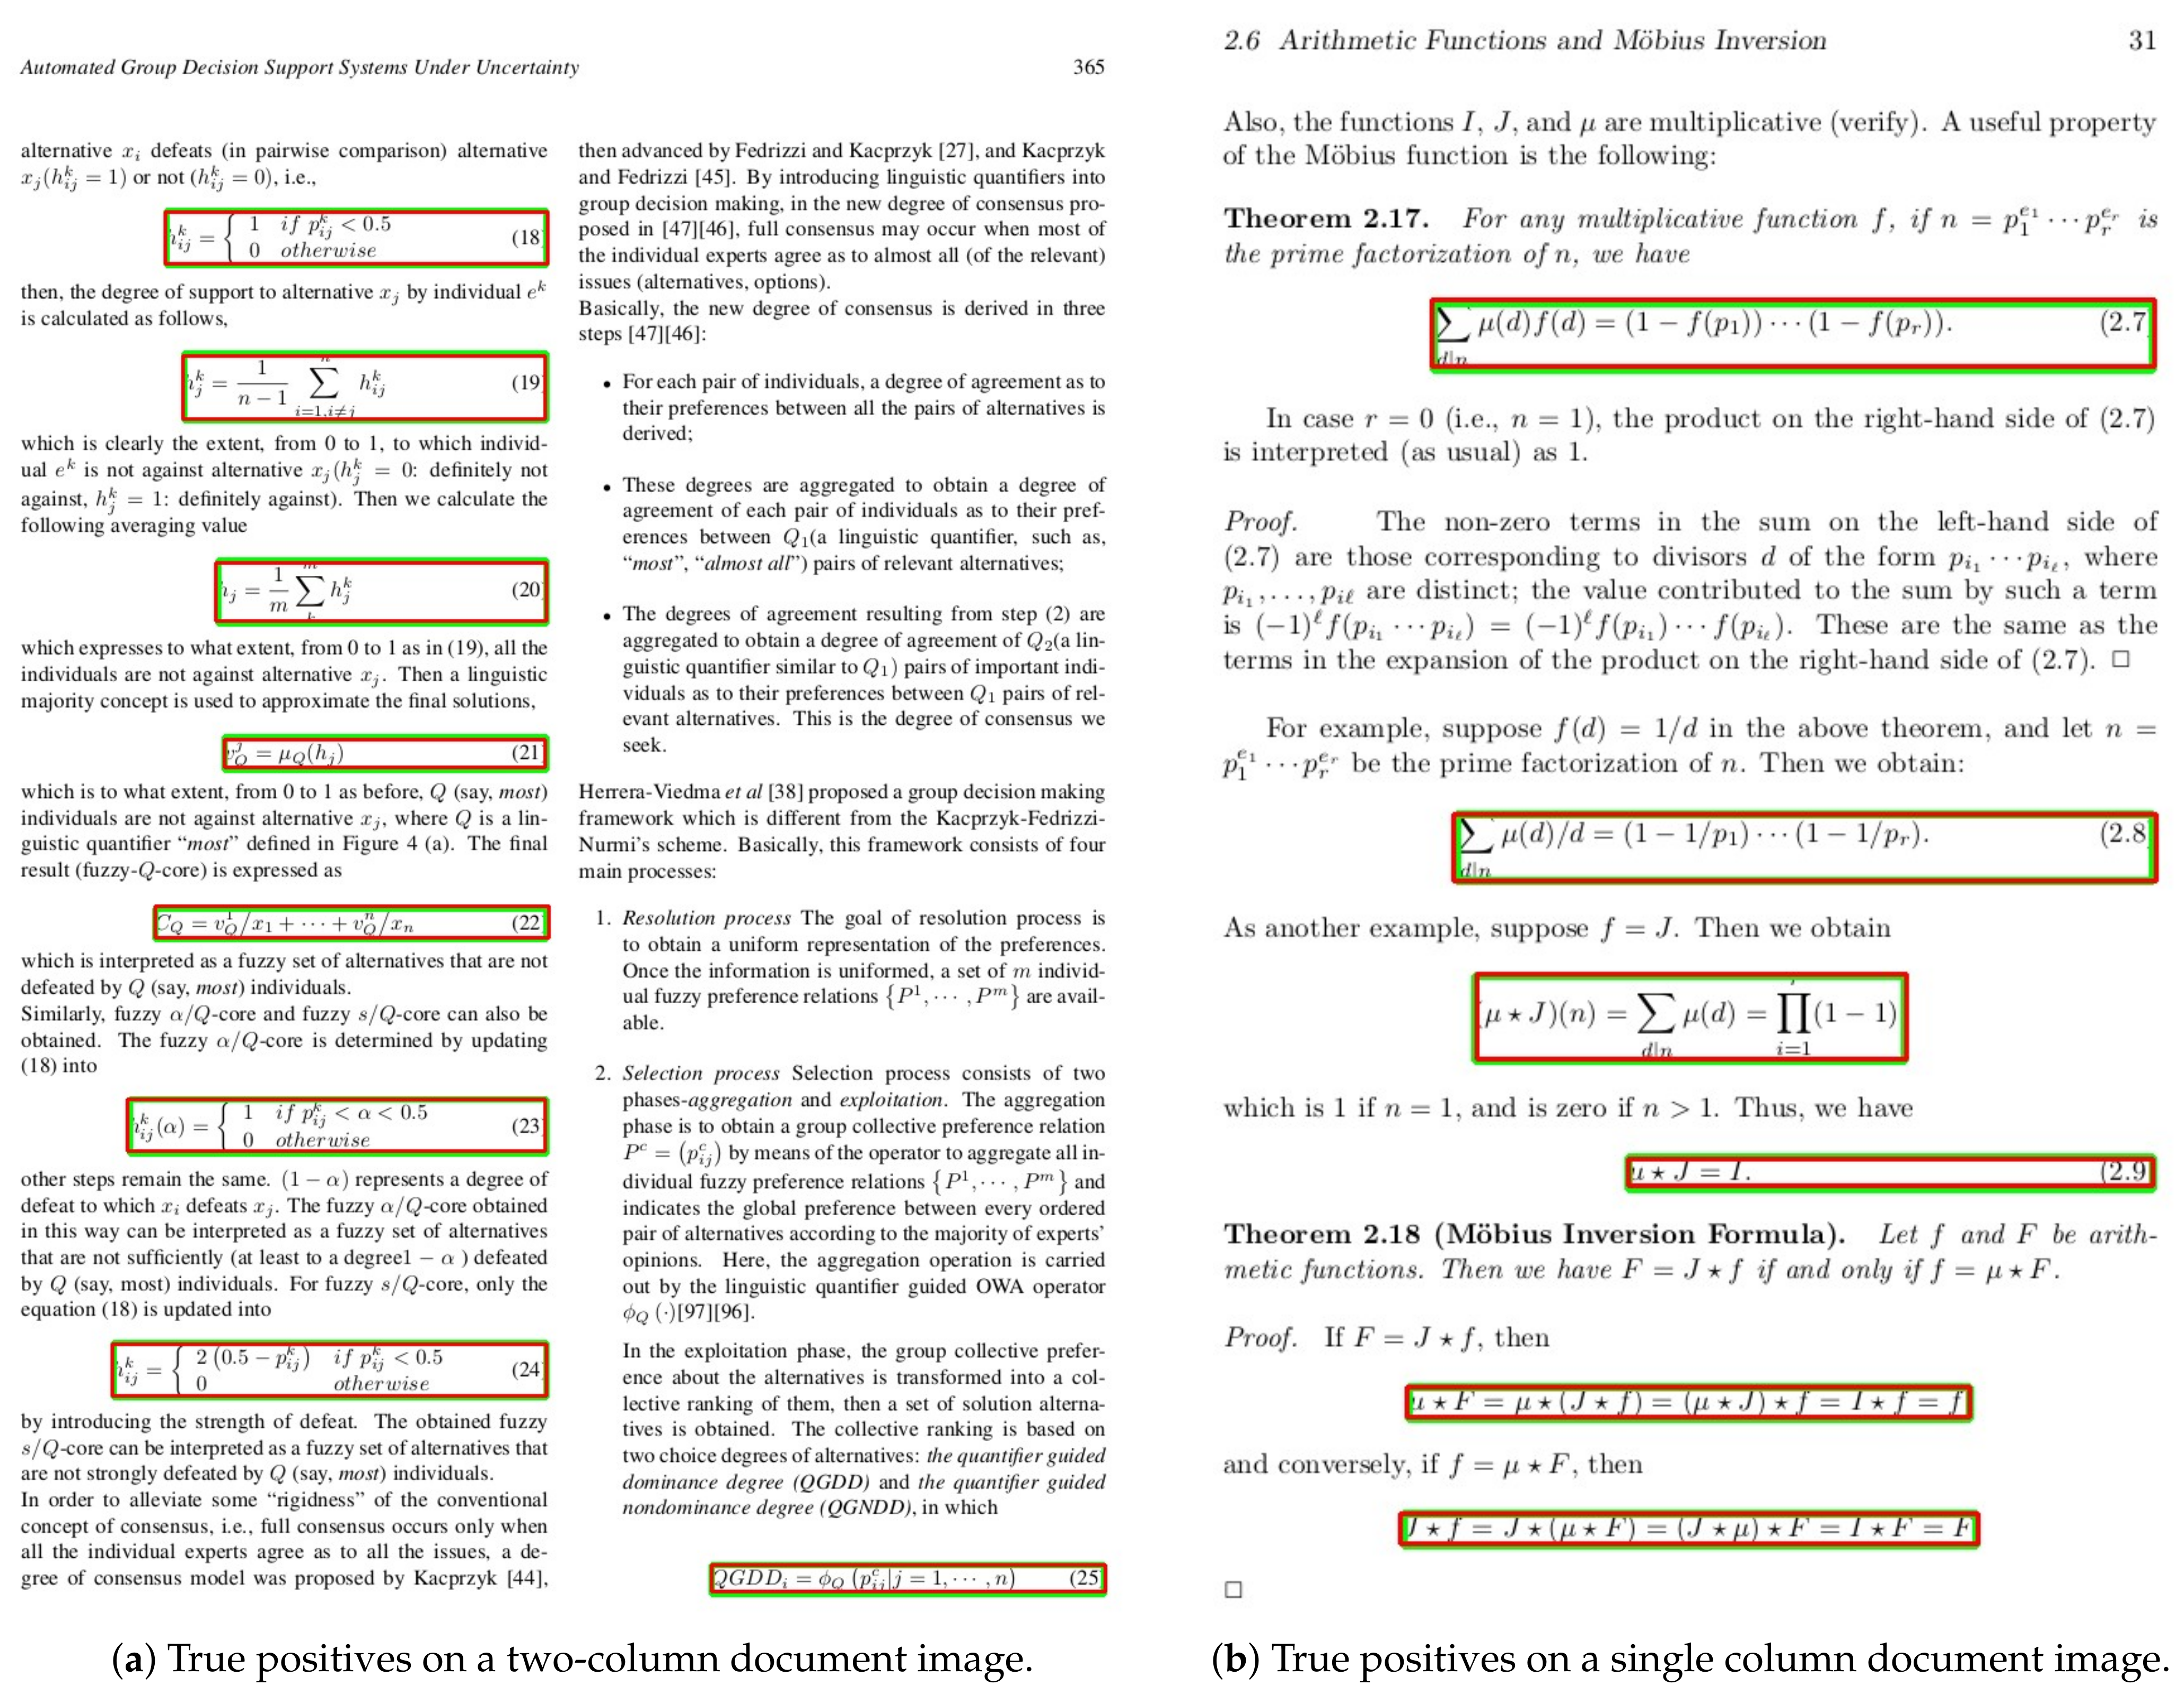
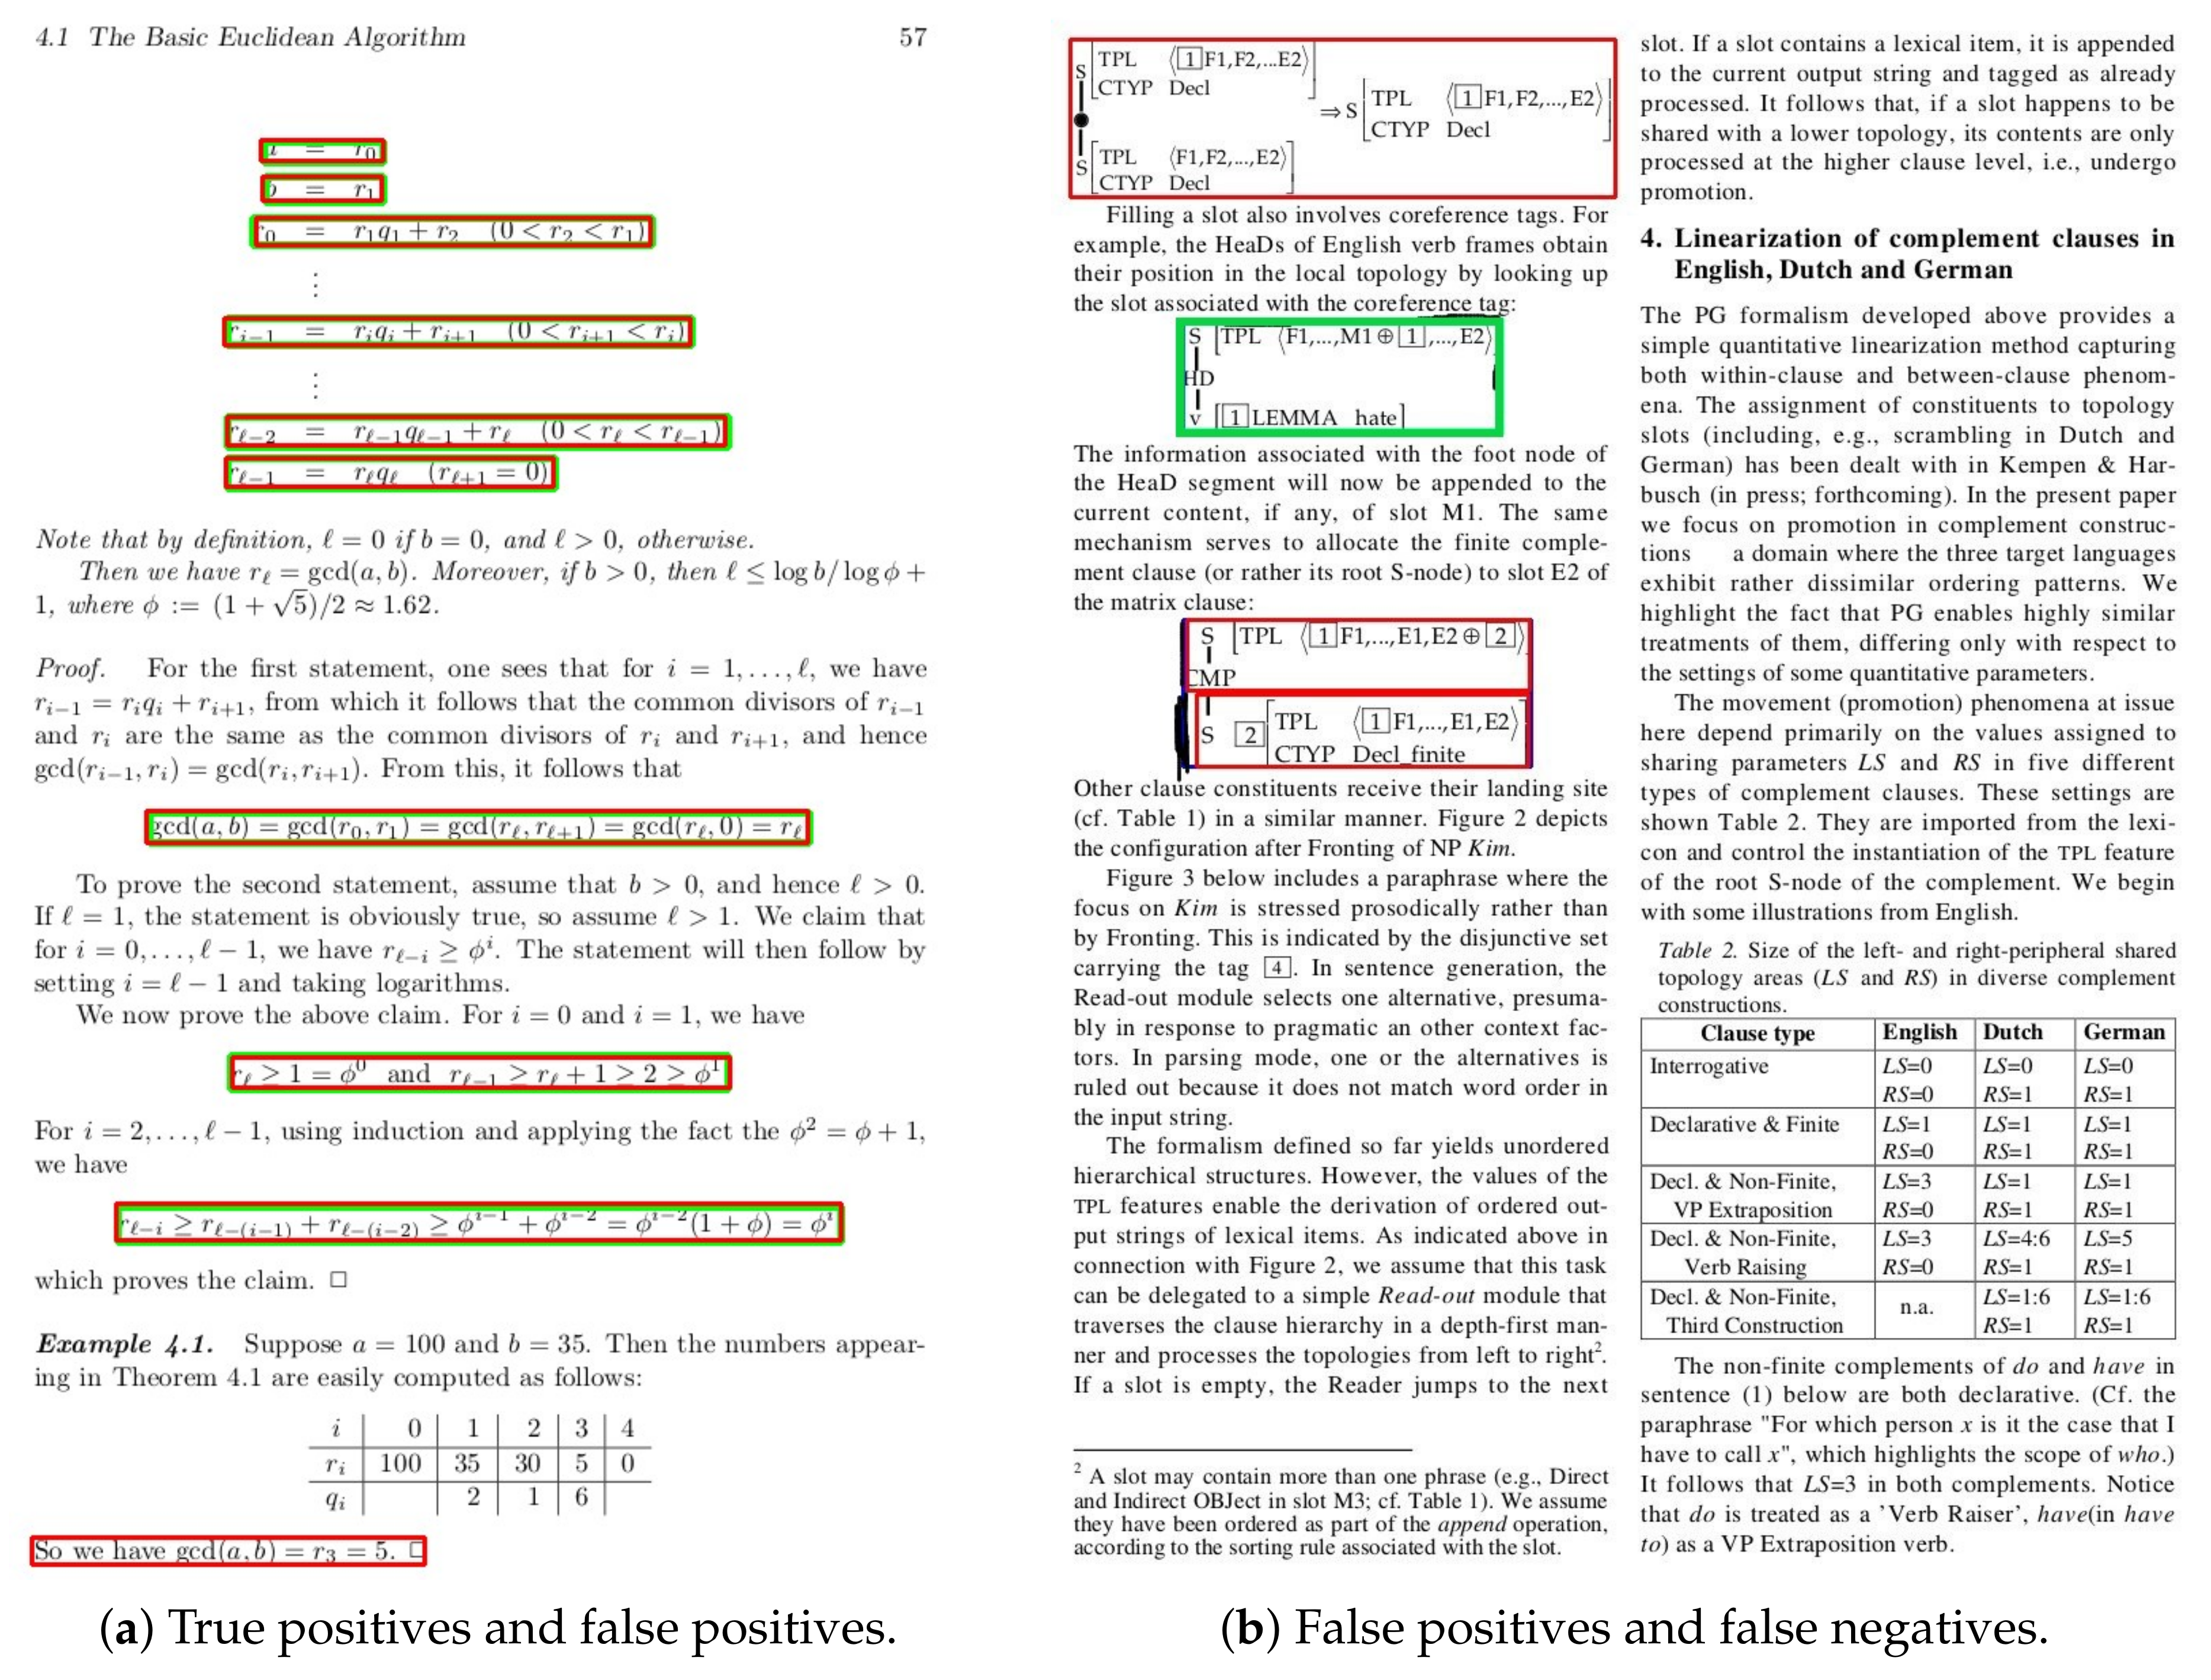
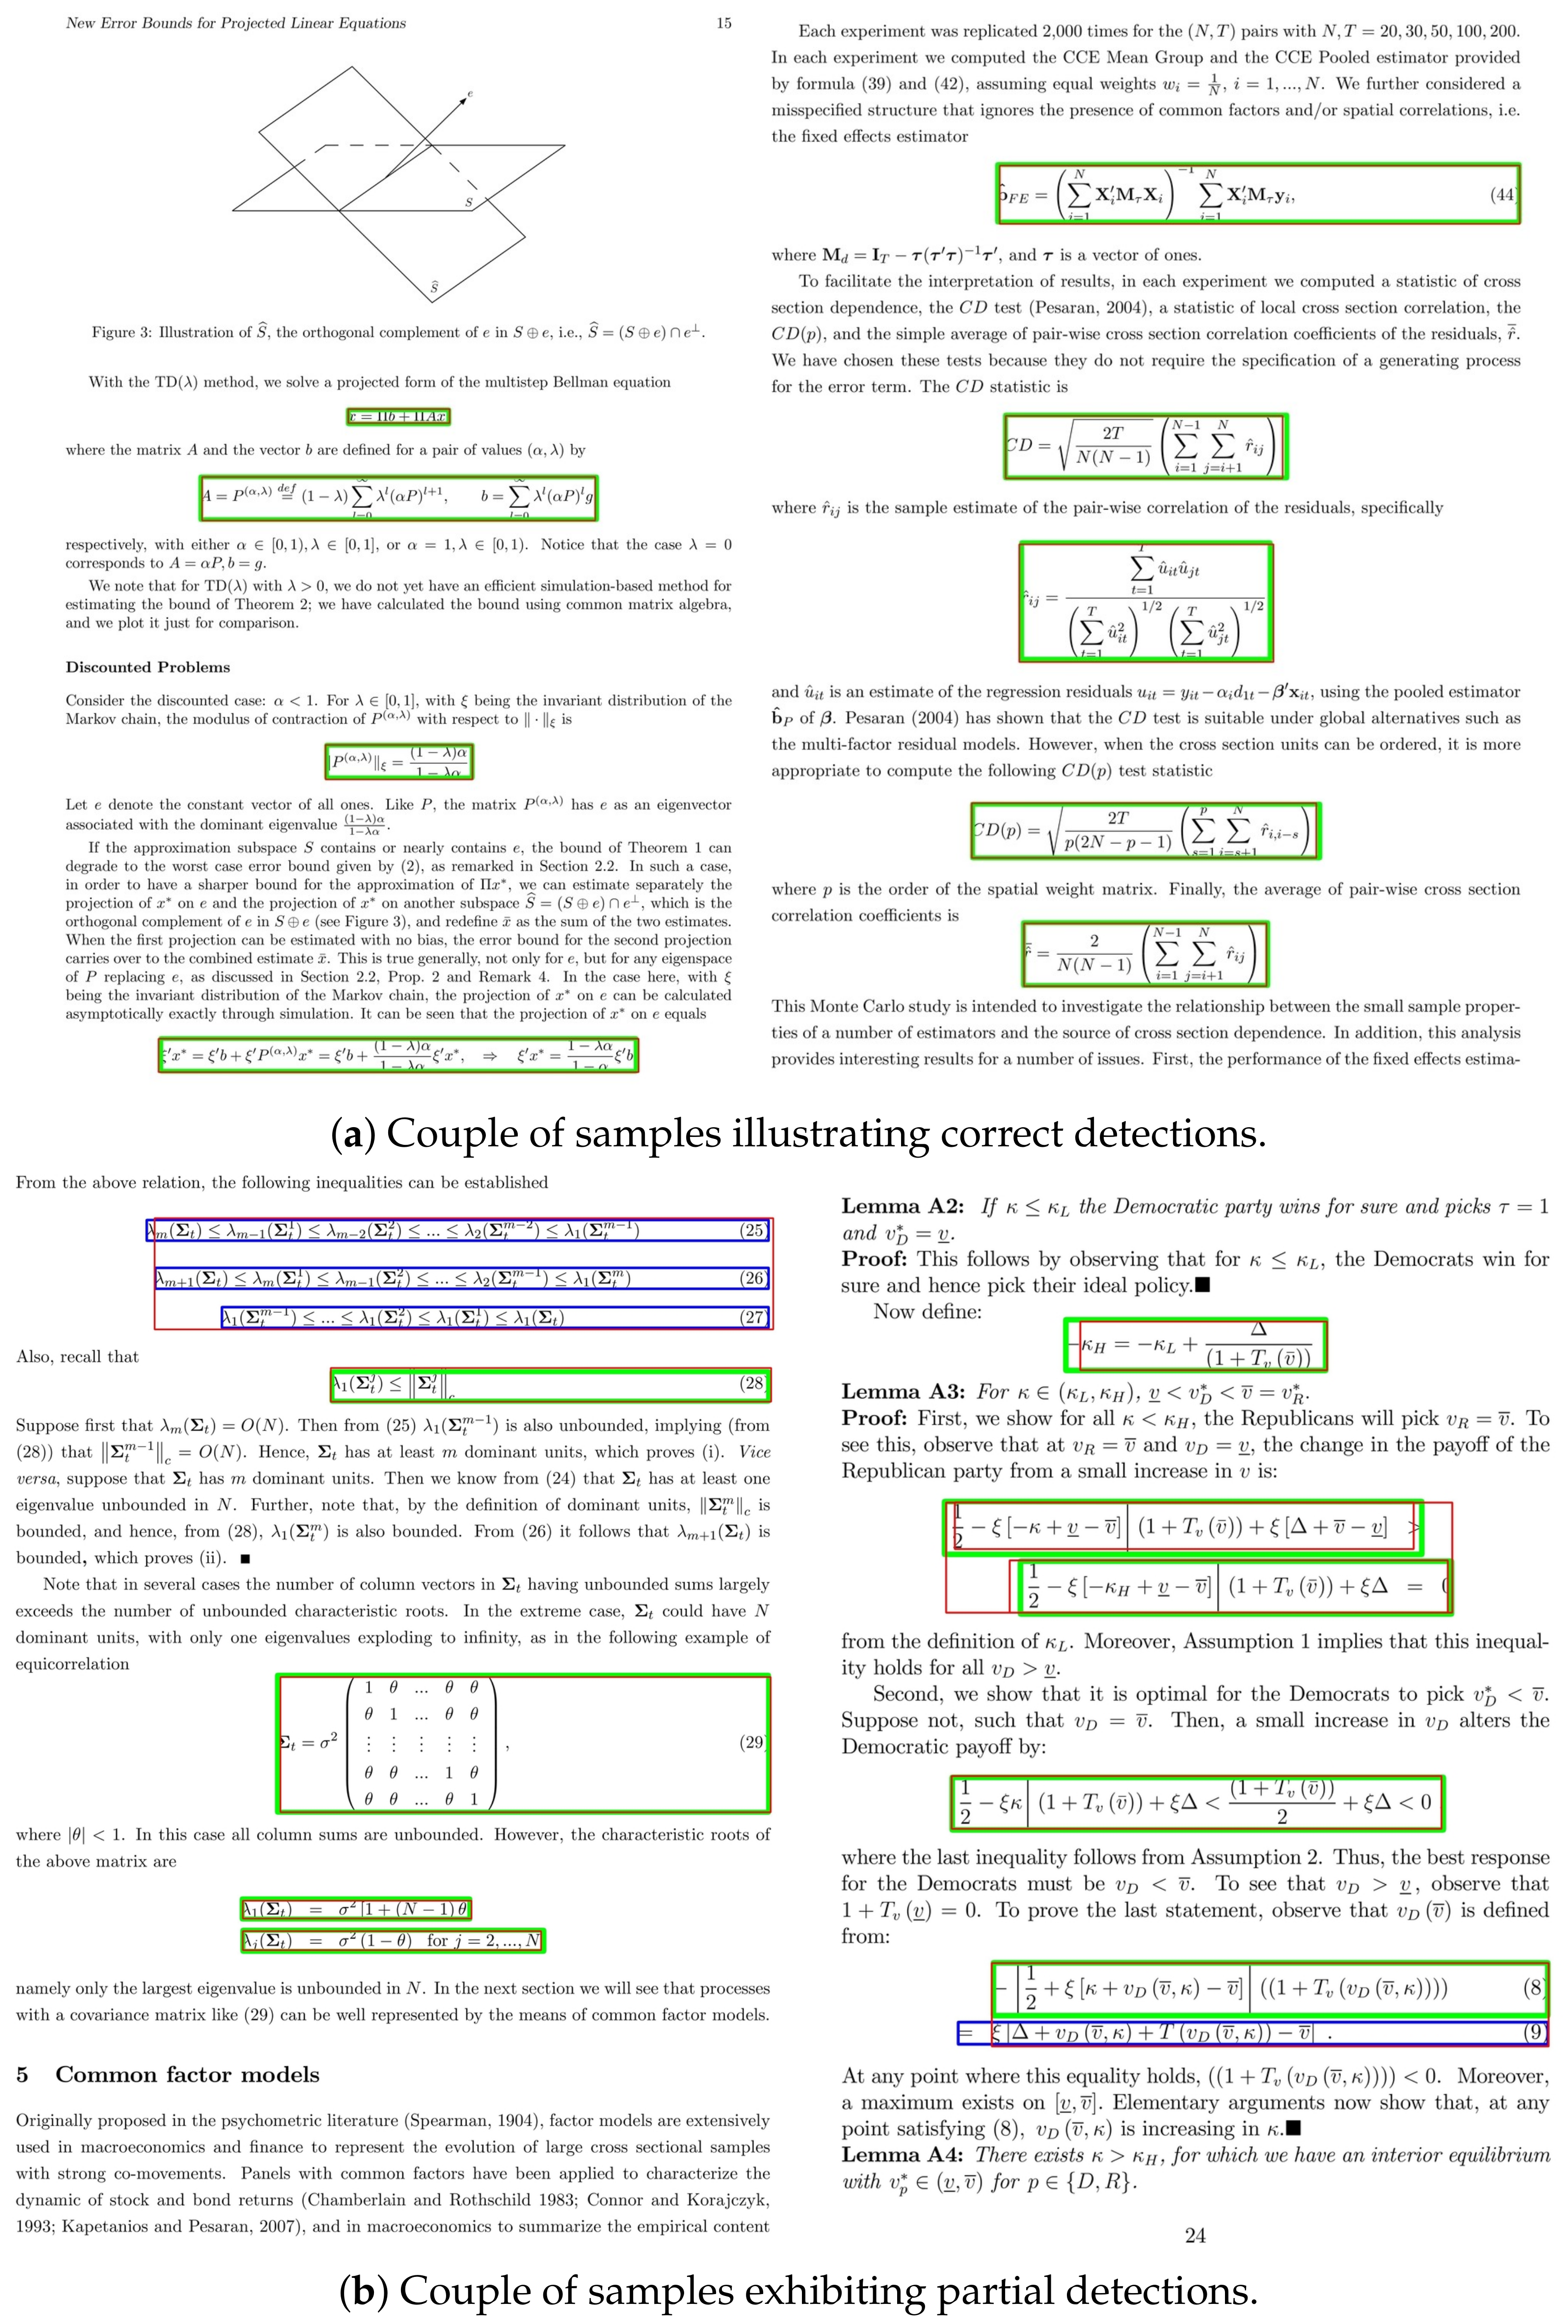
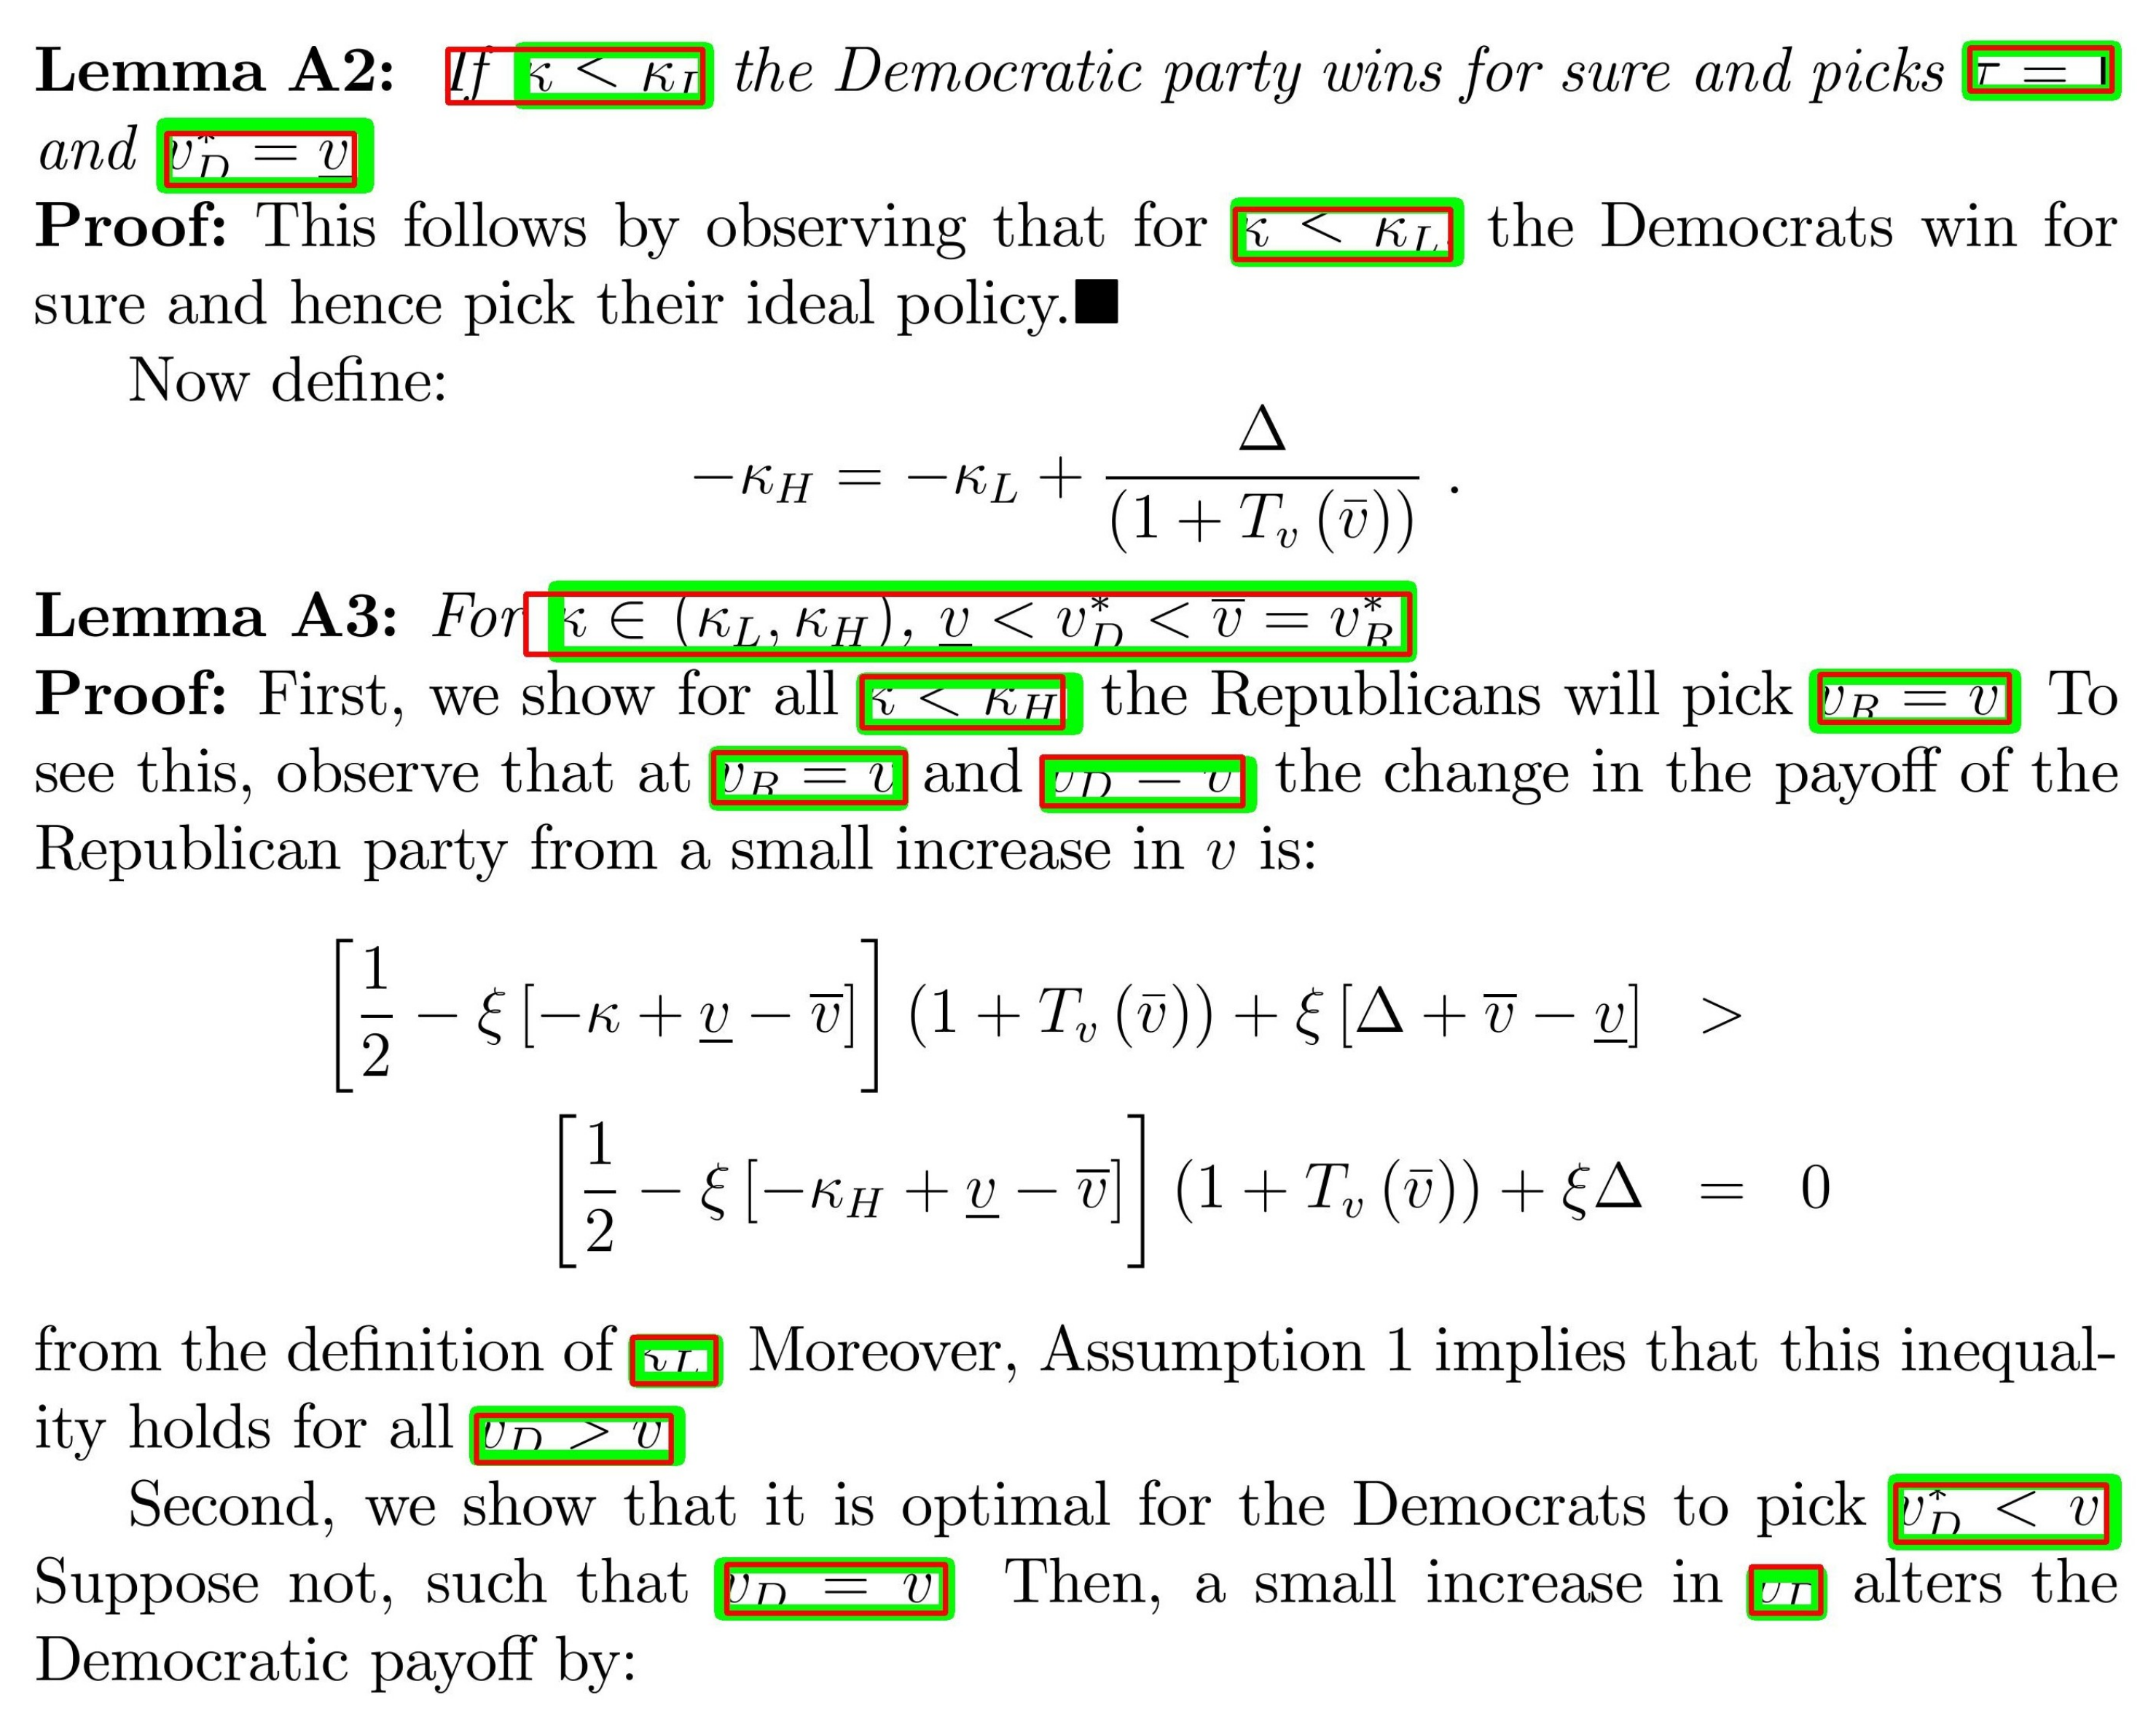
- Correct: the predicted bounding box is considered correct when the IoU score between the predicted formula region and the ground truth is equal to or greater than 0.5.
- Partial: when the IoU score between the inferred and the ground truth formula region is in the interval (0; 0.5), the detection is categorized as partial.
4.3. Result and Discussion
4.3.1. ICDAR-17
Comparison with State-of-the-Art Methods
4.3.2. Marmot
Comparison with State-of-the-Art Methods
5. Conclusions and Future Work
Author Contributions
Funding
Institutional Review Board Statement
Informed Consent Statement
Data Availability Statement
Conflicts of Interest
References
- Kieninger, T.; Dengel, A. The t-recs table recognition and analysis system. In Proceedings of the International Workshop on Document Analysis Systems, Nagano, Japan, 4–6 November 1998; Springer: Berlin/Heidelberg, Germany, 1998; pp. 255–270. [Google Scholar]
- Inoue, K.; Miyazaki, R.; Suzuki, M. Optical recognition of printed mathematical documents. Proc. Third Asian Technol. Conf. Math 1998, 3, 280–289. [Google Scholar]
- Hashmi, K.A.; Ponnappa, R.B.; Bukhari, S.S.; Jenckel, M.; Dengel, A. Feedback Learning: Automating the Process of Correcting and Completing the Extracted Information. In Proceedings of the 2019 International Conference on Document Analysis and Recognition Workshops (ICDARW), Sydney, Australia, 20–25 September 2019; Volume 5, pp. 116–121. [Google Scholar]
- Smith, R. An overview of the Tesseract OCR engine. In Proceedings of the Ninth International Conference on Document Analysis and Recognition (ICDAR 2007), Curitiba, Brazil, 23–26 September 2007; Volume 2, pp. 629–633. [Google Scholar]
- Ahmad, R.; Afzal, M.Z.; Rashid, S.F.; Liwicki, M.; Breuel, T. Scale and rotation invariant OCR for Pashto cursive script using MDLSTM network. In Proceedings of the 13th International Conference on Document Analysis and Recognition (ICDAR), Nancy, France, 23–26 August 2015; pp. 1101–1105. [Google Scholar]
- Mokhtar, K.; Bukhari, S.S.; Dengel, A. OCR Error Correction: State-of-the-Art vs an NMT-based Approach. In Proceedings of the 13th IAPR International Workshop on Document Analysis Systems (DAS), Vienna, Austria, 24–27 April 2018; pp. 429–434. [Google Scholar]
- Mahdavi, M.; Zanibbi, R.; Mouchere, H.; Viard-Gaudin, C.; Garain, U. ICDAR 2019 CROHME+ TFD: Competition on recognition of handwritten mathematical expressions and typeset formula detection. In Proceedings of the 2019 International Conference on Document Analysis and Recognition (ICDAR), Sydney, Australia, 20–25 September 2019; pp. 1533–1538. [Google Scholar]
- Hashmi, K.A.; Liwicki, M.; Stricker, D.; Afzal, M.A.; Afzal, M.A.; Afzal, M.Z. Current Status and Performance Analysis of Table Recognition in Document Images with Deep Neural Networks. IEEE Access 2021, 9, 87663–87685. [Google Scholar] [CrossRef]
- Fang, J.; Tao, X.; Tang, Z.; Qiu, R.; Liu, Y. Dataset, ground-truth and performance metrics for table detection evaluation. In Proceedings of the 2012 10th IAPR International Workshop on Document Analysis Systems, Gold Coast, QLD, Australia, 27–29 March 2012; pp. 445–449. [Google Scholar]
- Chen, K.; Pang, J.; Wang, J.; Xiong, Y.; Li, X.; Sun, S.; Feng, W.; Liu, Z.; Shi, J.; Ouyang, W.; et al. Hybrid task cascade for instance segmentation. In Proceedings of the IEEE/CVF Conference on Computer Vision and Pattern Recognition, Long Beach, CA, USA, 16–20 June 2019; pp. 4974–4983. [Google Scholar]
- Phong, B.H.; Hoang, T.M.; Le, T.L. A hybrid method for mathematical expression detection in scientific document images. IEEE Access 2020, 8, 83663–83684. [Google Scholar] [CrossRef]
- Kacem, A.; Belaïd, A.; Ahmed, M.B. Automatic extraction of printed mathematical formulas using fuzzy logic and propagation of context. Int. J. Doc. Anal. Recognit. 2001, 4, 97–108. [Google Scholar] [CrossRef] [Green Version]
- Baker, J.B.; Sexton, A.P.; Sorge, V. Towards Reverse Engineering of PDF Documents. DML Towards Digit. Math. Libr. 2011, 4, 65–75. [Google Scholar]
- Jin, J.; Han, X.; Wang, Q. Mathematical Formulas Extraction; Icdar. Citeseer: Edinburgh, UK, 2003; pp. 1138–1141. [Google Scholar]
- Chang, T.Y.; Takiguchi, Y.; Okada, M. Physical structure segmentation with projection profile for mathematic formulae and graphics in academic paper images. In Proceedings of the Ninth International Conference on Document Analysis and Recognition (ICDAR 2007), Curitiba, State of Paraná, Brazil, 23–26 September 2007; Volume 2, pp. 1193–1197. [Google Scholar]
- Liu, Y.; Bai, K.; Gao, L. An efficient pre-processing method to identify logical components from pdf documents. In Pacific-Asia Conference on Knowledge Discovery and Data Mining; Springer: Berlin/Heidelberg, Germany, 2011; pp. 500–511. [Google Scholar]
- Ohyama, W.; Suzuki, M.; Uchida, S. Detecting mathematical expressions in scientific document images using a u-net trained on a diverse dataset. IEEE Access 2019, 7, 144030–144042. [Google Scholar] [CrossRef]
- Phong, B.H.; Dat, L.T.; Yen, N.T.; Hoang, T.M.; Le, T.L. A deep learning based system for mathematical expression detection and recognition in document images. In Proceedings of the 12th International Conference on Knowledge and Systems Engineering (KSE), Can Tho City, Vietnam, 12–14 November 2020; pp. 85–90. [Google Scholar]
- Mali, P.; Kukkadapu, P.; Mahdavi, M.; Zanibbi, R. ScanSSD: Scanning Single Shot Detector for Mathematical Formulas in PDF Document Images. arXiv 2020, arXiv:2003.08005. [Google Scholar]
- Younas, J.; Siddiqui, S.A.; Munir, M.; Malik, M.I.; Shafait, F.; Lukowicz, P.; Ahmed, S. Fi-Fo Detector: Figure and Formula Detection Using Deformable Networks. Appl. Sci. 2020, 10, 6460. [Google Scholar] [CrossRef]
- Ren, S.; He, K.; Girshick, R.; Sun, J. Faster r-cnn: Towards real-time object detection with region proposal networks. arXiv 2015, arXiv:1506.01497. [Google Scholar]
- Huang, Y.; Yan, Q.; Li, Y.; Chen, Y.; Wang, X.; Gao, L.; Tang, Z. A YOLO-based table detection method. In Proceedings of the 2019 International Conference on Document Analysis and Recognition (ICDAR), Sydney, Australia, 20–25 September 2019; pp. 813–818. [Google Scholar]
- Liu, W.; Anguelov, D.; Erhan, D.; Szegedy, C.; Reed, S.; Fu, C.Y.; Berg, A.C. Ssd: Single shot multibox detector. In Proceedings of the European Conference on Computer Vision, Amsterdam, The Netherlands, 8–16 October 2016; Springer: Berlin/Heidelberg, Germany, 2016; pp. 21–37. [Google Scholar]
- Lin, T.Y.; Dollár, P.; Girshick, R.; He, K.; Hariharan, B.; Belongie, S. Feature Pyramid Networks for Object Detection. arXiv 2017, arXiv:1612.03144. [Google Scholar]
- Agarwal, M.; Mondal, A.; Jawahar, C. CDeC-Net: Composite Deformable Cascade Network for Table Detection in Document Images. arXiv 2020, arXiv:2008.10831. [Google Scholar]
- Cai, Z.; Vasconcelos, N. Cascade r-cnn: Delving into high quality object detection. In Proceedings of the IEEE Conference on Computer Vision and Pattern Recognition, Salt Lake City, Utah, USA, 18–22 June 2018; pp. 6154–6162. [Google Scholar]
- Gao, L.; Yi, X.; Jiang, Z.; Hao, L.; Tang, Z. ICDAR2017 competition on page object detection. In Proceedings of the 2017 14th IAPR International Conference on Document Analysis and Recognition (ICDAR), Kyoto, Japan, 10–15 November 2017; Volume 1, pp. 1417–1422. [Google Scholar]
- Lin, X.; Gao, L.; Tang, Z.; Baker, J.; Sorge, V. Mathematical formula identification and performance evaluation in PDF documents. Int. J. Doc. Anal. Recognit. 2014, 17, 239–255. [Google Scholar] [CrossRef]
- Fateman, R.J.; Tokuyasu, T.; Berman, B.P.; Mitchell, N. Optical character recognition and parsing of typeset mathematics1. J. Vis. Commun. Image Represent. 1996, 7, 2–15. [Google Scholar] [CrossRef] [Green Version]
- Lee, H.J.; Wang, J.S. Design of a mathematical expression understanding system. Pattern Recognit. Lett. 1997, 18, 289–298. [Google Scholar] [CrossRef]
- Toumit, J.Y.; Garcia-Salicetti, S.; Emptoz, H. A hierarchical and recursive model of mathematical expressions for automatic reading of mathematical documents. In Proceedings of the Fifth International Conference on Document Analysis and Recognition. ICDAR’99 (Cat. No. PR00318), Bangalore, India, 20–22 September 1999; pp. 119–122. [Google Scholar]
- Garain, U.; Chaudhuri, B. A syntactic approach for processing mathematical expressions in printed documents. In Proceedings of the 15th International Conference on Pattern Recognition. ICPR-2000, Barcelona, Spain, 3–7 September 2000; Volume 4, pp. 523–526. [Google Scholar]
- Chowdhury, S.; Mandal, S.; Das, A.K.; Chanda, B. Automated segmentation of math-zones from document images. In Proceedings of the Seventh International Conference on Document Analysis and Recognition, Edinburgh, UK, 3–6 August 2003; Citeseer: Princeton, NJ, USA, 2003; pp. 755–759. [Google Scholar]
- Drake, D.M.; Baird, H.S. Distinguishing mathematics notation from English text using computational geometry. In Proceedings of the Eighth International Conference on Document Analysis and Recognition (ICDAR’05), Seoul, Korea, 29 September–1 August 2005; pp. 1270–1274. [Google Scholar]
- Bhatt, J.; Hashmi, K.A.; Afzal, M.Z.; Stricker, D. A Survey of Graphical Page Object Detection with Deep Neural Networks. Appl. Sci. 2021, 11, 5344. [Google Scholar] [CrossRef]
- He, W.; Luo, Y.; Yin, F.; Hu, H.; Han, J.; Ding, E.; Liu, C.L. Context-aware mathematical expression recognition: An end-to-end framework and a benchmark. In Proceedings of the 23rd International Conference on Pattern Recognition (ICPR), Cancun, Mexico, 4–8 December 2016; pp. 3246–3251. [Google Scholar]
- Gao, L.; Yi, X.; Liao, Y.; Jiang, Z.; Yan, Z.; Tang, Z. A deep learning-based formula detection method for PDF documents. In Proceedings of the 14th IAPR International Conference on Document Analysis and Recognition (ICDAR), Kyoto, Japan, 10–15 November 2017; Volume 1, pp. 553–558. [Google Scholar]
- Yi, X.; Gao, L.; Liao, Y.; Zhang, X.; Liu, R.; Jiang, Z. CNN based page object detection in document images. In Proceedings of the 14th IAPR International Conference on Document Analysis and Recognition (ICDAR), Kyoto, Japan, 10–15 November 2017; Volume 1, pp. 230–235. [Google Scholar]
- Ronneberger, O.; Fischer, P.; Brox, T. U-net: Convolutional networks for biomedical image segmentation. In Proceedings of the International Conference on Medical Image Computing and Computer-Assisted Intervention, Strasbourg, France, 27 September–1 October 2015; Springer: Berlin/Heidelberg, Germany, 2015; pp. 234–241. [Google Scholar]
- Redmon, J.; Farhadi, A. Yolov3: An incremental improvement. arXiv 2018, arXiv:1804.02767. [Google Scholar]
- Li, X.H.; Yin, F.; Liu, C.L. Page object detection from pdf document images by deep structured prediction and supervised clustering. In Proceedings of the 2018 24th International Conference on Pattern Recognition (ICPR), Beijing, China, 20–24 August 2018; pp. 3627–3632. [Google Scholar]
- Dai, J.; Qi, H.; Xiong, Y.; Li, Y.; Zhang, G.; Hu, H.; Wei, Y. Deformable Convolutional Networks. arXiv 2017, arXiv:1703.06211. [Google Scholar]
- He, K.; Gkioxari, G.; Dollár, P.; Girshick, R. Mask r-cnn. In Proceedings of the IEEE International Conference on Computer Vision, Venice, Italy, 22–29 October 2017; pp. 2961–2969. [Google Scholar]
- Zhao, Z.Q.; Zheng, P.; Xu, S.T.; Wu, X. Object detection with deep learning: A review. IEEE Trans. Neural Networks Learn. Syst. 2019, 30, 3212–3232. [Google Scholar] [CrossRef] [Green Version]
- Liu, Y.; Wang, Y.; Wang, S.; Liang, T.; Zhao, Q.; Tang, Z.; Ling, H. Cbnet: A novel composite backbone network architecture for object detection. In Proceedings of the AAAI Conference on Artificial Intelligence, New York, NY, USA, 7–12 February 2020; Volume 34, pp. 11653–11660. [Google Scholar]
- Xie, S.; Girshick, R.; Dollár, P.; Tu, Z.; He, K. Aggregated Residual Transformations for Deep Neural Networks. arXiv 2016, arXiv:1611.05431. [Google Scholar]
- Yosinski, J.; Clune, J.; Nguyen, A.; Fuchs, T.; Lipson, H. Understanding neural networks through deep visualization. arXiv 2015, arXiv:1506.06579. [Google Scholar]
- Siddiqui, S.A.; Malik, M.I.; Agne, S.; Dengel, A.; Ahmed, S. Decnt: Deep deformable cnn for table detection. IEEE Access 2018, 6, 74151–74161. [Google Scholar] [CrossRef]
- Zhu, X.; Hu, H.; Lin, S.; Dai, J. Deformable convnets v2: More deformable, better results. In Proceedings of the IEEE/CVF Conference on Computer Vision and Pattern Recognition, Long Beach, CA, USA, 15–21 June 2019; pp. 9308–9316. [Google Scholar]
- Lin, X.; Gao, L.; Tang, Z.; Lin, X.; Hu, X. Performance evaluation of mathematical formula identification. In Proceedings of the 10th IAPR International Workshop on Document Analysis Systems, Queensland, Australia, 27–29 March 2012; pp. 287–291. [Google Scholar]
- Chen, K.; Wang, J.; Pang, J.; Cao, Y.; Xiong, Y.; Li, X.; Sun, S.; Feng, W.; Liu, Z.; Xu, J.; et al. MMDetection: Open MMLab Detection Toolbox and Benchmark. arXiv 2019, arXiv:1906.07155. [Google Scholar]
- Lin, T.Y.; Maire, M.; Belongie, S.; Bourdev, L.; Girshick, R.; Hays, J.; Perona, P.; Ramanan, D.; Zitnick, C.L.; Dollár, P. Microsoft COCO: Common Objects in Context. arxiv 2014, arXiv:1405.0312. [Google Scholar]
- Powers, D.M. Evaluation: From precision, recall and F-measure to ROC, informedness, markedness and correlation. arXiv 2020, arXiv:2010.16061. [Google Scholar]
- Blaschko, M.B.; Lampert, C.H. Learning to localize objects with structured output regression. In Proceedings of the European Conference on Computer Vision, Marseille, France, 12–16 October 2008; Springer: Berlin/Heidelberg, Germany, 2008; pp. 2–15. [Google Scholar]
- Chu, W.T.; Liu, F. Mathematical formula detection in heterogeneous document images. In Proceedings of the 2013 Conference on Technologies and Applications of Artificial Intelligence, Taipei, Taiwan, 6–8 December 2013; pp. 140–145. [Google Scholar]


| Stage | Output | DCN | ResNeXt-101 (32 × 4d) |
|---|---|---|---|
| conv1 | 112 × 112 | ✗ | 7 × 7, 64, stride 2 |
| conv2 | 56 × 56 | - | 3 × 3 max pooling, stride 2 |
| ✗ | 1 × 1, 128 3 × 3, 128, C = 32 × 3 1 × 1, 128 | ||
| conv3 | 28 × 28 | ✓ | 1 × 1, 256 3 × 3, 256, C = 32 × 4 1 × 1, 512 |
| conv4 | 14 × 14 | ✓ | 1 × 1, 512 3 × 3, 512, C = 32 × 23 1 × 1, 1024 |
| conv5 | 7 × 7 | ✓ | 1 × 1, 1024 3 × 3, 1024, C = 32 × 3 1 × 1, 2048 |
| 1 × 1 | ✗ | global average pool 1000-d fc, softmax |
| Datasets | ICDAR-17 | Marmot | ||
|---|---|---|---|---|
| Train | Test | Train | Test | |
| Number of Images | 1600 | 817 | 330 | 70 |
| Number of Isolated Formulas | 3534 | 1929 | 1322 | 253 |
| Number of Embedded Formulas | - | - | 6951 | 956 |
| ICDAR-2017 POD | ||||||||
|---|---|---|---|---|---|---|---|---|
| Method | IoU = 0.6 | IoU = 0.8 | ||||||
| Precision | Recall | F1-Score | AP | Precision | Recall | F1-Score | AP | |
| NLPR-PAL [27] † | 0.901 | 0.929 | 0.915 | 0.839 | 0.888 | 0.916 | 0.902 | 0.816 |
| Li et al. [41] † | 0.935 | 0.331 | 0.489 | 0.312 | 0.877 | 0.310 | 0.459 | 0.274 |
| Fi-Fo Detector Non Deformable [20] | 0.910 | 0.927 | 0.918 | 0.953 | 0.860 | 0.877 | 0.868 | 0.928 |
| Fi-Fo Detector Deformable [20] | 0.957 | 0.952 | 0.954 | 0.949 | 0.913 | 0.908 | 0.910 | 0.898 |
| Ours (Without Pre-Processing) | 0.950 | 0.948 | 0.949 | 0.97 | 0.914 | 0.912 | 0.913 | 0.949 |
| Ours (Complete Method) | 0.954 | 0.952 | 0.953 | 0.97.5 | 0.918 | 0.916 | 0.917 | 0.954 |
| Method | Formula | Correct (%) | Partial (%) | Total |
|---|---|---|---|---|
| Chu et al. [55] | Isolated | 26.87 | 44.87 | 71.76 |
| Embedded | 1.74 | 28.87 | 30.61 | |
| Phong et al. [11] | Isolated | 50.37 | 39.14 | 91.18 |
| Embedded | 22.9 | 58.45 | 81.35 | |
| Phong et al. [18] | Isolated | 93 | - | - |
| Embedded | 73 | - | - | |
| Ours (Without Pre-processing) | Isolated | 92.5 | 4.64 | 97.14 |
| Embedded | 80.6 | 6.23 | 86.83 | |
| Ours (Complete) | Isolated | 93 | 4.86 | 97.86 |
| Embedded | 81.3 | 6.77 | 88.07 |
Publisher’s Note: MDPI stays neutral with regard to jurisdictional claims in published maps and institutional affiliations. |
© 2021 by the authors. Licensee MDPI, Basel, Switzerland. This article is an open access article distributed under the terms and conditions of the Creative Commons Attribution (CC BY) license (https://creativecommons.org/licenses/by/4.0/).
Share and Cite
Hashmi, K.A.; Pagani, A.; Liwicki, M.; Stricker, D.; Afzal, M.Z. Cascade Network with Deformable Composite Backbone for Formula Detection in Scanned Document Images. Appl. Sci. 2021, 11, 7610. https://doi.org/10.3390/app11167610
Hashmi KA, Pagani A, Liwicki M, Stricker D, Afzal MZ. Cascade Network with Deformable Composite Backbone for Formula Detection in Scanned Document Images. Applied Sciences. 2021; 11(16):7610. https://doi.org/10.3390/app11167610
Chicago/Turabian StyleHashmi, Khurram Azeem, Alain Pagani, Marcus Liwicki, Didier Stricker, and Muhammad Zeshan Afzal. 2021. "Cascade Network with Deformable Composite Backbone for Formula Detection in Scanned Document Images" Applied Sciences 11, no. 16: 7610. https://doi.org/10.3390/app11167610
APA StyleHashmi, K. A., Pagani, A., Liwicki, M., Stricker, D., & Afzal, M. Z. (2021). Cascade Network with Deformable Composite Backbone for Formula Detection in Scanned Document Images. Applied Sciences, 11(16), 7610. https://doi.org/10.3390/app11167610