
Deep Learning Based Android Anomaly Detection Using a Combination of Vulnerabilities Dataset


Abstract
:1. Introduction
- 1.
- We developed a malware detection model based on deep learning and we investigated several node architectures in hidden layers in order to get the highest possible performance. The proposed model outperforms the state-of-the-art.
- 2.
- We developed a malware detection model based on SVM and investigated different parameter settings to identify which were the best for our malware detection task.
- 3.
- We provide comparison of the performance of our DL and SVM classifiers, with respect to state-of-the-art approaches and even some commercial anti-viruses and results show that our classifiers are the most effective in identifying malicious applications. As such, our models establish a new, important reference point in the current state-of-the-art when it comes to malware detection.
2. Background
2.1. Android Vulnerabilities
2.1.1. Dangerous Permissions
2.1.2. AndroBugs Vulnerabilities
2.1.3. Code Smell
2.2. Machine Learning (ML)
2.2.1. Deep Learning (DL)
2.2.2. Support Vector Machines (SVM)
3. Methodology
3.1. Dataset
| Algorithm 1: VirusShare Android apps collection. |
 |
3.2. Feature Extraction
| Algorithm 2: Feature Extraction Algorithm. |
 |
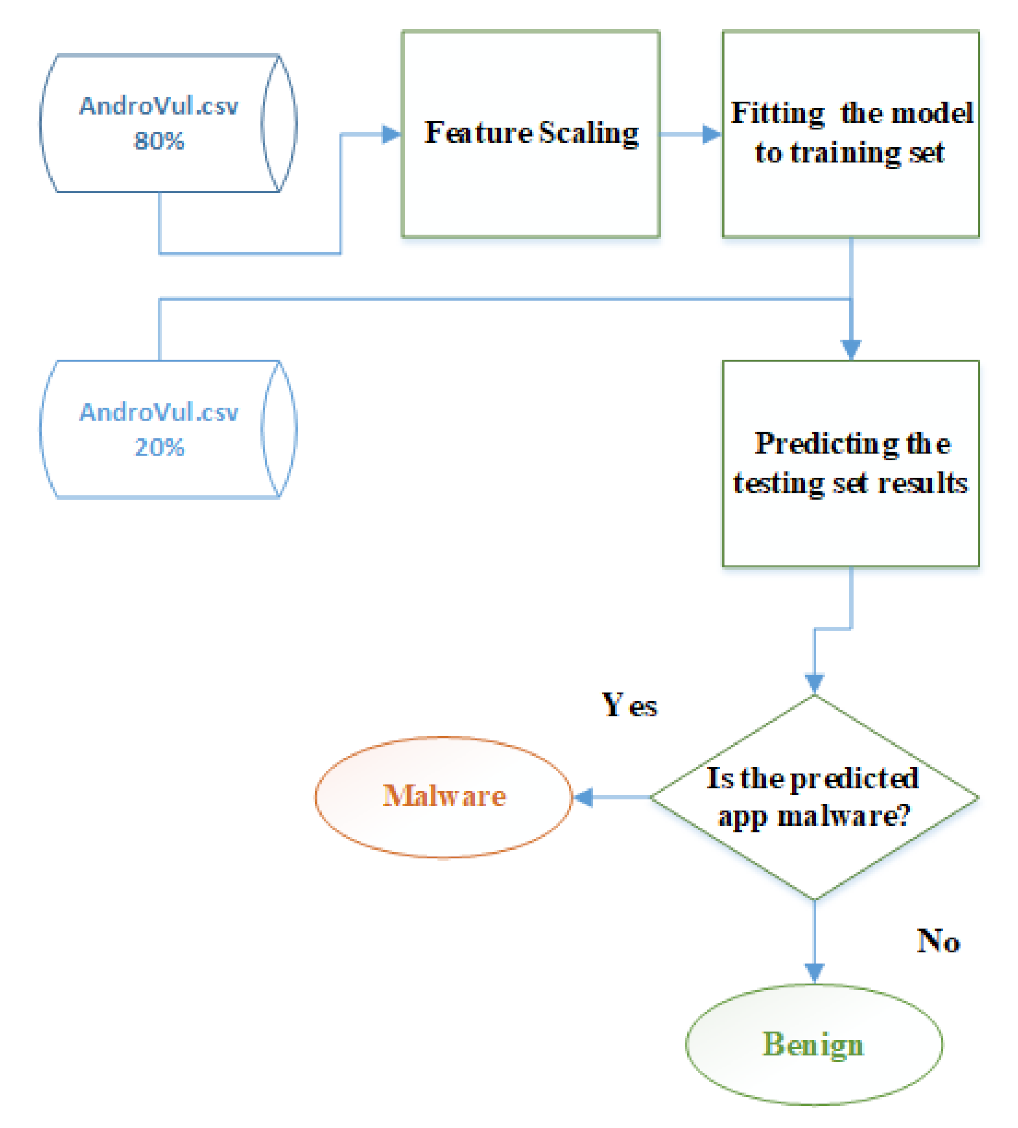
3.3. General Architecture of Our Machine Learning Approach
3.4. Android Malware Detection Based on Deep Learning
| Algorithm 3: Deep Learning based Model. |
 |
3.5. Android Malware Detection Based on Support Vector Machine
| Algorithm 4: Support Vector Machine based Model. |
 |
4. Experiments
4.1. Performance Indicators
- Precision: The ratio of actual malwares in the set of apps classified as such: TP/(TP+FP)
- Recall: The ratio of malwares that were detected as such: TP/(TP+FN)
- Accuracy: The percentage of applications that have been appropriately categorised:(TP+TN)/(TP+TN+FP+FN)
- F1-Measure: A performance indicator that takes into account both the precision and recall of the obtained classification: 2 × (Recall × Precision)/(Recall + Precision)
- Area under ROC Curve (AUC): A measure of the predictive power of the classifier that basically informs on how well the model can distinguish between classes (here, benign apps vs. malwares).
4.2. Experimental Setup
4.3. Results
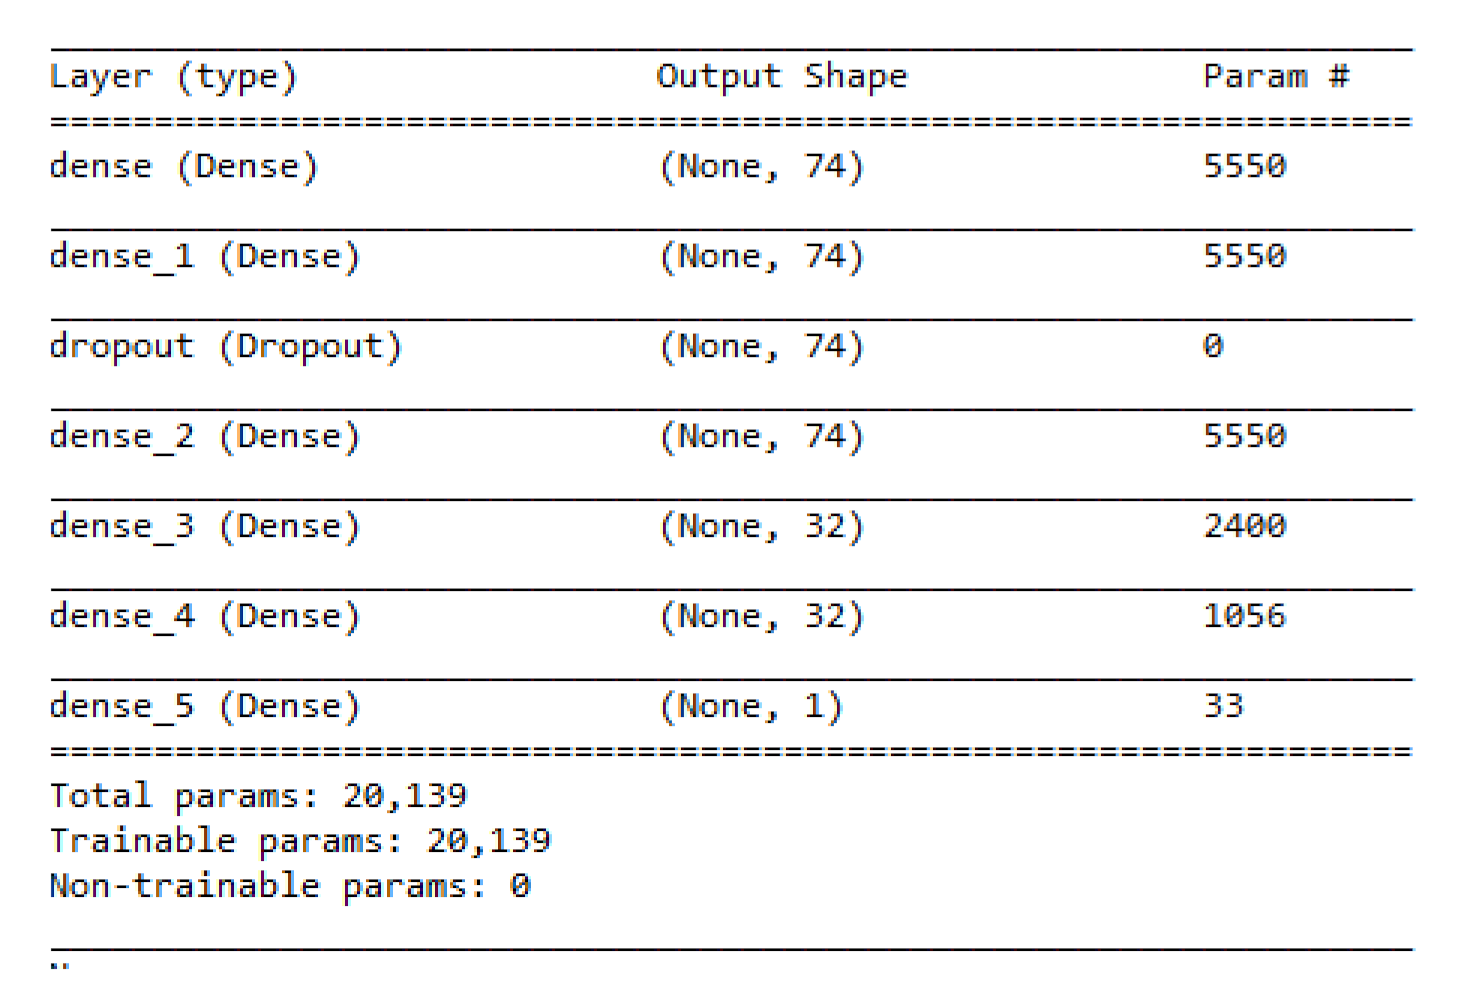
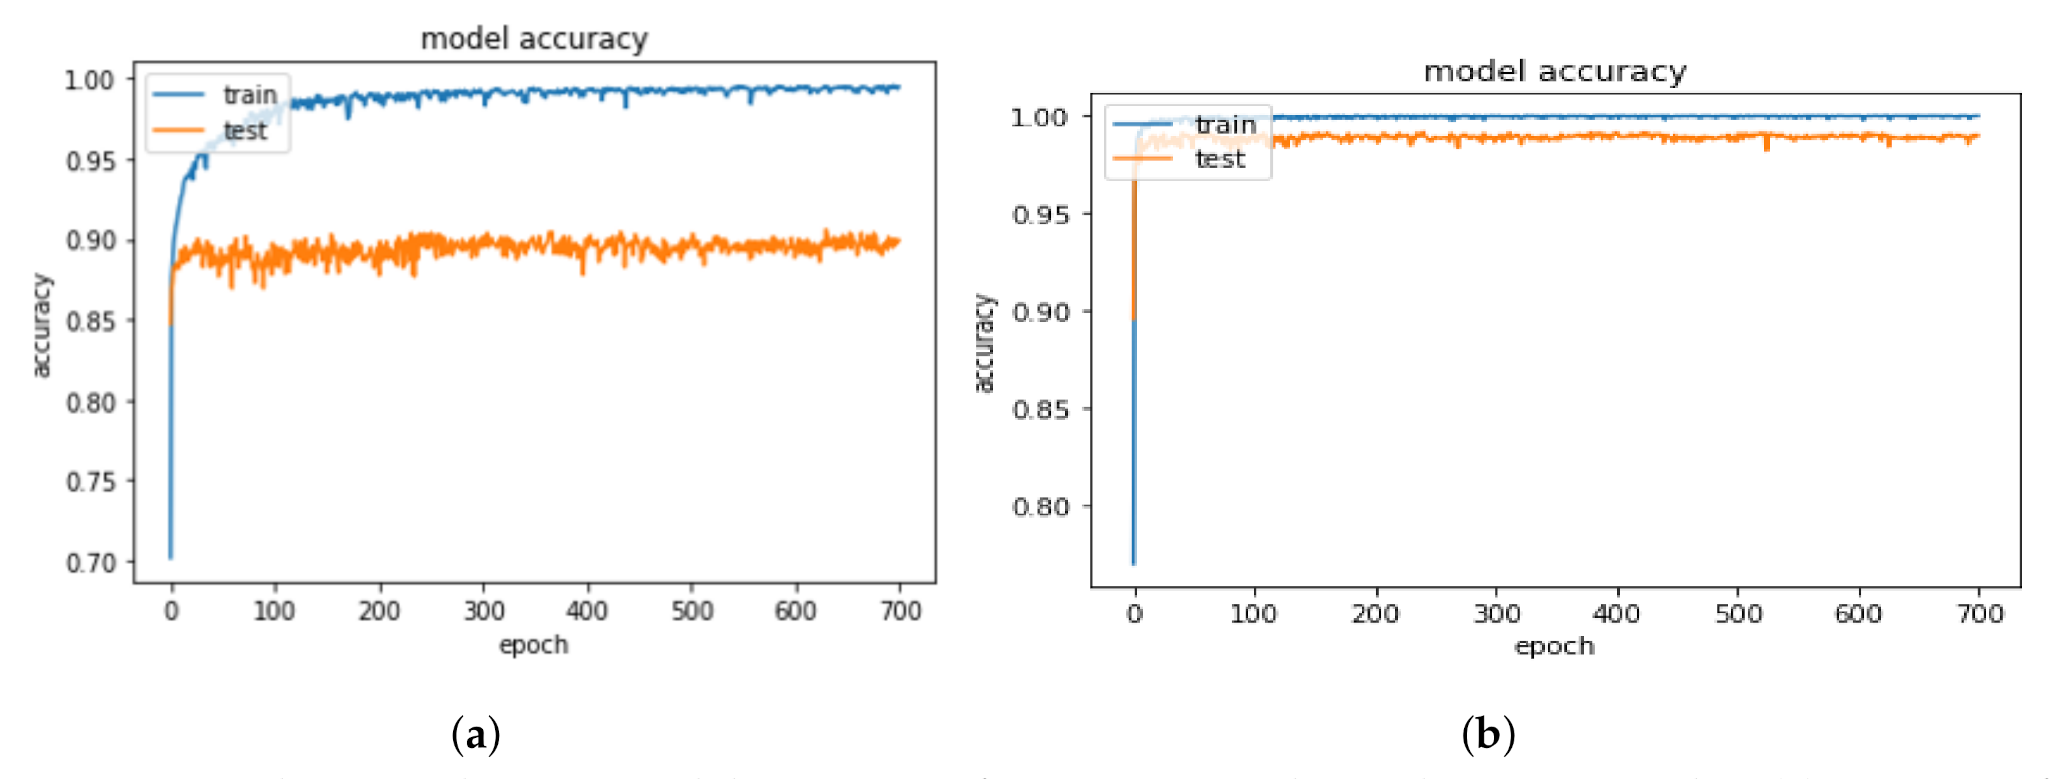
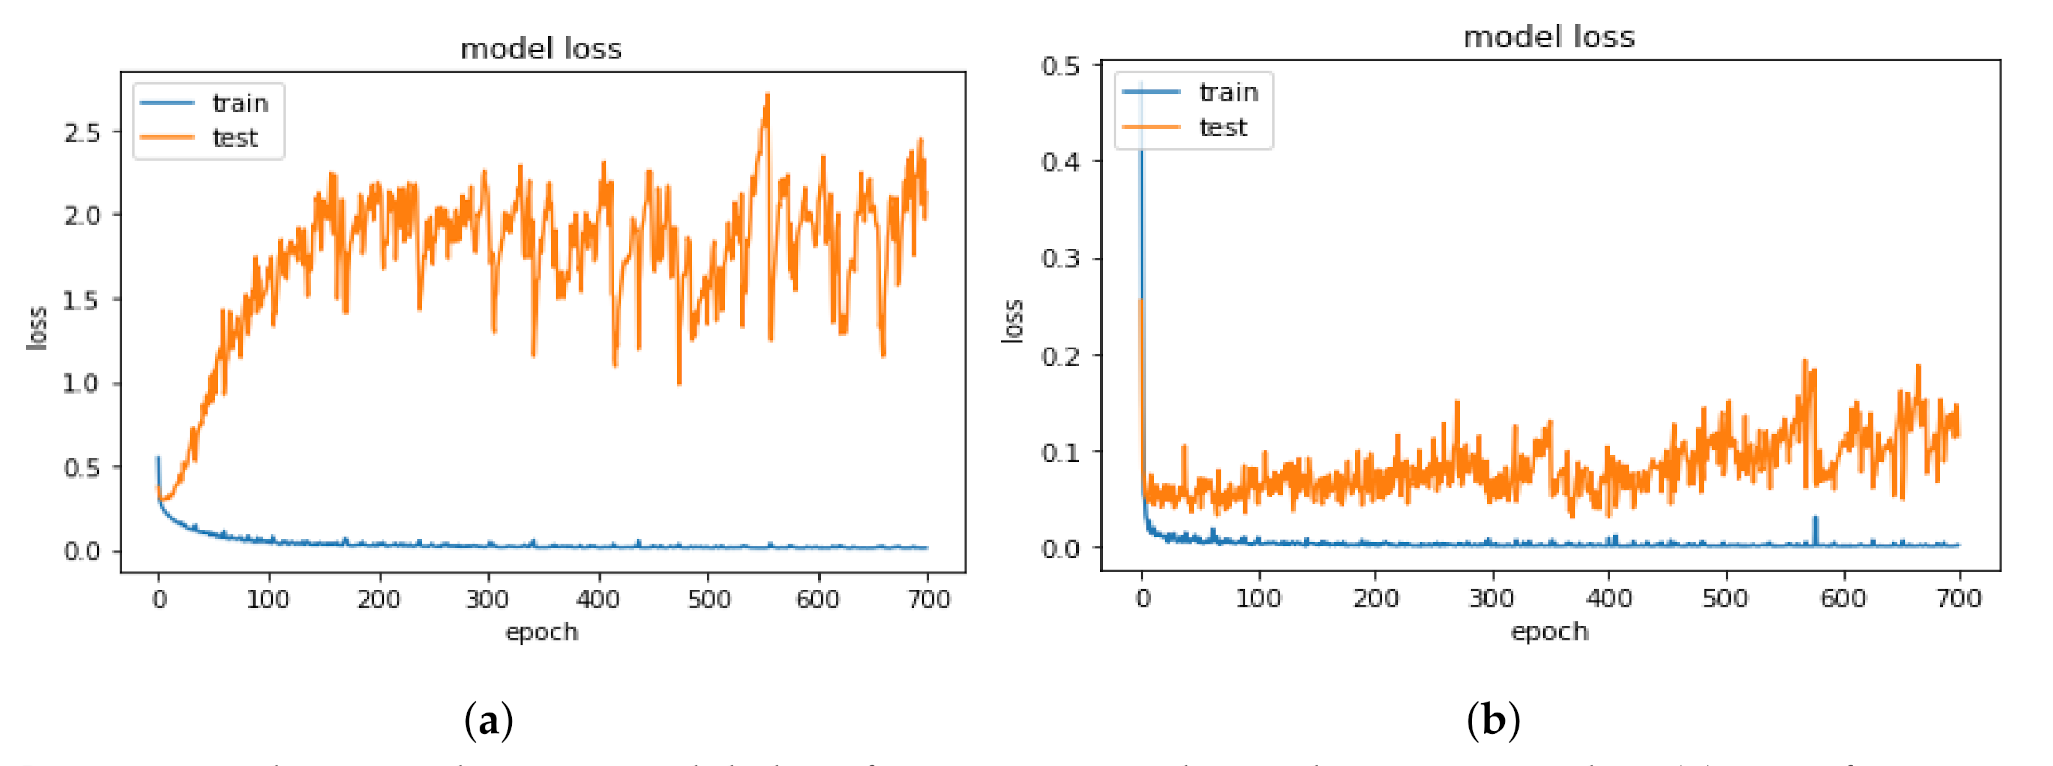
- Performance of DL model:Initially, we used 11,814 apps; in this experiment, an app which has 0 flag labelled as benign, whereas an app which has two or more flags labelled as malware, and an app with one flag are excluded. The training phase performance results were higher than the testing phase, which caused over-fitting in the model. To solve this situation, we increased the size of the dataset by adding the malware apps from VirusShare and apps with one flag as benign. Experimentally, we observe that the performance improved. From Table 4, we can observe that the size of the dataset has increased from 11,814 to 18,780 to avoid over-fitting and improve the performance.
- Performance of the SVM model:Table 3 illustrates the experimental results. When we were tuning the hyperplane parameters, we noticed that when gamma is smaller than 0.01 and C is higher than 1000, the results improve, i.e., both parameters increase the values of AUC, F1, and the accuracy. With such parameter values, we can therefore get the correctly separating hyperplane and improve the performance of the model. Table 6 shows that the confusion matrix correctly classifies the 2425 benign samples as benign and 1235 malware samples as malware. Out of 3706 app samples, 3660 were predicted accurately and only 46 were wrongly predicted.
- Challenges and discussionImproving the performance of the SVM classifier was challenging and involved some fine tuning with respect to the two parameters: C and gamma. Our results showed that tuning C correctly is a vital step in the use of SVMs for structural risk minimization In RBF kernel, both C and gamma parameters need to be optimized simultaneously. If gamma is large, the effect of C becomes negligible.. When gamma gets smaller, the results improve.As for the DL, the configuration of the hyperparameters (the number of layers and nodes in each hidden layer) for our specific predictive modeling problem was done via systematic experimentation. It is worth noting that the time complexity of the DL algorithm is higher than the time complexity of the SVM algorithm.
4.4. Comparison with Well-Known Anti-Virus Tool
5. Related Work
5.1. Static Analysis
5.2. Dynamic Analysis
5.3. Hybrid Analysis
6. Conclusions
Author Contributions
Funding
Institutional Review Board Statement
Informed Consent Statement
Data Availability Statement
Acknowledgments
Conflicts of Interest
References
- Google Play Store. Android Official Store. Available online: https://play.google.com/store/apps (accessed on 27 January 2021).
- Sirisha, P.; Anuradha, T. Detection of Permission Driven Malware in Android Using Deep Learning Techniques. In Proceedings of the 2019 3rd International conference on Electronics, Communication and Aerospace Technology (ICECA), Coimbatore, India, 12 June 2019; pp. 941–945. [Google Scholar]
- Sabhadiya, S.; Barad, J.; Gheewala, J. Android Malware Detection using Deep Learning. In Proceedings of the 2019 3rd International Conference on Trends in Electronics and Informatics (ICOEI), Tirunelveli, India, 23 April 2019; pp. 1254–1260. [Google Scholar]
- Haystack. Mobile Issues. Available online: https://safeguarde.com/mobile-apps-stealing-your-information/ (accessed on 14 March 2021).
- AV-TEST. Security Institute. Available online: https://www.av-test.org/en/statistics/malware/ (accessed on 12 November 2020).
- Chebyshev, V. Mobile Malware Evolution 2020. Available online: https://securelist.com/mobile-malware-evolution-2020/101029/ (accessed on 1 March 2021).
- Kumaran, M.; Li, W. Lightweight malware detection based on machine learning algorithms and the android manifest file. In Proceedings of the 2016 IEEE MIT Undergraduate Research Technology Conference (URTC), Cambridge, MA, USA, 4 November 2016; pp. 1–3. [Google Scholar]
- Li, W.; Wang, Z.; Cai, J.; Cheng, S. An android malware detection approach using weight-adjusted deep learning. In Proceedings of the 2018 International Conference on Computing, Networking and Communications (ICNC), Maui, HI, USA, 5 March 2018; pp. 437–441. [Google Scholar]
- Namrud, Z.; Kpodjedo, S.; Talhi, C. AndroVul: A repository for Android security vulnerabilities. In Proceedings of the 29th Annual International Conference on Computer Science and Software Engineering, Markham, ON, Canada, 4 November 2019; pp. 64–71. [Google Scholar]
- Tchakounté, F.; Hayata, F. Supervised learning based detection of malware on android. In Mobile Security and Privacy; Elsevier: Amsterdam, The Netherlands, 2017; pp. 101–154. [Google Scholar]
- Verbraeken, J.; Wolting, M.; Katzy, J.; Kloppenburg, J.; Verbelen, T.; Rellermeyer, J.S. A Survey on Distributed Machine Learning. ACM Comput. Surv. (CSUR) 2020, 53, 1–33. [Google Scholar] [CrossRef] [Green Version]
- Gadient, P.; Nierstrasz, O.; Ghafari, M. Security in Android Applications; University of Bern: Bern, Switzerland, 2017. [Google Scholar]
- Catak, F.O.; Yazı, A.F.; Elezaj, O.; Ahmed, J. Deep learning based Sequential model for malware analysis using Windows exe API Calls. PeerJ Comput. Sci. 2020, 6, e285. [Google Scholar] [CrossRef] [PubMed]
- Catak, F.O.; Ahmed, J.; Sahinbas, K.; Khand, Z.H. Data augmentation based malware detection using convolutional neural networks. PeerJ Comput. Sci. 2021, 7, e346. [Google Scholar] [CrossRef] [PubMed]
- Naway, A.; Li, Y. A review on the use of deep learning in android malware detection. arXiv 2018, arXiv:1812.10360. [Google Scholar]
- Li, Y.; Wang, G.; Nie, L.; Wang, Q.; Tan, W. Distance metric optimization driven convolutional neural network for age invariant face recognition. Pattern Recognit. 2018, 75, 51–62. [Google Scholar] [CrossRef]
- Verma, S.; Sharan, A. Enhancing the performance of SVM based document classifier by selecting good class representative using fuzzy membership criteria. In Proceedings of the 2017 3rd International Conference on Computational Intelligence & Communication Technology (CICT), Ghaziabad, India, 9 February 2017; pp. 1–6. [Google Scholar]
- AndroZoo. Android Apps Repository. Available online: https://AndroZoo.uni.lu/ (accessed on 1 March 2018).
- VirusTotal. Antiviruses Website Scanners. Available online: https://www.virustotal.com/gui/ (accessed on 11 March 2018).
- VirusShare. Malware Repository. Available online: https://virusshare.com/ (accessed on 25 August 2019).
- Bhattacharya, A.; Goswami, R.T. DMDAM: Data mining based detection of android malware. In Proceedings of the First International Conference on Intelligent Computing and Communication, Kalyani, West Bengal, India, 2 August 2017; pp. 187–194. [Google Scholar]
- Xu, J.; Rahmatizadeh, R.; Bölöni, L.; Turgut, D. A sequence learning model with recurrent neural networks for taxi demand prediction. In Proceedings of the 2017 IEEE 42nd Conference on Local Computer Networks (LCN), Singapore, 9 October 2017; pp. 261–268E. [Google Scholar]
- Huang, G.; Liu, Z.; Van Der Maaten, L.; Weinberger, K.Q. Densely connected convolutional networks. In Proceedings of the IEEE Conference on Computer Vision and Pattern Recognition, Honolulu, HI, USA, 21–26 July 2017; pp. 4700–4708. [Google Scholar]
- Naway, A.; Li, Y. Using Deep Neural Network for Android Malware Detection. arXiv 2019, arXiv:1904.00736. [Google Scholar]
- Baskaran, B.; Ralescu, A. A Study of Android Malware Detection Techniques and Machine Learning. In Proceedings of the 27th Modern Artificial Intelligence and Cognitive Science Conference 2016, Dayton, OH, USA, 22–23 April 2016; pp. 15–23. [Google Scholar]
- Yerima, S.Y.; Sezer, S.; Muttik, I. Android malware detection using parallel machine learning classifiers. In Proceedings of the 2014 Eighth International Conference on Next Generation Mobile Apps, Services and Technologies, Oxford, UK, 10 September 2014; pp. 37–42. [Google Scholar]
- Al Ali, M.; Svetinovic, D.; Aung, Z.; Lukman, S. Malware detection in android mobile platform using machine learning algorithms. In Proceedings of the 2017 International Conference on Infocom Technologies and Unmanned Systems (Trends and Future Directions) (ICTUS), Dubai, United Arab Emirates, 18 December 2017; pp. 763–768. [Google Scholar]
- Rehman, Z.U.; Khan, S.N.; Muhammad, K.; Lee, J.W.; Lv, Z.; Baik, S.W.; Shah, P.A.; Awan, K.; Mehmood, I. Machine learning-assisted signature and heuristic-based detection of malwares in Android devices. Comput. Electr. Eng. 2018, 69, 828–841. [Google Scholar] [CrossRef]
- Zhu, H.J.; You, Z.H.; Zhu, Z.X.; Shi, W.L.; Chen, X.; Cheng, L. DroidDet: Effective and robust detection of android malware using static analysis along with rotation forest model. Neurocomputing 2018, 272, 638–646. [Google Scholar] [CrossRef]
- Masud, M.Z.; Sahib, S.; Abdollah, M.F.; Selamat, S.R.; Yusof, R. Analysis of features selection and machine learning classifier in android malware detection. In Proceedings of the 2014 International Conference on Information Science & Applications (ICISA), Seoul, Korea, 6 May 2014; pp. 1–5. [Google Scholar]
- Martinelli, F.; Marulli, F.; Mercaldo, F. Evaluating convolutional neural network for effective mobile malware detection. Procedia Comput. Sci. 2017, 112, 2372–2381. [Google Scholar] [CrossRef]
- Muttoo, S.K.; Badhani, S. Android malware detection: State of the art. Int. J. Inf. Technol. 2017, 9, 111–117. [Google Scholar] [CrossRef]
- Yuan, Z.; Lu, Y.; Wang, Z.; Xue, Y. Droid-sec: Deep learning in android malware detection. In Proceedings of the 2014 ACM Conference on SIGCOMM, Chicago, IL, USA, 17 August 2014; pp. 371–372. [Google Scholar]
- Yuan, Z.; Lu, Y.; Xue, Y. Droiddetector: Android malware characterization and detection using deep learning. Tsinghua Sci. Technol. 2016, 21, 114–123. [Google Scholar] [CrossRef]
- Xu, L.; Zhang, D.; Jayasena, N.; Cavazos, J. Hadm: Hybrid analysis for detection of malware. In Proceedings of the SAI Intelligent Systems Conference, London, UK, 21–22 September 2016; pp. 702–724. [Google Scholar]
- Zhu, H.J.; Jiang, T.H.; Ma, B.; You, Z.H.; Shi, W.L.; Cheng, L. HEMD: A highly efficient random forest-based malware detection framework for Android. Neural Comput. Appl. 2018, 30, 3353–3361. [Google Scholar] [CrossRef]


| App | Samples |
|---|---|
| Benign | 11,971 |
| Flagged Malware | 2831 |
| VirusShare Malware | 3978 |
| Total | 18,780 |
| Parameters | Value |
|---|---|
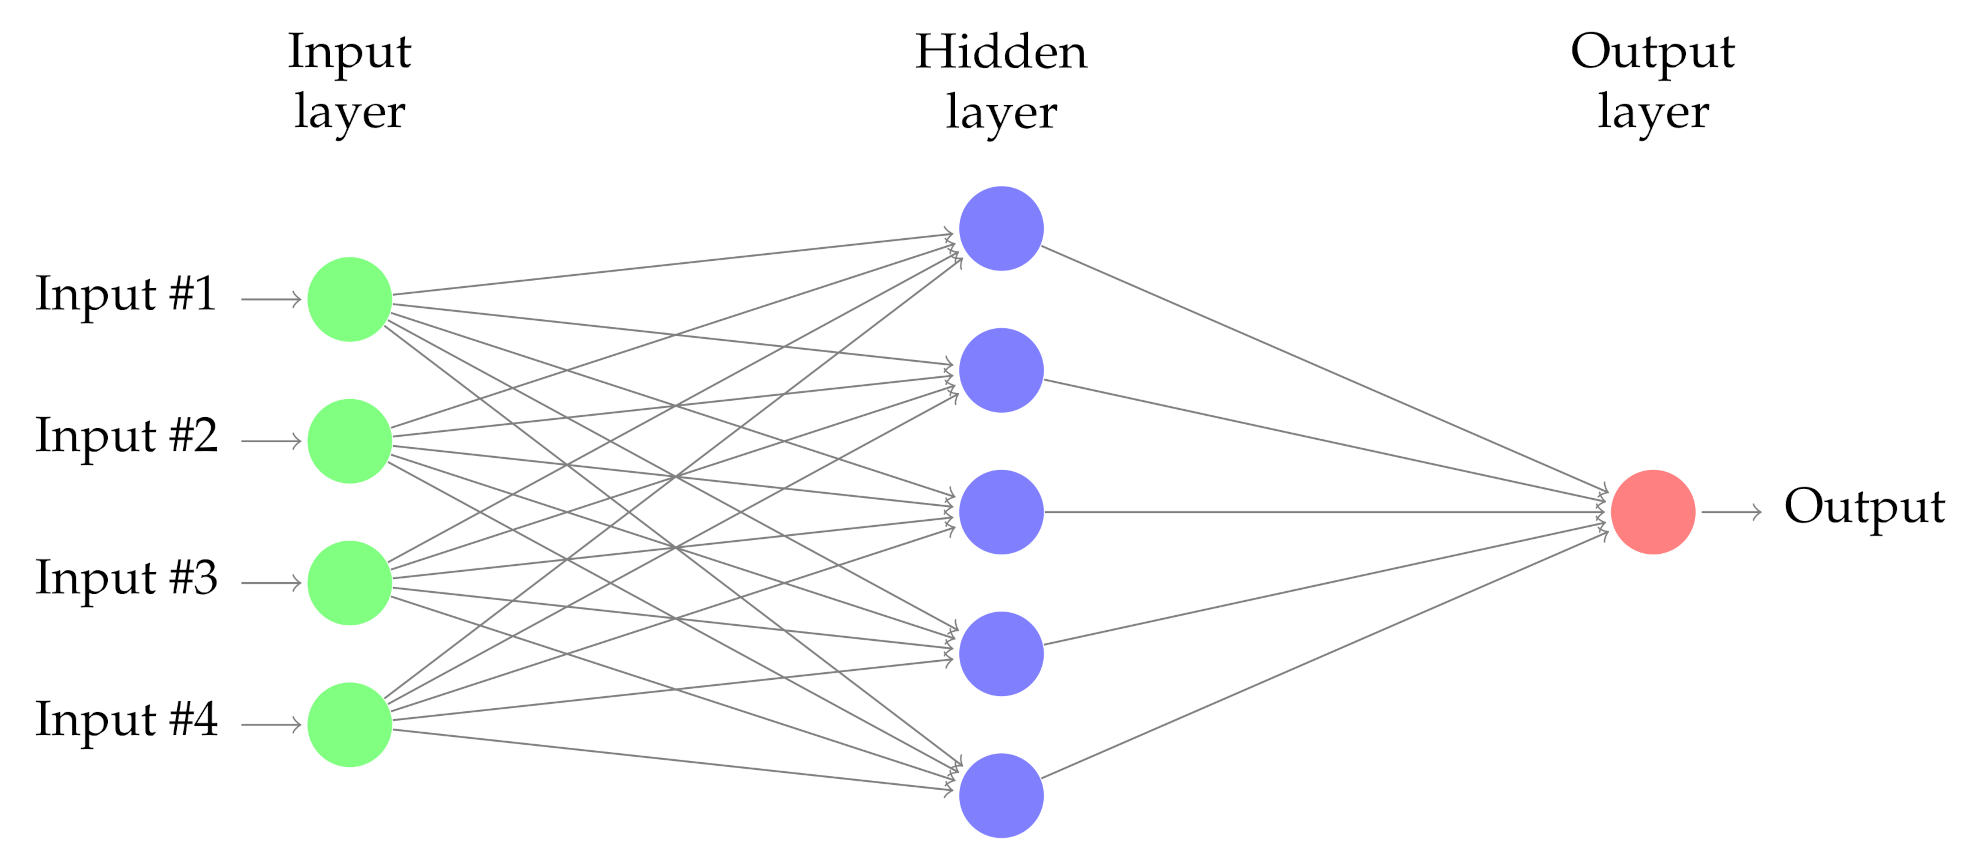
| Number of units | 74-74-74-32-32-1 |
| Number of layers | one input, 4 hidden, one output |
| Activation function | relu, sigmoid |
| Kernel initializer | uniform |
| Dropout | 0.2 |
| optimizer | adam |
| epochs | 1000 |
| batch_size | 200 |
| loss | binary_crossentropy |
| C | Gamma | Accuracy | F1 | AUC_score |
|---|---|---|---|---|
| 10 | 0.1 | 93.98% | 91.4% | 94% |
| 100 | 0.1 | 94.7% | 92.4% | 94.75% |
| 1000 | 0.1 | 95.1% | 93% | 95.2% |
| 10 | 0.01 | 97.95% | 96.95% | 97.4% |
| 100 | 0.01 | 98.38% | 97.6% | 97.97% |
| 1000 | 0.01 | 98.76% | 98.2% | 98.5% |
| Size of Dataset | Accuracy | F1 | AUC_score |
|---|---|---|---|
| 11,814 samples | 89% | 90% | 88% |
| 18,780 samples | 99.33% | 99% | 99.15% |
| 3706 | Predicted Class | ||
|---|---|---|---|
| Benign | Malware | ||
| Sensitivity | B (99.71%) | 2406 | 7 |
| Specificity | M (98.61%) | 18 | 1275 |
| 3706 | Predicted Class | ||
|---|---|---|---|
| Benign | Malware | ||
| Sensitivity | B (99.26%) | 2425 | 18 |
| Specificity | M (97.78%) | 28 | 1235 |
| The Classifier | Accuracy | F1 | AUC_score |
|---|---|---|---|
| Deep Learning | 99.33% | 99.03% | 99.15% |
| SVM | 98.76% | 98.2% | 98.5% |
| Best result for State of Art | 95.31% | 95.31 | N/A |
| Malware Detection | Accuracy |
|---|---|
| Our approach | 99.33% |
| Virus Total | 75% |
| References | Feature Used | Dataset Used | Used Classifier | Accuracy |
|---|---|---|---|---|
| Paper [2] | permissions | 398 samples 331 features | Deep Learning | 85% |
| Paper [8] | permissions, APIs, URLs | 2800 samples 237 features | Deep Learning | 90% |
| Paper [24] | permissions, APIs, Invalid certificate | 1200 samples | Deep Learning | 95.31% |
| Paper [29] | permissions, APIs | 2130 samples | Random Forest | 88.26% |
| Paper [28] | permissions | 401 samples | SVM | 85% |
| Paper [36] | permissions, APIs | 2130 samples | Random Forest | 89.91%. |
| Our previous work [9] | Permissions, Code smell, AndroBugs vulnerabilities | 1600 samples 74 features | Weka (RBF) provides best result | 83% |
| Our approach | Permissions, Code smell, AndroBugs vulnerabilities | 18,526 samples 74 features | Deep learning & SVM | 99.3% & 98.76% Respectively |
Publisher’s Note: MDPI stays neutral with regard to jurisdictional claims in published maps and institutional affiliations. |
© 2021 by the authors. Licensee MDPI, Basel, Switzerland. This article is an open access article distributed under the terms and conditions of the Creative Commons Attribution (CC BY) license (https://creativecommons.org/licenses/by/4.0/).
Share and Cite
Namrud, Z.; Kpodjedo, S.; Talhi, C.; Bali, A.; Boaye Belle, A. Deep Learning Based Android Anomaly Detection Using a Combination of Vulnerabilities Dataset. Appl. Sci. 2021, 11, 7538. https://doi.org/10.3390/app11167538
Namrud Z, Kpodjedo S, Talhi C, Bali A, Boaye Belle A. Deep Learning Based Android Anomaly Detection Using a Combination of Vulnerabilities Dataset. Applied Sciences. 2021; 11(16):7538. https://doi.org/10.3390/app11167538
Chicago/Turabian StyleNamrud, Zakeya, Sègla Kpodjedo, Chamseddine Talhi, Ahmed Bali, and Alvine Boaye Belle. 2021. "Deep Learning Based Android Anomaly Detection Using a Combination of Vulnerabilities Dataset" Applied Sciences 11, no. 16: 7538. https://doi.org/10.3390/app11167538
APA StyleNamrud, Z., Kpodjedo, S., Talhi, C., Bali, A., & Boaye Belle, A. (2021). Deep Learning Based Android Anomaly Detection Using a Combination of Vulnerabilities Dataset. Applied Sciences, 11(16), 7538. https://doi.org/10.3390/app11167538