Abstract
Tick species are considered the second leading vector of human diseases. Different ticks can transmit a variety of pathogens that cause various tick-borne diseases (TBD), such as Lyme disease. Currently, it remains a challenge to diagnose Lyme disease because of its non-specific symptoms. Rapid and accurate identification of tick species plays an important role in predicting potential disease risk for tick-bitten patients, and ensuring timely and effective treatment. Here, we developed, optimized, and tested a smartphone-based deep learning algorithm (termed “TickPhone app”) for tick identification. The deep learning model was trained by more than 2000 tick images and optimized by different parameters, including normal sizes of images, deep learning architectures, image styles, and training–testing dataset distributions. The optimized deep learning model achieved a training accuracy of ~90% and a validation accuracy of ~85%. The TickPhone app was used to identify 31 independent tick species and achieved an accuracy of 95.69%. Such a simple and easy-to-use TickPhone app showed great potential to estimate epidemiology and risk of tick-borne disease, help health care providers better predict potential disease risk for tick-bitten patients, and ultimately enable timely and effective medical treatment for patients.
1. Introduction
Tick-borne diseases have become more prevalent in the United States in recent years, posing a growing threat to public health [1,2,3]. Various ticks can carry and transmit different pathogens that can cause more than 20 diseases in humans, including Lyme disease, granulocytic anaplasmosis, babesiosis, and Borrelia mayonii infection [4,5,6]. Among these, Lyme disease represents the most frequent tick-borne disease in the United States, with at least 30,000 cases reported each year according to the Centers for Disease Control and Prevention [7]. Treatment of Lyme disease accounts for direct medical costs ranging between USD 712 million and USD 1.3 billion annually in the United States [8]. Most cases of Lyme disease are caused by Borrelia burgdorferi (B. burgdorferi) and, rarely, Borrelia mayonii, which can be transmitted by infected Ixodes scapularis ticks, commonly known as deer ticks [9]. Unfortunately, it remains a challenge to accurately diagnose Lyme disease because patients often present with non-specific symptoms [10,11]. Therefore, rapid and accurate tick identification plays an important role in: (i) estimating epidemiology and risk of tick-borne diseases [12,13], and (ii) helping health care providers better predict potential disease risk for tick-bitten patients, thus reducing unnecessary prescription of prophylactic antibiotics [9,14,15].
Tick species can be morphologically identified using standard taxonomic keys. In recent years, various materials and resources have been used to aid public health practitioners, clinicians, and the public in identifying ticks [14,15]. For instance, a Tick ID chart was used to help identify tick species that are specific to the US regions [14,15]. Some web pages also provided a free resource to aid in tick identification [14,15]. However, the effectiveness of these resources is still unknown. Usually, accurate tick identification typically requires experienced individuals in entomology and expensive equipment (e.g., a microscope). Even for health care providers in Lyme disease-endemic areas, the identification accuracy for tick species is still very low [16,17,18]. In a previous study [16], primary care providers from areas where Lyme disease is endemic, as the participants, conducted experiments to identify the common name or genus of retained ticks found in their area. Only 10.5% of the participants could identify the female black-legged tick, which is the carrier of Lyme disease, before specific training with a manual, and the percentage of identification only increased to 48.7% after the training [16]. In addition, there are some institutes and companies that offer fee-based tick identification and testing services. However, it usually takes several days to receive the test results because tick samples need to be sent to their laboratories. Therefore, there is an unmet need to develop a simple, accurate, and cost-effective approach that can be used to rapidly identify tick species by untrained individuals in the field or at the point of care.
Rapid advances in consumer electronics and mobile communication devices have revolutionized our daily lives. Ubiquitous smartphones, with their advanced computing capability and built-in functional modules (e.g., Global Positioning System, smartphone camera), provide unprecedented opportunities in remote disease diagnostics, mobile health, and public health surveillance, particularly in resource-limited settings where well-trained personnel and laboratory facilities are limited [19,20]. In recent years, deep learning has emerged as a powerful technology in various research fields, such as natural language processing, speech recognition, and especially image recognition [21,22,23,24,25]. The application of image recognition technology can be widely used in daily life and various research areas. For instance, mobile bank applications use handwritten character recognition systems to identify bank checks. In the agriculture field, Grinblat et al. used the vein morphological pattern to develop a deep learning model to identify plants [26], and Atila et al. used the EfficientNet deep learning model to classify plant leaf diseases [27]. In the medical field, Khare et al. developed a deep learning method to detect brain tumors in MRI [28], and Dai et al. developed a machine learning-based mobile application for skin cancer detection [29]. Fingerprint recognition and face recognition systems developed based on deep learning are embedded in smartphones to authenticate the user’s identity, thereby enhancing convenience [30]. The integration of deep-learning based image-recognition models with ubiquitous smartphones will lead to the development of a mobile diagnostic/detection platform, which could create a paradigm shift towards affordable and personalized health monitoring in the field or at home.
Here, for the first time, we validated and optimized a deep learning model, and developed a smartphone-based deep learning algorithm (termed “TickPhone app”) for rapid and accurate tick identification. The TickPhone app can be used by minimally trained individuals by simply taking a photograph of a tick, without the need for entomology expertise and expensive equipment. To improve the performance of the app, we enlarged the original dataset by data augmentation and optimized the deep learning model by several major parameters, such as the normal size of images, deep learning network architectures, image styles, and training–testing dataset distributions. The app was evaluated and validated for rapid and accurate tick identification by testing tick samples.
2. Methods
2.1. Development Process of TickPhone App
Figure 1 describes the framework of our TickPhone app’s development process, which primarily consists of: (i) data pool establishment, (ii) convolutional neural network development, (iii) deep learning model validation and optimization, and (iv) smartphone app development. The architecture of the convolutional neural network includes a convolution layer, a pooling layer, a flattening layer, a fully connected layer, and a softmax layer (Supplementary Materials, Figure S1). First, a data pool was created by collecting different tick photos (Figure 1i). Next, an optimized deep learning model was developed using Python Code (Version 3.7, the Python Software Foundation) in a computer platform (Processor: Intel (R) Core (TM) i7-8700K CPU @ 3.70 GHz, 3696 MHz, 6 Core(s), 12 Logical Processors, Chip Type: Intel (R) UHD Graphics Family and Total Available Graphics Memory: 16,430 MB) (Figure 1ii,iii). Then, the smartphone app was designed and developed by transferring the optimized deep learning model to the TensorFlow lite model (Figure 1iv). The graphical user interface (Figure S2A) of the app was implemented in Java using the standard Android Software Development Kit (SDK) (Version 9 API level 28). The test result can be uploaded to a remote server or website, enabling spatiotemporal mapping of tick species (Figure S2B).
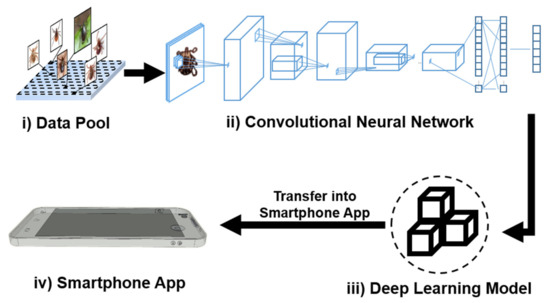
Figure 1.
Development process of our TickPhone app using the deep learning technique. It includes four major steps: (i) establishment of a data pool, (ii) development of a convolutional neural network, (iii) development and optimization of a deep learning model, and (iv) development a smartphone app.
2.2. Dataset Description
Various tick species can carry different pathogens that cause a variety of human diseases. For instance, deer ticks can transmit pathogens that can cause Lyme disease, one of the most dangerous tick-borne diseases [31]. As an application demonstration of our TickPhone app, we mainly focused on identifying three types of common ticks (Figure S3) in this study, which are: (i) deer tick (blacklegged tick, Ixodes scapularis), (ii) lone star tick (Amblyomma americanum), and (iii) dog tick (Dermacentor variabilis). The training and testing dataset used in this study mainly consists of: (i) photos provided by the Connecticut Veterinary Medical Diagnostic Laboratory (CVMDL) at the University of Connecticut, (ii) photos manually taken by smartphones, and (iii) images obtained from a Google image search. To further enlarge the dataset and reduce underfitting in the model training process, data augmentation technologies, such as rotation, height shift, width shift, shear, zoom, and horizontal flip (Figure S4), were applied to construct a dataset of more than 2000 images.
2.3. Deep Learning Model Optimization
The LeNet network was used as our deep learning architecture in this study. To develop a deep learning model for accurate tick identification, we optimized the following parameters: (i) normal size of the images, (ii) deep learning architectures, (iii) image styles, and (iv) training and testing dataset distributions (Figure 2). First, all of the images were normalized to the same size before importing into the LeNet architecture. Second, different numbers of the convolution and pool layers were set for the LeNet network architecture. The deeper the architecture, the more complicated its fit classification problem. Third, different image styles were tested and compared in our study. Usually, RGB (red, green, and blue) images provide more image details (e.g., red, green, and blue channels), whereas gray-scaled images block the color information of the background noise. The testing data was used to evaluate and validate the performance of the model. The model was evaluated by different training and testing data distributions: (i) 90–10%, (ii) 80–20%, (iii) 70–30%, and (iv) 60–40% (Figure 2).
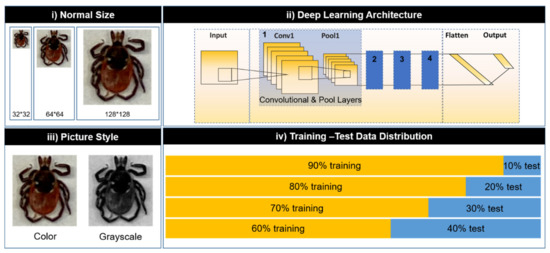
Figure 2.
Optimization of the deep learning model by different parameters: (i) normal size of images, (ii) deep learning network architectures, (iii) image styles, and (iv) training–testing data set distributions.
In this study, we generated a total of 96 experimental configurations (3 normal sizes × 4 deep learning network architectures × 2 image styles × 4 types of training and testing dataset distributions), which varied in terms of the following parameters (Figure 2): normal sizes (32 × 32, 64 × 64, and 128 × 128); deep learning network architectures (1–4 sets of convolution and pool layers of LeNet); image styles (color scale and grayscale); and training–testing dataset distributions (90–10%, 80–20%, 70–30%, and 60–40%). In this study, the notation of “Image Normal Size: Deep Learning Network Architecture (number of sets of LeNet convolution and pool layers): Image Style: Training–Testing Dataset Distribution (percentage)” was used to represent particular experiments. For example, to refer to the experiment using color pictures with a size of 64 × 64 trained by two convolution and pool layers on a training–testing dataset distribution of 90–10%, we described it with the notation “64: 2: Color: 90–10”. In addition, a support vector machine (SVM) based on Sklearn was developed for image classification. The image classification method based on Sklearn’s SVM was applied to the same dataset for comparison purposes. The method was developed using the optimized parameters selected by the CNN and the final accuracy was also compared with the accuracy of the CNN method.
2.4. Deep Learning Model Evaluation
The optimized deep learning model was chosen from the 96 deep learning models created by the Keras Python library. All of the experiments were replicated three times. The final training and testing accuracy of each replicate for 60 epochs were recorded and analyzed. The gap between the final training–testing accuracies of each replicate indicates the fitting performance of the deep learning algorithms. The larger the gap, the higher the overfitting of the deep learning algorithms. In this study, a harmonic mean of six accuracies (training/testing accuracies × 3 replicates) was used as a score to evaluate the algorithm’s performance. The harmonic mean has been used to mitigate the impacts of large outliers and aggravate the impacts of small ones [32]. Thus, a higher score indicates that the model has higher accuracy and better stability.
2.5. TickPhone App Design
The optimized deep learning model was transferred to a TensorFlow Lite model to develop a smartphone app. Figure 3A showed the design process of our smartphone-based deep learning algorithm for tick identification. It mainly contains three layers: (i) a data layer (tick photos), (ii) a decision layer (deep learning model), and (iii) a user layer (user interface). The optimized deep learning model-based application was developed using the Android studio software (Google Inc.) with the programming language Java (Figure 3B). The app consists of three major modules: (i) an imaging module, which allows one to take tick photos and save them in a smartphone; (ii) a function module, which provides a command structure and graphical user interface to allow one to choose different functions (e.g., camera imaging, tick identification, and mapping); and (iii) a result display module, which reports test results and provides tick photos as references (Figure 3B). In this study, the optimized deep learning model was first trained from pre-prepared images and then transferred into a model that can be used by smartphones. To evaluate the performance of our TickPhone app, 31 independent adult tick species provided by the CVMDL of the University of Connecticut were tested by different smartphone modules (e.g., Samsung Galaxy S6, Huawei P20 Pro).
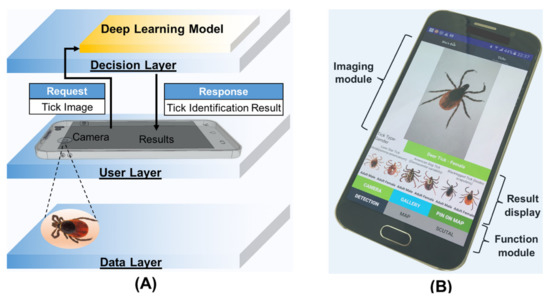
Figure 3.
Design and development of our TickPhone app using a deep learning model. (A) The design scheme of the TickPhone app for tick identification. It includes: (i) a data layer (tick photos), (ii) a user layer (user interface), and (iii) a decision layer (deep learning model). (B) A photograph of the smartphone with our TickPhone app that includes three modules: (i) an imaging module, (ii) a result display module, and (iii) a function module.
3. Results and Discussion
3.1. Deep Learning Network
In this study, we used a convolutional neural network to classify tick images because of its superior performance in image classification [33,34]. There are different convolutional neural network architectures widely used in previous research [21,22,23,35], such as LeNet, AlexNet, VGG Net, GoogleNet, and ResNet. Here, the LeNet network was used as our deep learning architecture due to its simplicity and ease of implementation [34,36]. The overall network architecture design of this study is shown in Figure S1. The back view of the ticks was used as the main identification information to distinguish ticks in our study. Figure 4A shows a photograph of a female deer tick taken using our smartphone. Figure 4B illustrates the filtered output images of the deer tick (Figure 4A) in 20 activations of the first convolutional layer (64: 2: Color: 80–20), which demonstrates that our deep learning model can efficiently activate against the morphologic characters of the tick samples.

Figure 4.
Tick photo and its visualization of activations. (A) A photograph of a female tick that was taken using our smartphone. (B) Visualization of activation in the first convolution layer of 64: 2: Color: 80–20, demonstrating that the model has learned to efficiently activate against the morphologic characters of the female tick (A).
3.2. Parameter Optimization of Deep Learning Model
We used ternary phase diagrams to optimize four major parameters of our deep learning algorithms, such as the normal size of images, deep learning network architectures, image styles, and training–testing dataset distributions. In the ternary phase diagram of color pictures (Figure 5A), the 128: 2: Color: 80–20 and 64: 3: Color: 80–20 showed the lowest performance score (~0.2) and the highest performance score (~0.9), respectively. For the normal size of the pictures, the performance score at the normal size of 128 was much lower than that at the normal size of 64 or 32, which may be attributed to reduced image quality due to enlargement. For the deep learning network architecture, the best performance score was obtained at around three sets of convolution and max-pooling layers. Generally, deep learning models can build better features than shallow models because of intermediate hidden layers. As shown in Figure 5A, the performance score of the shallow model with one set of convolutional and max-pooling layers was lower than that of deeper models with several sets of convolutional and max-pooling layers.
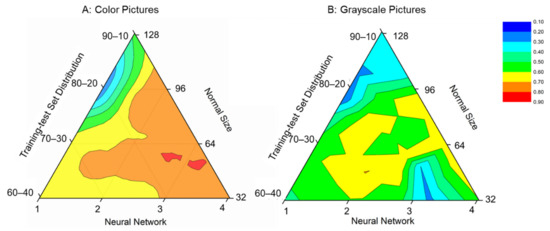
Figure 5.
Ternary phase diagram of performance scores with various network layers, training–test distributions, and picture normal sizes: (A) color pictures and (B) grayscale pictures.
In the ternary phase diagram of the grayscale pictures (Figure 5B), the 128: 2: Grayscale: 80–20 (128 × 128 sizes of grayscale pictures trained by two convolution and pool layers on a training–testing dataset distribution of 80–20%) had the lowest performance score (<0.2), whereas the 64: 2: Grayscale: 70–30 (64 × 64 size grayscale pictures trained by two convolution and pool layers on a training–testing dataset distribution of 70–30%) had the highest (~0.7). Compared with the color pictures, the performance score trained by the grayscale images was much lower, which may be attributed to information loss of images during the transfer from color to grayscale images. As shown in Figure 5B, the grayscale pictures cannot improve the accuracy due to the loss of some important tick information. Therefore, we chose the 64: 3: Color: 80–20 as our optimized deep learning model in our study.
3.3. Training and Validation Accuracy
In deep learning algorithms, both overfitting and underfitting can result in poor performance. As shown in Figure 6, both training and validation accuracies improve with the increase in the number of epochs, which showed that no underfitting occurred in our optimized deep learning algorithm. In addition, there was no significant difference between the training and validation accuracies, which demonstrates that there was no overfitting for our optimized deep learning model. In our study, we chose the 60th epoch to optimize our deep learning algorithm because the increase in both training and validation accuracies was not significant and tended to remain relatively stable. With our optimized deep learning model, 64: 3: Color: 80–20, at the 60th epoch, we achieved a validation accuracy of ~90% and a training accuracy of ~85% (Figure 6). In this study, the validation accuracy of the SVM method developed with the same image set and the same parameters, i.e., colored tick images, 80% training dataset, and 20% validation dataset, only reached 46.94%. This demonstrates that the deep learning model with optimized parameters in this study has a significant advantage in tick identification compared to the SVM method. As shown in Figure 6, although the training accuracy and validation accuracy were close throughout the training process, the validation accuracy was slightly higher than the training accuracy at the end, which is because the dropouts applied to the model to increase the model’s robustness led to a slightly higher validation accuracy than training accuracy. In the future, with the increase in tick numbers in the database, the bias of the training data and validation data will decrease, leading to higher accuracies.
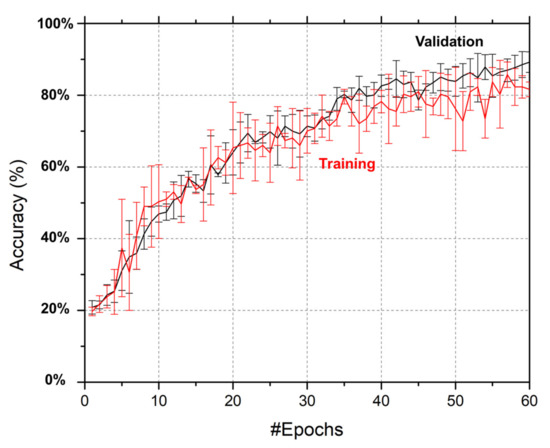
Figure 6.
Accuracy curves for training and validation of our optimized deep learning model. Error bars represent the standard deviations of three replicate experiments using the same parameters, 64: 3: Color: 80–20.
3.4. Tick Identification with TickPhone App
To evaluate and validate the performance of our TickPhone app, we tested 31 adult tick specimens as independent samples. Each tick was photographed three times using a smartphone. For comparison, all of these ticks were also identified by trained professionals at the CVMDL, a fully accredited diagnostic laboratory at the University of Connecticut. Table S1 summarizes the test results of both our TickPhone app and trained professionals. The test results show that our TickPhone app achieved recognition accuracies of 95.69% and 96.77% using the Samsung Galaxy S6 and Huawei P20 Pro, respectively. In a previous study [16], primary care providers were only able to achieve identification accuracies of 10.5%, 46.1%, and 57.9% for adult female blacklegged tick (engorged), dog tick, and lone star tick, respectively. Thus, our TickPhone app shows a much better identification accuracy compared to the previous method. As shown in Figure S5, misidentification of ticks was mainly due to the poor quality of the tick photos, caused by glare or lack of focus. Therefore, it is crucial to take high-quality tick photos with the smartphone to achieve highly accurate tick identification.
Further, we used receiver-operating characteristics (ROC) curve analysis to evaluate the detection sensitivity and specificity of our approach [37,38]. As shown in Figure 7, we achieved an average area under the curve (AUC) of ~93% for all three types of tick species. In particular, our TickPhone app can identify adult female deer ticks and adult male deer ticks with an AUC of 98% and 96%, respectively. In our testing, there were relatively low AUCs (86% for males and 89% for females) for lone star tick identification, which can be attributed to the limited number of lone star tick photos available to train our deep learning model. The identification accuracy can be further improved in the future with the addition of more lone star tick photos. Therefore, all of these results showed that our TickPhone app is a simple, reliable, and accurate approach for rapidly identifying tick species without the need for well-trained personnel and expensive equipment.
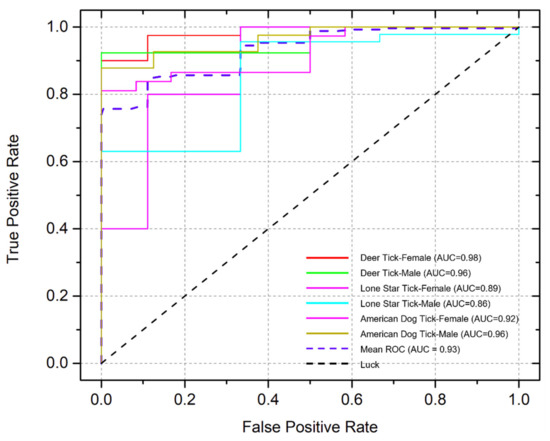
Figure 7.
Receiver-operating characteristic curve analysis of identification of three common tick species, including female deer ticks, male deer ticks, female lone star ticks, male lone star ticks, female American dog ticks, and male American dog ticks.
4. Conclusions
In this study, we optimized and validated a deep learning algorithm, and developed a smartphone app, to rapidly identify tick species. The optimized deep learning model was developed using a convolutional neural network and converted to a TensorFlow Lite model for app development. The app allows an untrained individual to perform rapid and accurate tick identification by simply taking a photo of the tick using a smartphone, thus eliminating the need for entomological knowledge and expensive equipment. Our study showed that the optimized deep learning model can achieve a training accuracy of ~90% and a validation accuracy of ~85%. In the independent test with 31 tick specimens, our TickPhone app achieved an identification accuracy of 95.69%. In the receiver-operating characteristics curve analysis, we identified adult female deer ticks and adult male deer ticks with an AUC of 98% and 96%, respectively. Such a simple, rapid, and reliable approach has the potential to be used for tick identification in the field, at home, or at the point of need. In future work, deeper and new deep learning models (MobileNet, Efficient-B0, SqueezeNet) [39,40,41] will be used to improve the accuracy of the models, and backdoor or data poisoning methods will be adapted to improve the models’ security [42].
Supplementary Materials
The following are available online at https://www.mdpi.com/article/10.3390/app11167355/s1, Figure S1. The architecture of the conventional neutral network developed for tick identification; Figure S2. Interfaces of our TickPhone app. (A) Tick identification, and (B) spatiotemporal mapping of tick identification results; Figure S3. Three types of common ticks (e.g., deer tick, dog tick, and lone star tick) and their transmitting tick-borne diseases; Figure S4. Data augmentation from original pictures through different methods: (i) rotation with 30% range, (ii) height shift with 30% range, (iii) width shift with 30% range, (iv) shear with 30% range, (v) zoom with 30% range, and (vi) horizontal flip; Figure S5. Examples of the poor-quality tick photos caused by glare (A) or being out of focus (B); Table S1. Comparison of tick identification results obtained by our TickPhone app and provided by the Connecticut Veterinary Medical Diagnostic Laboratory.
Author Contributions
Z.X. and C.L. conceived the experiments, research goals, and smartphone application design. Z.X., X.D. and K.Y. performed the experiments. Z.X. and Z.L. developed the smartphone application. J.A.S., M.B.S. and H.A.M. collected and recognized field samples. Z.X., X.D., K.Y. and C.L. wrote the manuscript. All authors reviewed the manuscript. All authors have read and agreed to the published version of the manuscript.
Funding
This research was supported by startup funds at the University of Connecticut Health Center.
Institutional Review Board Statement
Not applicable.
Informed Consent Statement
Not applicable.
Data Availability Statement
Data available from the authors upon a reasonable request.
Conflicts of Interest
The authors declare no conflict of interest.
References
- Sonenshine, D.E. Range Expansion of Tick Disease Vectors in North America: Implications for Spread of Tick-Borne Disease. Int. J. Environ. Res. Public Health 2018, 15, 478. [Google Scholar] [CrossRef] [Green Version]
- Eisen, R.J.; Kugeler, K.; Eisen, L.; Beard, C.B.; Paddock, C.D. Tick-Borne Zoonoses in the United States: Persistent and Emerging Threats to Human Health. ILAR J. 2017, 58, 319–335. [Google Scholar] [CrossRef] [Green Version]
- Hook, S.A.; Nelson, C.A.; Mead, P.S. U.S. public’s experience with ticks and tick-borne diseases: Results from national HealthStyles surveys. Ticks Tick-Borne Dis. 2015, 6, 483–488. [Google Scholar] [CrossRef]
- Michelet, L.; Joncour, G.; Devillers, E.; Torina, A.; Vayssier-Taussat, M.; Bonnet, S.I.; Moutailler, S. Tick species, tick-borne pathogens and symbionts in an insular environment off the coast of Western France. Ticks Tick-Borne Dis. 2016, 7, 1109–1115. [Google Scholar] [CrossRef] [PubMed]
- Davies, S.; Abdullah, S.; Helps, C.; Tasker, S.; Newbury, H.; Wall, R. Prevalence of ticks and tick-borne pathogens: Babesia and Borrelia species in ticks infesting cats of Great Britain. Vet. Parasitol. 2017, 244, 129–135. [Google Scholar] [CrossRef] [Green Version]
- Estrada-Peña, A.; Roura, X.; Sainz, A.; Miró, G.; Solano-Gallego, L. Species of ticks and carried pathogens in owned dogs in Spain: Results of a one-year national survey. Ticks Tick-Borne Dis. 2017, 8, 443–452. [Google Scholar] [CrossRef] [PubMed]
- Centers for Disease Control and Prevention. Lyme Disease Data Tables: Historical Data Reported Cases of Lyme Disease by State or Locality, 2007–2017. Available online: https://www.cdc.gov/lyme/stats/tables.html?CDC_AA_refVal=https%3A%2F%2Fwww.cdc.gov%2Flyme%2Fstats%2Fchartstables%2Freportedcases_statelocality.html (accessed on 8 August 2020).
- Adrion, E.R.; Aucott, J.; Lemke, K.W.; Weiner, J.P. Health Care Costs, Utilization and Patterns of Care following Lyme Disease. PLoS ONE 2015, 10, e0116767. [Google Scholar] [CrossRef]
- Nadelman, R.B.; Nowakowski, J.; Fish, D.; Falco, R.C.; Freeman, K.; McKenna, D.; Welch, P.; Marcus, R.; Agüero-Rosenfeld, M.E.; Dennis, D.T.; et al. Prophylaxis with Single-Dose Doxycycline for the Prevention of Lyme Disease after anIxodes scapularisTick Bite. N. Engl. J. Med. 2001, 345, 79–84. [Google Scholar] [CrossRef] [PubMed]
- Delaney, M. Treating Lyme disease: When will science catch up? Pharm. J. 2016, 14, 34. [Google Scholar] [CrossRef]
- Marques, A.R. Laboratory Diagnosis of Lyme Disease: Advances and Challenges. Infect. Dis. Clin. N. Am. 2015, 29, 295–307. [Google Scholar] [CrossRef] [Green Version]
- Nicholson, M.C.; Mather, T.N. Methods for Evaluating Lyme Disease Risks Using Geographic Information Systems and Geospatial Analysis. J. Med. Entomol. 1996, 33, 711–720. [Google Scholar] [CrossRef]
- Ostfeld, R.S.; Levi, T.; Keesing, F.; Oggenfuss, K.; Canham, C.D. Tick-borne disease risk in a forest food web. Ecology 2018, 99, 1562–1573. [Google Scholar] [CrossRef]
- University of Rhode Island TickEncounter Resource Center. TickSpotters. Available online: https://tickencounter.org/tickspotters/submit_form (accessed on 8 August 2020).
- University of Rhode Island TickEncounter Resource Center. Tick Identification Chart. Available online: https://tickencounter.org/tick_identification (accessed on 8 August 2020).
- Butler, A.D.; Carlson, M.L.; Nelson, C.A. Use of a tick-borne disease manual increases accuracy of tick identification among primary care providers in Lyme disease endemic areas. Ticks Tick-Borne Dis. 2017, 8, 262–265. [Google Scholar] [CrossRef]
- Falco, R.C.; Fish, D.; D’Amico, V. Accuracy of tick identification in a Lyme disease endemic area. J. Am. Med. Assoc. 1998, 280, 602–603. [Google Scholar] [CrossRef] [PubMed]
- Koffi, J.K.; Savage, J.; Thivierge, K.; Lindsay, L.R.; Bouchard, C.; Pelcat, Y.; Ogden, N.H. Evaluating the submission of digital images as a method of surveillance for Ixodes scapularis ticks. Parasitology 2017, 144, 877–883. [Google Scholar] [CrossRef] [PubMed] [Green Version]
- Erickson, D.; O’Dell, D.; Jiang, L.; Oncescu, V.; Gumus, A.; Lee, S.; Mancuso, M.; Mehta, S. Smartphone technology can be transformative to the deployment of lab-on-chip diagnostics. Lab Chip 2014, 14, 3159–3164. [Google Scholar] [CrossRef] [PubMed] [Green Version]
- Ding, X.; Mauk, M.G.; Yin, K.; Kadimisetty, K.; Liu, C. Interfacing Pathogen Detection with Smartphones for Point-of-Care Applications. Anal. Chem. 2018, 91, 655–672. [Google Scholar] [CrossRef]
- Sun, Y.; Liang, D.; Wang, X.; Tang, X. DeepID3: Face Recognition with Very Deep Neural Networks. arXiv 2015, arXiv:1502.00873. [Google Scholar]
- Zhong, Z.; Jin, L.; Xie, Z. High performance offline handwritten Chinese character recognition using GoogLeNet and directional feature maps. In Proceedings of the 2015 13th International Conference on Document Analysis and Recognition (ICDAR), Tunis, Tunisia, 23–26 August 2015; pp. 846–850. [Google Scholar] [CrossRef] [Green Version]
- He, K.; Zhang, X.; Ren, S.; Sun, J. Deep Residual Learning for Image Recognition. In Proceedings of the 2017 IEEE 2nd Information Technology, Networking, Electronic and Automation Control Conference (ITNEC), Chengdu, China, 15–17 December 2017; pp. 770–778. [Google Scholar] [CrossRef] [Green Version]
- Dourado, C.M.J.M.; Da Silva, S.P.P.; Da Nobrega, R.V.M.; Filho, P.P.R.; Muhammad, K.; De Albuquerque, V.H.C. An Open IoHT-Based Deep Learning Framework for Online Medical Image Recognition. IEEE J. Sel. Areas Commun. 2020, 39, 541–548. [Google Scholar] [CrossRef]
- Quiroz, I.; Alférez, G.H. Image recognition of Legacy blueberries in a Chilean smart farm through deep learning. Comput. Electron. Agric. 2020, 168, 105044. [Google Scholar] [CrossRef]
- Grinblat, G.L.; Uzal, L.C.; Larese, M.G.; Granitto, P. Deep learning for plant identification using vein morphological patterns. Comput. Electron. Agric. 2016, 127, 418–424. [Google Scholar] [CrossRef] [Green Version]
- Atila, Ü.; Uçar, M.; Akyol, K.; Uçar, E. Plant leaf disease classification using EfficientNet deep learning model. Ecol. Inform. 2021, 61, 101182. [Google Scholar] [CrossRef]
- Khare, S.; Gupta, N.; Srivastava, V. Optimization technique, curve fitting and machine learning used to detect Brain Tumor in MRI. In Proceedings of the IEEE International Conference on Computer Communication and Systems ICCCS14, Chennai, India, 20–21 February 2014; pp. 254–259. [Google Scholar] [CrossRef]
- Dai, X.; Spasic, I.; Meyer, B.; Chapman, S.; Andres, F. Machine Learning on Mobile: An On-device Inference App for Skin Cancer Detection. In Proceedings of the 2019 Fourth International Conference on Fog and Mobile Edge Computing (FMEC), Rome, Italy, 10–13 June 2019; pp. 301–305. [Google Scholar] [CrossRef]
- Liu, Q.; Zhang, N.; Yang, W.; Wang, S.; Cui, Z.; Chen, X.; Chen, L. A review of image recognition with deep convolutional neural network. In International Conference on Intelligent Computing; Springer: Cham, Switzerland, 2017; pp. 69–80. [Google Scholar] [CrossRef]
- Holzmann, H. Diagnosis of tick-borne encephalitis. Vaccine 2003, 21, S36–S40. [Google Scholar] [CrossRef]
- Berlin, J.; Motro, A. Database Schema Matching Using Machine Learning with Feature Selection. In International Conference on Advanced Information Systems Engineering; Springer: Berlin/Heidelberg, Germany, 2013; pp. 452–466. [Google Scholar] [CrossRef]
- Socher, R.; Huval, B.; Bhat, B.; Manning, C.D.; Ng, A.Y. Convolutional-recursive deep learning for 3D object classification. Adv. Neural Inf. Process. Syst. 2012, 25, 656–664. [Google Scholar]
- El-Sawy, A.; El-Bakry, H.; Loey, M. CNN for Handwritten Arabic Digits Recognition Based on LeNet-5. In Advances in Intelligent Systems and Computing; Springer: Cham, Switzerland, 2016; pp. 566–575. [Google Scholar] [CrossRef] [Green Version]
- Iandola, F.N.; Han, S.; Moskewicz, M.W.; Ashraf, K.; Dally, W.J.; Keutzer, K. SqueezeNet: AlexNet-level accuracy with 50× fewer parameters and <0.5MB model size. arXiv 2016, arXiv:1602.07360. [Google Scholar]
- Al-Jawfi, R. Handwriting Arabic character recognition lenet using neural network. Int. Arab. J. Inf. Technol. 2009, 6, 304–309. [Google Scholar]
- Hand, D.J.; Till, R.J. A Simple Generalisation of the Area under the ROC Curve for Multiple Class Classification Problems. Mach. Learn. 2001, 45, 171–186. [Google Scholar] [CrossRef]
- Horng, M.-H. Multi-class support vector machine for classification of the ultrasonic images of supraspinatus. Expert Syst. Appl. 2009, 36, 8124–8133. [Google Scholar] [CrossRef]
- Li, Y.; Huang, H.; Xie, Q.; Yao, L.; Chen, Q. Research on a Surface Defect Detection Algorithm Based on MobileNet-SSD. Appl. Sci. 2018, 8, 1678. [Google Scholar] [CrossRef] [Green Version]
- Xiong, D.; Huang, K.; Jiang, H.; Li, B.; Chen, S.; Jiang, X. IdleSR: Efficient Super-Resolution Network with Multi-scale IdleBlocks. In European Conference on Computer Vision; Springer: Cham, Switzerland, 2020; pp. 136–151. [Google Scholar] [CrossRef]
- Ucar, F.; Korkmaz, D. COVIDiagnosis-Net: Deep Bayes-SqueezeNet based diagnosis of the coronavirus disease 2019 (COVID-19) from X-ray images. Med. Hypotheses 2020, 140, 109761. [Google Scholar] [CrossRef]
- Kwon, H.; Yoon, H.; Park, K.-W. Multi-Targeted Backdoor: Indentifying Backdoor Attack for Multiple Deep Neural Networks. IEICE Trans. Inf. Syst. 2020, 103, 883–887. [Google Scholar] [CrossRef]
Publisher’s Note: MDPI stays neutral with regard to jurisdictional claims in published maps and institutional affiliations. |
© 2021 by the authors. Licensee MDPI, Basel, Switzerland. This article is an open access article distributed under the terms and conditions of the Creative Commons Attribution (CC BY) license (https://creativecommons.org/licenses/by/4.0/).