Abstract
This paper elaborates the cone–hemispherical gypsum particle breakages under normal contact with different particle shape parameters (contact diameter d, cone angle θ and sphere diameter D) and proposes a simple quantitative approach to discriminate breakage modes. The effects of the particle shape parameters on particle breakage are investigated through analyzing breakage processes, breakage modes and force–displacement curves. Three breakage modes are formed during the breakage experiments: peeling, peeling–splitting and splitting, corresponding to three different normal force–displacement curves. The formation of a conical core is deemed as the precondition for particle splitting. The particle breakage mode transfers from peeling to splitting with the increase in contact diameter d and cone angle θ, but a decrease in sphere diameter D. The critical normal force Fcr is positively linearly related to contact diameter d and cone angle θ, but the relationship between Fcr and sphere diameter D heavily depends on the breakage mode. Furthermore, the critical contact diameter dcr described by cone angle θ and sphere diameter D is proposed to discriminate breakage modes of the cone–hemispherical gypsum particles.
1. Introduction
Particle breakage of granular materials usually occurs at high stress levels in high earth–rockfill dams [1]. Large deformation caused by rapid brittle breakage of particles usually leads to dam instability, even failure, causing serious accidents [2,3,4,5]. Therefore, considerable effort has been devoted to particle breakage, as well as its affecting factors, and significant advancements have been achieved in recent years [6,7,8]. Mostly, the particle was considered to be an ideal sphere because the spherical particle has greater crushing strength [9]. Actually, almost all granular particles in nature exist in a non-spherical form. Compared with spherical particles, non-spherical particles need a higher coordination number to maintain a stable configuration due to a decrease in the number of strong force chains in numerical simulation [10]. Many experimental studies demonstrated that particle breakage could be significantly affected by the shape anisotropy of non-spherical particles [6,10,11].
Particle shape parameters, such as sphericity, roundness, angularity, irregularity, were presented to describe particle shape [9,12]. A lower degree of sphericity and higher flakiness index led to lower resistance to particle breakage [13,14,15]. Besides, the flat and elongated ratio and angularity index were recommended to describe the particle shape of the coarse-grained soil [16,17,18]. Zhu et al. [19] calculated the angularity index to eliminate the influence of particle size on the angularity of coarse aggregate. Wu et al. [20] proposed particles’ circularity value through image processing and analysis to describe the characteristics of particle shape. Jiang et al. presented a boundary–spheropolygon element method to simulate the interaction of particles and found the decrease in the circularity of particles increases the heterogeneity of the force chain and causes high tensile stress areas in certain particles, which would lead to more breakage and showed lower breakage resistance in the granular material [15].
Meanwhile, particle size has a great influence on particle breakage. With the increase in particle size, the characteristic stress of a single particle decreases [21,22,23,24,25,26,27]. The possible explanation is that the increase in particle size increases the probability of larger flaws being present [27]. The characteristic stress of coral sand at the failure state and particle size has an exponential relationship under a single particle compression test [21]. Furthermore, the studies of non-spherical particle breakage are mostly for natural materials, and the quantitative analysis of particle shape on particle breakage is still scarce.
This paper investigated the particle breakage of a kind of shape-anisotropic particle under normal load. The particles were molded as the cone–hemisphere with different sphere diameters, cone angles and contact diameters. The influences of these variables on particle breakage mode were elaborated by analyzing breakage processes, breakage modes and force–displacement curves. Furthermore, the breakage mode discrimination of cone–hemispherical gypsum based on particle shape was proposed. To eliminate the effect of fissures, high-strength gypsum was used as the molding material in this study due to its isotropy, flawlessness and ease of molding.
2. Material and Experimental Method
2.1. Experimental Material
Compared with natural materials with fissures and joints, high-strength gypsum is isotropic, flawless and easy to shape. In order to study the physical and mechanical parameters of high-strength gypsum, the cylinder samples with strain gauges are subjected to a uniaxial compression test, and the compressive strength, elastic modulus and poisson ratio can be calculated. The tensile strength of high-strength gypsum can be calculated by the splitting test. The parameters of high-strength gypsum and natural materials (sandstone, limestone and slate [28]) were listed in Table 1. The high-strength spherical gypsum also showed similar breakage characteristics with natural materials (sandstone, limestone and slate) under normal contact. The breakage modes of gypsum and these three natural material spherical particles (sphere diameter = 50 mm) are similar, as shown in Figure 1. Both gypsum and natural material particles presented as a local crushing at the contact area and then broke into two or three pieces as a whole. The reason for spherical gypsum being crushed into three pieces instead of two pieces is that particles with lower strength are more likely to crush into more pieces [28]. Normal force–displacement curves (see Figure 2) also show similarities. The normal forces of all particles increase with increasing displacements in the initial stage, which corresponds to the local crushing at the contact; the normal forces then drop sharply. At this stage, the spherical particles broke into two pieces. Then, the normal forces continued to increase as the broken pieces supported loads continuously and broke into more pieces. The first peak value of the normal force Fcr is of great significance as it is the characteristic critical force for the overall crushing of spherical particles [28]. The critical forces of four spherical particles and their tensile strengths have a positive correlation, as shown in Figure 3. Hence, high-strength gypsum could be used in this study as an alternative to natural material for molding cone–hemisphere particles.

Table 1.
Properties of high-strength gypsum and natural materials.
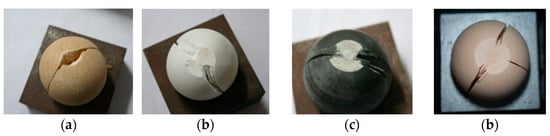
Figure 1.
Comparison of breakage modes between natural and gypsum particles: (a) sandstone; (b) limestone; (c) slate; (d) gypsum.
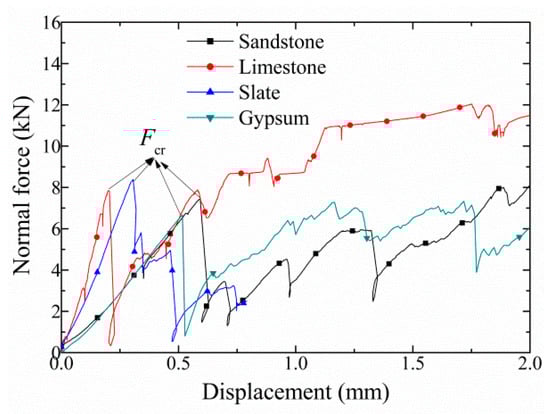
Figure 2.
Normal force–displacement curves of four spherical particles.
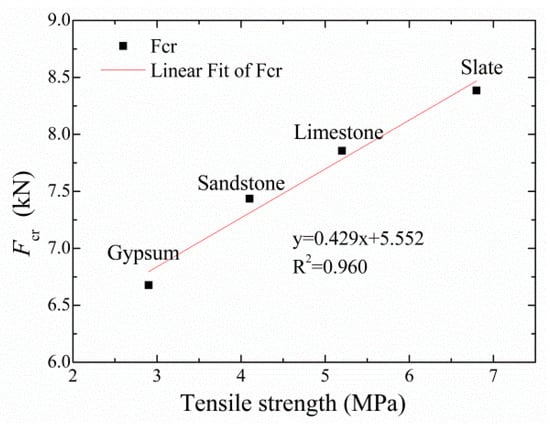
Figure 3.
Relationship between critical normal force Fcr and the tensile strength.
2.2. Experiment Scheme
Although it is worth studying the breakage of shape-anisotropic non-spherical particles, the particle shape should be simple enough. For single-particle contact, the impact of particle shape on particle breakage is mainly at the contact point because crushing failure is sensitive to the relative curvature of the contact interfaces [27]. The particle shape is designed as a cone–hemisphere in this study (see Figure 4). Twenty-three group normal contact tests of cone–hemispherical particles with different contact diameters, cone angles and sphere diameters were carried out, as listed in Table 2. Each group test was repeated 10 times to minimize the random error. The rock rheological testing system (see Figure 5) was used for normal contact experiments, which can load the rock in two ways: force control or displacement control. The measurement and control precision for force and deformation are 5 N and 0.001 mm, respectively. The data acquisition frequency is approximately 1 Hz. The steel groove bases (see Figure 5c) are designed to support particles. A high-definition camera was fixed in front of the testing system to capture the particle breakage process per 10 s. The displacement control loading mode with a constant loading velocity of 0.002 mm/s was adopted. For a sphere diameter of 30 mm or a sphere diameter of 50 mm and a cone angle of 120°, the predetermined displacements are 1.5 mm, or else the predetermined displacement is 2 mm, to make sure particles fully crush.
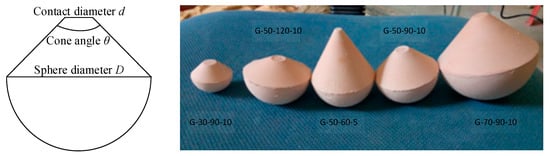
Figure 4.
Cone–hemispherical particle.
Table 2.
Particle groups used in the experiments.
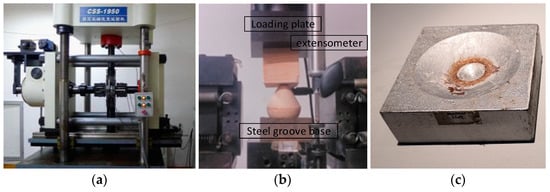
Figure 5.
Experimental instruments and normal contact: (a) rock rheological testing system; (b) normal contact; (c) steel groove base.
3. Results
3.1. Breakage Process and Mode
Particle breakage modes vary with particle shape and external conditions [29]. For cone–hemispherical particles, the particle breakage undergoes two processes under external force, which is similar to the work of Tapias [30]. A local crushing occurred at the contact area when the normal force was relatively small. With increasing normal force, the particle breakages turn out to be three types: peeling, peeling–splitting and splitting, as shown in Figure 6. Peeling is that the particle is crushed at the contact interface, and a few fragments are peeled off the particle body (see Figure 6a). Another breakage mode is considered as peeling–splitting (see Figure 6b). Some fragments are peeled off at a relatively low load, but the particle is crushed into two pieces with increasing load. The third breakage mode is called splitting (see Figure 6c). Few fragments are peeled off, and the particle is crushed into two pieces directly. Interestingly, a conical core was formed during the breakage process of peeling–splitting and splitting (see Figure 7). The conical core consists of a round platform (the platform is the contact interface) and an inverted cone. The formation of splitting is caused by the conical core inserting into the particle and the tensile stress reaching the tensile strength [31,32]. Therefore, the occurrence of the conical core is considered as the precondition for particle crushing as splitting eventually.
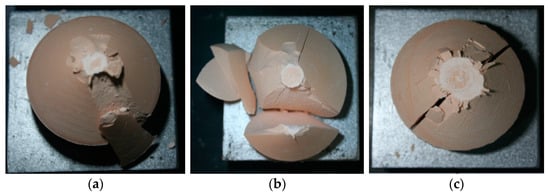
Figure 6.
Photography of different breakage modes: (a) peeling; (b) peeling–splitting; (c) splitting.
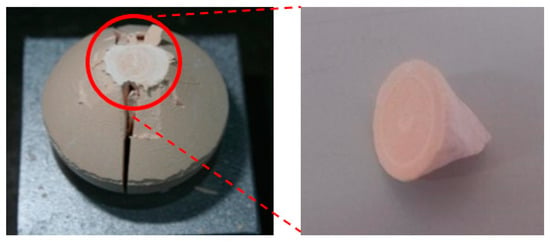
Figure 7.
Conical core formed during the particle breakage.
Table 3 listed the breakage modes for the cone–hemispherical gypsum particles. Particle breakage mode gradually transfers from peeling to splitting with the increase in contact diameter d for particles of the same sphere diameter D and cone angle θ. For the same sphere diameter D (here, 50 mm) and cone angle (here, 90°), particles crush as peeling (d = 5 mm), peeling–splitting (d = 7, 8 mm) and splitting (d = 10 mm), respectively, as shown in Figure 8. The explanation is that for a smaller contact diameter, the particle is more likely to crush at the contact due to the stress concentration before the stress transfers to the inside of the particle. For the same sphere diameter D and contact diameter d, the larger the cone angle θ is, the more likely the particle crushes as splitting. For the same sphere diameter D (here, 50 mm) and contact diameter d (here, 7 mm), the breakage modes are peeling, peeling–splitting and splitting for particles of cone angle of 60°, 90°and 120°, respectively, as shown in Figure 9. However, particles of the same cone angle θ and contact diameter d tend to crush as peeling instead of splitting with the increase in sphere diameter D. Figure 10 shows the breakage modes of particles of the same cone angle (here, 90°) and contact diameter (here, 8 mm). It can be seen that for sphere diameter D 30 mm, 50 mm and 70 mm, the breakage modes are splitting, peeling–splitting and peeling, respectively.
Table 3.
Particle breakage modes.
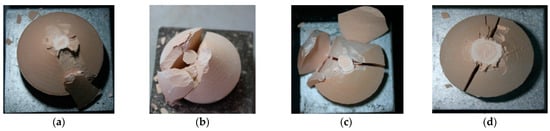
Figure 8.
Breakage modes change with the increase in contact diameter d when the sphere diameter D is 50 mm and cone angle θ is 90°: (a) d = 5 mm; (b) d = 7 mm; (c) d = 8 mm; (d) d = 10 mm.
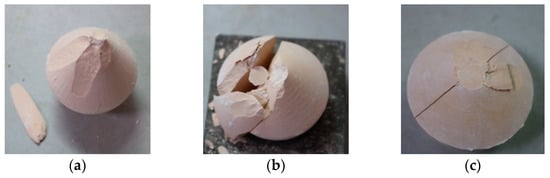
Figure 9.
Breakage modes change with the increase in cone angle θ when the sphere diameter D is 50 mm and contact diameter is 7 mm: (a) θ = 60°; (b) θ = 90°; (c) θ =120°.
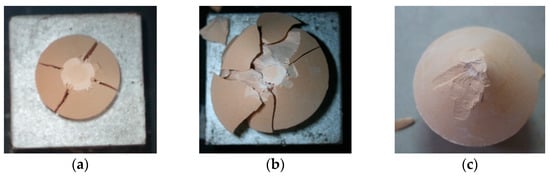
Figure 10.
Breakage modes change with the increase in sphere diameter D when cone angle θ is 90° and contact diameter is 8 mm: (a) D = 30 mm; (b) D = 50 mm; (c) D = 70 mm.
3.2. Force–Displacement Curves
The force–displacement curves are significantly different among the three breakage modes. Figure 11a shows the typical peeling force–displacement curves. The normal force increases linearly with displacement, during which the local crushing happens and then fluctuates in a certain range due to a few small fragments peeled off. The larger reduction in the normal force is attributed to the bigger fragment. For particle peeling–splitting, the normal force experiences a more visible plummet after a linearly increasing and floating process, mainly caused by more severe local crushing and peeling (see Figure 11b). In this stage, the particle crushes into two pieces. After that, the normal force increases gently because the broken pieces could continue to support the load. The force–displacement curve of the particle splitting (see Figure 11c) is similar to that of spherical particle splitting [28]. The normal force increases linearly, accompanied by the occurrence of local crushing, and then drops steeply to almost zero since the particle breaks into pieces.
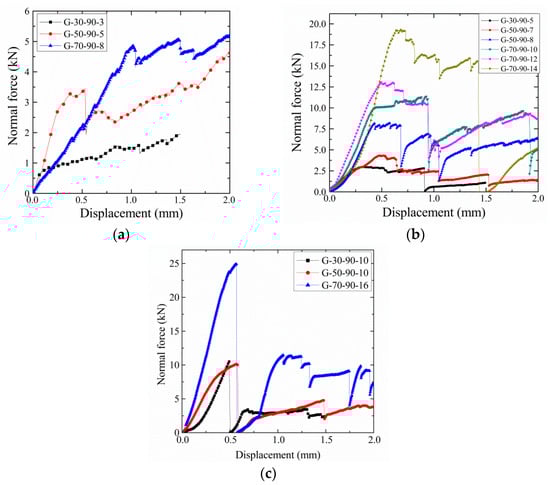
Figure 11.
The typical force–displacement curves corresponding to three particle breakage modes: (a) peeling; (b) peeling–splitting; (c) splitting.
After the normal force reaches its first peak, a relatively large displacement is generated for particle peeling or peeling–splitting, while a large normal force reduction occurs for particle splitting. All the consequences might induce serious accidents in practical engineering. Therefore, the first peak value Fcr of the normal force is of great significance to particle breakage. The critical normal force Fcr is closely related to contact diameter d. The relationship between the critical normal force and contact diameter is shown in Figure 12. It can be seen that for the same cone angle (here, 90°), the 30 and 50 mm exhibit an almost identical linearly increasing relationship between Fcr and d, whereas, for a larger sphere diameter, the effect of the contact diameter d in Fcr is more prominent, evident by the highly accelerated increase of Fcr with an increase of d. The explanation for the prominent effect of contact diameter d in Fcr for larger sphere diameter D is that Fcr is related to the crushing surface of the particle. For larger sphere diameter D and contact diameter d, the crushing surface is much larger than smaller ones. The relationship between critical normal force Fcr and cone angle θ can also be linearly-fitted (see Figure 13). For the same cone angle and contact diameter, it seems that the critical normal force Fcr has no significant relationship with sphere diameter D. Figure 14a shows no direct correlation between Fcr and D for particles of contact diameter of 8 mm and 10 mm when the cone angle is 90°. The reason may lie in that the breakage modes affect Fcr heavily. Nevertheless, for the particles that have the same breakage mode, the critical normal force Fcr increases linearly with increasing sphere diameter D, as shown in Figure 14b. Thus, the relationship between Fcr and D heavily depends on particle breakage mode.
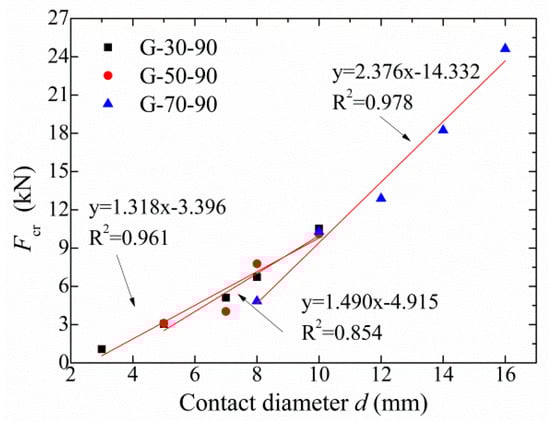
Figure 12.
Relationship between critical normal force Fcr and contact diameter d.
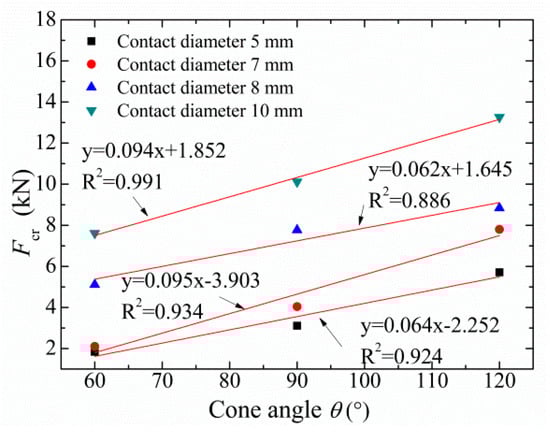
Figure 13.
Relationships between critical normal force Fcr and θ for particles of sphere diameter of 50 mm.
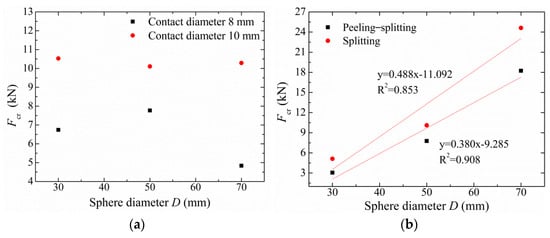
Figure 14.
Relationship between critical normal force Fcr and sphere diameter D: (a) contact diameters of 8 mm and 10 mm; (b) breakage modes of peeling–splitting and splitting.
3.3. Breakage Mode Discrimination
The peeling–splitting mode can be seen as a transition between peeling and splitting as it has the characteristics of both peeling and splitting. According to the breakage modes discussed above, the relationship between contact diameter d, cone angle θ and sphere diameter D in different modes can be deduced. In order to distinguish different breakage modes, the largest contact diameter d when the particle is crushed as peeling is defined as the lower critical contact diameter dcrl, and the smallest contact diameter d when the particle crushed as splitting is called the upper critical contact diameter dcru. With increasing cone angle θ, the critical contact diameters dcrl and dcru decrease, as shown in Figure 15. It indicates that for larger cone angle θ, the particle is more susceptible to crush as splitting. For particles of sphere diameter of 50 mm, the relationship between cone angle θ and the critical contact diameters dcrl and dcru could be described as:
where dcrl1 is the lower critical contact diameter of cone–hemispherical particles of sphere diameter of 50 mm; dcru1 is the upper critical contact diameter of cone–hemispherical particles of sphere diameter of 50 mm. θ is the cone angle of cone–hemispherical particles of 50 mm.
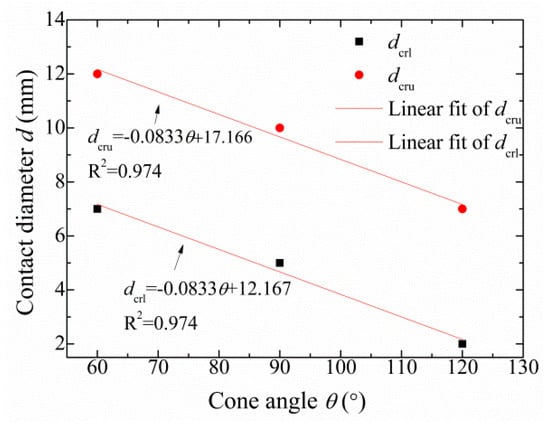
Figure 15.
Relationship between critical normal diameter dcr and cone angle θ.
For the same cone angle, particle shape is the same for the same ratio of contact diameter d to sphere diameter D. As the breakage mode is related to particle shape instead of particle scale [33], ratios of the critical contact diameters dcrl and dcru to sphere diameter D for particles of the same cone angle should be constants. For the particles of cone angle of 90°, when sphere diameters are 30 mm, 50 mm and 70 mm, the ratios of the lower critical contact diameter dcrl to sphere diameter D are 0.10, 0.10 and 0.11, the ratios of the upper critical contact diameter dcru to sphere diameter D are 0.23, 0.20 and 0.23, respectively. Then the relationship between critical contact diameters dcrl and dcru and sphere diameter D can be described as:
where dcrl2 is the lower critical contact diameter of the cone–hemispherical particles of cone angle of 90°; dcru2 is the upper critical contact diameter of the cone–hemispherical particles of cone angle of 90°. D is the sphere diameter.
As discussed above, the critical contact diameter dcr has a linear relationship with sphere diameter D and cone angle θ. Therefore, these three variables can be fitted by plane, as shown in Figure 16. The critical contact diameter dcr can be described as:
where dcrl is the lower critical contact diameter of the cone–hemispherical particle; dcru is the upper critical contact diameter of the cone–hemispherical particle; D is the sphere diameter, and θ is the cone angle.
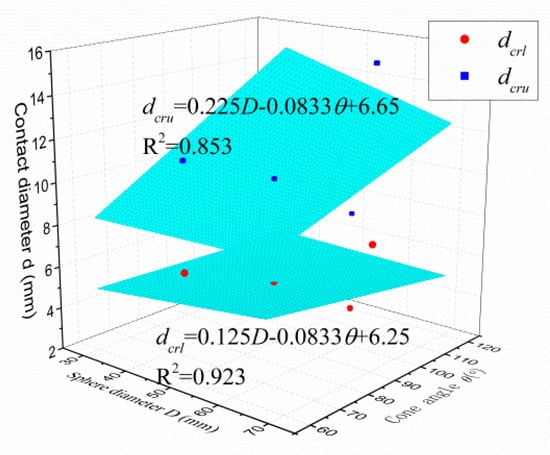
Figure 16.
Relationship between critical normal force Fcr and sphere diameter D.
Therefore, breakage modes can be discriminated for cone–hemispherical gypsum by critical contact diameter dcrl and dcru evaluated by formula (3). When contact diameter d is smaller than or equal to the lower critical contact diameter dcrl, the particle will crush as peeling under normal contact. When contact diameter d is larger than or equal to the upper critical contact diameter dcru, the particle will crush as splitting under normal contact. Otherwise, the particle will crush as peeling–splitting. The discrimination can be described as:
where dcrl is the lower critical contact diameter; dcru is the upper critical contact diameter. The formulas (3) and (4) can be used to estimate the breakage modes of cone–hemispherical gypsum particles according to particle shape.
4. Discussion
This paper investigated the quantified relationship between particle shape and breakage modes. The breakage mode of cone–hemispherical particles is related to contact diameter, cone angle and sphere diameter, but not to particle scale. The different stress path is the main reason for the influence of particle shape on the breakage modes. For peeling, stress concentration caused by normal loading leads to particle crushing at the contact before the stress transfers to the inside of the particle. While particle splitting occurred as the conical core formed at the contact inserted into particle with cracks development and penetration due to the stress reaches its tensile strength. Particle peeling–splitting is caused by the above two reasons. For flawless particles, the strength is irrelevant to particle scale. However, the critical normal force is affected by both particle shape and particle scale, as the critical normal force is related to particle breakage surface. The discrimination of breakage mode based on particle shape provides a reference to select the reasonable particle shape for practical engineering, as there is a significant influence of particle shape on particle breakage.
As the limitations of experimental conditions, only three sets of cone angle and sphere diameter were designed for cone–hemispherical particles, the breakage mode discrimination obtained is maybe not sufficiently precise, but still available due to its regularity. In future work, natural materials will be considered to explore their influence on particle breakage and the applicability of breakage mode discrimination on different materials.
5. Conclusions
In this study, detailed insights into the cone–hemispherical gypsum particle breakage under normal contact at different contact diameter d, cone angle θ and sphere diameter D was obtained. By analyzing particle breakage processes, breakage modes, normal force–displacement curves and the effect of particle shape variables on particle breakage were investigated, and particle breakage discrimination based on particle shape was proposed. The main conclusions are as follows:
- After a local crushing at the contact interface, the particle breakages with increasing normal forces turn out to be three modes: peeling, peeling–splitting and splitting. The particle breakage mode transfers from peeling to splitting with the increases in contact diameter d and cone angle θ, but a decrease in sphere diameter D;
- Each breakage mode has a distinct force–displacement curve. The first peak of normal force Fcr has a positive linear correlation with contact diameter d and cone angle θ, but no direct correlation with sphere diameter D. The relationship between the critical normal force Fcr and sphere diameter D heavily depends on the breakage mode;
- The critical contact diameter dcr described by cone angle θ and sphere diameter D is proposed to discriminate particle breakage mode. If contact diameter d is smaller than the lower critical contact diameter dcrl, peeling will occur, and if contact diameter d is larger than the upper critical contact diameter dcru, the particle would be split; otherwise, the particle would crush as peeling–splitting.
Author Contributions
Conceptualization, J.Z. and Y.Z.; methodology, Y.Z., J.Z. and Q.J.; formal analysis, Q.J. and Q.H.; data curation, Q.H., L.L. and Y.N.; writing—original draft preparation, Y.Z.; writing—review and editing, L.L. and Y.N.; All authors have read and agreed to the published version of the manuscript.
Funding
This research was funded by the National Natural Science Foundation of China, grant number 51479138.
Institutional Review Board Statement
Not applicable.
Informed Consent Statement
Not applicable.
Data Availability Statement
The data presented in this study are available in the insert article.
Conflicts of Interest
The authors declare no conflict of interest. The funders had no role in the design of the study; in the collection, analyses, or interpretation of data; in the writing of the manuscript, or in the decision to publish the results.
References
- Lade, P.V.; Yamamuro, J.A.; Bopp, P.A. Significance of particle crushing in granular materials. J. Geotech. Eng. 1996, 122, 309–316. [Google Scholar] [CrossRef]
- Lawton, E.C.; Fragaszy, R.J.; Hetherington, M.D. Review of wetting-induced collapse in compacted soil. J. Geotech. Eng. 1992, 118, 1376–1394. [Google Scholar] [CrossRef]
- Cetin, H.; Laman, M.; Ertunç, A. Settlement and slaking problems in the world’s fourth largest rock-fill dam, the Ataturk Dam in Turkey. Eng. Geol. 2000, 56, 225–242. [Google Scholar] [CrossRef]
- Alonso, E.E.; Olivella, S.; Pinyol, N.M. A review of Beliche dam. Géotechnique 2005, 55, 267–285. [Google Scholar] [CrossRef]
- Jia, Y.; Xu, B.; Chi, S.; Xiang, B.; Xiao, D.; Zhou, Y. Joint back analysis of the creep deformation and wetting deformation parameters of soil used in the Guanyinyan composite dam. Comput. Geotech. 2018, 96, 167–177. [Google Scholar] [CrossRef]
- Karatza, Z.; Andò, E.; Papanicolopulos, S.-A.; Viggiani, G.; Ooi, J.Y. Effect of particle morphology and contacts on particle breakage in a granular assembly studied using X-ray tomography. Granul. Matter 2019, 21, 44. [Google Scholar] [CrossRef] [Green Version]
- Jia, Y.; Xu, B.; Chi, S.; Xiang, B.; Xiao, D.; Zhou, Y. Particle breakage of rockfill material during triaxial tests under complex stress paths. Int. J. Géoméch. 2019, 19, 04019124. [Google Scholar] [CrossRef]
- Hong, C.; Huang, M.; Zhang, D.; Shou, P.; Zhu, Z. Characteristics of direct shear and particle breakage of pebble gravel materials. Geofluids 2020, 2020, 1–13. [Google Scholar] [CrossRef]
- Zhang, J.; Luo, M. Dilatancy and critical state of calcareous sand incorporating particle breakage. Int. J. Géoméch. 2020, 20, 04020030. [Google Scholar] [CrossRef]
- Wang, Y.; Shao, S.; Wang, Z. Effect of particle breakage and shape on the mechanical behaviors of granular materials. Adv. Civ. Eng. 2019, 2019, 1–15. [Google Scholar] [CrossRef]
- Yang, G.; Yan, X.; Nimbalkar, S.; Xu, J. Effect of particle shape and confining pressure on breakage and deformation of artificial rockfill. Int. J. Geosynth. Ground Eng. 2019, 5, 15. [Google Scholar] [CrossRef]
- Ballantyne, G.R.; Bonfils, B.; Powell, M.S. Evolution of impact breakage characterisation: Redefining t-family relationship. Int. J. Miner. Process. 2017, 168, 126–135. [Google Scholar] [CrossRef] [Green Version]
- Afshar, T.; Disfani, M.M.; Arulrajah, A.; Narsilio, G.A.; Emam, S. Impact of particle shape on breakage of recycled construction and demolition aggregates. Powder Technol. 2017, 308, 417–422. [Google Scholar] [CrossRef]
- Fu, R.; Hu, X.; Zhou, B. Discrete element modeling of crushable sands considering realistic particle shape effect. Comput. Geotech. 2017, 91, 179–191. [Google Scholar] [CrossRef]
- Jiang, Y.; Herrmann, H.J.; Alonso-Marroquin, F. A boundary-spheropolygon element method for modelling sub-particle stress and particle breakage. Comput. Geotech. 2019, 113, 103087. [Google Scholar] [CrossRef]
- Kuo, C.-Y.; Freeman, R.B. Imaging indices for quantification of shape, angularity, and surface texture of aggregates. Transp. Res. Rec. J. Transp. Res. Board 2000, 1721, 57–65. [Google Scholar] [CrossRef]
- Al-Rousan, T.; Masad, E.; Tutumluer, E.; Pan, T. Evaluation of image analysis techniques for quantifying aggregate shape characteristics. Constr. Build. Mater. 2007, 21, 978–990. [Google Scholar] [CrossRef]
- Hong, L.; Gu, X.-L.; Lin, F.; Gao, P.; Sun, L.-Z. Effects of coarse aggregate form, angularity, and surface texture on concrete mechanical performance. J. Mater. Civ. Eng. 2019, 31, 04019226. [Google Scholar] [CrossRef]
- Zhu, H.; Fang, H.; Yang, J.; Su, X.; Cai, Y.; Lv, N. The independent characterization and experimental study of coarse aggregate angularity. Part. Sci. Technol. 2019, 39, 116–122. [Google Scholar] [CrossRef]
- Wu, X.H.; Cai, Y.Q.; Xu, S.F.; Xu, S.F.; Zhuang, Y.C.; Wang, Q.X.; Wang, Z. Effects of size and shape on the crushing strength of coral sand particles under diametral compression test. Bull. Eng. Geol. Environ. 2020, 80, 1829–1839. [Google Scholar]
- Shen, J.; Xu, D.; Liu, Z.; Wei, H. Effect of particle characteristics stress on the mechanical properties of cement mortar with coral sand. Constr. Build. Mater. 2020, 260, 119836. [Google Scholar] [CrossRef]
- Gupta, A.K. Effects of particle size and confining pressure on breakage factor of rockfill materials using medium triaxial test. J. Rock Mech. Geotech. Eng. 2016, 8, 378–388. [Google Scholar] [CrossRef] [Green Version]
- Rahmani, H.; Panah, A.K. Influence of particle size on particle breakage and shear strength of weak rockfill. Bull. Int. Assoc. Eng. Geol. 2020, 80, 473–489. [Google Scholar] [CrossRef]
- Sun, Y.; Nimbalkar, S.; Chen, C. Particle breakage of granular materials during sample preparation. J. Rock Mech. Geotech. Eng. 2019, 11, 417–422. [Google Scholar] [CrossRef]
- Choi, H.; Lake, C.B.; Hills, C.D. Particle size effects on breakage of ACT aggregates under physical and environmental loadings. J. Hazard. Toxic Radioact. Waste 2020, 24, 04019029. [Google Scholar] [CrossRef]
- Ovalle, C.; Frossard, E.; Dano, C.; Hu, W.; Maiolino, S.; Hicher, P.Y. The effect of size on the strength of coarse rock aggregates and large rockfill samples through experimental data. Acta Mech. 2014, 225, 2199–2216. [Google Scholar] [CrossRef] [Green Version]
- Cavarretta, I.; O’Sullivan, C.; Coop, M.R. The relevance of roundness to the crushing strength of granular materials. Géotechnique 2017, 67, 301–312. [Google Scholar] [CrossRef] [Green Version]
- Zhou, J.; Zhang, Y.W.; Zhou, Y.H.; Zhang, J. Experimental study on particle breakage of coarse-grained soil considering normal contact force. Chin. J. Geotech. Eng. 2018, 40, 1163–1170. [Google Scholar]
- Wang, W.; Coop, M.R. An investigation of breakage behavior of single sand particles using a high-speed microscope camera. Géotechnique 2016, 66, 984–998. [Google Scholar] [CrossRef] [Green Version]
- Tapias, M.; Alonso, E.E.; Gili, J. A particle model for rockfill behavior. Géotechnique 2015, 65, 975–994. [Google Scholar] [CrossRef]
- Yu, S.; Jia, M.; Zhou, J.; Zhao, C.; Li, L. Micro-mechanism of spherical gypsum particle breakage under ball–plane contact condition. Appl. Sci. 2019, 9, 4795. [Google Scholar] [CrossRef] [Green Version]
- Niu, Y.; Li, L.; Zhang, Y.; Yu, S.; Zhou, J. Micromechanism of the breakage of two spherical gypsum particles under normal–tangential contact conditions. Appl. Sci. 2021, 11, 4039. [Google Scholar] [CrossRef]
- Zhao, B.; Wang, J.; Coop, M.R.; Viggiani, G.; Jiang, M. An investigation of single sand particle fracture using X-ray micro-tomography. Géotechnique 2015, 65, 625–641. [Google Scholar] [CrossRef] [Green Version]
Publisher’s Note: MDPI stays neutral with regard to jurisdictional claims in published maps and institutional affiliations. |
© 2021 by the authors. Licensee MDPI, Basel, Switzerland. This article is an open access article distributed under the terms and conditions of the Creative Commons Attribution (CC BY) license (https://creativecommons.org/licenses/by/4.0/).