Article

Guided Spatial Transformers for Facial Expression Recognition

by
Cristina Luna-Jiménez
*,
Jorge Cristóbal-Martín
,
Ricardo Kleinlein
,
Manuel Gil-Martín
,
José M. Moya
and
Fernando Fernández-Martínez
Information Processing and Telecommunications Center, E.T.S.I. de Telecomunicación, Universidad Politécnica de Madrid, Avda. Complutense 30, 28040 Madrid, Spain
*
Author to whom correspondence should be addressed.
Appl. Sci. 2021, 11(16), 7217; https://doi.org/10.3390/app11167217
Submission received: 21 June 2021 / Revised: 29 July 2021 / Accepted: 2 August 2021 / Published: 5 August 2021
(This article belongs to the Special Issue Computational Trust and Reputation Models)

Abstract

:
Spatial Transformer Networks are considered a powerful algorithm to learn the main areas of an image, but still, they could be more efficient by receiving images with embedded expert knowledge. This paper aims to improve the performance of conventional Spatial Transformers when applied to Facial Expression Recognition. Based on the Spatial Transformers’ capacity of spatial manipulation within networks, we propose different extensions to these models where effective attentional regions are captured employing facial landmarks or facial visual saliency maps. This specific attentional information is then hardcoded to guide the Spatial Transformers to learn the spatial transformations that best fit the proposed regions for better recognition results. For this study, we use two datasets: AffectNet and FER-2013. For AffectNet, we achieve a 0.35% point absolute improvement relative to the traditional Spatial Transformer, whereas for FER-2013, our solution gets an increase of 1.49% when models are fine-tuned with the Affectnet pre-trained weights.

1. Introduction

For many years, computer vision has been an active area of research. The development of Convolutional Neural Networks implied a revolution in this field as they were demonstrated to be an effective framework to improve many image processing tasks, such as image classification [1], Facial Expression Recognition [2], etc. However, they lack an attention mechanism that can identify the most relevant parts of an image. As a consequence of this necessity, the Spatial Transformer Networks (STN) appeared [3]. These models aim to detect the main regions that appear on an image and correct spatial variations by transforming the input data. Using these modified images, the following layers of the network increase their recognition rates [4,5,6].
Unlike conventional STNs, where the localization network exclusively receives the original input image, we propose replacing the original input image feeds into the localization network with our generated masks. These representations prove to be adequate to improve the attention on relevant local regions of the face, as they are the eyes, mouth, nose, etc. by increasing the final recognition rate.
To evaluate the viability of this idea, we test our proposal on a Facial Emotion Recognition task, given its interest in different fields. Recognizing emotions lets us efficiently interact with others. By analyzing user reactions, it is also possible to detect a loss of trust or changes in emotions in Embodied Conversational Agents (ECAs), letting one react to this event and adapt machine behaviors to improve interactions or modify the dialogue content, tone, or facial expression (if it has them) to create a better socio-affective user experience [7]. Furthermore, systems able to recognize certain emotions or deficits of them could help to diagnose certain diseases like depressive disorders [8], Parkinson’s [9], etc., and improve the treatment of the patients. Another relevant application of Facial Expression Recognition is for automotive safety. Recognizing negative emotions like stress, anger, or fatigue is crucial to avoid traffic accidents and increase the security on the road [10] on intelligent vehicles, allowing them to act accordingly to the state of the driver.
The selected datasets for our work are AffectNet [11] and FER-2013 [12]. In both datasets, the strategies that employ masks instead of the original images significantly improve the results reached by the conventional STN model.
To summarize, the contributions of this paper are as follows:
  • We propose a new module, that we call “Mask Generator”, to attach to the Spatial Transformer to improve its performance. This module will generate several masks that are fed into the STN together with the original images. These masks, which are directly crafted from the estimated facial landmarks or assimilated as the resulting visual saliency maps from the original image, are practical to enhance the attention on relevant local regions.
  • We also solve the Facial Emotion Recognition task on two popular datasets, achieving statistically significant results with our strategies, which improves the conventional STNs. The results obtained in this task expose the efficacy of this idea and open the possibility of applying the same procedures to other computer vision tasks where the ground-truth of the interest regions is not available.
To our knowledge, this is the first work that analyzes and compares strategies to study the effect of feeding different images with embedded domain knowledge of the task into the localization network of an STN, trained end-to-end with only class emotional labels. The rest of the paper is organized as follows. Section 2 describes the related works and preceding research studies. Section 3 summarizes the methodology. Throughout Section 4, we describe the experiments, the datasets used, and some implementation details. Section 5 presents the main experiments performed and results. Finally, in Section 6, we discuss the main conclusions of our study and indicate some future research lines.

2. Related Work

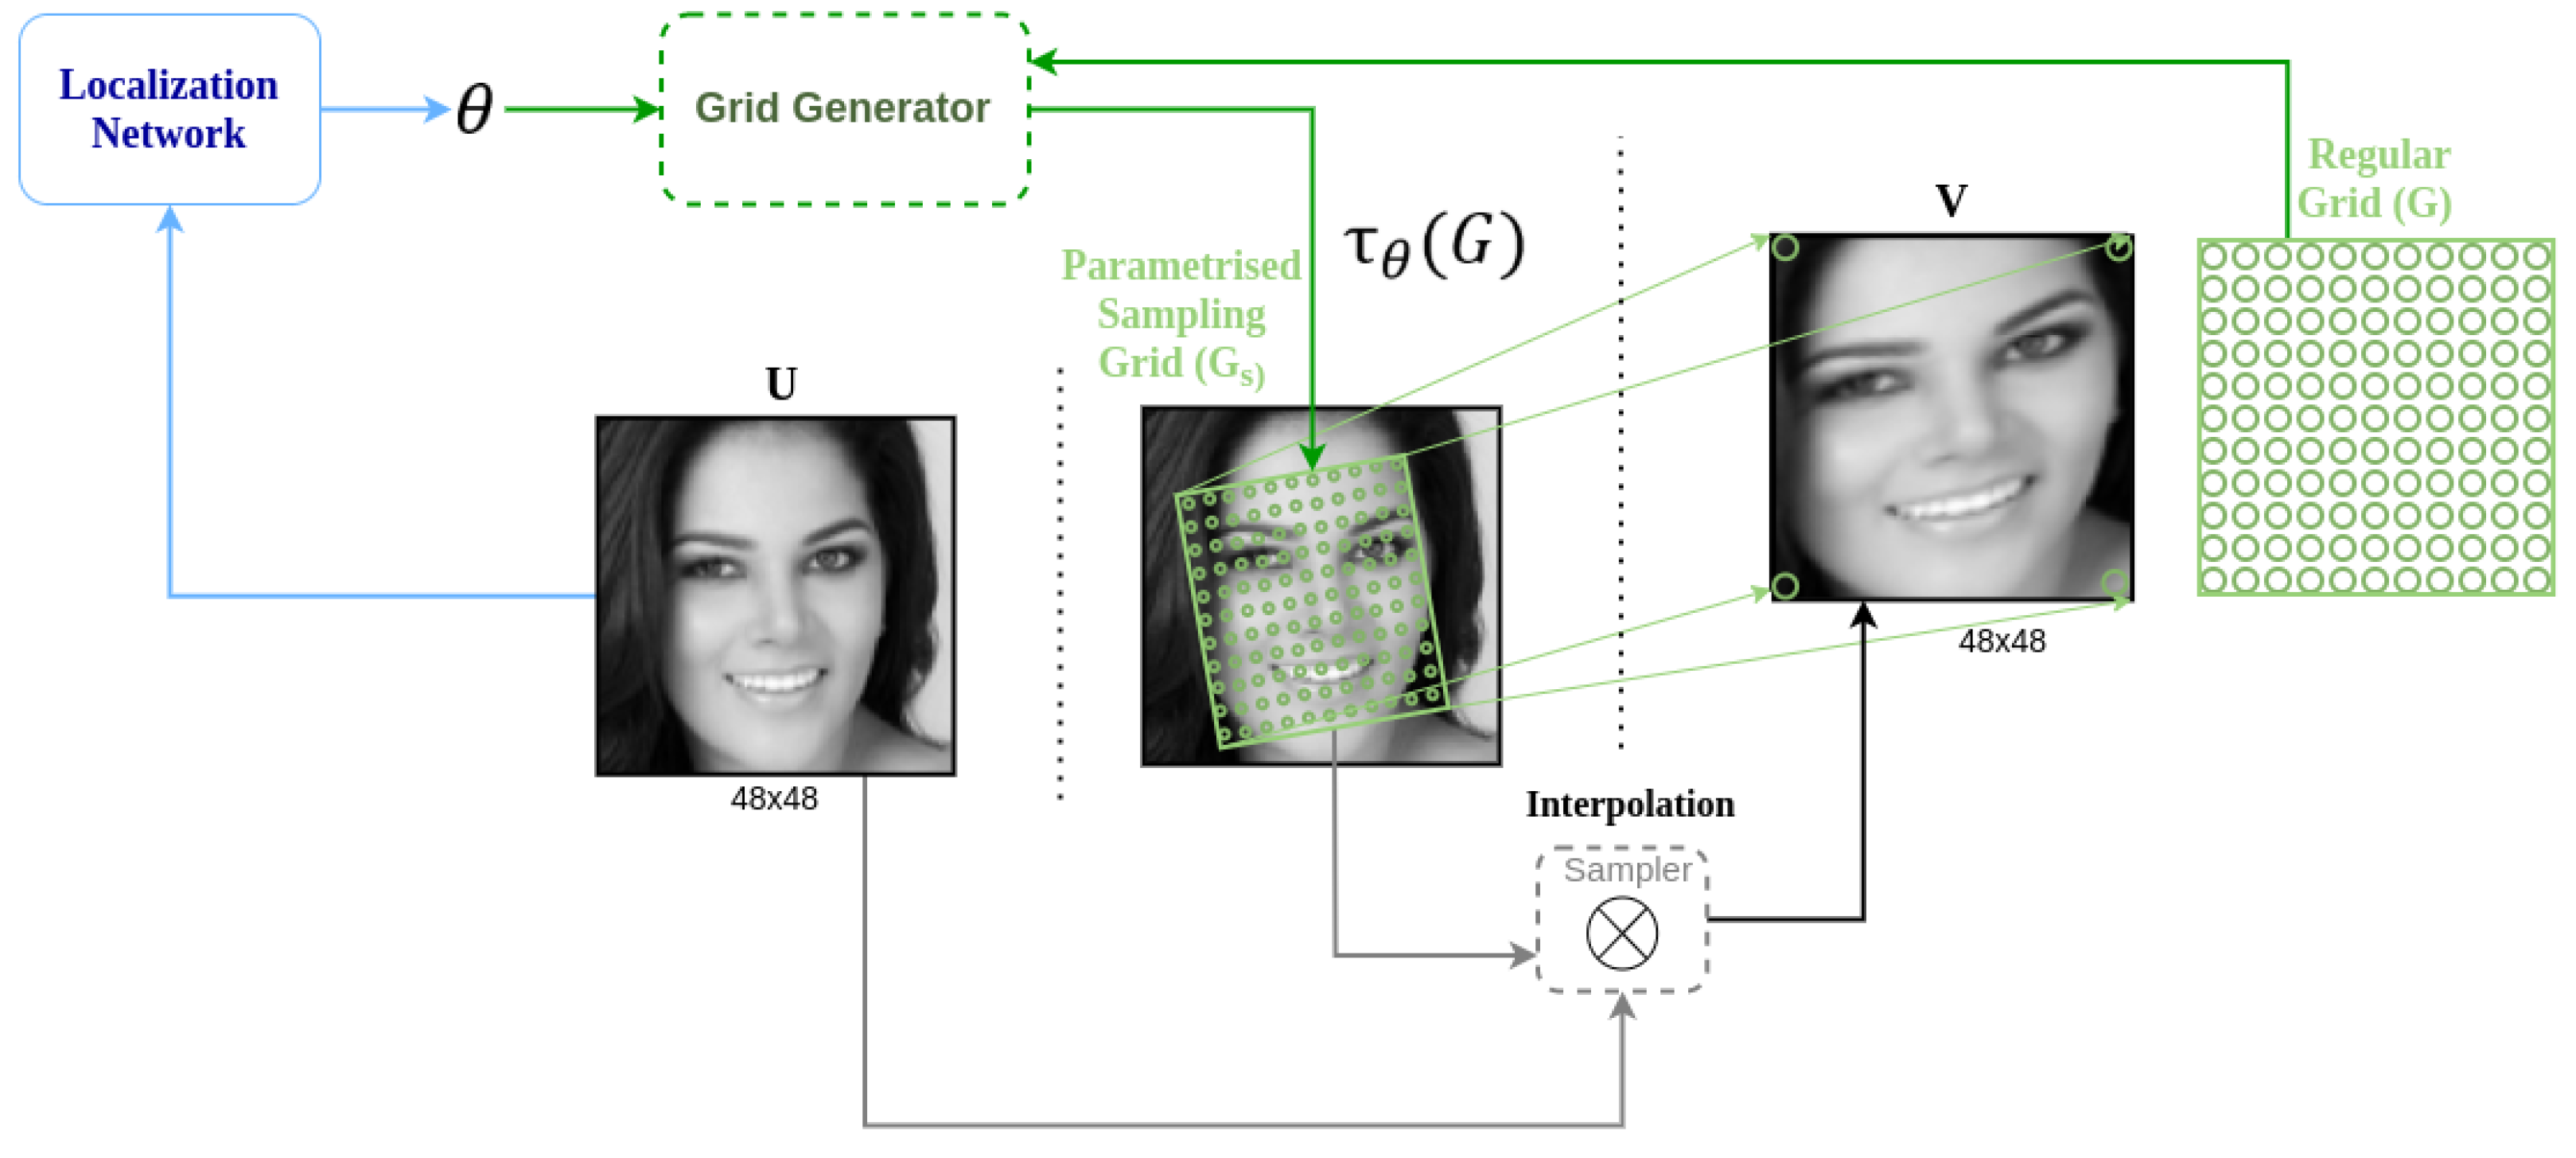
2.1. Spatial Transformer Networks

Due to the adequacy of STNs [3] to solve visual tasks, they have been employed in many domains. We have classified the latest publications in the literature into three groups: task-based, framework-based, and model-based.
The first group that we called task-based publications contains all the studies that apply STNs to previous areas. Until the appearance of the STNs, these problems were solved with other architectures such as CNNs. However, with the development of these models, the community reached state-of-the-art results applying STNs on previously studied tasks. Some examples of this success occurred in the areas of lip movement detection [4], emotion recognition [5], or saliency prediction [13].
The second trend of publications, which are framework-based, includes research studies that investigate how to connect or incorporate this model in other frameworks. As in [14], where the authors combine an STN with a Generative Adversarial Network (GAN) to create more realistic images, or in [15], with the aggregation of an STN before a CNN network that recognizes people, making use of triplet loss as the cost function.
The third relevant line of STN papers, those that are model-based, aims to improve the original version of the STN by combining it with other ideas as in the work of Lin et al. [16] that integrate Lucas and Kanade (LK) algorithm into a classic STN, or the proposed STN-RNN in [17] that uses recurrent neural networks into an STN pipeline.
This third group also includes the work of M.C.H.Lee et al. [18]. In their article, the authors argue that their “Image-and-Spatial-Transformer Networks” (ISTN) could improve the medical image registration problem, which consists of the alignment of several images. They propose to add an extra network on top of an STN. The top network (ITN) generates the segments that conform to the input image. Then, the STN predicts the transformation matrix to align the images from the generated segments of the ITN. However, for the training of the ITN, it is necessary to have the ground truth of the images with the landmarks of the segments correctly annotated to train the ITN network.
Our proposal follows a similar idea in a more general way because we do not have access to the ground truth of the attention regions. Instead, we evaluate the images generated automatically from different general purpose pre-trained networks that emphasize the most relevant areas of an input image. With these generic masks, we conduct an ablation study to assess the impact of passing each of them to the localization network of the STN. Results reveal that their inclusion enhances the performance of conventional STNs for the emotion recognition task.
One of the advantages of our proposal is that we do not need to re-train the models that extract the masks, as they are general purpose models that can be applied to several tasks. The use of these generalistic models reduces the manual annotation effort required to create supervised-tailored models.
Apart from the similarities with the work in [18], there are also several differences to our work. The first one is that we apply our proposal to a different domain, thus we require other landmarks extractors that detect morphologically different regions. Another of the main differences is the architecture of the STN that we use, as we need to add some extra layers after predicting the transformation matrix parameters to address the Facial Emotion Recognition task. Finally, we extend the ablation study that they do by evaluating modified versions of the landmarks and the idea of using the saliency maps, everything extracted automatically without re-training these models.

2.2. Emotion Recognition

Emotions are considered a psychological state. Due to their interest and variety of applications, they have been vastly studied from different scopes as psychology, computer science, medicine, etc.
Regarding psychological and neuroscience studies, they usually focus on discovering when a person manifests a specific emotion or how the brain generates the emotions. As an attempt to answer these questions, many psychological theories were proposed.
Two of the most relevant psychological theories that deepen the categorization of emotions were proposed by P. Ekman in 1999 [19], and by J. Posner and J.A.Rusell in 2005 [20].
Ekman’s theory [19] establishes that there are six main families of universal emotions. These families of emotions are anger, fear, sadness, enjoyment, disgust, and surprise. Later, J.Posner and J.A.Rusell developed a new theory: “the circumplex model of affect”. This new theory contrasts with the Ekman assumptions as they considered that emotions appear as a product of two independent neural systems, one that informs about the valence (how positive or negative is an emotion) and the other that represents the arousal (how intense or soft is an emotion) [20].
These psychological theories built the base to create most of the current existing datasets for emotion recognition [11,12,21,22,23,24]. Depending on the corpus, emotions are annotated in terms of a group of families, following the Ekman’s theory [12,21]; in terms of valence and arousal [24], as J.Poser and J.A.Rusell said; or following both strategies [11,22,23].
The apparition of these datasets incentivized the investigation of new features and models to learn to recognize these emotions. An example of features is the landmarks estimation, which consists of extracting the coordinates of some key points around the eyebrows, eyes, nose, mouth, and jaw. Works such as that in [25] demonstrate that landmarks encapsulate important information about the facial expression of a person. Another example of features highly related to emotions are the Facial Action Units (FACs). In [26], they extract several FACs and introduce them into a 7-layer autoencoder, recognizing emotions with a high accuracy rate. One of the advantages of FACs compared with landmarks is that they encapsulate a facial movement, with information being more highly processed. However, it is not easy to create a mask from the FACs information, whereas landmark coordinates can be easily represented in an image.
Regarding the models, some of the most interesting for this work are EmotionalDAN [27] and Deep-Emotion [5]. EmotionalDAN can solve emotion, valence, and landmarks recognition at once, improving its baseline model that did not include the landmarks and valence predictors. It is interesting to mention this model because it also uses landmarks to improve the final results. On the other hand, Deep-Emotion uses an STN architecture to address emotion recognition, emphasizing that these models are appropriate to solve our task.
The last mention is for the study of Mavani, V. et al. [28]. Among their experiments, they evaluate the results of multiplying the original input image with a salience map. When they introduce this combined image into their model instead of the original image, the network learns from the filtered image. This result indicates that saliency can localize the most relevant areas in an image, allowing the network to extract emotional information.
Our work extends the previous studies by suggesting and comparing several methods to improve the performance of the localization network in STNs for Facial Emotion Recognition tasks.

3. Methodology

Our main goal is the evaluation of different strategies to improve the performance of Spatial Transformers Networks for Facial Emotion Recognition tasks. For this task, we include a module in charge of generating images, called masks, that will serve as input to the Localization Network of the STN.
The motivation of this work, rather than helping to push the research on the topic and achieve state-of-the-art results in each specific task, is to explore how well the proposed models generalize and perform on independent datasets. Therefore, to enable the analysis and comparison across differently (and maybe inconsistently) annotated datasets, our recognition experiments were performed according to the three main emotional valence categories: positive, neutral, and negative. This task re-definition should help us reduce potential biases resulting from a more heterogeneous and more skewed or unbalanced distribution of the emotion categories. Besides, as we plan to explore and evaluate transfer learning and adapt the models trained on both datasets, this valence categorization also allows us to adopt the same target labels in both cases, which minimizes the discrepancy between them in terms of the feature representation and ensures optimal transfer accuracy (the deviation between classifier weights across domains can be minimized when classes are the same [29,30]).
In this section, we will start by introducing how we generate the mentioned masks, and then we will define the structure of our Spatial Transformer.

3.1. Masks Generator

As we mentioned in Section 2.2, both landmarks and saliency maps have been widely employed in visual classification and recognition tasks. The main advantage of these two approaches is that they automatically detect essential parts of the image and emphasize them, obtaining a new image with embedded knowledge relevant to the task. For this reason, we use these techniques, and variations of them, for creating our masks.
The mask generator module can be fixed before the localization network, or before the sampler to modify the inputs of an STN, as we can see in Figures 5 and 6.
In this section, we explain the type of masks that the generator can produce.

3.1.1. Landmark-Based Binary Masks

Our face changes when we express emotions. Muscles and ligaments adopt different positions when we smile or frown. All these movements help our brain to recognize how people feel in each moment. The landmarks are related to these facial movements as they constitute a set of points that surrounds the key parts of the face as they are the eyebrows, eyes, nose, mouth, and jaw. Once we obtain the landmarks, it is possible to create regions of interest by filling in the enclosed area of the landmarks.
To detect as many faces as possible, we use a state-of-the-art CNN-based face detector, MTCNN [31]. When it finds a new face, the face passes to dlib library [32] to extract the landmarks. The landmarks consist of 68 (x,y) tuples, which are the coordinates of the points that indicate the position of eyes, eyebrows, nose, and mouth in an image. With these tuples, we generate a binary mask: black and white. In white, we remark the relevant pixels enclosed by the landmarks, and in black, the rest of the background.
Notice that for some samples, the facial detector fails and does not detect any face. In those cases, it is not possible to generate the landmarks mask of that sample. As the STN always expects an image, we tested several ideas to substitute the landmarks masks on these cases: the first one that appears in tables as v1, consists of a substitute to those samples with full-white images, to indicate to the model that all the pixels are equally relevant; the second option, or v2, was used to introduce the saliency maps instead of the white images; and the third option, or v3, was used to ignore the predictions of the model trained with the landmarks mask and rely on the predictions of another model for those images. In our case, the second model was trained with saliency maps and appears in Table 1 and Table A1 as “STN with saliency masks”.
For simplicity, the rest of the strategies derived from the landmarks use full-white images (v1) when the face is not detected.
In the following subsections, we will detail how we extract the saliency maps and how we train each model with the different masks.

3.1.2. Landmarks-Based Soft Masks

This strategy is a modified version of the binary masks with a soft background.
To soften the background of the landmark-based binary mask, we fix a threshold of 0.15. All the pixels that have intensities below 0.15, now get the value of 0.5, whereas the rest change their value to 1. As a consequence, we obtain images as shown in the third column of Figure 1.
With this transformation, we pursue to improve the training of the network, as introducing many zeros may deteriorate the learning of those areas in which there is usually a zero due to the functioning of the backpropagation algorithm. When the backpropagation algorithm propagates the error, those inputs with zero will not modify their associated weights in the network, as they did not contribute to the final prediction. However, these areas could still carry important information about the context and could be relevant for some images. For this reason, we considered that introducing non-zero values may benefit the network’s learning.
Furthermore, we believe that this way of expressing the data maintains the possibility of determining the transformation from the whole image and not only from the regions delimited by the landmarks, using more context but still retaining relevant regions.

3.1.3. Landmark-Based Dilated Binary Masks

This version is an approach between two strategies: the landmarks’ masks and the saliency masks.
The dilation transformation is a morphological operation that consists of convolving an input image with a kernel. We apply this operation to the landmark-based binary masks, after scaling them to 48 × 48 pixels and removing the jaw. The results are images that present an increment in the size of the streaks that define the picture.
As the thickness of the lines that conform to the image increases, we hypothesize that we could observe one of the following two possible behaviors. On the one hand, the surrounding pixels to the landmarks regions could give extra information from the surrounding area that may help to contextualize the relevant regions. On the other hand, this increment in size could introduce redundant information instead of valuable and new knowledge, which may degrade the final performance. Experiments suggest that our second intuition is closer to reality.
To generate the dilation, we used the OpenCV library [33]. We set a kernel of 2 × 2 with all the values to 0.5 and 2 repetitions. Some examples of the landmark-based dilated binary masks appear in the fourth column of Figure 1.

3.1.4. Visual Saliency-Based Masks

Visual saliency predictors generate saliency maps. These saliency maps are images that help to understand the meaning of an image’s content by emphasizing the most relevant areas that usually attract our attention. The very definition indicates the relation that these maps share with the attention and how humans maintain only relevant information when they solve a task.
As we describe in Section 3.2, the localization network has the characteristics of a spatial attention mechanism. This mechanism has the function of discovering the essential parts of the original image. Once it detects these regions, it learns the optimal transformation to convert the image and passes the modified image to the rest of the network to solve the recognition task.
Due to the similarities between the saliency maps and the attention mechanism of the STN [13,34,35], we hypothesize that saliency maps should contain enough information to guide the learning of the localization branch and to reduce the complexity of the training.
To extract the visual saliency maps from the original images, we employ the pre-trained CNN in [36] on the salicon dataset [37]. The reason for choosing this network is due to its size–performance balance. This model is lighter than others but achieves as good metrics as some state-of-the-art saliency predictors. In the fifth column of Figure 1, we have our saliency masks.

3.1.5. Landmark-Based Facial Patches

The generator creates these masks by multiplying the original image in grayscale by the landmarks-based binary masks. The result, as we can see in the sixth column of Figure 1, is the original image cropped accordingly to the regions delimited by the extracted facial landmark, with the rest of the background in black.
We use the resultant images at the input of the sampler of the STN instead of the original image, as the conventional STN does. The target of this experiment is to evaluate whether the contextual information is relevant or not. For this reason, we maintain only the data of the original image comprehended in the selected patches of the eyebrows, eyes, nose, and mouth areas.

3.1.6. Landmark-Based Image Weighing

Similar to the mask described in the previous subsection, this weighted image is also created by multiplying the original image with a mask, the landmarks-based soft mask. As we can see in the last column of Figure 1, the image contains all the information of the original image as well as the landmarks regions.
As we commented before, we will use these masks to feed the sampler of the Spatial Transformer.

3.1.7. Common Mask Processing

Before leaving the mask generator, all the images are resized to 48 × 48 and converted to grayscale. This is the format that the network expects at its input.
After the mask generator, all the images suffer an additional transformation, a standard normalization:
I n o r m ( x , y ) = ( I ( x , y ) 0.5 ) 0.5
where (x,y) represents the coordinate of each pixel of the image I, and I(x,y) the intensity value of the pixel with coordinates (x,y).

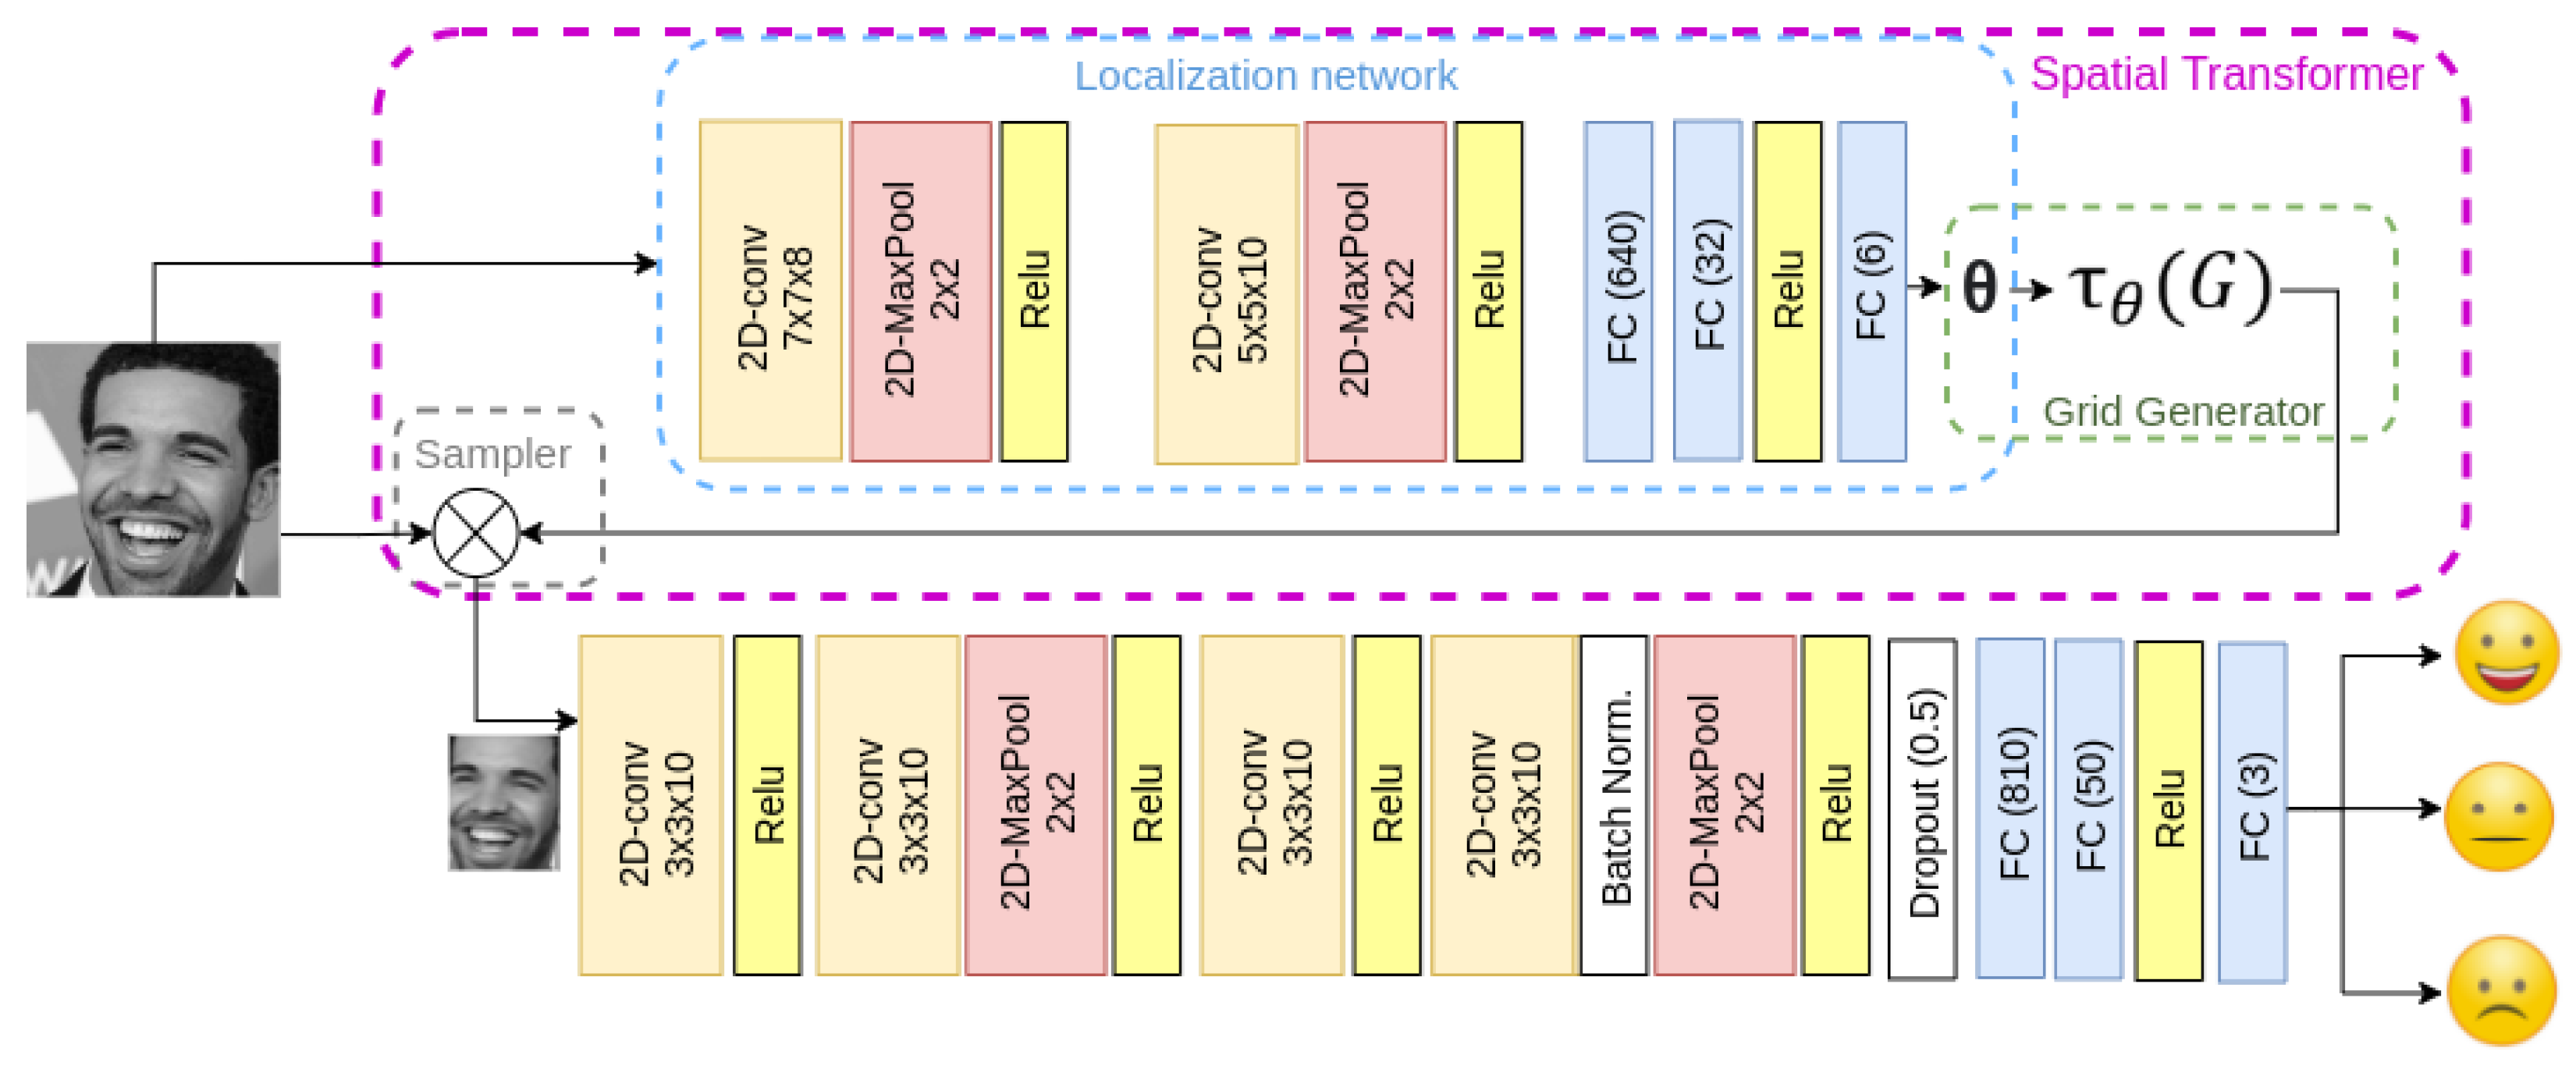
3.2. Spatial Transformer Network

We implement a Spatial Transformer Network. As defined in [3], the classic version contains three main modules: the localization network, the grid generator, and the sampler.
The localization network receives the input image U and outputs the θ parameters that form the transformation matrix, τ θ . These parameters vary depending on the input image and change during the training because they usually correspond to the weights extracted from a fully connected layer. This module is in charge of detecting the most relevant regions to focus on the image for identifying the class in later layers.
The grid generator creates a regular grid of a certain size and receives the parameters θ of the localization network. With these two inputs, it applies an affine transformation on the regular grid G, resulting in the parametrized sampling grid G s , which is a warped version of the regular grid centered on the most important pixels of the input image U, as θ is estimated from U. This sampling grid is a mapping that lets us infer a relationship between the coordinates of the pixels in the input image, U, and the expected position of the transformed pixels at the output image, V. This step is represented by the following equation:
x i s y i s = τ θ ( G ) = θ 11 θ 12 θ 13 θ 21 θ 22 θ 23 x i t y i t 1
where ( x i s , y i s ) are the source coordinates of the input image U that define the sample points of G s ; ( x i t , y i t ) are the target coordinates of the regular grid G in the output image, V; and θ is the coefficient of the transformation matrix.
Notice that the transformation matrix has an inverse. By taking the inverse and the input image, it is possible to obtain the values of the pixels in the output image.
Finally, the sampler module applies the spatial transformation by taking the sampling grid G s and the input image U, to produce the transformed image V. To obtain the value of each pixel of V when there is no direct correspondence with the input image pixels, it applies an interpolation based on these 2 inputs.
In Figure 2, we can see an example of how the STN transforms an input image.
The transformed image passes to the classification network, usually a CNN or an MLP. Both the spatial transformer and classification networks are complementary and their combination ensures the sufficient utilization of both global and local features to solve the recognition problem.
In this work, we use a compacted STN architecture with few convolutional and fully connected layers, similar to the one reported in [5], as their results indicate that these small networks can solve Facial Emotion Recognition problems with relatively high accuracy. In Appendix B, we summarize our architecture with the input layers, the expected output size, and the filters and strides used for the convolutional layers and max-poolings.
Unlike in classic STN which receives the same image at the input of the localization network and the sampler, we examine the effect of adding an extra module, the mask generator, that changes the input that receives the localization network by a mask. More specifically, we evaluate whether precomputed masks that contain information about the relevant areas to focus on may improve the performance of the classic STN. In Figure 5, we can see a picture of what we have just explained. Additionally, we also study the effect of adding the mask generator at the input of the sampler too, as it depicts the Figure 6.

4. Experiments

With the idea of improving the performance of Spatial Transformers Networks for Facial Emotion Recognition tasks, we train a simple CNN with an STN with our mask generator module to predict valence. We evaluate our proposals on 2 datasets: AffectNet and FER-2013.
In this section, we will explain the 4 types of experiments performed, we will also detail the setup, including the validation and the training parameters.

4.1. Experiments Description

Regarding the experiments, we implement 2 initial models: the first one is a CNN without the STN and the second includes a conventional STN into the simple-CNN. These experiments are the baseline to evaluate our proposals.
In the second round of experiments, we will check the performance of the STN with our proposed module, the “Mask Generator”.
In this section, we describe the experiments, the corpora used during the analysis, and the configured training and validation parameters.

4.1.1. Simple CNN

This first experiment consists of a classification network exclusively, without the STN. We did this experiment to confirm whether adding the attention mechanism could help to achieve better recognition rates or not. Lower or similar scores would indicate that increasing the complexity of the model, adding the STN, does not provide any benefit. Besides, this experiment also establishes a baseline to analyze the improvements that our proposal can achieve. In Figure 3, we can see the classification network used in this experiment.

4.1.2. Baseline STN

As a second benchmark to compare the improvements introduced by our proposals, we implemented a conventional ST, which receives a unique image at the input of the Localization Network and the Sampler, as we can see in Figure 4.
This experiment lets us understand our contribution by comparing the performance of the conventional STN with our versions using the Mask Generator.

4.1.3. STN with Mask Generator at the Localization Network

This section groups the experiments performed with 5 of the 7 masks introduced in Section 3.1: the landmarks-based binary masks, the landmarks-based soft masks, the landmarks-based dilated binary masks, and the visual saliency based masks.
This family of experiments combines the Spatial Transformer with the classification network, as we can see in Figure 5. In each experiment, the Mask Generator creates a mask that passes to the localization network. The localization network learns the transformation parameters from this image and sends them to the sampler. The sampler receives the θ parameters and the original image as inputs and returns the transformed version of the original image.
This transformed version, that focuses on the most relevant parts emphasized by the mask, feeds the classification network.
The main difference of this experiment with the conventional STN (Baseline STN) is that we inject the generated masks to the localization network instead of the original image. As the masks contain a simpler but more informational version of the image, it is expected that the mask approaches achieve higher accuracy than the baseline. In Section 5, we compare the results got by these strategies.

4.1.4. STN with Mask Generator at the Localization Network and Sampler

For this group of experiments, we employ an additional Mask Generator at the input of the Sampler. The first generator always produces the landmarks-based binary masks, introduced later into the Localization Network. The second Mask Generator creates Landmarks-based facial patches and Landmarks-based image weighing masks that feed the sampler.
With these 2 experiments, we try to answer the following questions:
  • Is it possible to solve the Facial Emotion Recognition task only from the most relevant patches of the original image?
  • Would the classification network be able to extract information from an image with embedded knowledge?
To answer the first question, we changed the input of the sampler to the landmarks-based facial patches. These images remove superfluous information and maintain the values of the original image for the eyebrows, eyes, nose, and mouth. This experiment appears represented in Figure 6.
To address the second question, we feed the Sampler with the landmarks-based image weighing. This mask maintains all the contextual information of the original image and overlaps the landmarks’ knowledge about the relevant points on an image for detecting emotions.
Notice that, in this case, the transformed version of the mask generated at the output of the sampler passes to the classification network, so this CNN will need to extract information from the patches or weighted images to solve the Facial Emotion Recognition task.

4.2. Datasets

In this work, we employ 2 common corpora for emotion recognition: AffectNet [11] and FER-2013 [12].
  • AffectNet: AffectNet is one of the largest datasets available for visual emotion recognition in the wild. It contains approximately 450,000 images divided into 11 non-equally distributed categories: ‘Neutral’, ‘Happy’, ‘Sad’, ‘Surprise’, ‘Fear’, ‘Disgust’, ‘Anger’, ‘Contempt’, ‘None’, ‘Uncertain’, and ‘Non-Face’. Besides the emotional label, each image also has its arousal and valence annotated in the range from −1 to 1. The only categories that do not include these annotations are ‘Uncertain’ and ‘Non-Face’. To adapt the annotations to our task and facilitate compatibility between datasets, we divide the valence axis into 3 regions. The first region, which goes from valence 1 to 0.2, represents positive emotions. The second region ranges from 0.2 to −0.2, and it is considered the region of neutral valence. The third group contains the images with valence lower than −0.2, which receives the negative valence label. In total, our new subset contains 325,239 images. In Figure 7, we can see the final distribution of images per class. As the plot shows, the subset is non-balanced, having more positive images than negative or neutral.
  • FER-2013: The Facial Expression Recognition 2013 database contains 35,887 grayscale images with a resolution of 48 × 48 pixels. This dataset was collected using Google by requesting images associated with key emotional terms. The downloaded images were filtered for rejecting repeated samples and resized. Accordingly to the key term used in the query, each image was assigned to one of the following categories: angry, disgust, fear, happy, sad, surprise, and neutral.
    One of the major difficulties of this dataset is the different nature of the images as they can contain different poses, occlusions, blurring, and other artifacts, which makes the recognition a challenging task. Again, we need to distribute the images into the same 3 label levels to homogenize both datasets.
    Unlike what we did with AffectNet, in this dataset, we do not have the valence annotations. For this reason, and following the theories of J.Posner and J. Rusell [20], we assigned the positive valence to those images categorized as ’happy’, the neutral valence to the ’neutral’ images, and the rest of the samples to the negative valence set. Those images tagged as ’surprise’ were excluded from the groups since this emotion can represent positive or negative valences, depending on the situation. In total, the new subset contains 31,885 images over the original size of 35,887. In Figure 7, we can see the distribution of the labels.

4.3. Evaluation and Training Parameters

We evaluate our results following a 5-fold cross-validation strategy in both datasets. The division in folds was random and stratified, i.e., each fold has a similar number of samples per class randomly selected.
Concerning the training configuration and hyperparameters, we chose a batch size of 128 samples and a maximum number of training epochs of 500. To avoid overfitting, we also implemented an Early-Stopping strategy to finish the training when the validation accuracy did not improve in 30 iterations. Regarding regularization, we only used dropout with a 0.5 probability.
As we are solving an unbalanced classification task, we utilized the weighted cross-entropy loss implemented in PyTorch [38].
To optimize this objective function, we employed an Adam optimizer with a learning rate of 0.001 as it achieves faster convergence than other optimizers such as Stochastic Gradient Descent.
Regarding the metrics used to compare the results, we computed the average accuracy over the 5 folds. We also included a confidence interval to evaluate the significance of our methods and compare scenarios.
As we will see in the next section, all the strategies start the training from a random initialization of the weights, ’from scratch’, except for the results reported in Section 5.2, in which we conduct transfer learning using pre-trained weights on AffectNet.

5. Results

5.1. Evaluation of Strategies on AffectNet

Table 1 shows the valence recognition rates obtained on AffectNet dataset.
ZeroR is the simplest classifier that relies on the target and always predicts the majority category (class). Although there is no predictability power in ZeroR, it is appropriate for determining a baseline performance as a benchmark for the other classification methods.
The ‘Simple CNN’ experiment beats the ZeroR rates, demonstrating that the proposed architecture is suitable for solving the task and evidencing a learning process. However, this result is significantly lower than the obtained when we add the Spatial Transformer, called Baseline-STN in the Table 1, which confirms that including this mechanism improves the accuracy.
The rest of the results with a single mask generator get higher accuracies than the ‘Baseline-STN’. These outcomes suggest that feeding the localization network with any of the landmarks strategies (binary masks, soft masks, and dilated masks) or saliency maps helps the attention mechanism to focus on the most relevant areas, which provokes a growth in the recognition accuracy.
It is especially interesting the case of the ‘STN with landmarks—soft masks’ because its result surpasses in a significant statistical way the accuracy achieved by the ‘Baseline STN’. For this reason, we can conclude that this proposal seems to be the best option to train the Spatial Transformers, despite the misdetected faces.
Although soft masks and dilated masks pursue the target of improving the binary mask version, only the soft mask leads to competitive results, with an average accuracy of 70.72%. This rate is 0.19 points higher than the dilated masks, 0.15 points superior to the binary landmarks, and 0.35 points better than the ‘Baseline STN’.
For the dilated masks, the results may indicate that increasing the size of the strokes introduces redundant information that is not convenient to learn the most relevant regions on an image. This strategy seems to maintain the drawbacks of the saliency and landmarks strategies. On the one hand, it misdetected the same faces as in the landmarks strategy. On the other hand, it also loses definition on the relevant areas, similar to what happens in the saliency maps. The combination of both effects concludes with an accuracy rate comparable to the landmarks-based binary masks; however, the dilated masks require more processing efforts to be generated.
The last strategy of this family to analyze is the mask-based saliency. In this case, the result also improves compared to the conventional STN by 0.23 points. This outcome implies that when landmarks or ground truth of the most relevant regions on the image are not available, we can still guide the learning of the localization network using the saliency maps and improve the performance of conventional STNs.
If we compare the saliency with the ‘STN with landmarks—soft masks’ model, the saliency maps are 0.1 points under the accuracy of the best landmark-based strategy. Despite reaching a lower performance in this task, saliency maps are still a powerful option as current saliency predictors are trained to extract saliency maps from almost any object, not only faces. This generic knowledge offers the possibility of applying this strategy in other domains without the necessity of a tailored landmarks extractor.
Regarding the method to deal with faces misdetected by the facial detector, we can see that the best option is version 3.
Changing the white images (v1) by saliency maps (v2) does not improve the final accuracy, probably because for AffectNet the number of lost faces was not too large, a 1.6%, or because training the STN with landmarks and saliency maps introduce some noise during the learning process because of the use of different ways of representing the information. The third version that relied on predictions of the STN trained with saliency maps for those cases improves the accuracy slightly, but it still does not surpass the results obtained by the STN trained with saliency masks. This tendency is also observed in the results for the FER-2013 dataset in Table A1.
Apart from the accuracy, we can also analyze the number of epochs that the models take until they converge. Comparing the results, the STN with dilated masks is one of the best in terms of epochs to converge as it takes 31 fewer epochs on average than the ‘Baseline STN’ method but increases the accuracy by 0.16 points. In second place, we have the rest of the landmark-based models that converge in around 20 fewer epochs than the ‘Baseline STN’, and in the third position is the ‘STN with saliency masks’ that takes 19 iterations more than the conventional STN.
As additional tests, we also performed separate experiments with 2 mask generators, one at the input of the Localization Network and the other before the Sampler, as we described in Section 4.1.4.
The first experiment, that passes patches masks to the sampler, did not surpass the results of the ‘Simple-CNN’. The main hypothesis of this low performance is that patches do not carry enough information for solving an emotion recognition task, which causes a reduction of the accuracy.
Regarding the second experiment using weighted masks, the performance is similar, but the reason for this low accuracy is likely different. We believe that in this case, the network is not capable of learning emotions because when we incorporate additional information into the image, we also break its regular patterns, which may cause errors during the training. Additionally, for the cases where the landmarks are incorrectly detected, the combined image could draw incoherent information.
If we compare both strategies, the best would be the weighted version because it still maintains all the information of the original image and the landmarks, although softened. However, neither of them could be considered a suitable option to improve the performance of a conventional STN.

5.2. Transfer-Learning on FER-2013

We applied the most competitive strategies used in AffectNet for the dataset of FER-2013. Although the task to solve is essentially the same, the conditions are more challenging in this dataset.
The first difference with AffectNet is that the original size of the images in FER-2013 is 48 × 48. The reduced resolution of these images makes it more problematic to detect faces to extract landmarks. A number that supports this statement is the amount of misdetected faces in each dataset. In AffectNet, we lost only 1.6% of the faces, whereas in FER-2013, we have 13.57% of misdetections. Another handicap of this dataset is the variety of data as there are images without faces, with cartoons, occlusions, etc. The reader can find a more detailed analysis of errors in the Appendix C.
Nonetheless, we decided to use it to discover if our methodology also works under challenging conditions. As we can see in Figure 8, the saliency-mask strategy reaches a statistically significant accuracy compared to the ‘Baseline-STN’. The landmark-based strategies overpass the baseline model and follow tendencies similar to the experiments with AffectNet although they did not achieve statistically significant results probably because of the limited amount of evaluation data and the increment in the number of misdetected faces.
Comparing the green results with the red results of Figure 8, we can conclude that the use of pre-trained weights on AffectNet benefits all the models, especially the STN trained with saliency maps. This saliency-based model gets an increment of 1.08 points compared to its version trained ‘from scratch’. It seems that TL alleviates the reduced size of the dataset and enlarges the performance gap between our proposals and the baseline.
In general, the performance of our models for this second dataset also demonstrates certain robustness as the accuracy of the landmarks-based models does not decrease in a relevant manner despite losing approximately 14% of the training images. More interesting are the results obtained with the saliency-based model. This strategy beats all the landmark versions, enhancing the advantage of this method that always returns a saliency map, facilitating the functioning of the Spatial Transformer to learn the relevant regions on the image.

6. Conclusions

STN strategies have been confirmed to be more effective than CNN for solving Facial Emotion Recognition tasks. Based on these models, we appended a mask generator module into a conventional STN. This proposal reaches higher accuracy rates, enhancing the suitability of landmarks and saliency masks to improve the learning of the Localization Network, and thus the performance of the STNs.
The reason for this accuracy improvement compared to existing STNs relies on introducing more specific information to the attention mechanism, extracted from powerful pre-trained models that generate the saliency maps or the landmarks. The localization network receives these filtered images that contain the most relevant regions emphasized.
These images with emphasized regions help the attention mechanism to concentrate only on those relevant regions to transform the original image. As a result of this transformation, the classification branch sees a filtered image without unnecessary material to solve the Facial Emotion Recognition task. For this reason, in the results, we have observed an improvement in most of our strategies compared to traditional STNs.
From the different strategies tested for Facial Emotion Recognition tasks, the landmark-based methods with soft masks achieved the best performance on the AffectNet dataset, beating to the conventional STNs.
On FER-2013, the landmark-based masks also achieved good results, but the saliency maps surpassed all the other strategies, including the Baseline-STN. In this case, all the versions trained applying transfer learning from the learned weights on AffectNet demonstrated better performances. These results suggest that the models trained on AffectNet are robust enough for being used in other datasets.
Notice that there is a performance difference between AffectNet and FER-2013. The main reason for this difference may be the nature of the datasets and their initial distribution. AffectNet has a ZeroR of 49.26% against the ZeroR of FER-2013 that reaches a value of 52.37%. This difference explains why the models trained with FER-2013 achieved higher accuracy rates. Another important difference between datasets is the separation of our best model compared to the baseline STNs. In the case of AffectNet, this difference is 0.35% against the 1.49% reached in FER-2013. These results could be explained by the number of samples of the datasets and the resolution of their images. AffectNet contains more images with good quality and resolution, whereas FER-2013 has fewer images taken in more challenging conditions. Results seem to indicate that our proposals are more competitive for complex scenarios where the number of samples is limited. This result is coherent as in our strategies the STN only has to learn from the filtered masks (landmarks or saliency maps) and not from the complete image that is more complex and the localization network requires more samples to discover and learn patterns.
In conclusion, landmark-based strategies are the best option in the absence of ground truths of the most relevant regions, considering that landmarks represent tailored information about the regions of interest. However, when landmarks are not available or the quality of the images is low, we can also employ the saliency maps. Saliency maps have also achieved high accuracy rates in the experiments and, moreover, there are numerous general purpose saliency predictors [36,39] that could be used directly or re-trained for a new task, without the necessity of having the landmarks. These facts suggest that the method based on saliency maps could scale well to other computer vision tasks.
Regarding the analysis of errors, we detected that when the number of lost faces is close to 14%, the landmark-based versions are less efficient than the saliency-based. The misdetected faces could happen due to several factors as occlusions, illumination conditions, resolution of images, quality, presence of several faces, rotations, etc. In future versions, we will consider these sources of error to reduce their contribution to the recognition rate.
Other sources of errors in our models come from the distinction between emotions, as in ’Happy’ and ’Contempt’. They share similar patterns but their valences are opposed. For these cases, one solution will be to evaluate models with higher resolution images at their input, or to train customized models to distinguish between these 2 emotions to reduce the confusion between them.
As future lines, we also plan to apply these strategies to other fields to confirm the generalization capacity of these solutions. Additionally, we will study the possibility of developing different Spatial Transformers to focus on the eyes, nose, and mouth to extract information from each region and combine them in a posterior step. Furthermore, we reckon on exploring architectures with more layers to see if the network still benefits from the attention mechanism or not. Finally, we will extend our study to improve the landmark solutions when the face is not detected.

Author Contributions

Conceptualization, C.L.-J., R.K., M.G.-M. and F.F.-M.; Data curation, C.L.-J., J.C.-M. and R.K.; Formal analysis, C.L.-J. and F.F.-M.; Funding acquisition, M.G.-M., J.M.M. and F.F.-M.; Investigation, C.L.-J., J.C.-M., R.K. and F.F.-M.; Methodology, C.L.-J., J.C.-M., R.K. and F.F.-M.; Project administration, M.G.-M., J.M.M. and F.F.-M.; Resources, M.G.-M. and F.F.-M.; Software, C.L.-J. and J.C.-M. and R.K.; Supervision, M.G.-M., J.M.M. and F.F.-M.; Validation, C.L.-J. and J.C.-M.; Visualization, C.L.-J. and J.C.-M.; Writing—original draft, C.L.-J. and J.C.-M.; Writing—review and editing, C.L.-J., R.K. and F.F.-M. All authors have read and agreed to the published version of the manuscript.

Funding

The work leading to these results has been supported by the Spanish Ministry of Economy, Industry and Competitiveness through the CAVIAR (MINECO, TEC2017-84593-C2-1-R) and AMIC (MINECO, TIN2017-85854-C4-4-R) projects (AEI/FEDER, UE). Also, R.K.’s research was supported by the Spanish Ministry of Education (FPI grant PRE2018-083225).

Institutional Review Board Statement

Ethical review and approval were waived for this study, because the datasets used are accessible under request for research purposes or open-accessed under ’Open Database License’ and the authors of this work were adhered to the terms of the license agreement of the first dataset.

Informed Consent Statement

Subject consent was waived because the datasets used are accessible under request for research purposes or open-accessed under ’Open Database License’ and the authors of this study were adhered to the terms of the license agreement of the datasets.

Data Availability Statement

All the code implemented for this publication is available at https://github.com/cristinalunaj/Guided-EMO-SpatialTransformer, accessed on 2 August 2021. The AffectNet database used in this paper is available under request from http://mohammadmahoor.com/affectnet/, accessed on 27 July 2021. This database is available only for research and educational purpose and not for any commercial use. FER-2013 is open-access and can be downloaded from https://www.kaggle.com/msambare/fer2013, accessed on 27 July 2021.

Acknowledgments

We gratefully acknowledge the support of NVIDIA Corporation with the donation of the Titan X Pascal GPU used for part of this research.

Conflicts of Interest

The authors declare no conflict of interest.

Abbreviations

The following abbreviations are used in this manuscript:
STNSpatial Transformer Network
CNNConvolutional Neural Network
MTCNNMulti-task Cascaded Convolutional Networks
FER-2013Facial Expression Recognition 2013 database
GANGenerative Adversarial Networks
TLTransfer Learning

Appendix A. Complementary Material of the Results

Figure 1 represents the mean accuracy and the confidence intervals of the results obtained on AffectNet for the evaluated strategies.
Figure A1. Quantitative evaluation of the different strategies on AffectNet. In black is the average accuracy of the 5-folds CV; in red, the confidence intervals. Plot of the Table 1 without the v2 and v3 of the binary-based mask strategies.
Applsci 11 07217 g0a1
Table A1 shows the numerical values returned in each experiment. It also includes the ZeroR performance to demonstrate that our proposals are convenient to solve the Facial Emotion Recognition task.
Table A1. Quantitative evaluation of the most relevant strategies on FER-2013 applying training from scratch against Transfer Learning.
Weights InitializationStrategyAccuracy ±
95% Confidence
Interval
From scratchZeroR52.37 ± 0.55
Baseline STN72.92 ± 0.48
STN with landmarks—binary masks v174.20 ± 0.48
STN with landmarks—binary masks v269.99 ± 0.50
STN with landmarks—binary masks v374.38 ± 0.48
STN with landmarks—soft masks73.64 ± 0.48
STN with saliency masks74.93 ± 0.48
Transfer-Learning
using AffectNet weights
Baseline STN74.52 ± 0.48
STN with landmarks—binary masks v174.69 ± 0.48
STN with landmarks—binary masks v274.26 ± 0.48
STN with landmarks—binary masks v375.18 ± 0.48
STN with landmarks—soft masks74.90 ± 0.48
STN with saliency masks76.01 ± 0.47

Appendix B. Architecture Layers and Dimensions

Table A2. Layers of the implemented Spatial Transformer Network.
Branches
of the Model
Input LayerOutput SizeFilter Size/StrideDepth
InputInput Image48 × 48 × 1--
Localization
Network
Convolution-2D42 × 42 × 87 × 7/18
MaxPooling-2D21 × 21 × 82 × 2/2-
Relu21 × 21 × 8--
Convlution-2D17 × 17 × 105 × 5/110
MaxPooling-2D8 × 8 × 102 × 2/2-
Relu8 × 8 × 10--
Fully-Connected640--
Fully-Connected32--
Relu32--
Fully-Connected ( θ )6--
InputTransformed Image48 × 48 × 1--
Simple-CNNConvolution-2D46 × 46 × 103 × 3/110
Relu46 × 46 × 10--
Convolution-2D44 × 44 × 103 × 3/110
MaxPooling-2D22 × 22 × 102 × 2/2-
Relu22 × 22 × 10--
Convolution-2D20 × 20 × 103 × 3/110
Relu20 × 20 × 10--
Convolution-2D18 × 18 × 103 × 3/110
Batch Normalization18 × 18 × 10--
MaxPooling-2D9 × 9 × 102 × 2/2-
Relu9 × 9 × 10--
Dropout (p = 0.5)9 × 9 × 10--
Fully-Connected810--
Fully-Connected50--
Relu50--
Fully-Connected3--

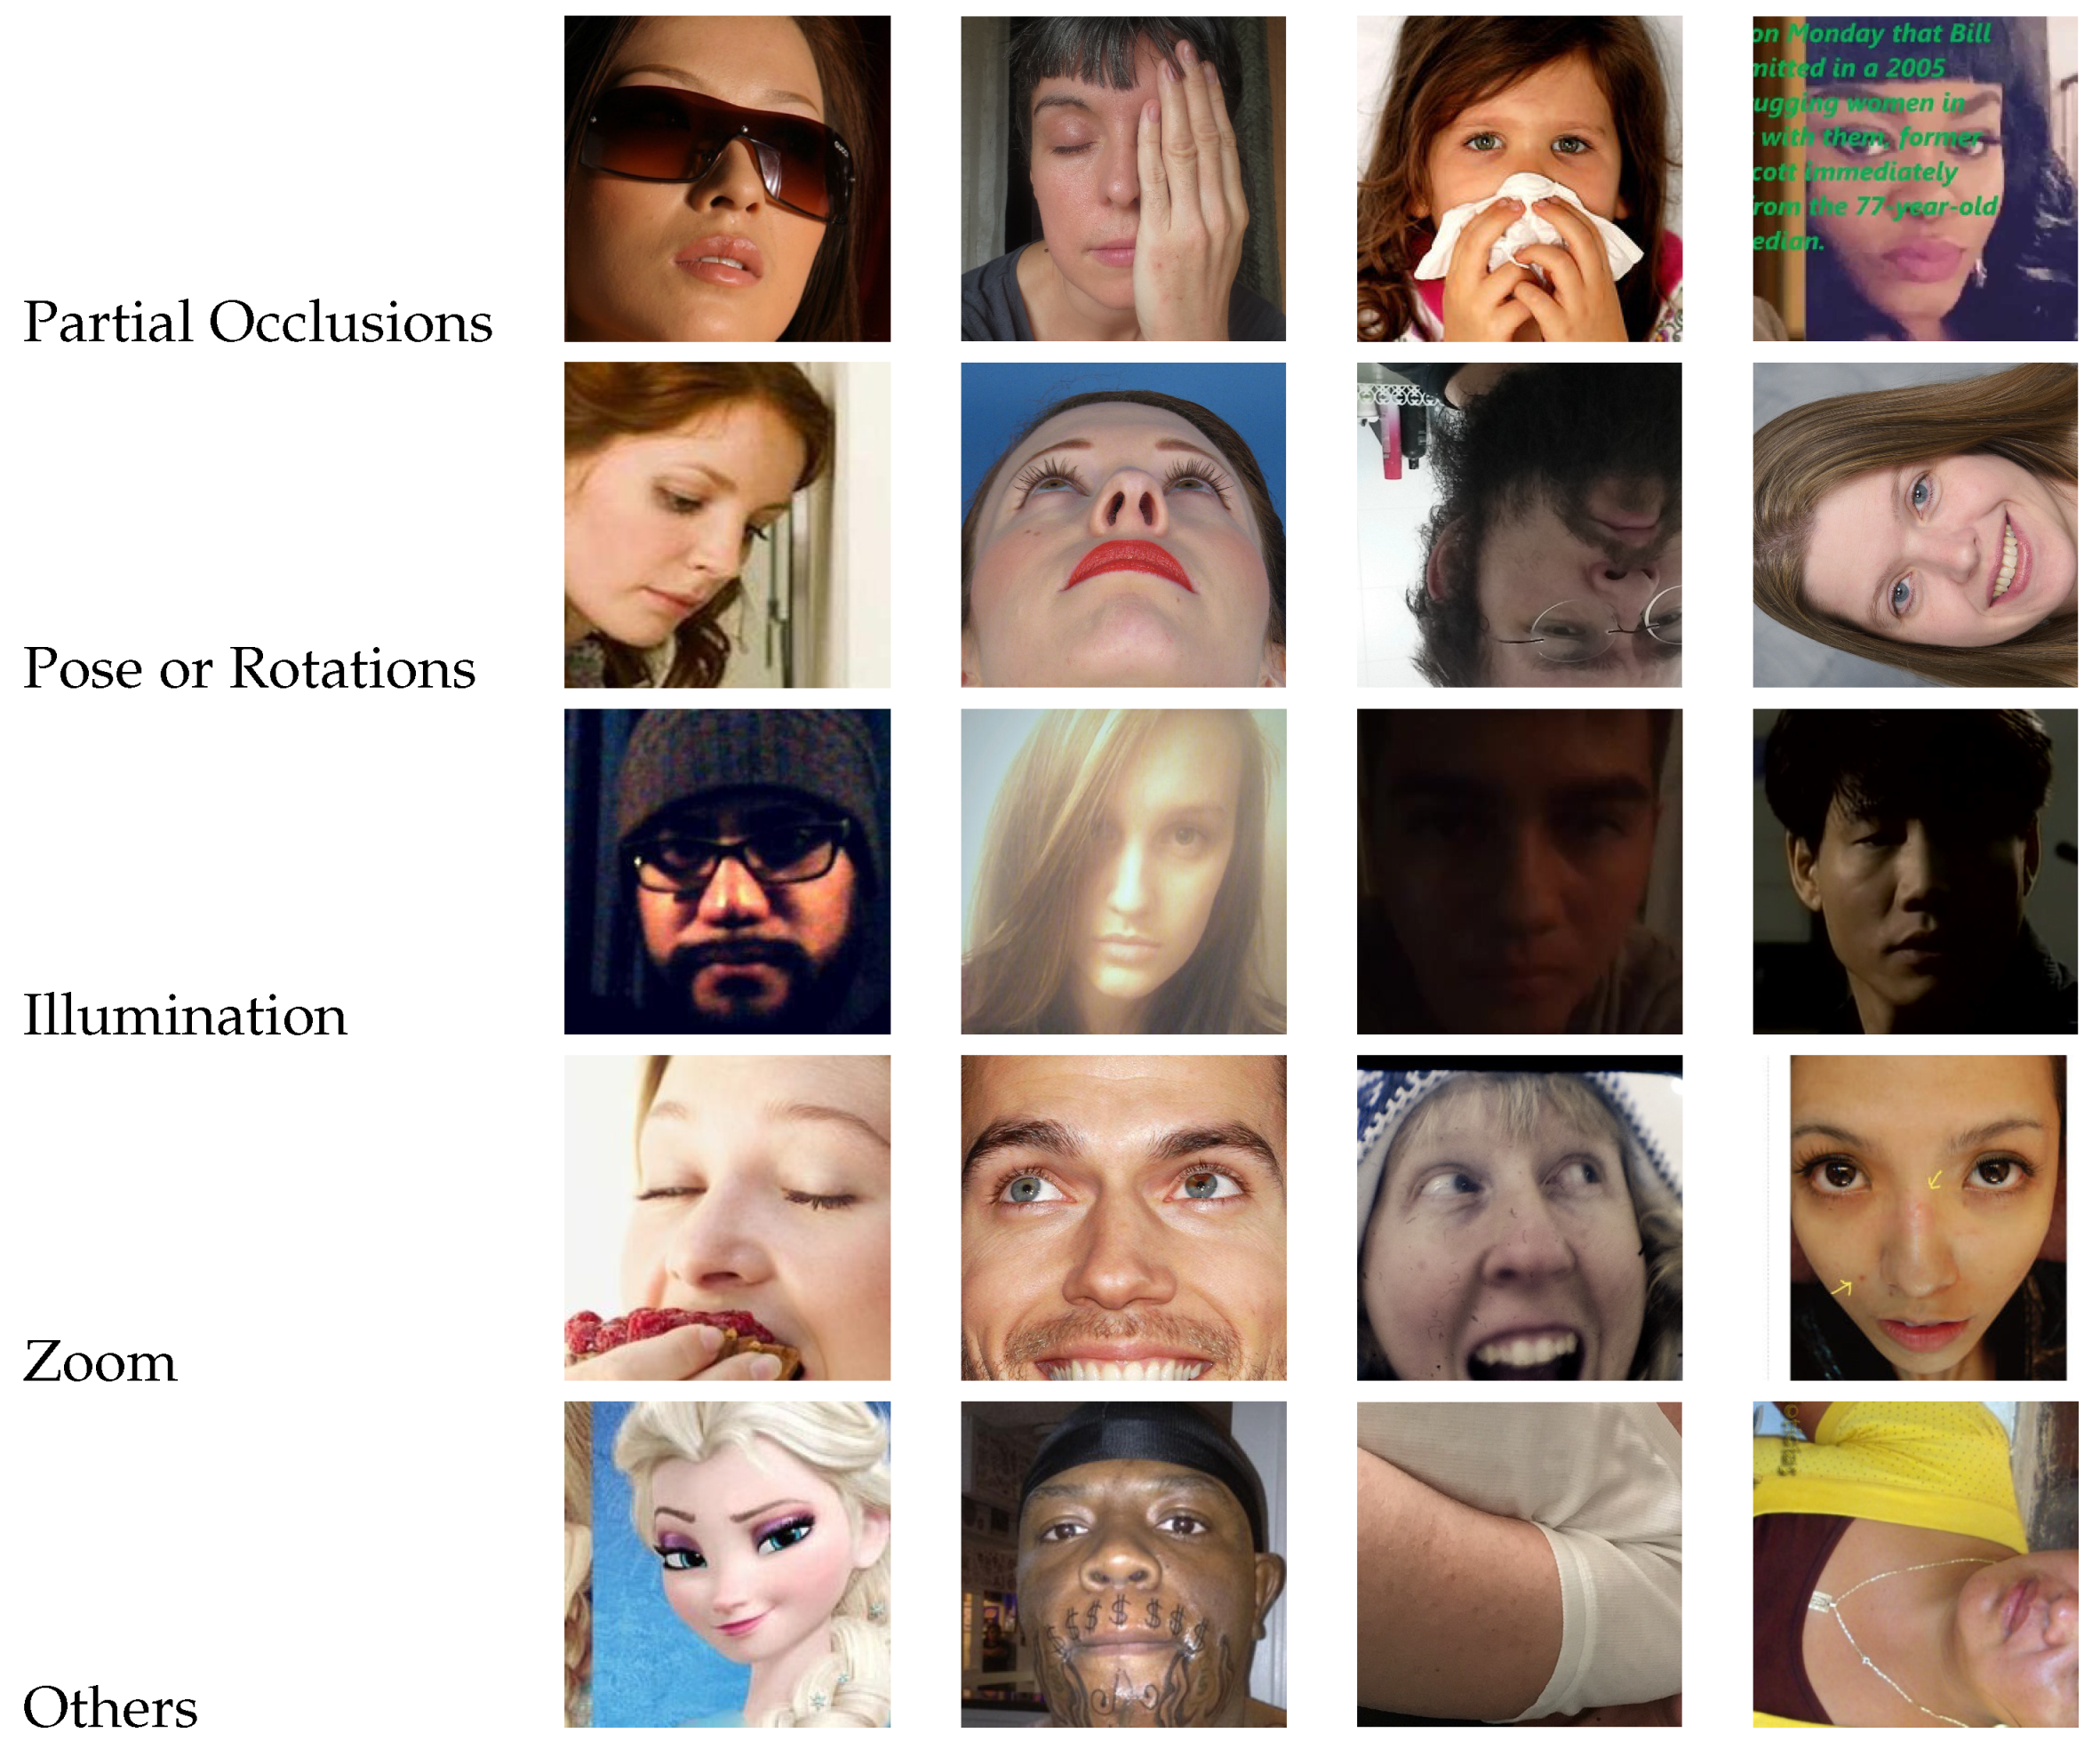
Appendix C. Analysis of Errors

In this section, we will analyze the errors introduced by the face detector and by our models to detect defects and propose solutions for future versions.

Appendix C.1. Errors Due to Facial Detector

Both AffectNet and FER-2013, are two datasets commonly used in the literature for Facial Emotion Recognition. However, both contain some challenging images that may affect the recognition rate.
One of the first tests to detect complex images is to understand the outputs of the facial detector. In our case, the MTCNN detector fails in 1.6% of the images for AffectNet and 13.57% for the FER-2013 dataset. Some samples of the misdetected faces appear in Figure A2 and Figure A3. We have arranged the type of errors into 4 groups that may cause the miss-detections: the presence of occlusions, extreme poses or rotations, poor illumination conditions, and too much zoom. On the row of ’Others’, we have included samples in which there are no faces, there are cartoons or the faces contain some peculiarities as tattoos. This last group is a minority but it is still important to understand the difficulties of the task and why the facial detector fails.
Some of these misdetections may cause errors in the emotion recognizer too. Analyzing the matches between the errors of the ‘STN with landmarks—soft masks’ strategy and the misdetected faces by MTCNN, we see that in AffectNet from the 1.6% of the lost faces, the 42.10% are incorrectly classified by the model. For FER-2013, this error rate represents the 26.14% of the 13.57% miss-detections.
To decrease the errors due to wrong images on the datasets, we could try to detect and remove the images without faces, as some examples under the ’Other’ row. Detecting them and training the models without them probably would improve our results since these images introduce noise during the learning.
For the occlusions, illumination, etc. we could test other facial detectors trained on these conditions or create a new model to learn emotions on these conditions. For this case, we should use another dataset with more images that represent these situations.
Figure A2. Samples of miss-detected faces on AffectNet by the STN with landmarks—soft masks model.
Applsci 11 07217 g0a2
Figure A3. Samples of miss-detected faces on FER-2013 by the STN with landmarks—soft masks model. TL version.
Applsci 11 07217 g0a3

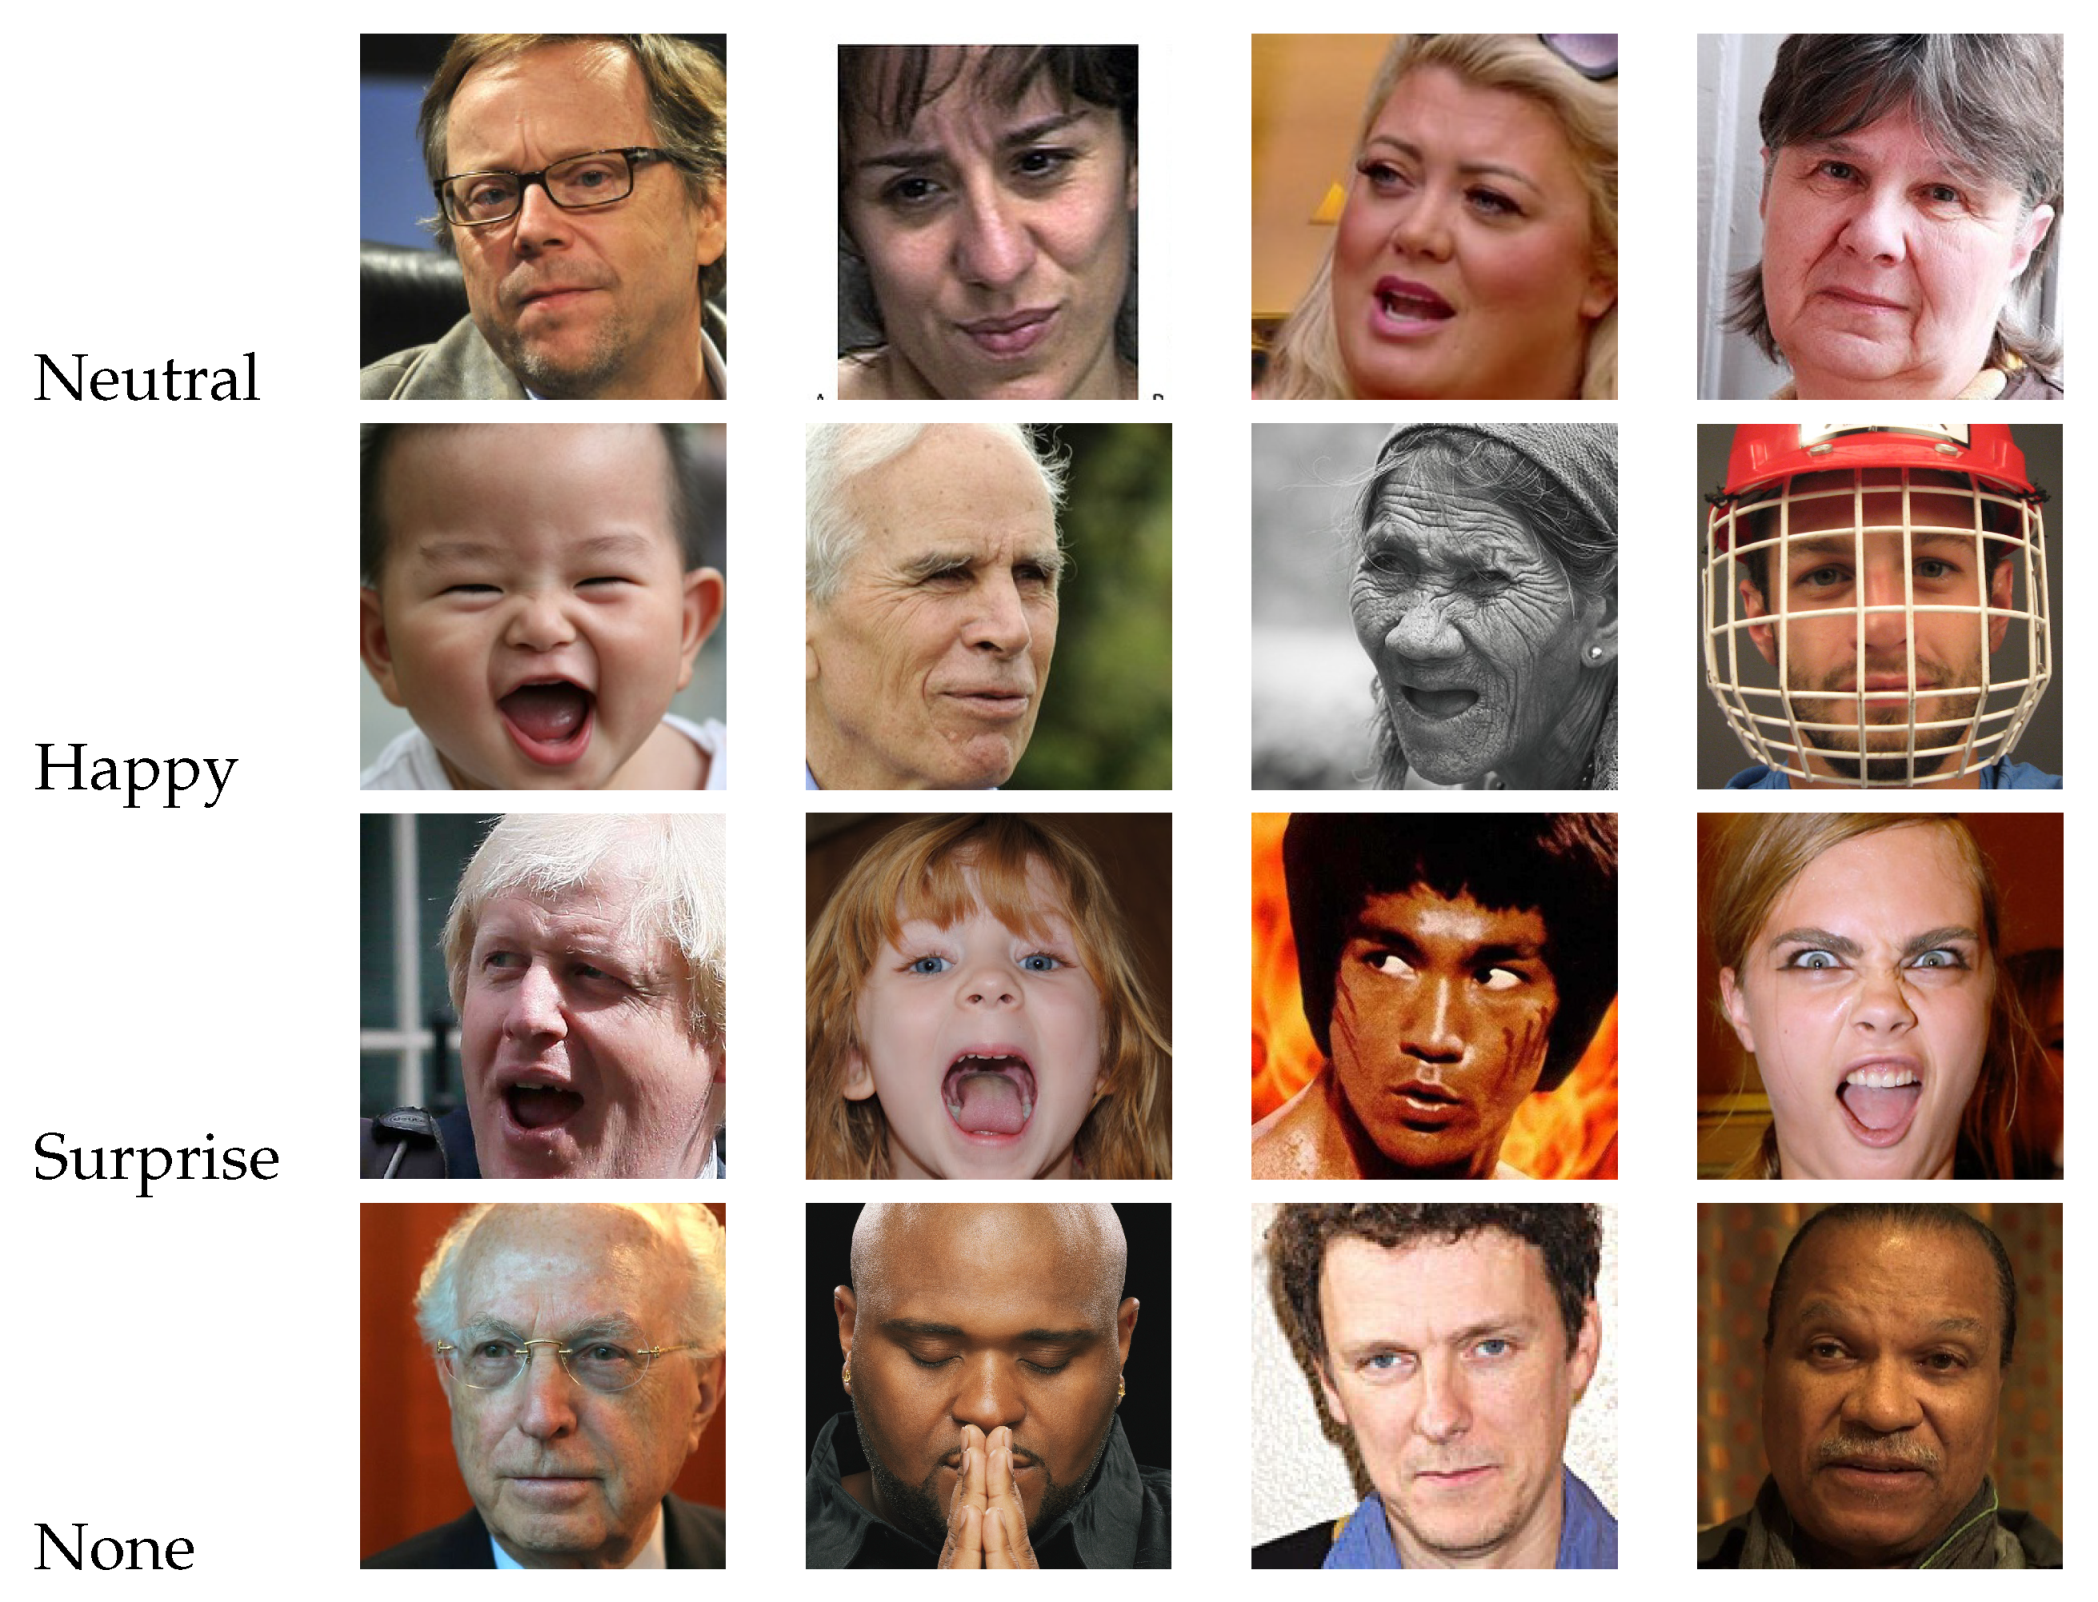
Appendix C.2. Most Common Errors across Emotions

To apprehend the limitations of our models, we accomplish an investigation to distinguish the most distanced errors in terms of their valence values. These errors are those labeled as positive but predicted as negative, and those annotated as negative but predictive as positive.
As both datasets have annotations of the emotions, we do this analysis across emotions. Instead of analyzing a specific strategy, we consider the most failed images by the following STN models: Baseline STN, STN with landmarks (binary, soft, and dilatation), and saliency. These erroneous images should inspire future versions of the models and the set-up to reduce the number of failed samples.
Starting with AffectNet, we can see in Table A3 that most of the misclassified images correspond to the contempt category. Checking some of the contempt images in Figure A4 give an intuition about what may be happening. It seems that our models are confusing ’Happiness’ with ’Contempt’. This mistake is understandable since both emotions share common patterns, but in AffectNet ’Contempt’ images are assigned to a strong negative valence, in average this class has a valence of −0.51 in the annotations.
The second emotion most mistaken corresponds with ’Sad’. We can see in Figure A4 that some of the pictures show people crying because of the emotion but not because they feel sad. These images could also confound the model since they contain information from two different emotions.
From Figure A4, we can see that in most samples people are smiling or showing their teeth. This common characteristic makes us think that the systems are learning more information from the mouth than other parts of the face, which could be reasonable because of the resolution of the images and the importance that the mouth has.
Table A3. Samples predicted as positive but with negative label. Common errors on AffectNet of models: Baseline-STN, STN with landmarks (binary and sof masks) and STN with saliency.
NeutralSadSurpriseFearDisgustAngerContemptNone
fold 135136395710231671
fold 24814132709934257
fold 33812524748230657
fold 43714227758731758
fold 533127256710936461
Total19167112273434791.645304
Figure A4. Samples predicted as positive but with negative label. Examples of the most negative valence images incorrectly classified.
Applsci 11 07217 g0a4
Regarding the negative predictions for real positive valence, we can see in Table A4 and Figure A5 some of the common wrongs recognized pictures by our models.
If we focus on the most numerous group, that correspond with the ’Happy’ category, there are several reasons that may explain the errors committed. One cause may be the occlusions. A second reason could be the age difference since ancient people and babies express their emotions differently because of the morphology of their faces. Although both datasets do not contain annotations about age ranges, the under-representation of some of them could be introducing a bias in our models.
Concerning ’None’ images, they represent different emotions what makes this group especially challenging. In fact, the standard deviation of valence annotations of this group is 0.40 against the other emotional categories whose deviation varies between 0.07 and 0.22. Introducing this group in the training and evaluation may have altered the learning process since annotations are not as clear as for other categories. Still, it is interesting to have it because it is closer to ’in the wild’ environments.
From this analysis, we draw several conclusions. The most important is related to the resolution of the images. In future versions, we will evolve our architecture to work with higher-resolution images. In this way, we could investigate if the image size is influencing the performance of the models. Second, we will study the distribution by ages of the dataset to consider training different emotion recognizers for different ranges of ages. Finally, we will develop a new experiment with and without the images under the ’None’ category to study how their inclusion influences the predictions of the other emotions.
Table A4. Samples predicted as negative but with positive label. Common errors on AffectNet of models: Baseline-STN, STN with landmarks (binary and sof masks) and STN with saliency.
NeutralHappySurpriseNone
fold 13720448177
fold 21918146136
fold 32616248142
fold 42718652145
fold 53721848148
Total146951242748
As we discussed in our experiment of the ’STN with weighted masks’, non-natural patterns on images damage the networks’ learning. As we can observe in Figure A6 and Figure A7, some of the samples incorrectly classified of the FER-2013 dataset contain watermarks or images with occlusions. The low quality of some images could explain part of the errors. Others may be caused by the same reason that we discussed with AffectNet results, age may introduce a bias, as well as some deviated annotations due to the complexity of the images, so the strategies to follow are the same that we commented before. In Table A5 and Table A6 we can see some of the most failed samples in terms of emotions.
Figure A5. Samples predicted as negative but with positive label. Examples of the most positive valence images incorrectly classified.
Applsci 11 07217 g0a5
Table A5. Samples predicted as positive but with negative label. Common errors on FER-2013 of models: Simple-CNN, Baseline-STN, STN with landmarks (binary and soft masks), and STN with saliency.
SadFearDisgustAnger
fold 11912012
fold 21216114
fold 31114121
fold 41215117
fold 51520014
Total6977378
Figure A6. Samples predicted as positive but with negative label. Examples of images incorrectly classified on FER-2013.
Applsci 11 07217 g0a6
Table A6. Samples predicted as negative but with positive label. Common errors on FER-2013 of models: Simple-CNN, Baseline-STN, STN with landmarks (binary and soft masks), and STN with saliency.
Happy
fold 168
fold 267
fold 365
fold 452
fold 568
Total320
Figure A7. Samples predicted as negative but with positive label. Examples of images incorrectly classified on FER-2013.
Applsci 11 07217 g0a7

References

  1. Krizhevsky, A.; Sutskever, I.; Hinton, G.E. ImageNet Classification with Deep Convolutional Neural Networks. Commun. ACM 2017, 60, 84–90. [Google Scholar] [CrossRef]
  2. Yu, Z.; Zhang, C. Image Based Static Facial Expression Recognition with Multiple Deep Network Learning. In Proceedings of the 2015 ACM on International Conference on Multimodal Interaction; Association for Computing Machinery: New York, NY, USA, 2015; pp. 435–442. [Google Scholar] [CrossRef]
  3. Jaderberg, M.; Simonyan, K.; Zisserman, A.; Kavukcuoglu, K. Spatial Transformer Networks. In Proceedings of the 28th International Conference on Neural Information Processing Systems, Montreal, QC, Canada, 7–12 December 2015; pp. 2017–2025. Available online: http://arxiv.org/abs/1506.02025 (accessed on 2 August 2021).
  4. Yu, J.; Wang, S. Visual Speech Recognition in Natural Scenes Based on Spatial Transformer Networks. In Proceedings of the 2020 IEEE 14th International Conference on Anti-Counterfeiting, Security, and Identification (ASID), Xiamen, China, 30 October–1 November 2020; pp. 1–5. [Google Scholar] [CrossRef]
  5. Minaee, S.; Minaei, M.; Abdolrashidi, A. Deep-Emotion: Facial Expression Recognition Using Attentional Convolutional Network. Sensors 2021, 21, 3046. [Google Scholar] [CrossRef] [PubMed]
  6. Bian, C.; Zhang, Y.; Yang, F.; Bi, W.; Lu, W. Spontaneous facial expression database for academic emotion inference in online learning. IET Comput. Vis. 2019, 13, 329–337. [Google Scholar] [CrossRef]
  7. de Visser, E.J.; Pak, R.; Shaw, T.H. From ‘automation’ to ‘autonomy’: The importance of trust repair in human–machine interaction. Ergonomics 2018, 61, 1409–1427. [Google Scholar] [CrossRef]
  8. Nyquist, A.C.; Luebbe, A.M. An Emotion Recognition–Awareness Vulnerability Hypothesis for Depression in Adolescence: A Systematic Review. Clin. Child Fam. Psychol. Rev. 2019, 23, 27–53. [Google Scholar] [CrossRef] [PubMed]
  9. Argaud, S.; Vérin, M.; Sauleau, P.; Grandjean, D. Facial emotion recognition in Parkinson’s disease: A review and new hypotheses. Mov. Disord. 2018, 33, 554–567. [Google Scholar] [CrossRef] [PubMed]
  10. Zepf, S.; Hernandez, J.; Schmitt, A.; Minker, W.; Picard, R.W. Driver Emotion Recognition for Intelligent Vehicles: A Survey. ACM Comput. Surv. 2020, 53. [Google Scholar] [CrossRef]
  11. Mollahosseini, A.; Hassani, B.; Mahoor, M.H. AffectNet: A Database for Facial Expression, Valence, and Arousal Computing in the Wild. IEEE Trans. Affect. Comput. 2019, 10, 18–31. Available online: https://arxiv.org/abs/1708.03985 (accessed on 2 August 2021). [CrossRef] [Green Version]
  12. Goodfellow, I.J.; Erhan, D.; Carrier, P.L.; Courville, A.; Mirza, M.; Hamner, B.; Cukierski, W.; Tang, Y.; Thaler, D.; Lee, D.H.; et al. Challenges in Representation Learning: A Report on Three Machine Learning Contests. Neural Inf. Process. 2013, 117–124. Available online: https://arxiv.org/abs/1307.0414 (accessed on 2 August 2021).
  13. Zhang, X.; Gao, T.; Gao, D. A New Deep Spatial Transformer Convolutional Neural Network for Image Saliency Detection. Des. Autom. Embed. Syst. 2018, 22, 243–256. [Google Scholar] [CrossRef]
  14. Lin, C.H.; Yumer, E.; Wang, O.; Shechtman, E.; Lucey, S. ST-GAN: Spatial transformer generative adversarial networks for image compositing. In Proceedings of the IEEE Conference on Computer Vision and Pattern Recognition, Salt Lake City, UT, USA, 18–23 June 2018; pp. 9455–9464. [Google Scholar] [CrossRef] [Green Version]
  15. Luo, H.; Jiang, W.; Fan, X.; Zhang, C. STNReID: Deep Convolutional Networks With Pairwise Spatial Transformer Networks for Partial Person Re-Identification. IEEE Trans. Multimed. 2020, 22, 2905–2913. [Google Scholar] [CrossRef] [Green Version]
  16. Lin, C.; Lucey, S. Inverse Compositional Spatial Transformer Networks. In Proceedings of the 2017 IEEE Conference on Computer Vision and Pattern Recognition (CVPR), Honolulu, HI, USA, 21–26 July 2017; pp. 2252–2260. Available online: https://arxiv.org/abs/1612.03897 (accessed on 2 August 2021). [CrossRef] [Green Version]
  17. Sønderby, S.K.; Sønderby, C.K.; Maaløe, L.; Winther, O. Recurrent Spatial Transformer Networks. CoRR. 2015. Available online: http://arxiv.org/abs/1509.05329 (accessed on 2 August 2021).
  18. Lee, M.C.H.; Oktay, O.; Schuh, A.; Schaap, M.; Glocker, B. Image-and-Spatial Transformer Networks for Structure-Guided Image Registration. In Medical Image Computing and Computer Assisted Intervention—MICCAI 2019; Shen, D., Liu, T., Peters, T.M., Staib, L.H., Essert, C., Zhou, S., Yap, P.T., Khan, A., Eds.; Springer International Publishing: Cham, Switzerland, 2019; Volume 11765, pp. 337–345. [Google Scholar] [CrossRef] [Green Version]
  19. Ekman, P. Basic Emotions. In Handbook of Cognition and Emotion; Dalgleish, T., Powers, M.J., Eds.; Wiley: Hoboken, NJ, USA, 1999; pp. 45–60. [Google Scholar] [CrossRef]
  20. Posner, J.; Russell, J.A.; Peterson, B.S. The circumplex model of affect: An integrative approach to affective neuroscience, cognitive development, and psychopathology. Dev. Psychopathol. 2005, 17. [Google Scholar] [CrossRef]
  21. Livingstone, S.R.; Russo, F.A. The Ryerson Audio-Visual Database of Emotional Speech and Song (RAVDESS): A dynamic, multimodal set of facial and vocal expressions in North American English. PLoS ONE 2018, 13, e0196391. [Google Scholar] [CrossRef] [PubMed] [Green Version]
  22. Poria, S.; Hazarika, D.; Majumder, N.; Naik, G.; Cambria, E.; Mihalcea, R. MELD: A Multimodal Multi-Party Dataset for Emotion Recognition in Conversations. In Proceedings of the 57th Annual Meeting of the Association for Computational Linguistics, Florence, Italy, 28 July–2 August 2019; pp. 527–536. [Google Scholar] [CrossRef] [Green Version]
  23. Busso, C.; Bulut, M.; Lee, C.C.; Kazemzadeh, A.; Mower Provost, E.; Kim, S.; Chang, J.; Lee, S.; Narayanan, S. IEMOCAP: Interactive emotional dyadic motion capture database. Lang. Resour. Eval. 2008, 42, 335–359. [Google Scholar] [CrossRef]
  24. Ringeval, F.; Sonderegger, A.; Sauer, J.; Lalanne, D. Introducing the RECOLA multimodal corpus of remote collaborative and affective interactions. In Proceedings of the 2013 10th IEEE International Conference and Workshops on Automatic Face and Gesture Recognition (FG), Shanghai, China, 22–26 April 2013; pp. 1–8. [Google Scholar] [CrossRef] [Green Version]
  25. Nguyen, B.T.; Trinh, M.H.; Phan, T.V.; Nguyen, H.D. An efficient real-time emotion detection using camera and facial landmarks. In Proceedings of the 2017 Seventh International Conference on Information Science and Technology (ICIST), Da Nang, Vietnam, 16–19 April 2017; pp. 251–255. [Google Scholar] [CrossRef]
  26. Bagheri, E.; Esteban, P.G.; Cao, H.L.; De Beir, A.; Lefeber, D.; Vanderborght, B. An Autonomous Cognitive Empathy Model Responsive to Users’ Facial Emotion Expressions. ACM Trans. Interact. Intell. Syst. 2020, 10, 20. [Google Scholar] [CrossRef]
  27. Tautkute, I.; Trzcinski, T. Classifying and Visualizing Emotions with Emotional DAN. Fundam. Informaticae 2019, 168, 269–285. [Google Scholar] [CrossRef] [Green Version]
  28. Mavani, V.; Raman, S.; Miyapuram, K.P. Facial Expression Recognition using Visual Saliency and Deep Learning. In Proceedings of the 2017 IEEE International Conference on Computer Vision Workshops (ICCVW 2017), Venice, Italy, 22–29 October 2017; pp. 2783–2788. [Google Scholar] [CrossRef] [Green Version]
  29. Kovashka, A.; Grauman, K. Attribute Adaptation for Personalized Image Search. In Proceedings of the 2013 IEEE International Conference on Computer Vision (ICCV), Sydney, Australia, 1–8 December 2013; pp. 3432–3439. [Google Scholar] [CrossRef] [Green Version]
  30. Yang, J.; Yan, R.; Hauptmann, A.G. Adapting SVM Classifiers to Data with Shifted Distributions. In Proceedings of the Seventh IEEE International Conference on Data Mining Workshops (ICDMW 2007), Omaha, NE, USA, 28–31 October 2007; pp. 69–76. [Google Scholar] [CrossRef] [Green Version]
  31. Zhang, K.; Zhang, Z.; Li, Z.; Qiao, Y. Joint Face Detection and Alignment Using Multitask Cascaded Convolutional Networks. IEEE Signal Process. Lett. 2016, 23, 1499–1503. [Google Scholar] [CrossRef] [Green Version]
  32. King, D.E. Dlib-Ml: A Machine Learning Toolkit. J. Mach. Learn. Res. 2009, 10, 1755–1758. [Google Scholar]
  33. Bradski, G. The OpenCV Library. Dr. Dobb’S J. Softw. Tools 2000, 120, 122–125. [Google Scholar]
  34. Liu, N.; Zhang, N.; Wan, K.; Han, J.; Shao, L. Visual Saliency Transformer. 2021. Available online: https://arxiv.org/abs/2104.12099 (accessed on 2 August 2021).
  35. Pahuja, A.; Majumder, A.; Chakraborty, A.; Babu, R.V. Enhancing Salient Object Segmentation through Attention. 2019. Available online: http://arxiv.org/abs/1905.11522 (accessed on 2 August 2021).
  36. Kroner, A.; Senden, M.; Driessens, K.; Goebel, R. Contextual encoder-decoder network for visual saliency prediction. Neural Netw. 2020, 129, 261–270. [Google Scholar] [CrossRef] [PubMed]
  37. Jiang, M.; Huang, S.; Duan, J.; Zhao, Q. SALICON: Saliency in Context. In Proceedings of the 2015 IEEE Conference on Computer Vision and Pattern Recognition (CVPR), Boston, MA, USA, 7–12 June 2015; pp. 1072–1080. [Google Scholar] [CrossRef]
  38. Paszke, A.; Gross, S.; Massa, F.; Lerer, A.; Bradbury, J.; Chanan, G.; Killeen, T.; Lin, Z.; Gimelshein, N.; Antiga, L.; et al. PyTorch: An Imperative Style, High-Performance Deep Learning Library. In Advances in Neural Information Processing Systems 32; Curran Associates, Inc.: Red Hook, NY, USA, 2019; pp. 8024–8035. [Google Scholar]
  39. Jalwana, M.; Akhtar, N.; Bennamoun, M.; Mian, A. CAMERAS: Enhanced Resolution and Sanity Preserving Class Activation Mapping for Image Saliency. In Proceedings of the IEEE/CVF Conference on Computer Vision and Pattern Recognition (CVPR), Virtual, 19–25 June 2021; pp. 16327–16336. Available online: https://arxiv.org/abs/2106.10649 (accessed on 2 August 2021).
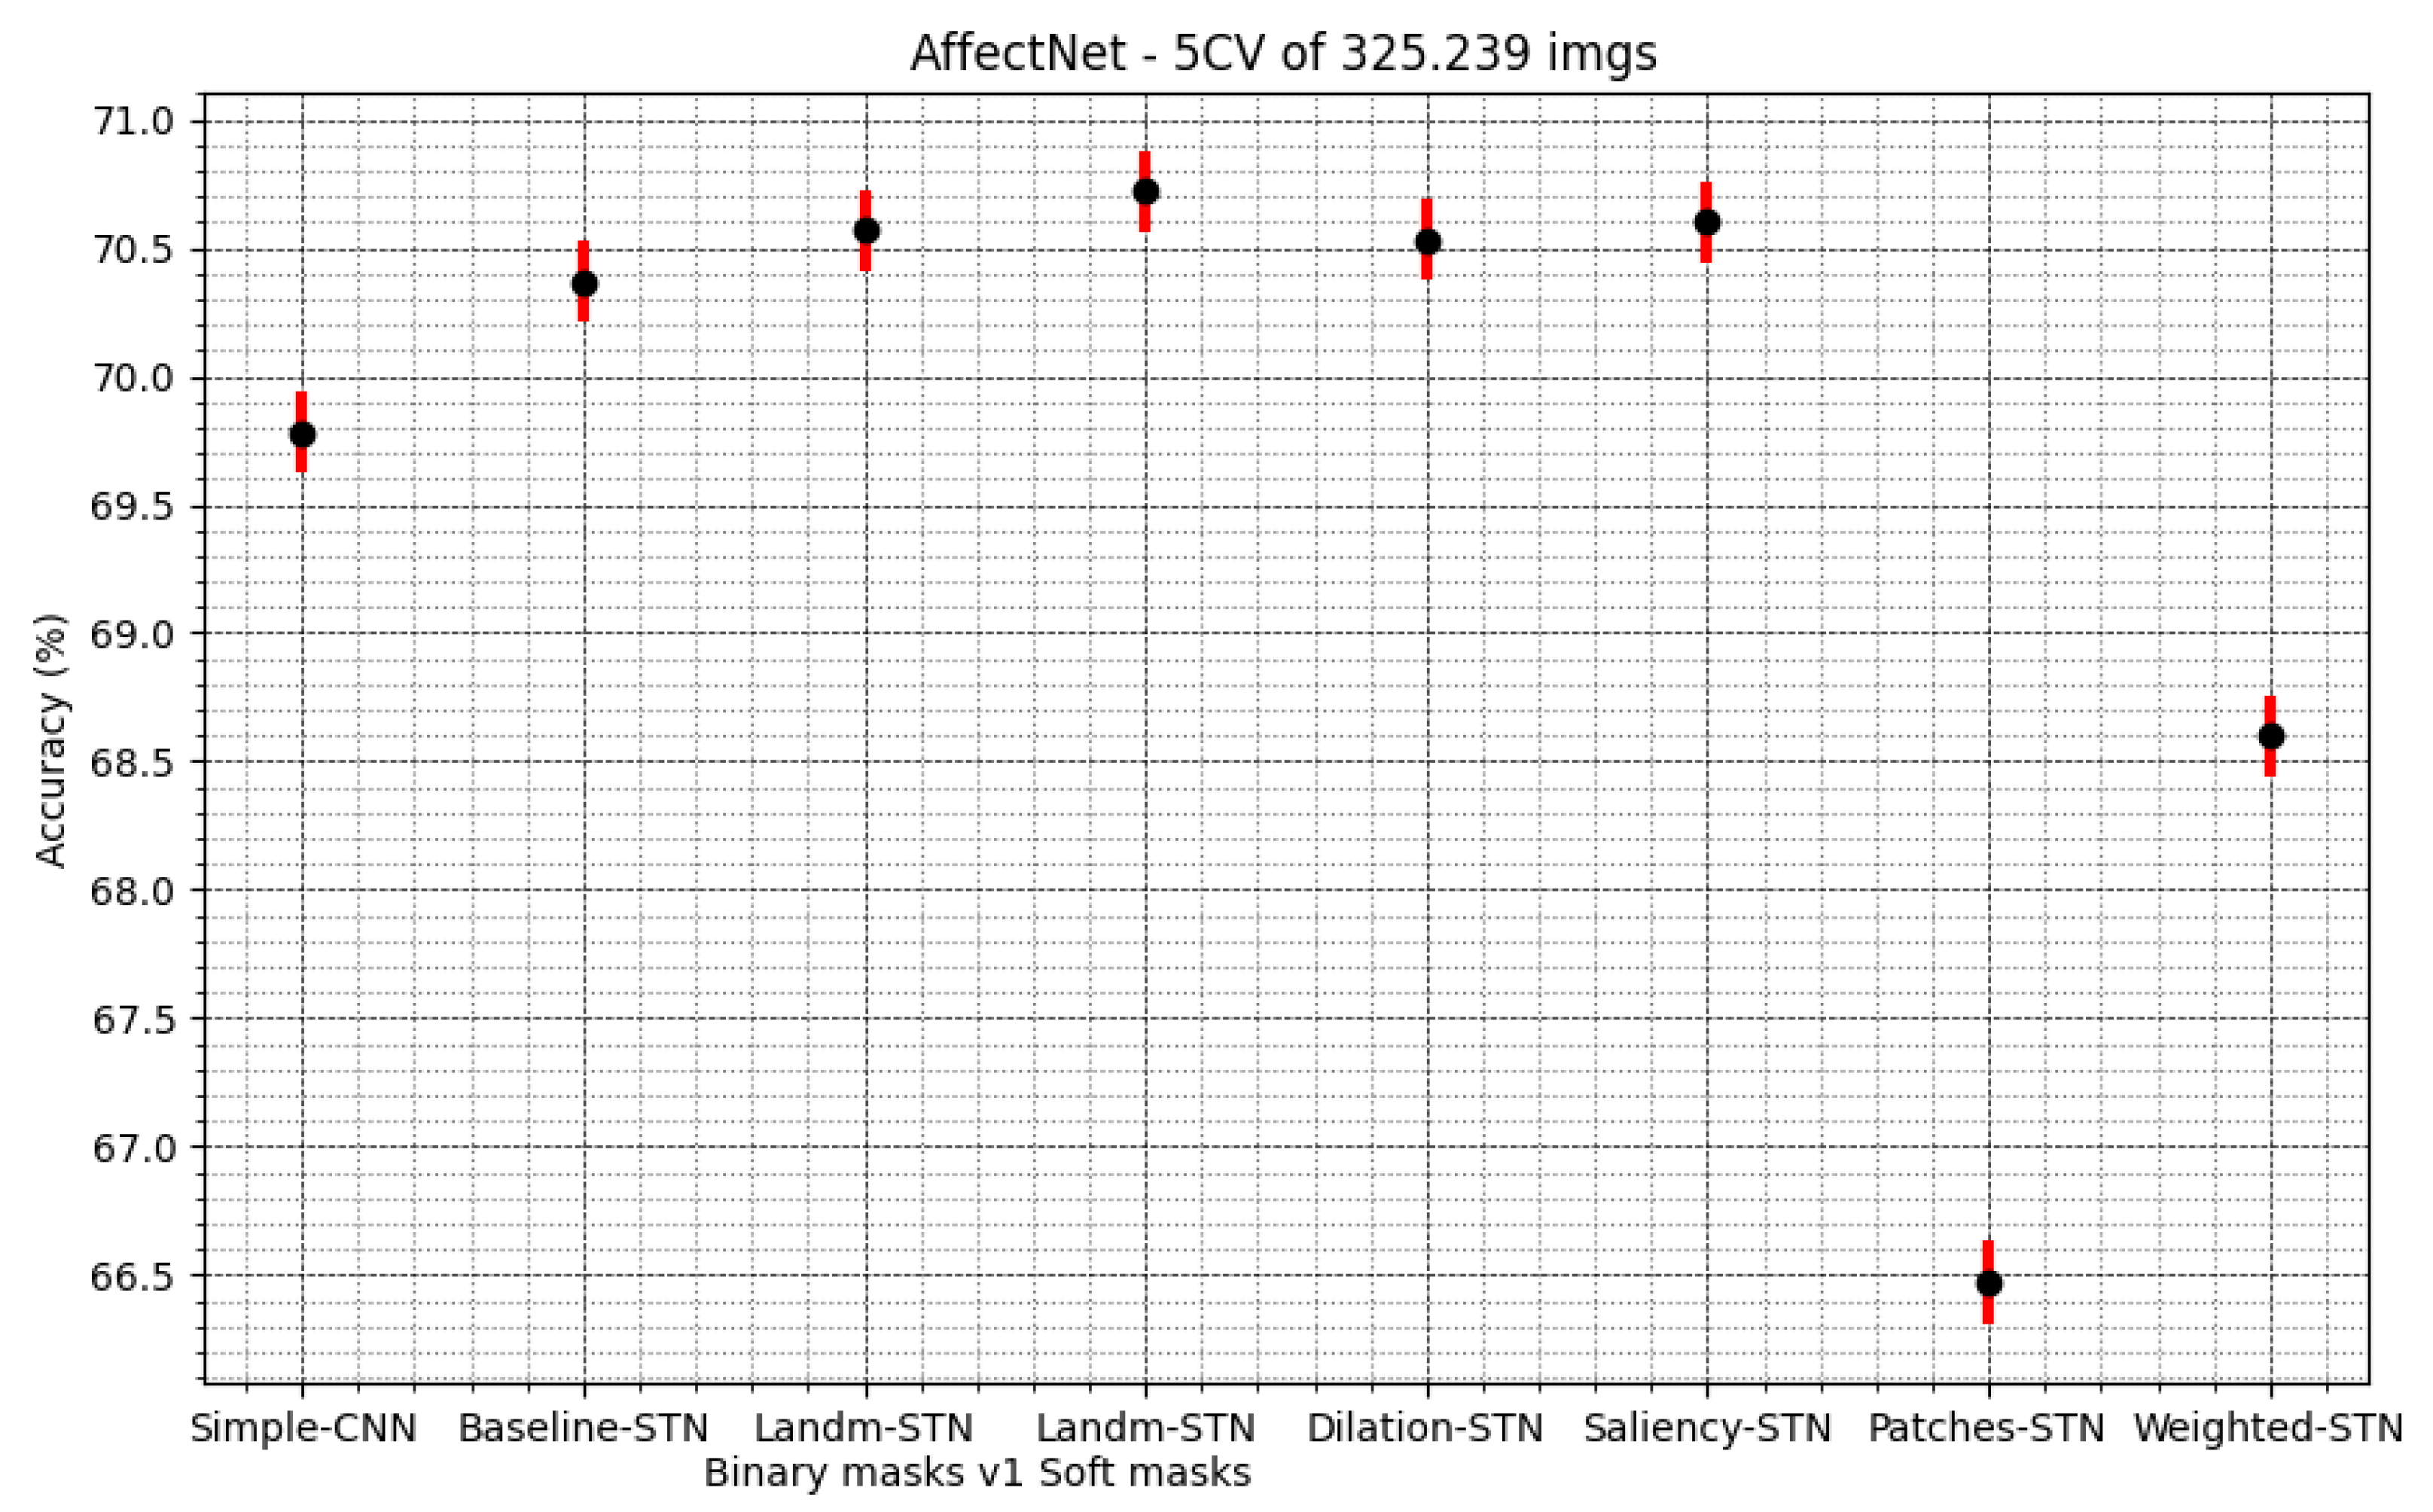
Figure 1. Samples of the generated masks on the AffectNet dataset. Columns are organized as follows: Original image, Landmark-based binary mask, Landmark-based soft masks, Landmark-based dilated binary masks, Visual Saliency based masks, Landmark-based facial patches, and Landmark-based image weighing masks. The first two rows have images with positive valence, the middle row shows an image with neutral valence, and the 2 last rows are examples of negative valence.
Applsci 11 07217 g001
Figure 2. Example of the transformation produced by a Spatial Transformer Network and its parts: localization network, grid generator, and sampler.
Applsci 11 07217 g002
Figure 3. Simple CNN network without STN.
Applsci 11 07217 g003
Figure 4. Baseline STN. Example of a conventional STN as it is described in [3].
Applsci 11 07217 g004
Figure 5. Spatial Transformer CNN architecture. Example for visual saliency based masks.
Applsci 11 07217 g005
Figure 6. Spatial Transformer CNN architecture. Example for landmarks-based facial patches masks.
Applsci 11 07217 g006
Figure 7. Distribution of the dataset labels. The X-axis contains the valence levels: Negative, Neutral, and Positive. The Y-axis represents the number of samples per class.
Applsci 11 07217 g007
Figure 8. Quantitative evaluation of the most relevant strategies on FER-2013. In red, the results training from scratch; in green applying Transfer-Learning on AffectNet weights. Table with values and the v2 and v3 versions of the binary-masks in Appendix A, Table A1.
Applsci 11 07217 g008
Table 1. Quantitative evaluation of the different strategies on AffectNet.
StrategyAccuracy ±
95% Confidence Interval
Average Epochs
to Converge
ZeroR49.26 ± 0.17-
Simple-CNN69.78 ± 0.1668
Baseline STN70.37 ± 0.1689
STN with landmarks—binary masks v170.57 ± 0.1670
STN with landmarks—binary masks v270.54 ± 0.1658
STN with landmarks—binary masks v370.59 ± 0.16-
STN with landmarks—soft masks70.72 ± 0.1671
STN with dilated masks70.53 ± 0.1658
STN with saliency masks70.60 ± 0.16108
STN with patches masks66.47 ± 0.1667
STN with weighted masks68.60 ± 0.1651
Publisher’s Note: MDPI stays neutral with regard to jurisdictional claims in published maps and institutional affiliations.

