
Energy Saving Quantitative Analysis of Passive, Active, and Renewable Technologies in Different Climate Zones


Abstract
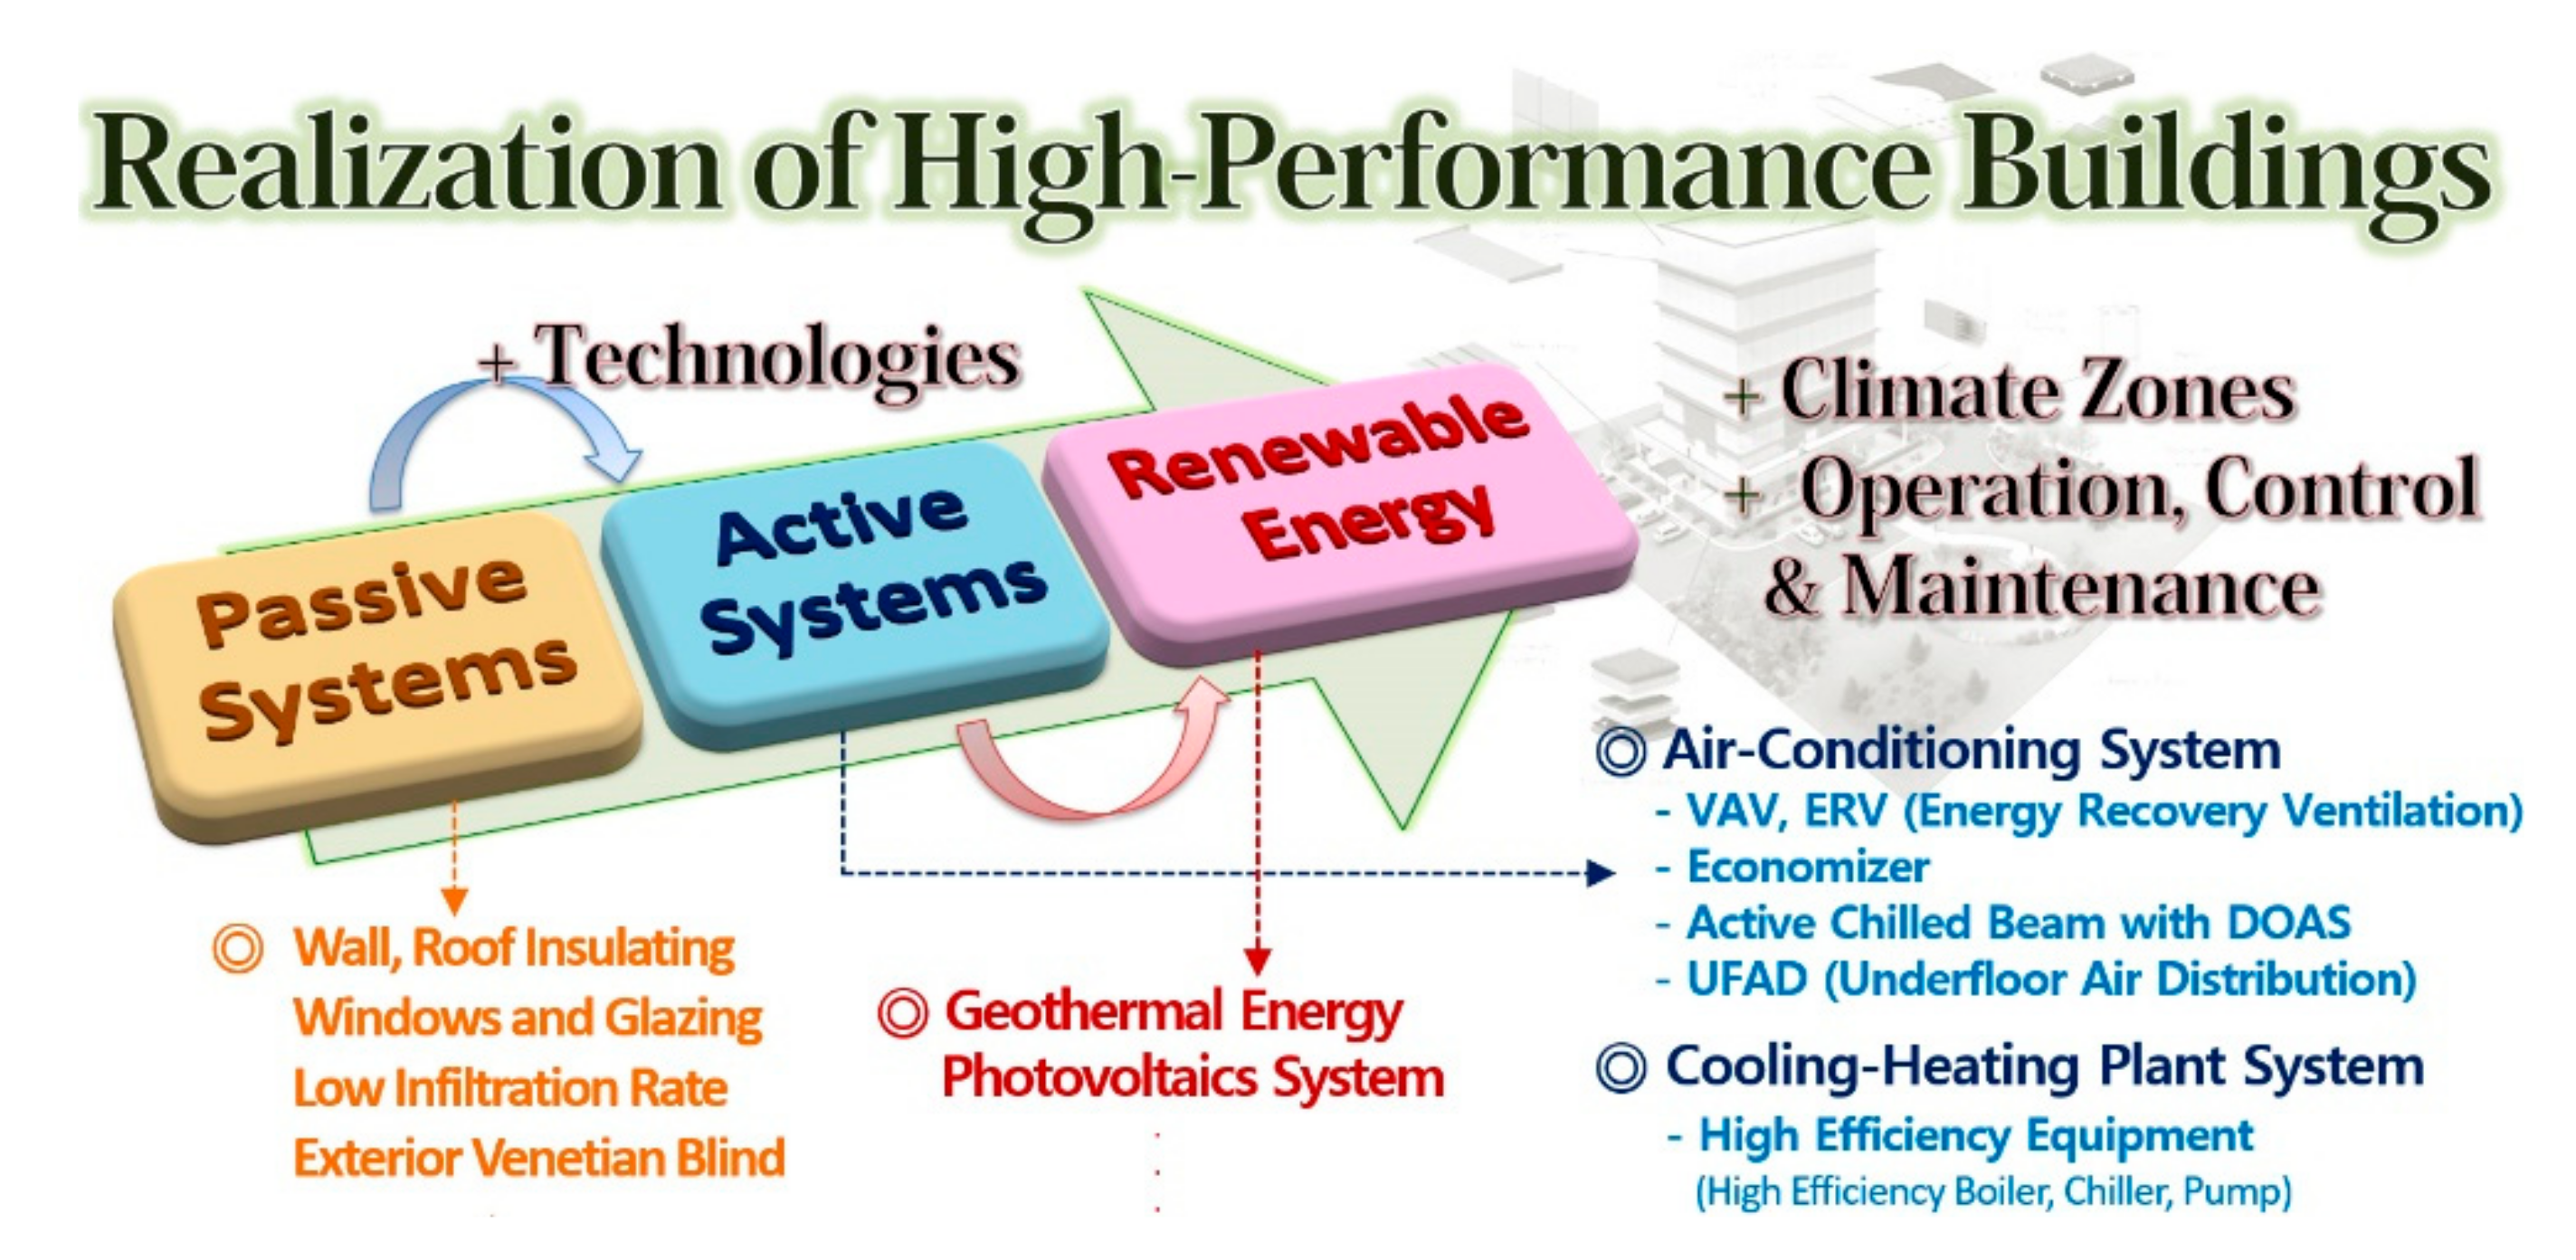
:1. Introduction
2. Literature Review
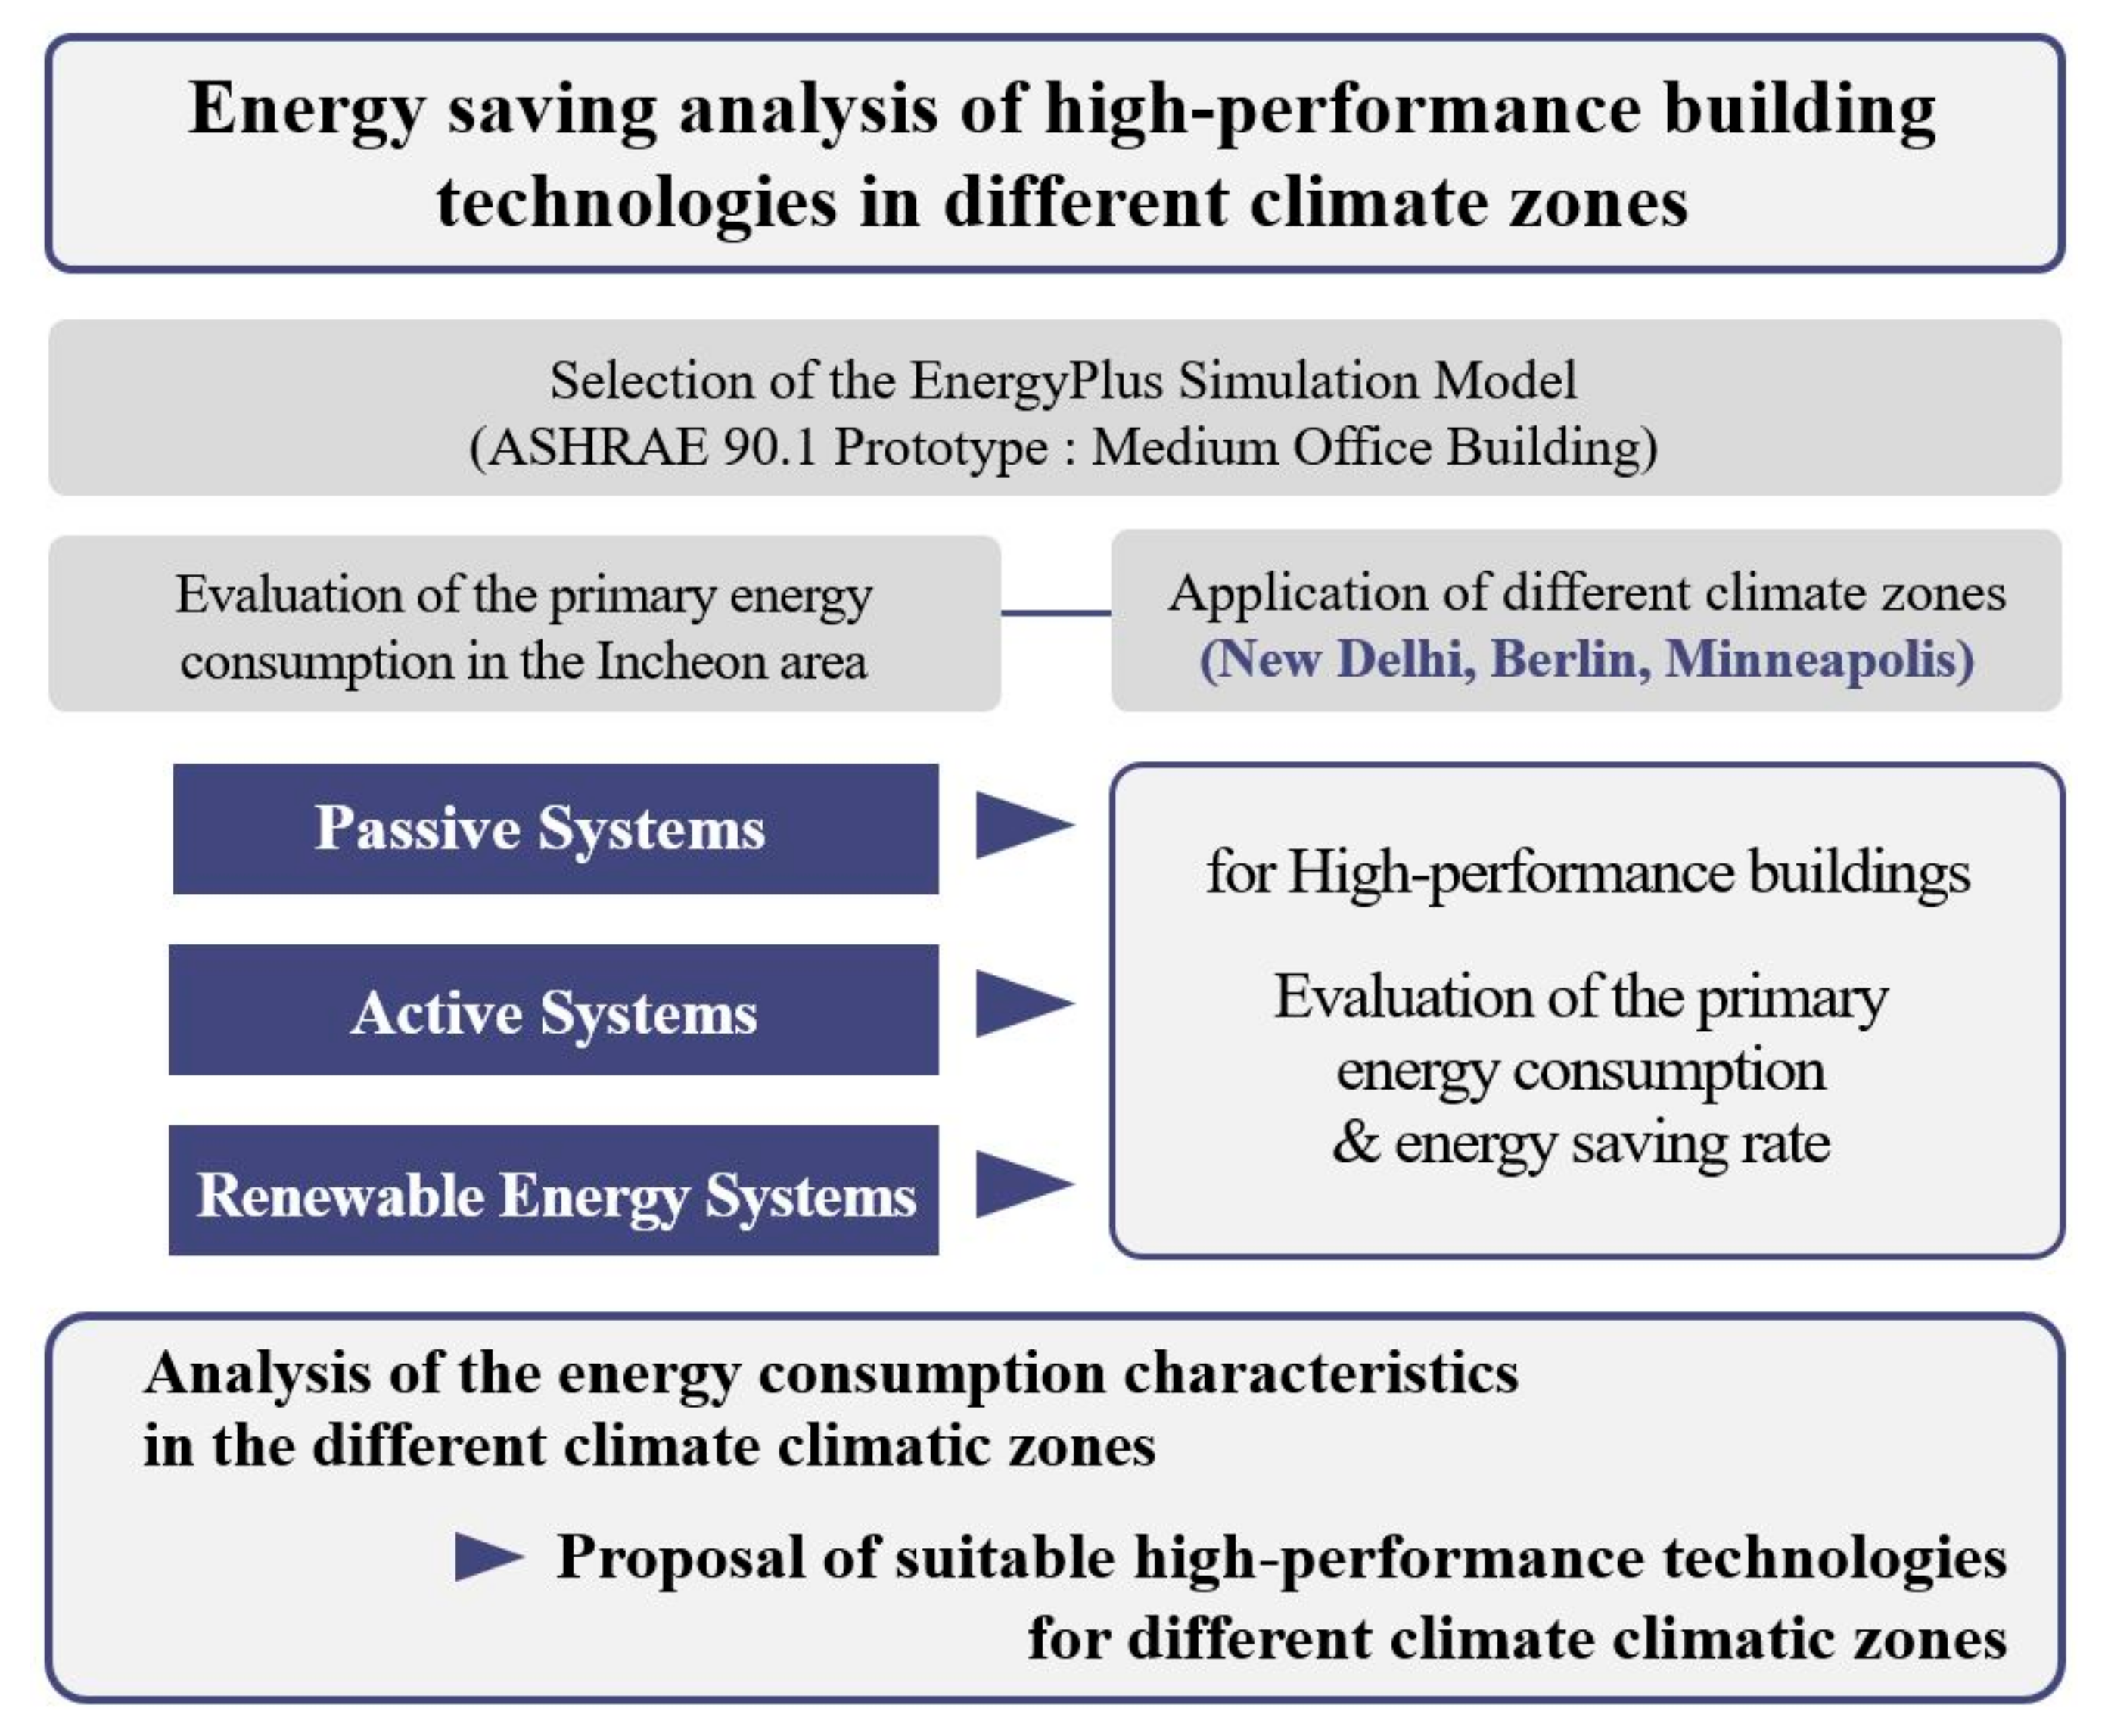
3. Simulation Methodology
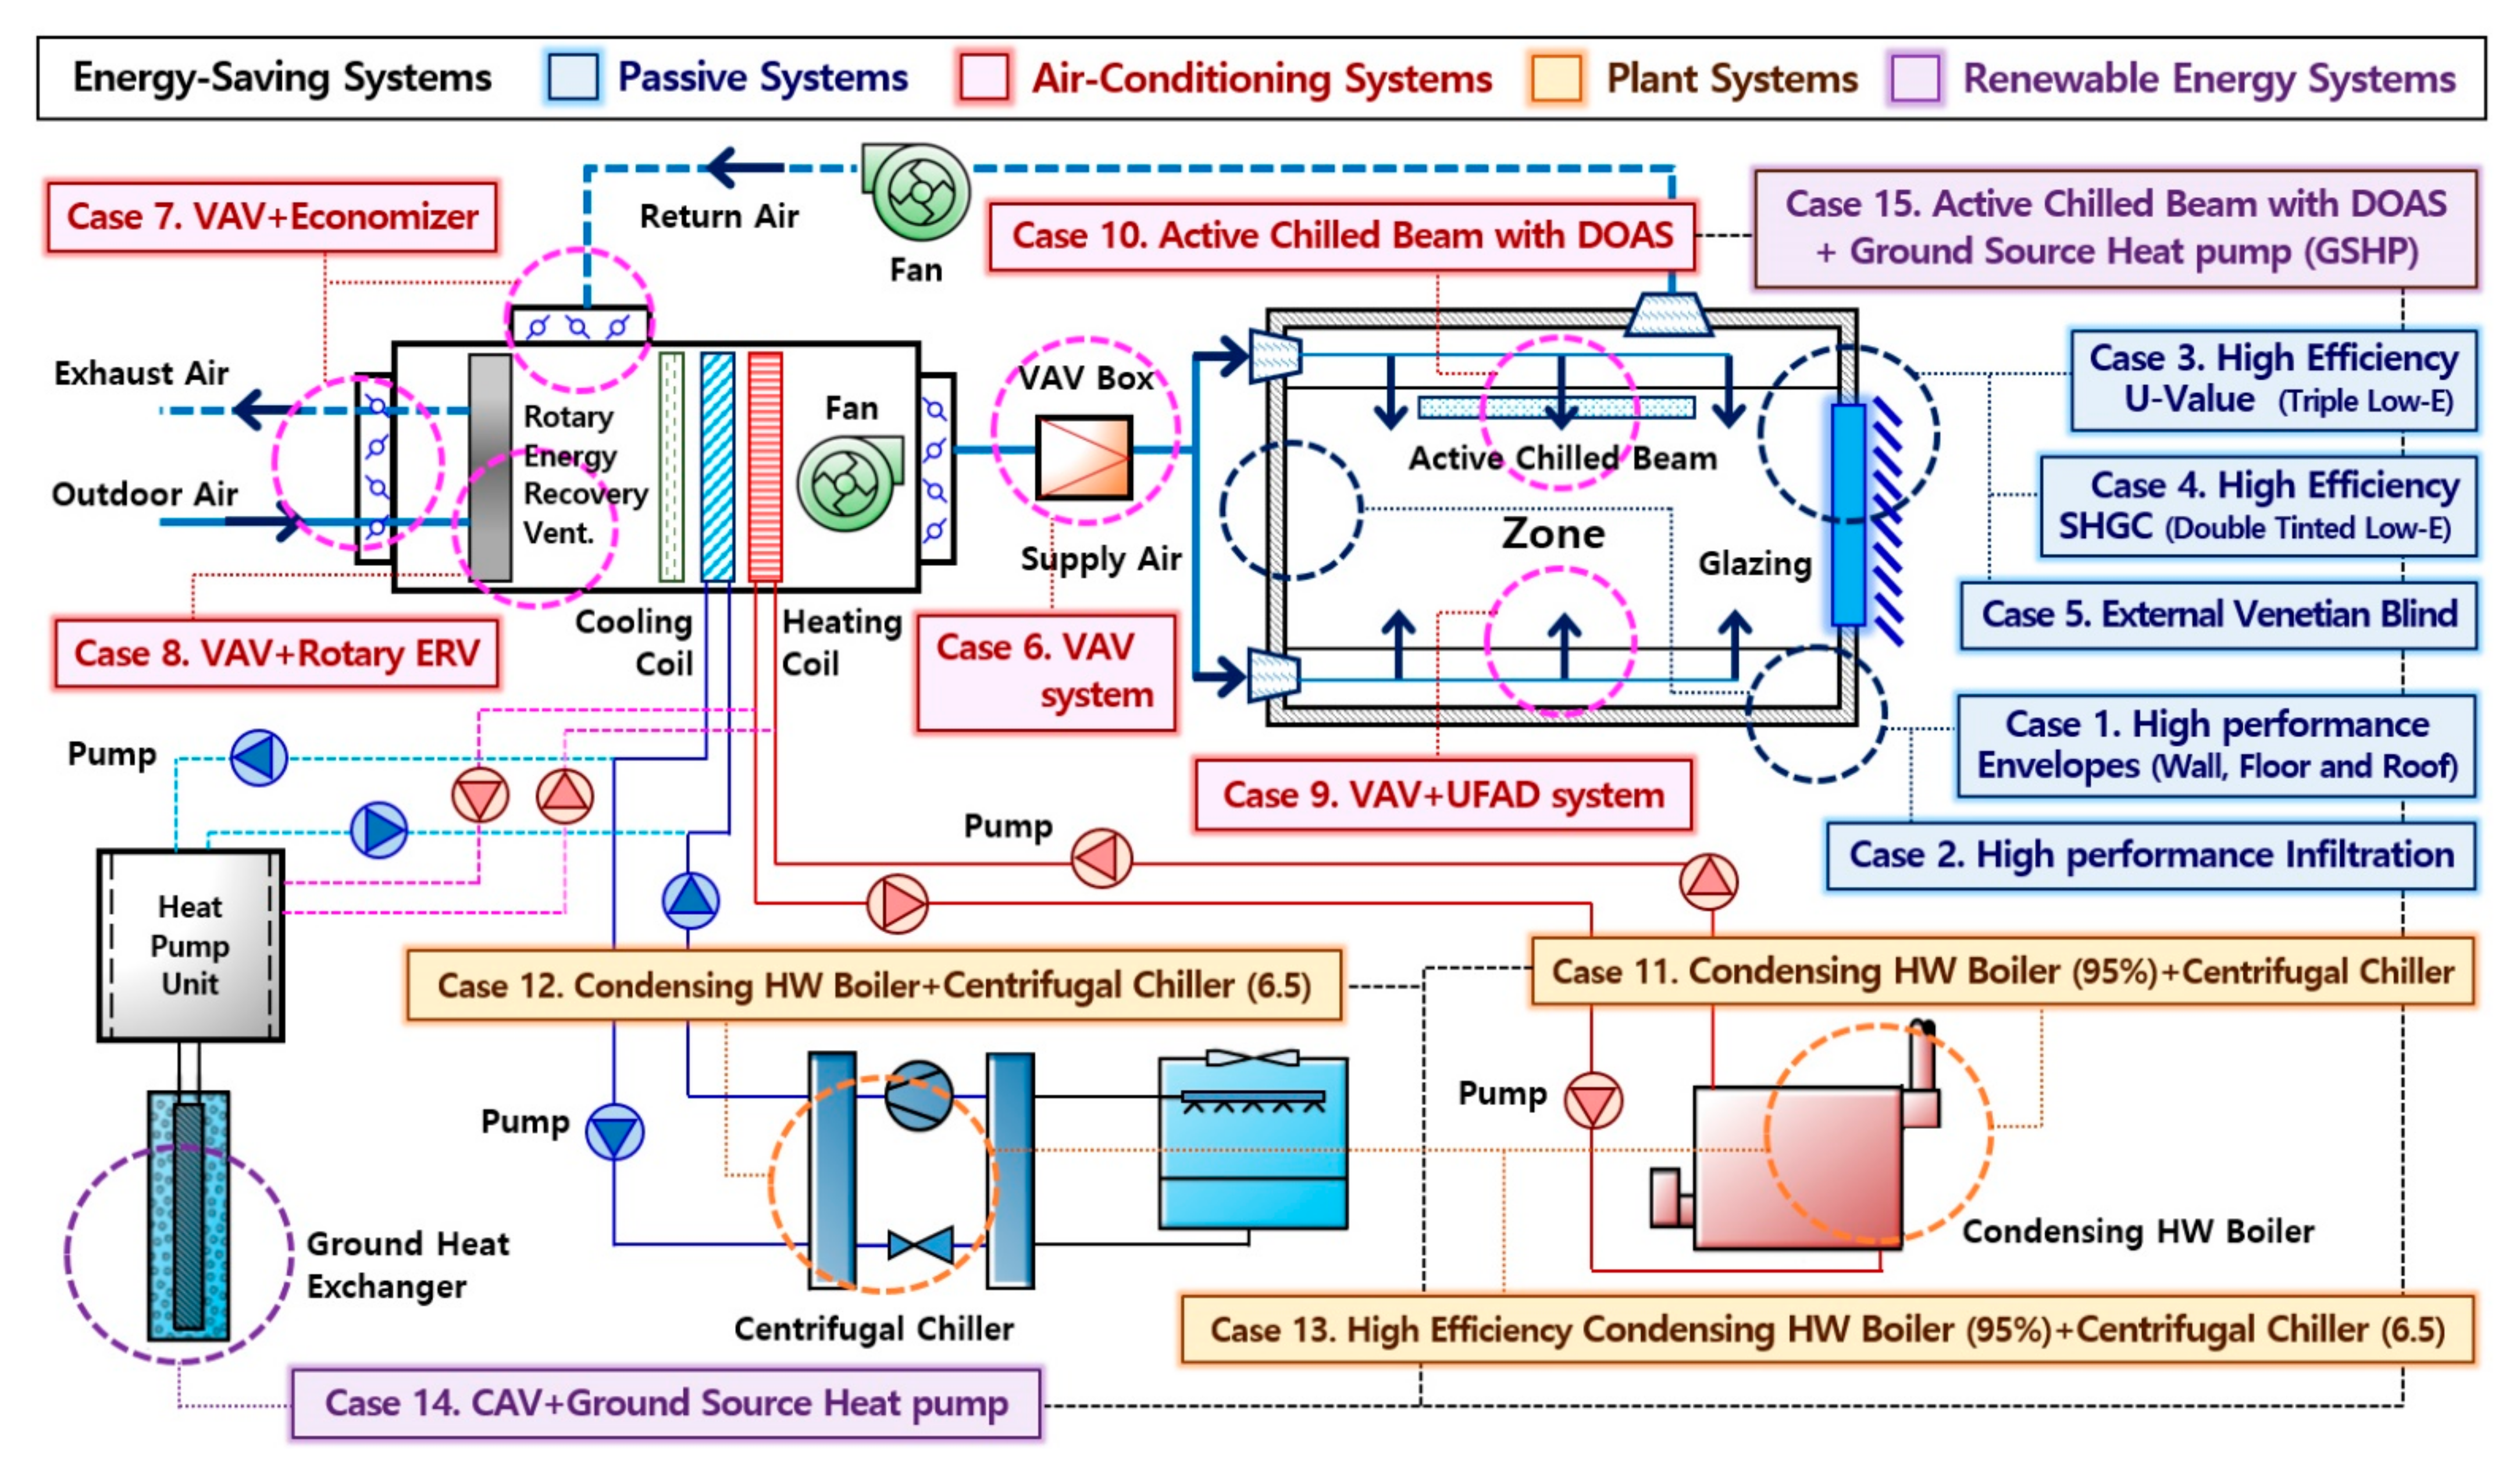
3.1. Simulation Model and Setting Variables
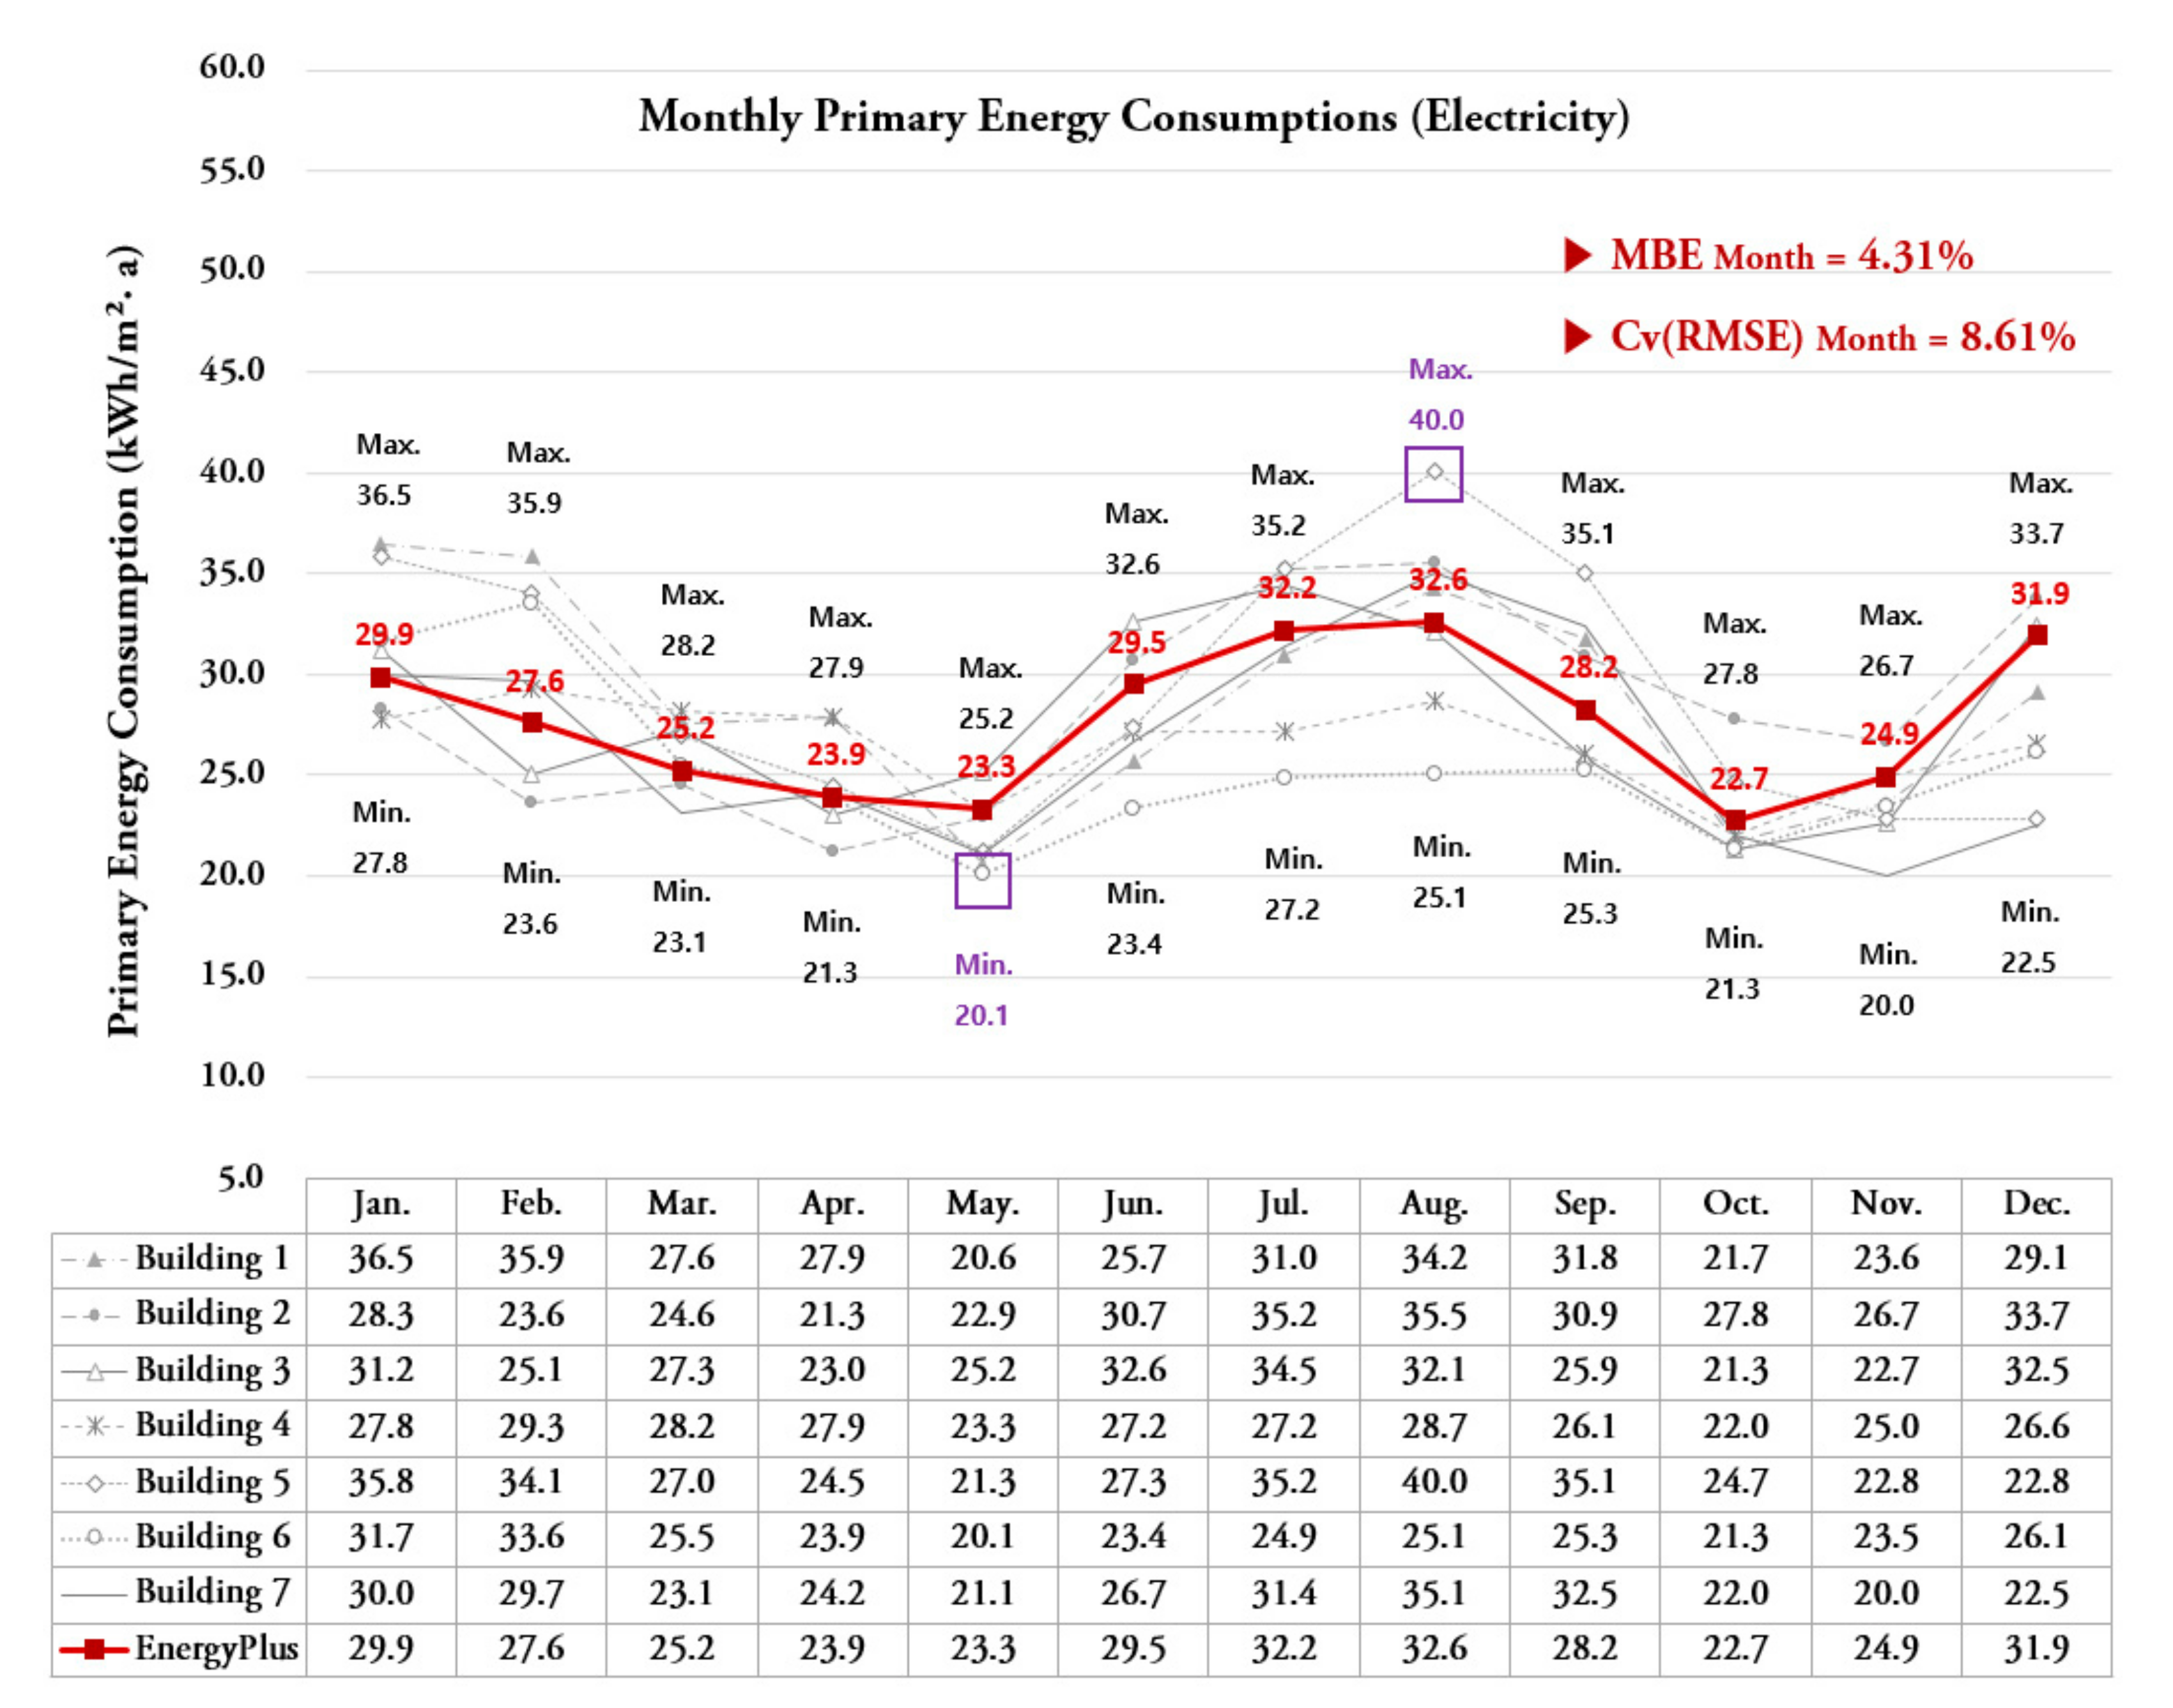
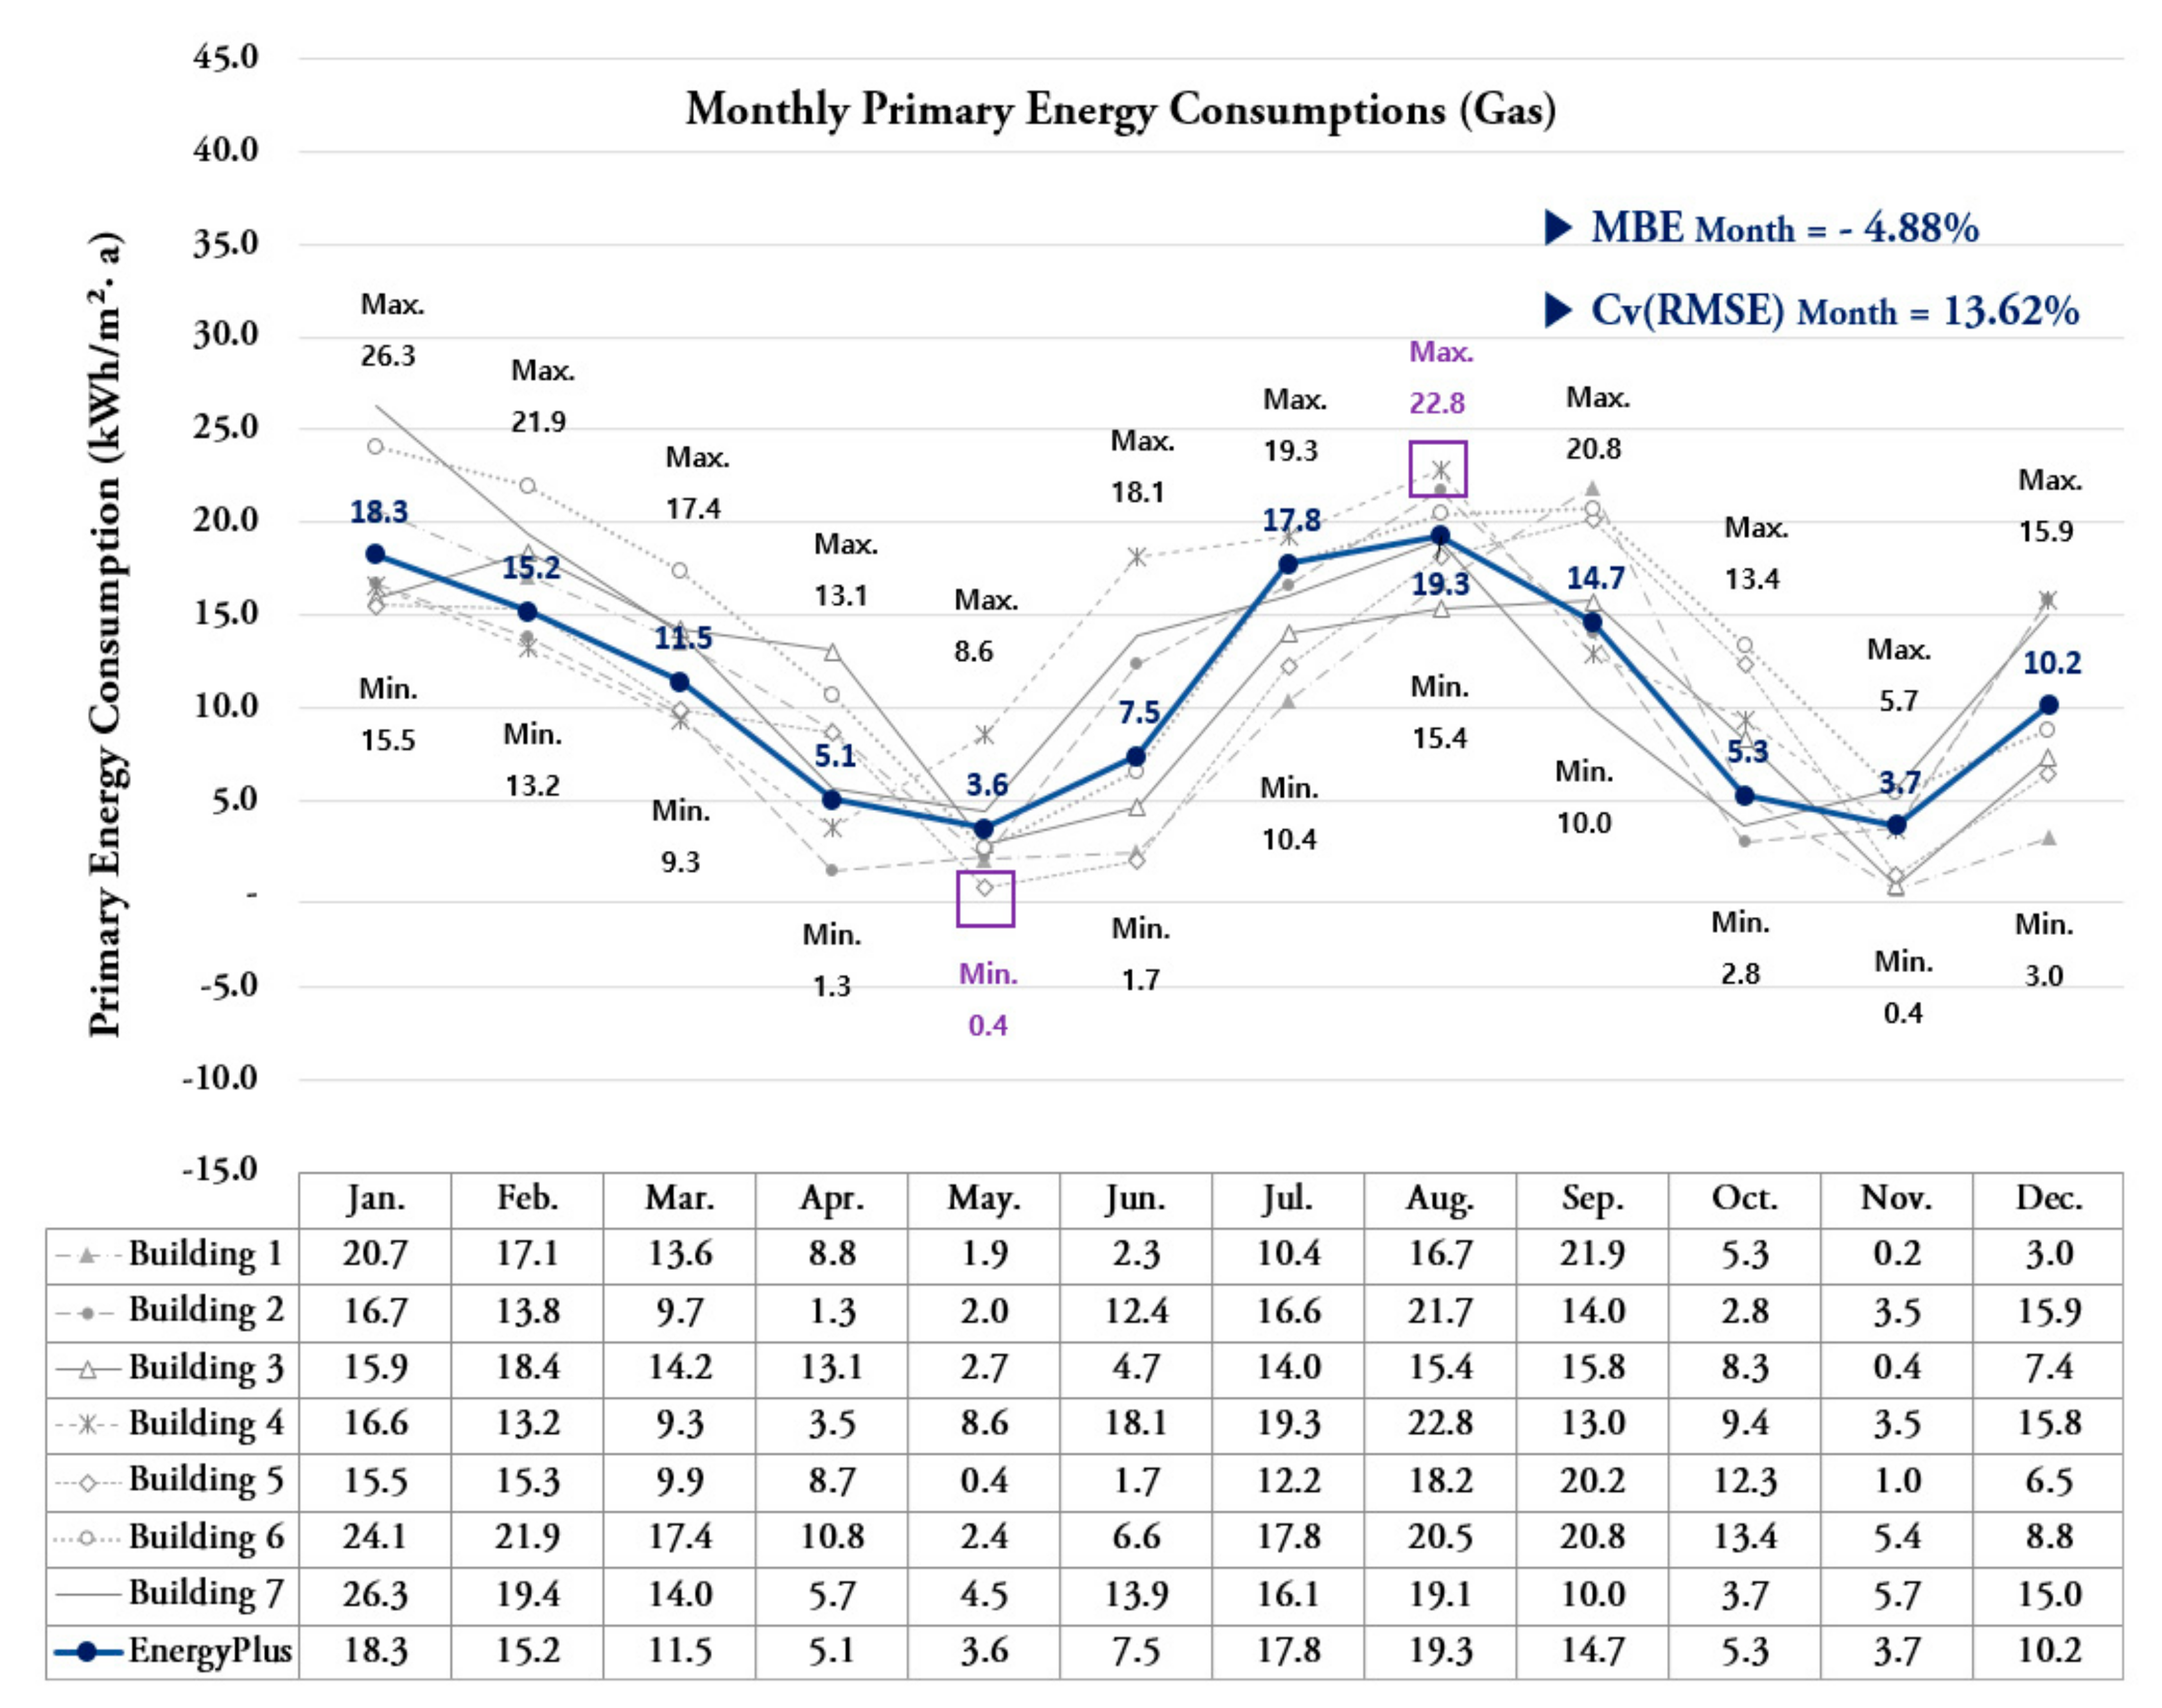
3.2. Validation of the Model
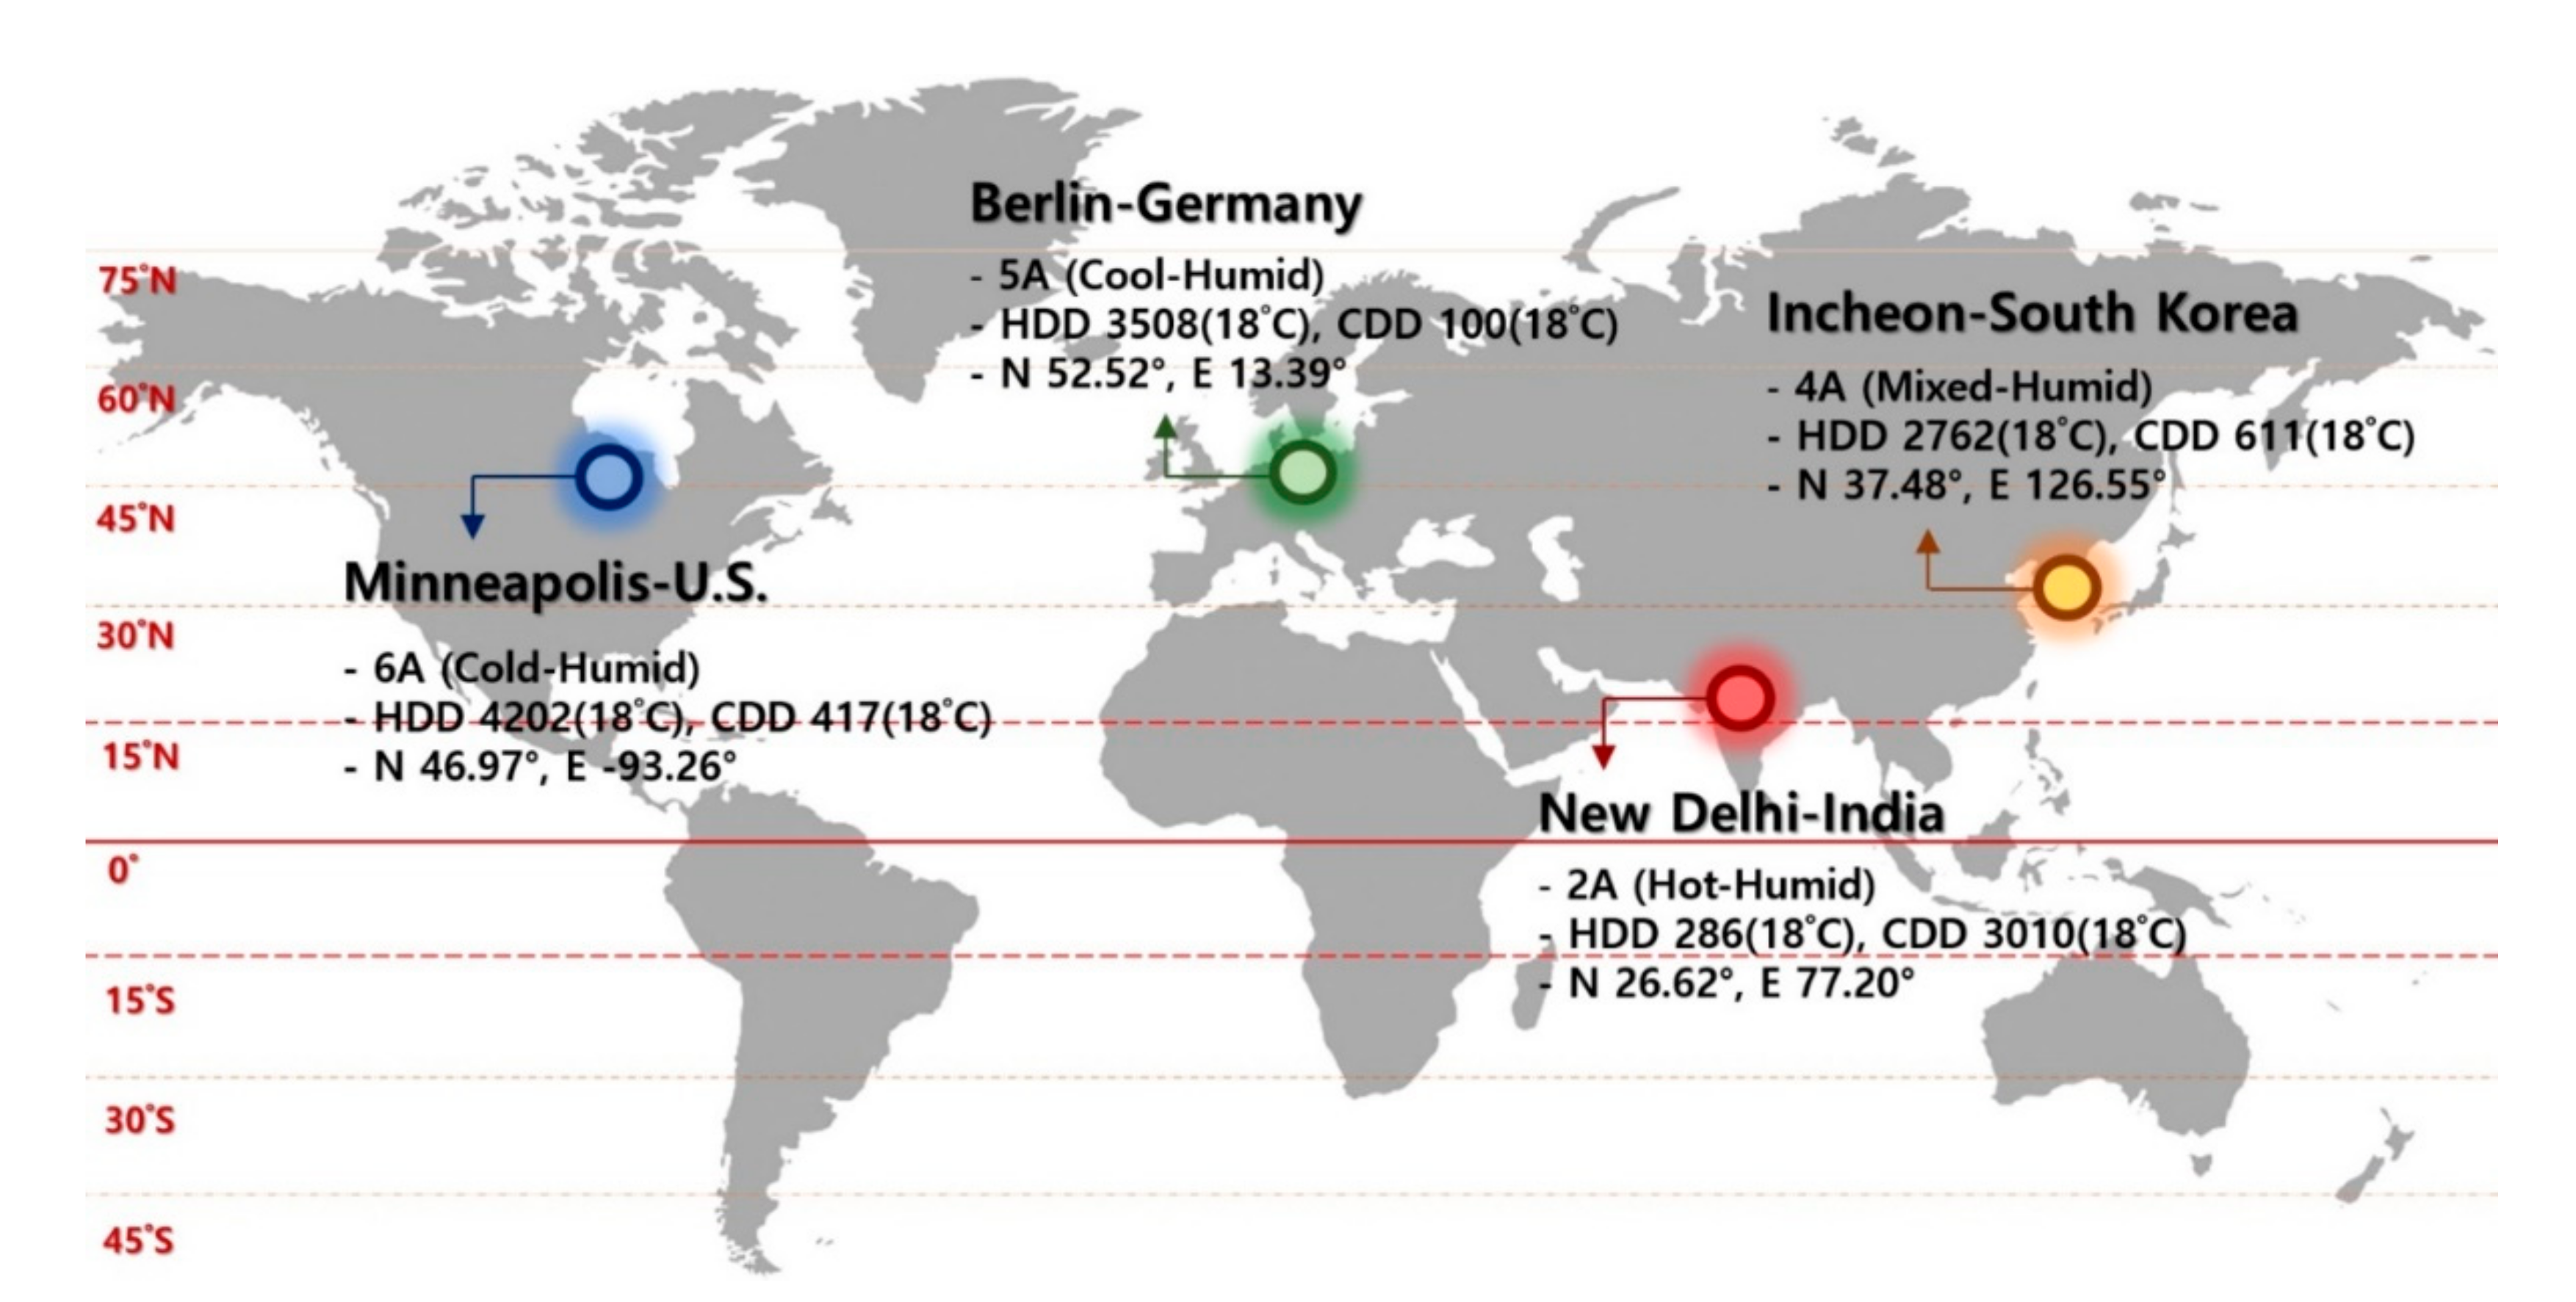
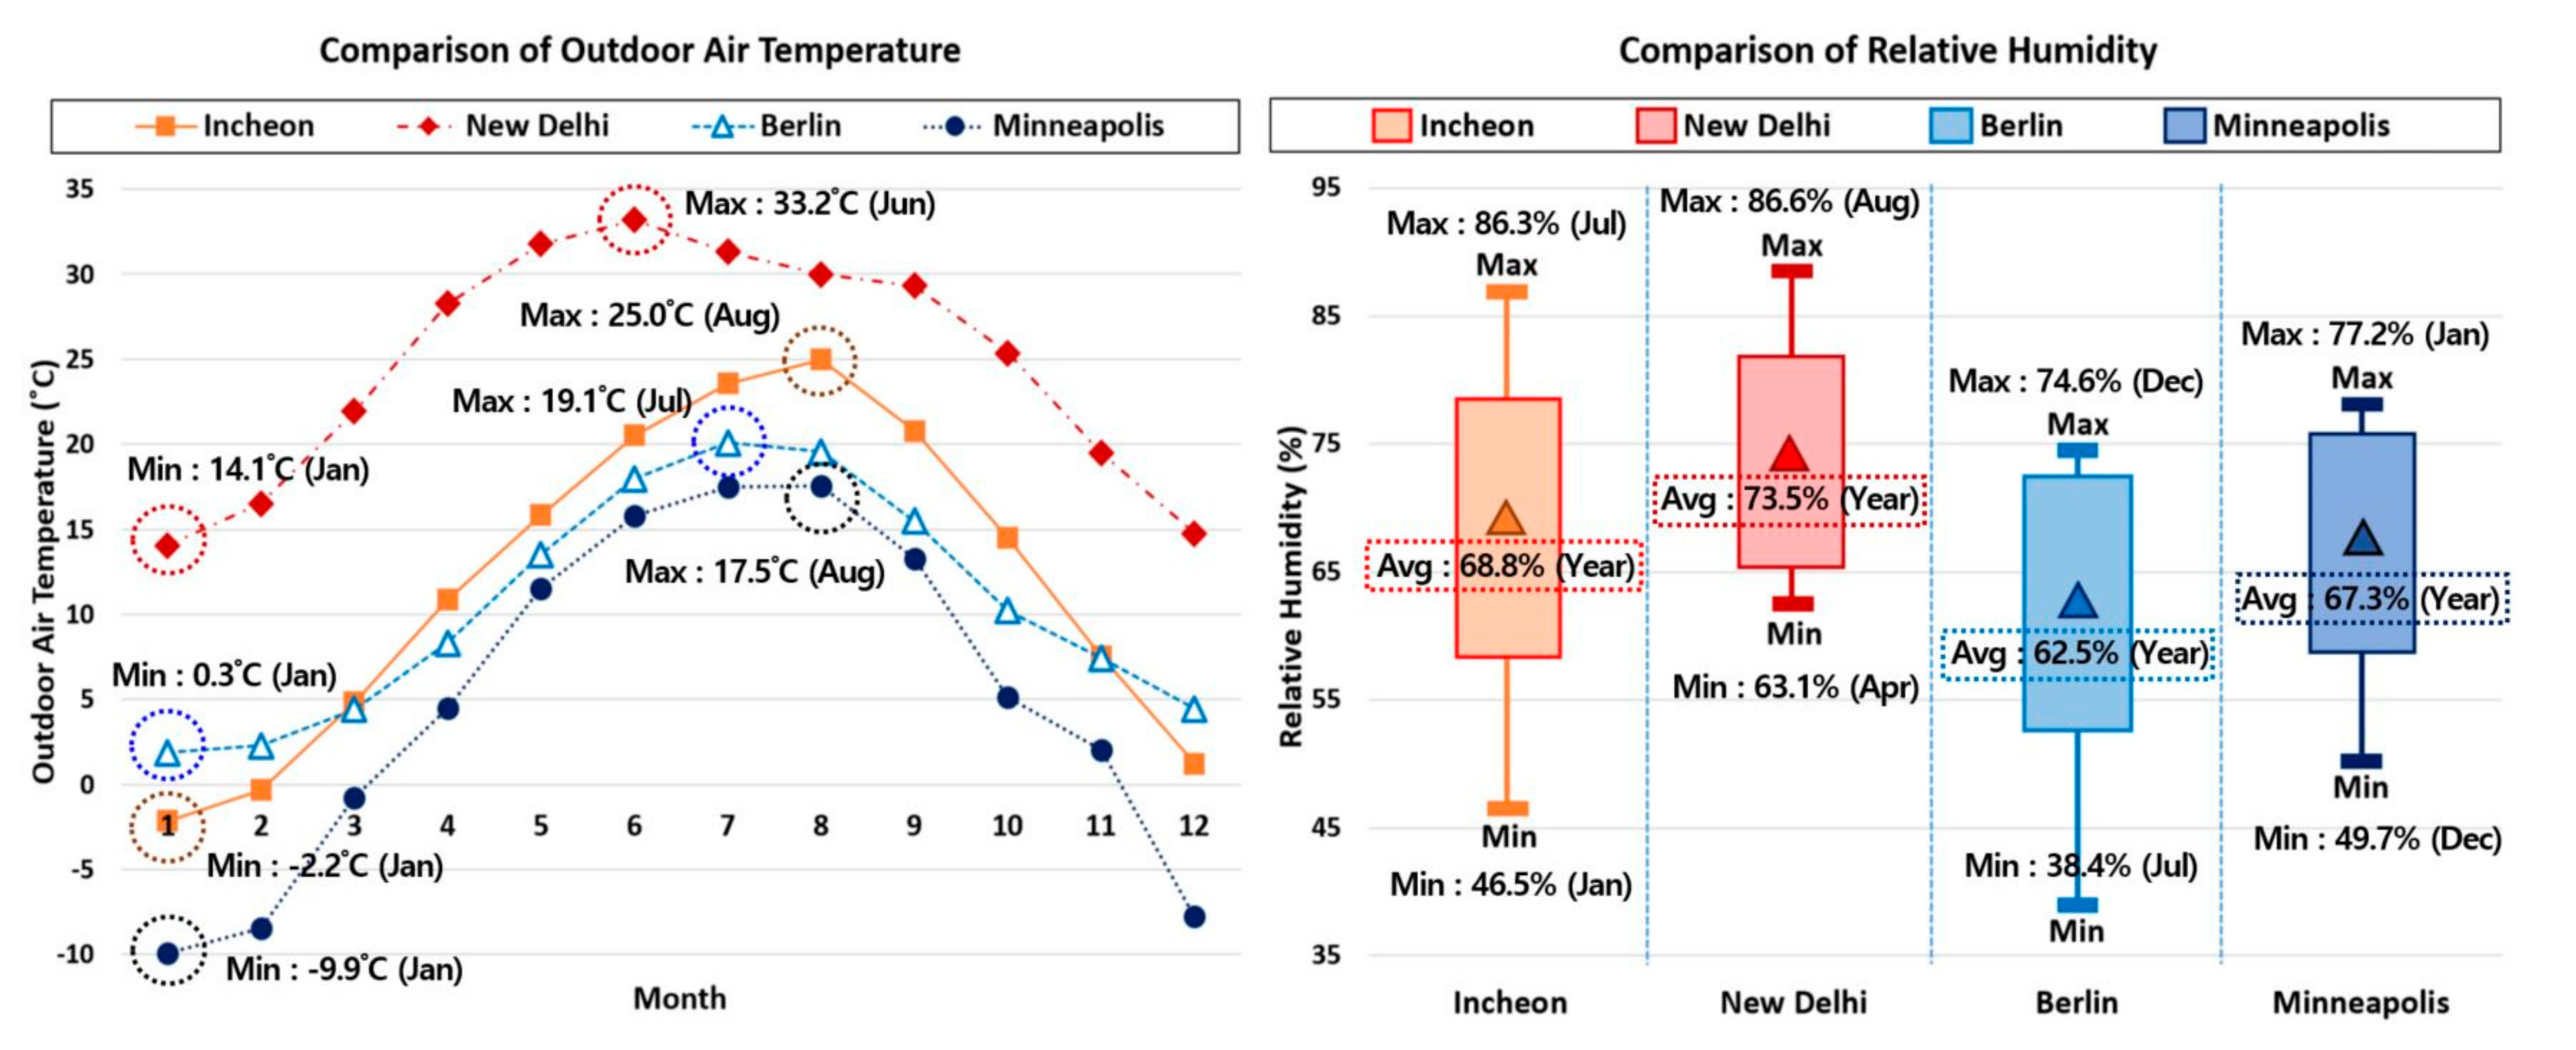
3.3. Weather Conditions of the Four Regions Selected for This Study
4. EnergyPlus Simulation Results
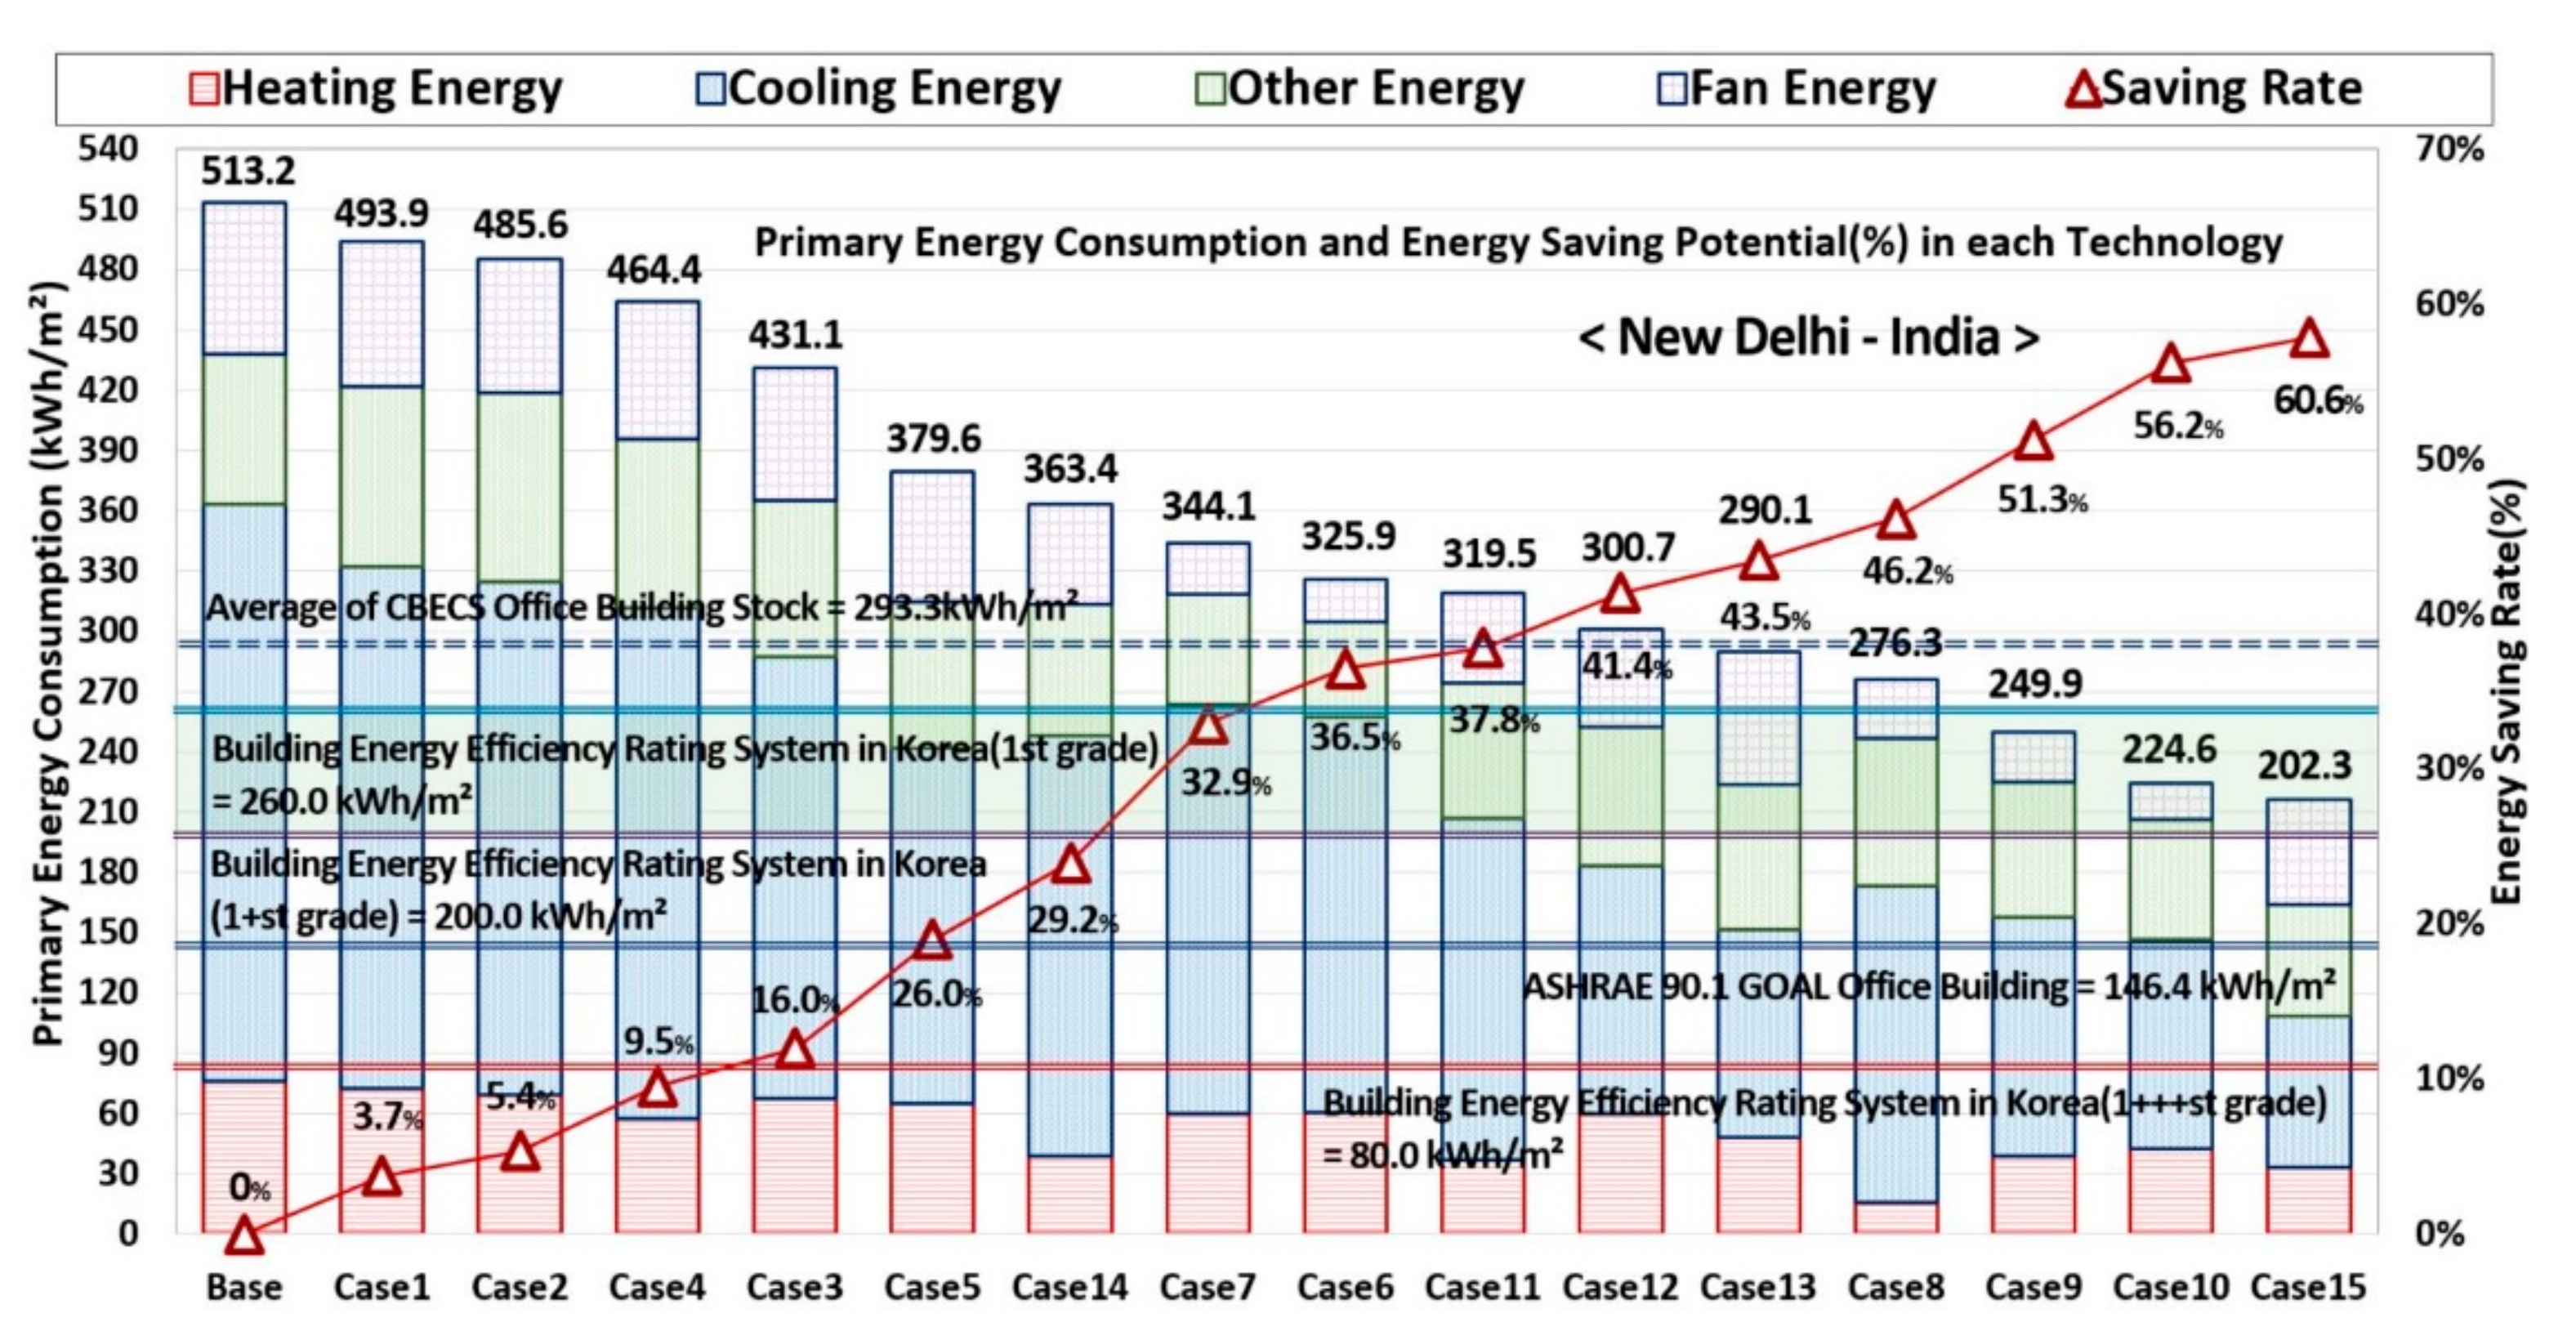
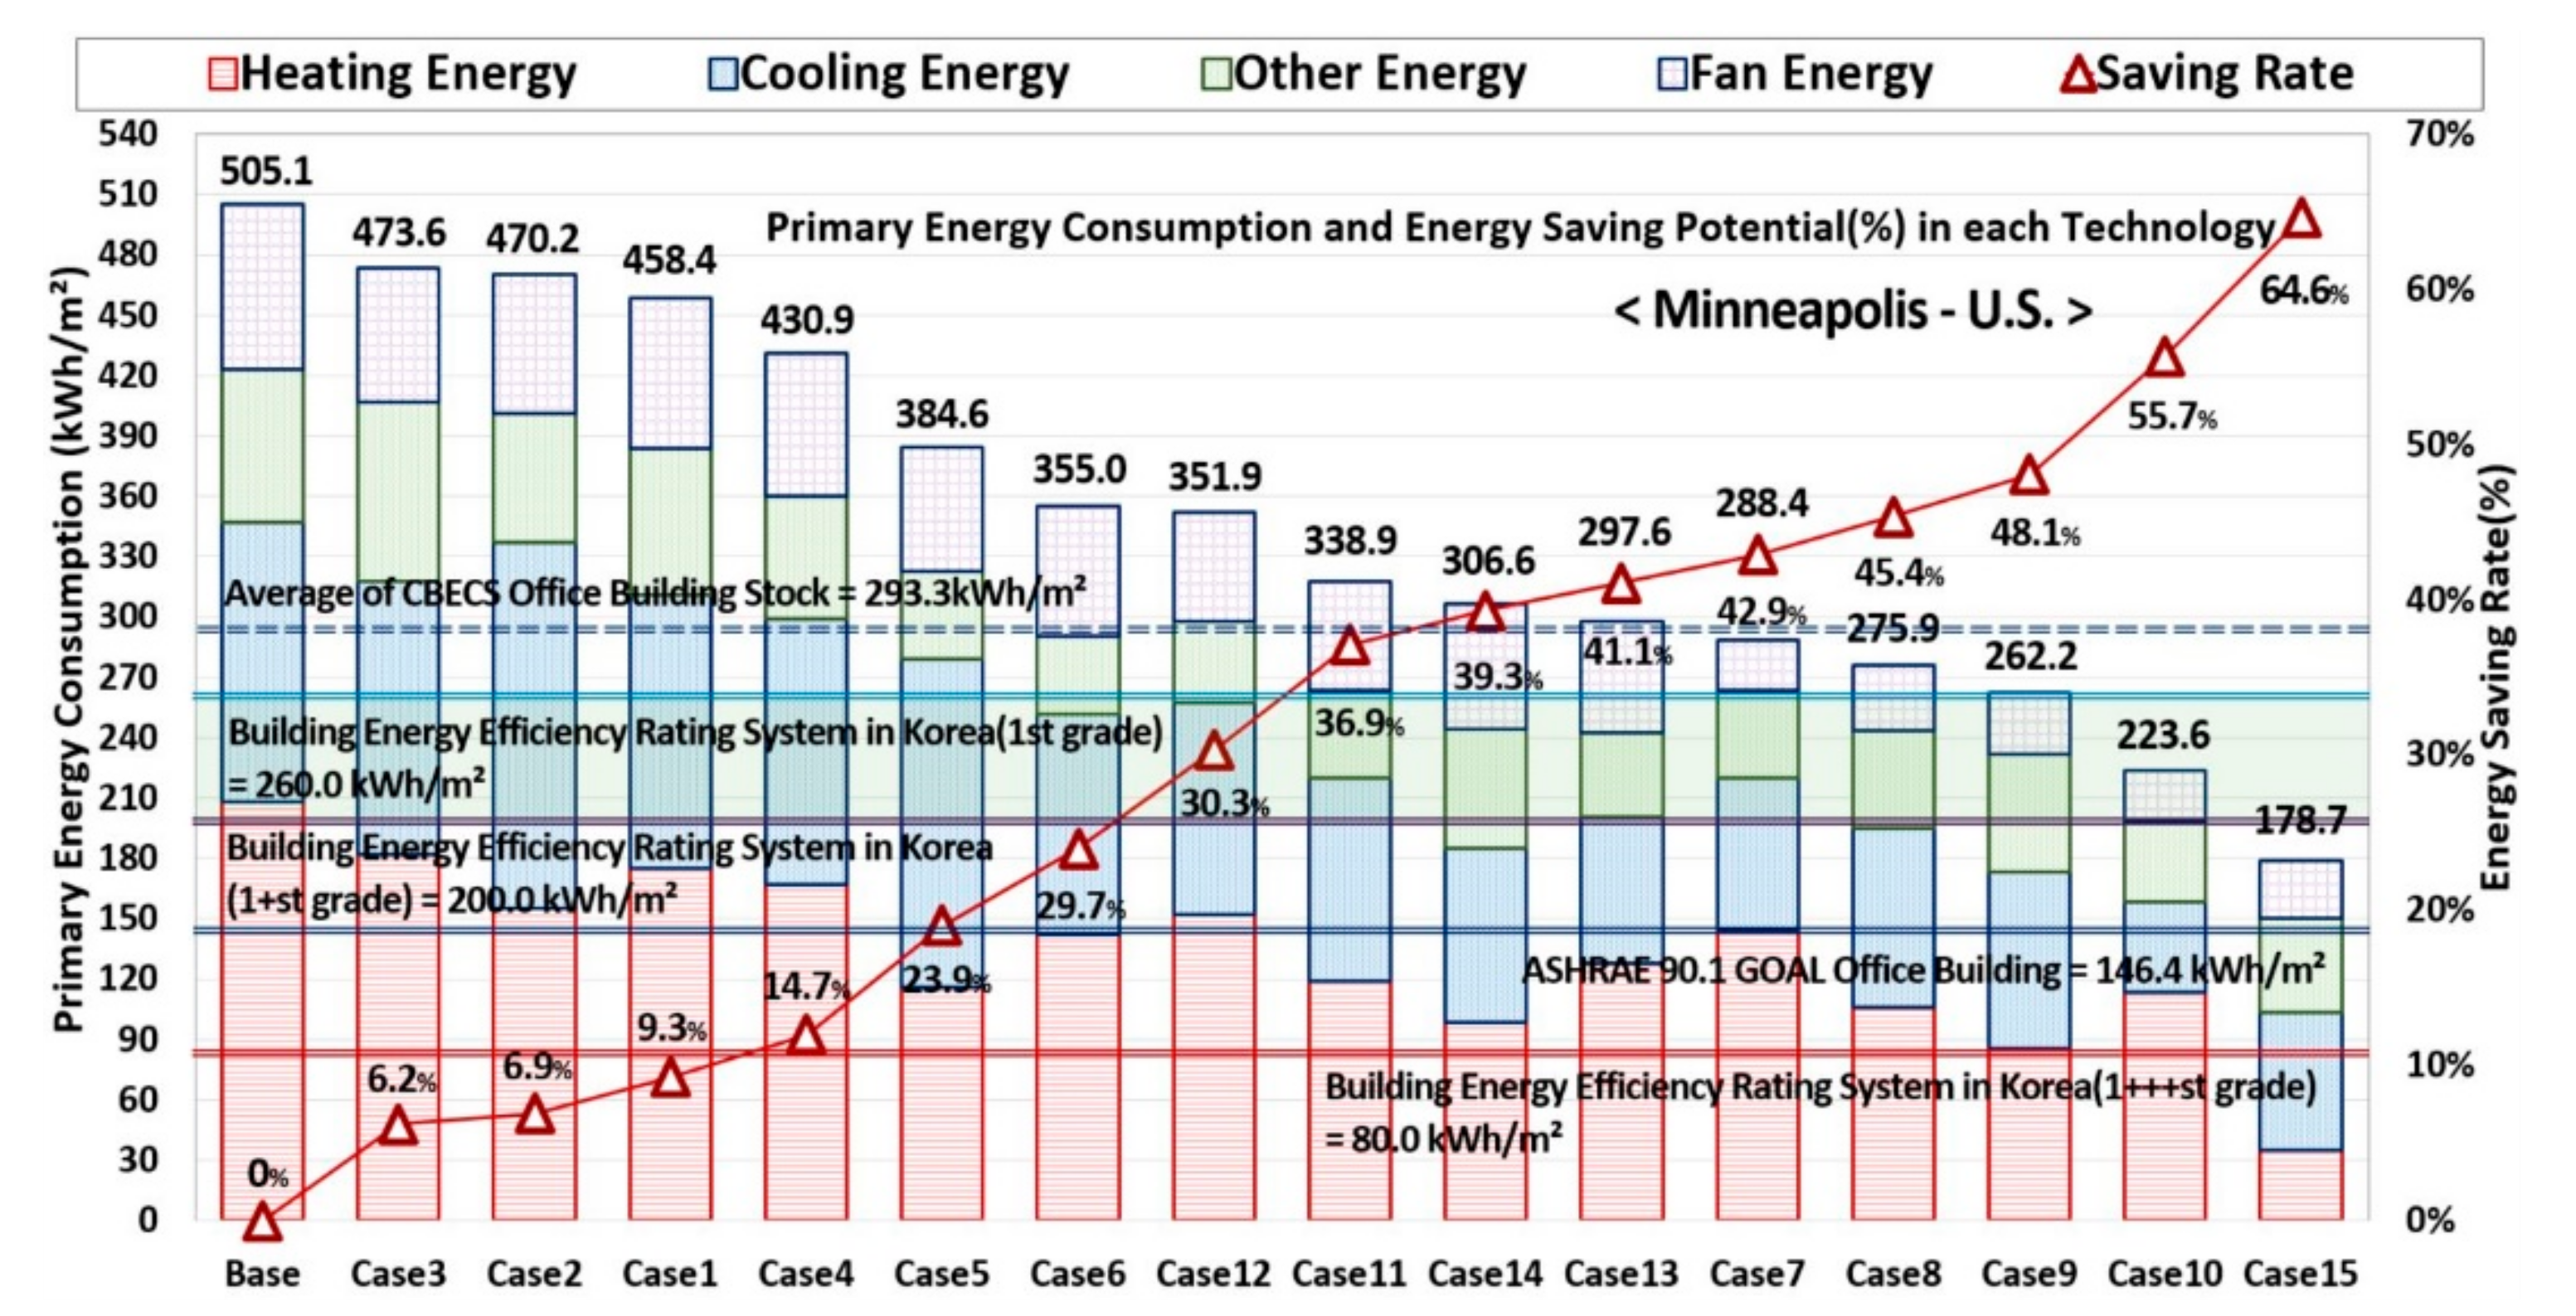
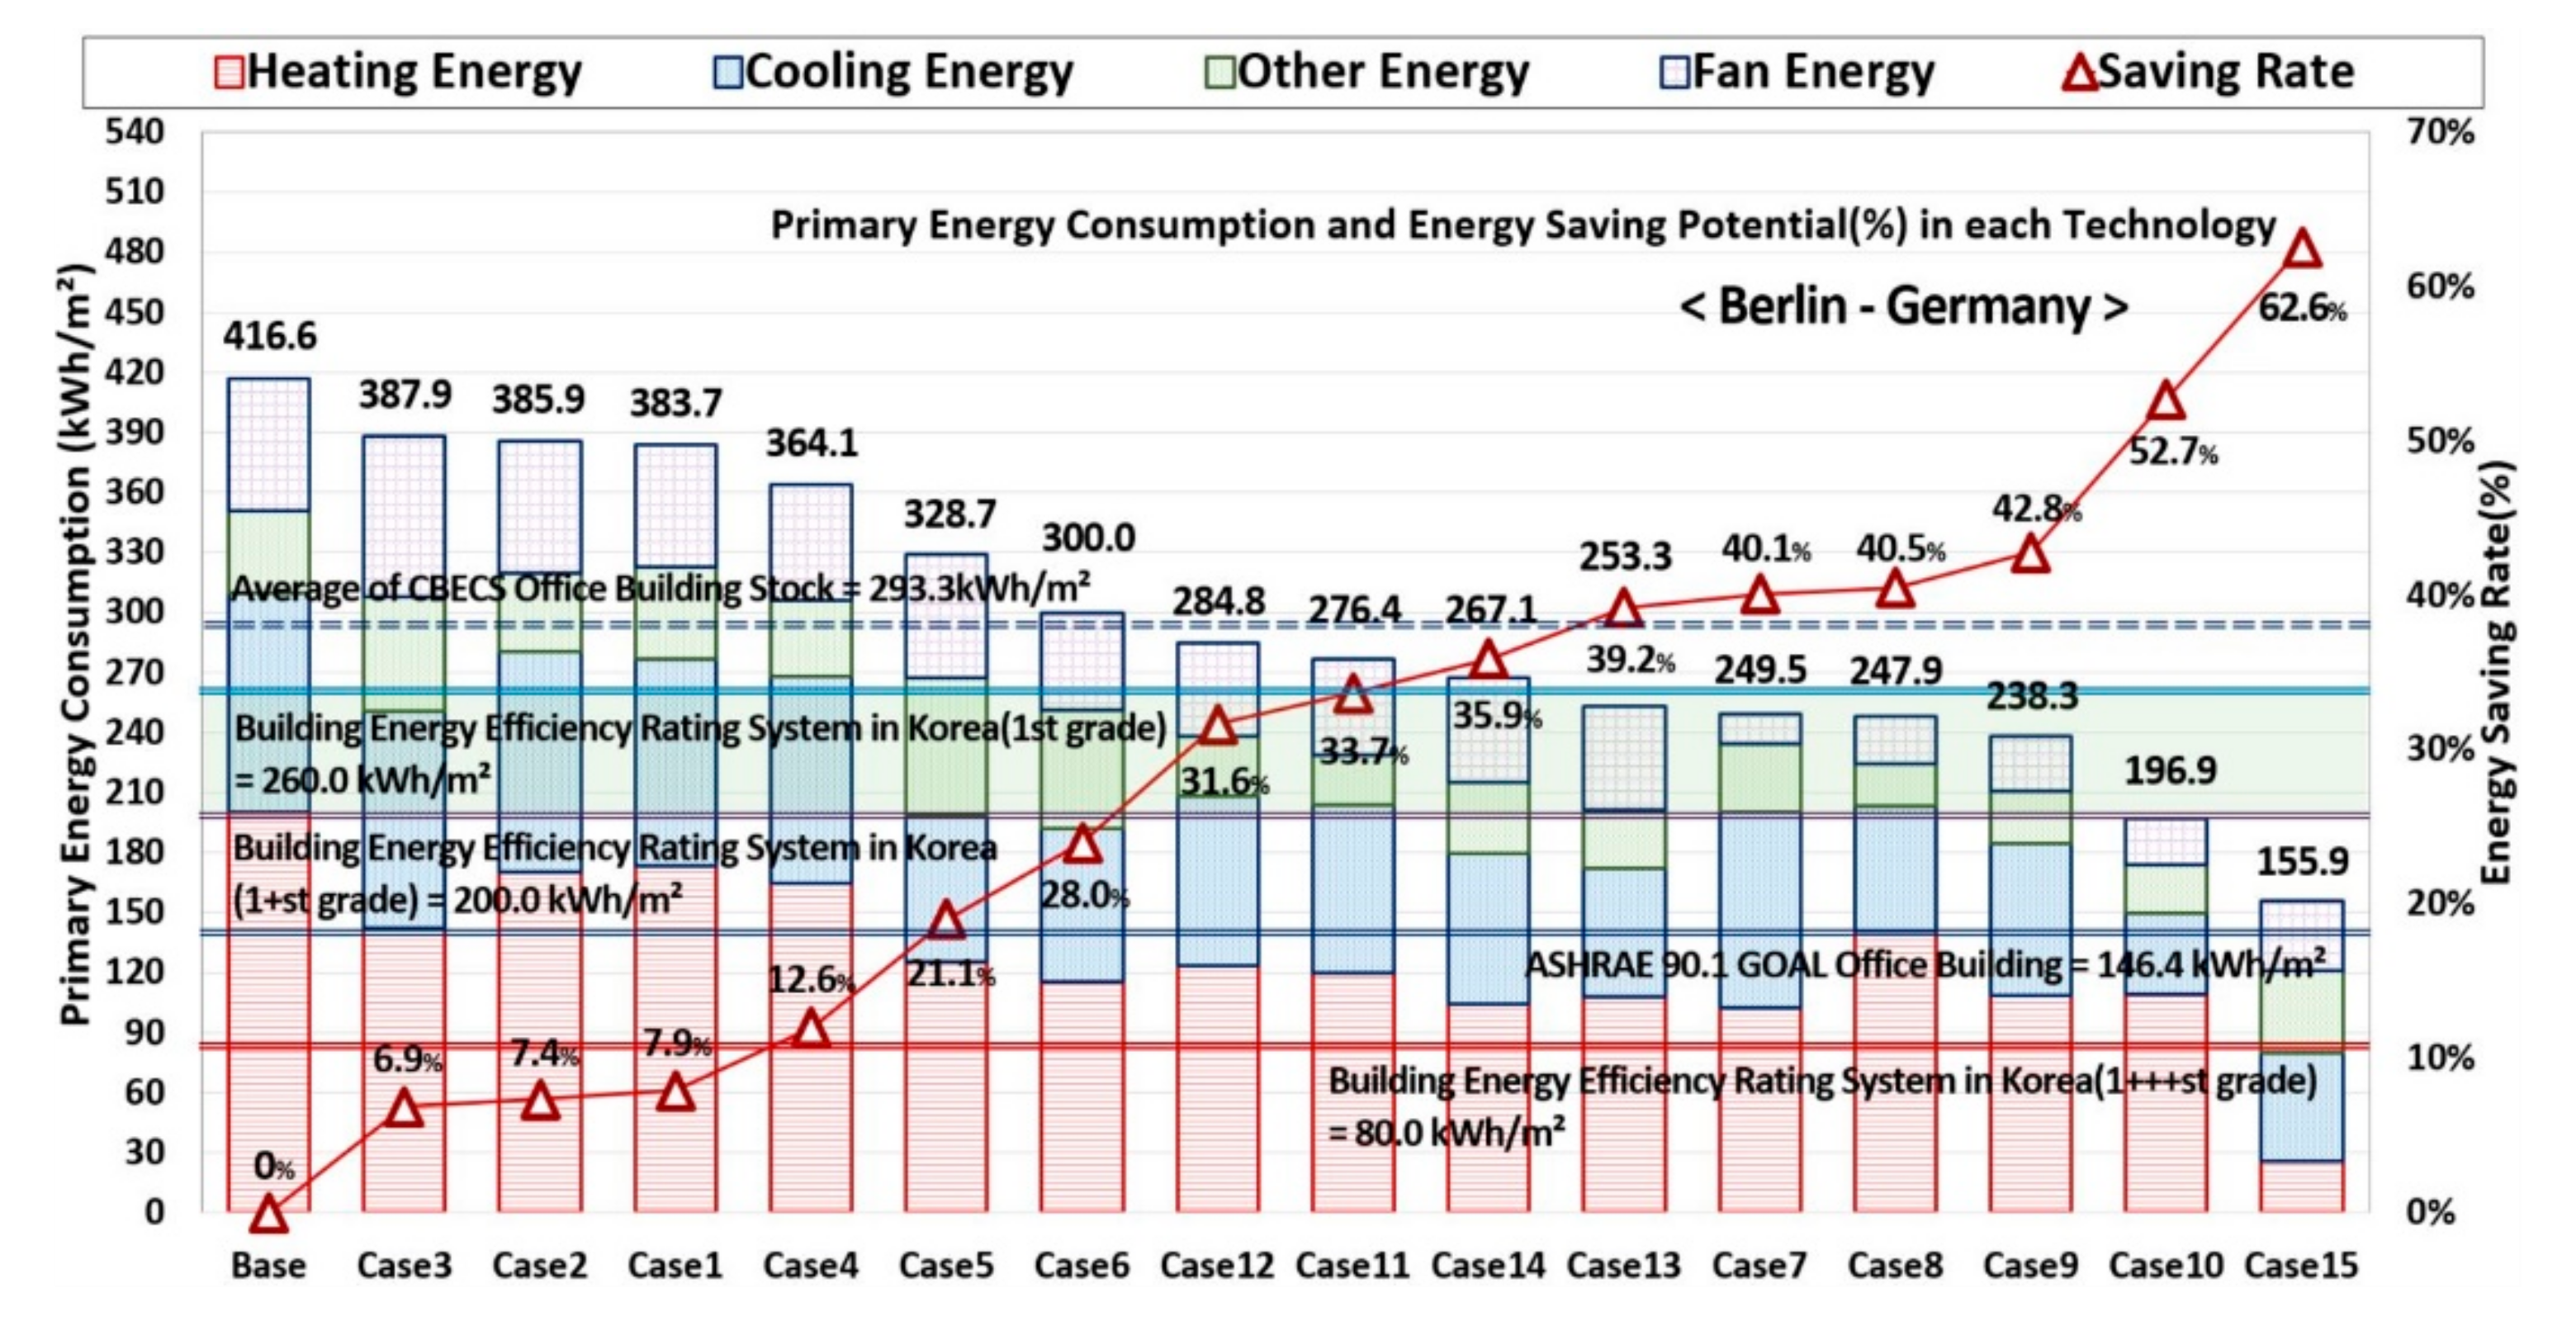
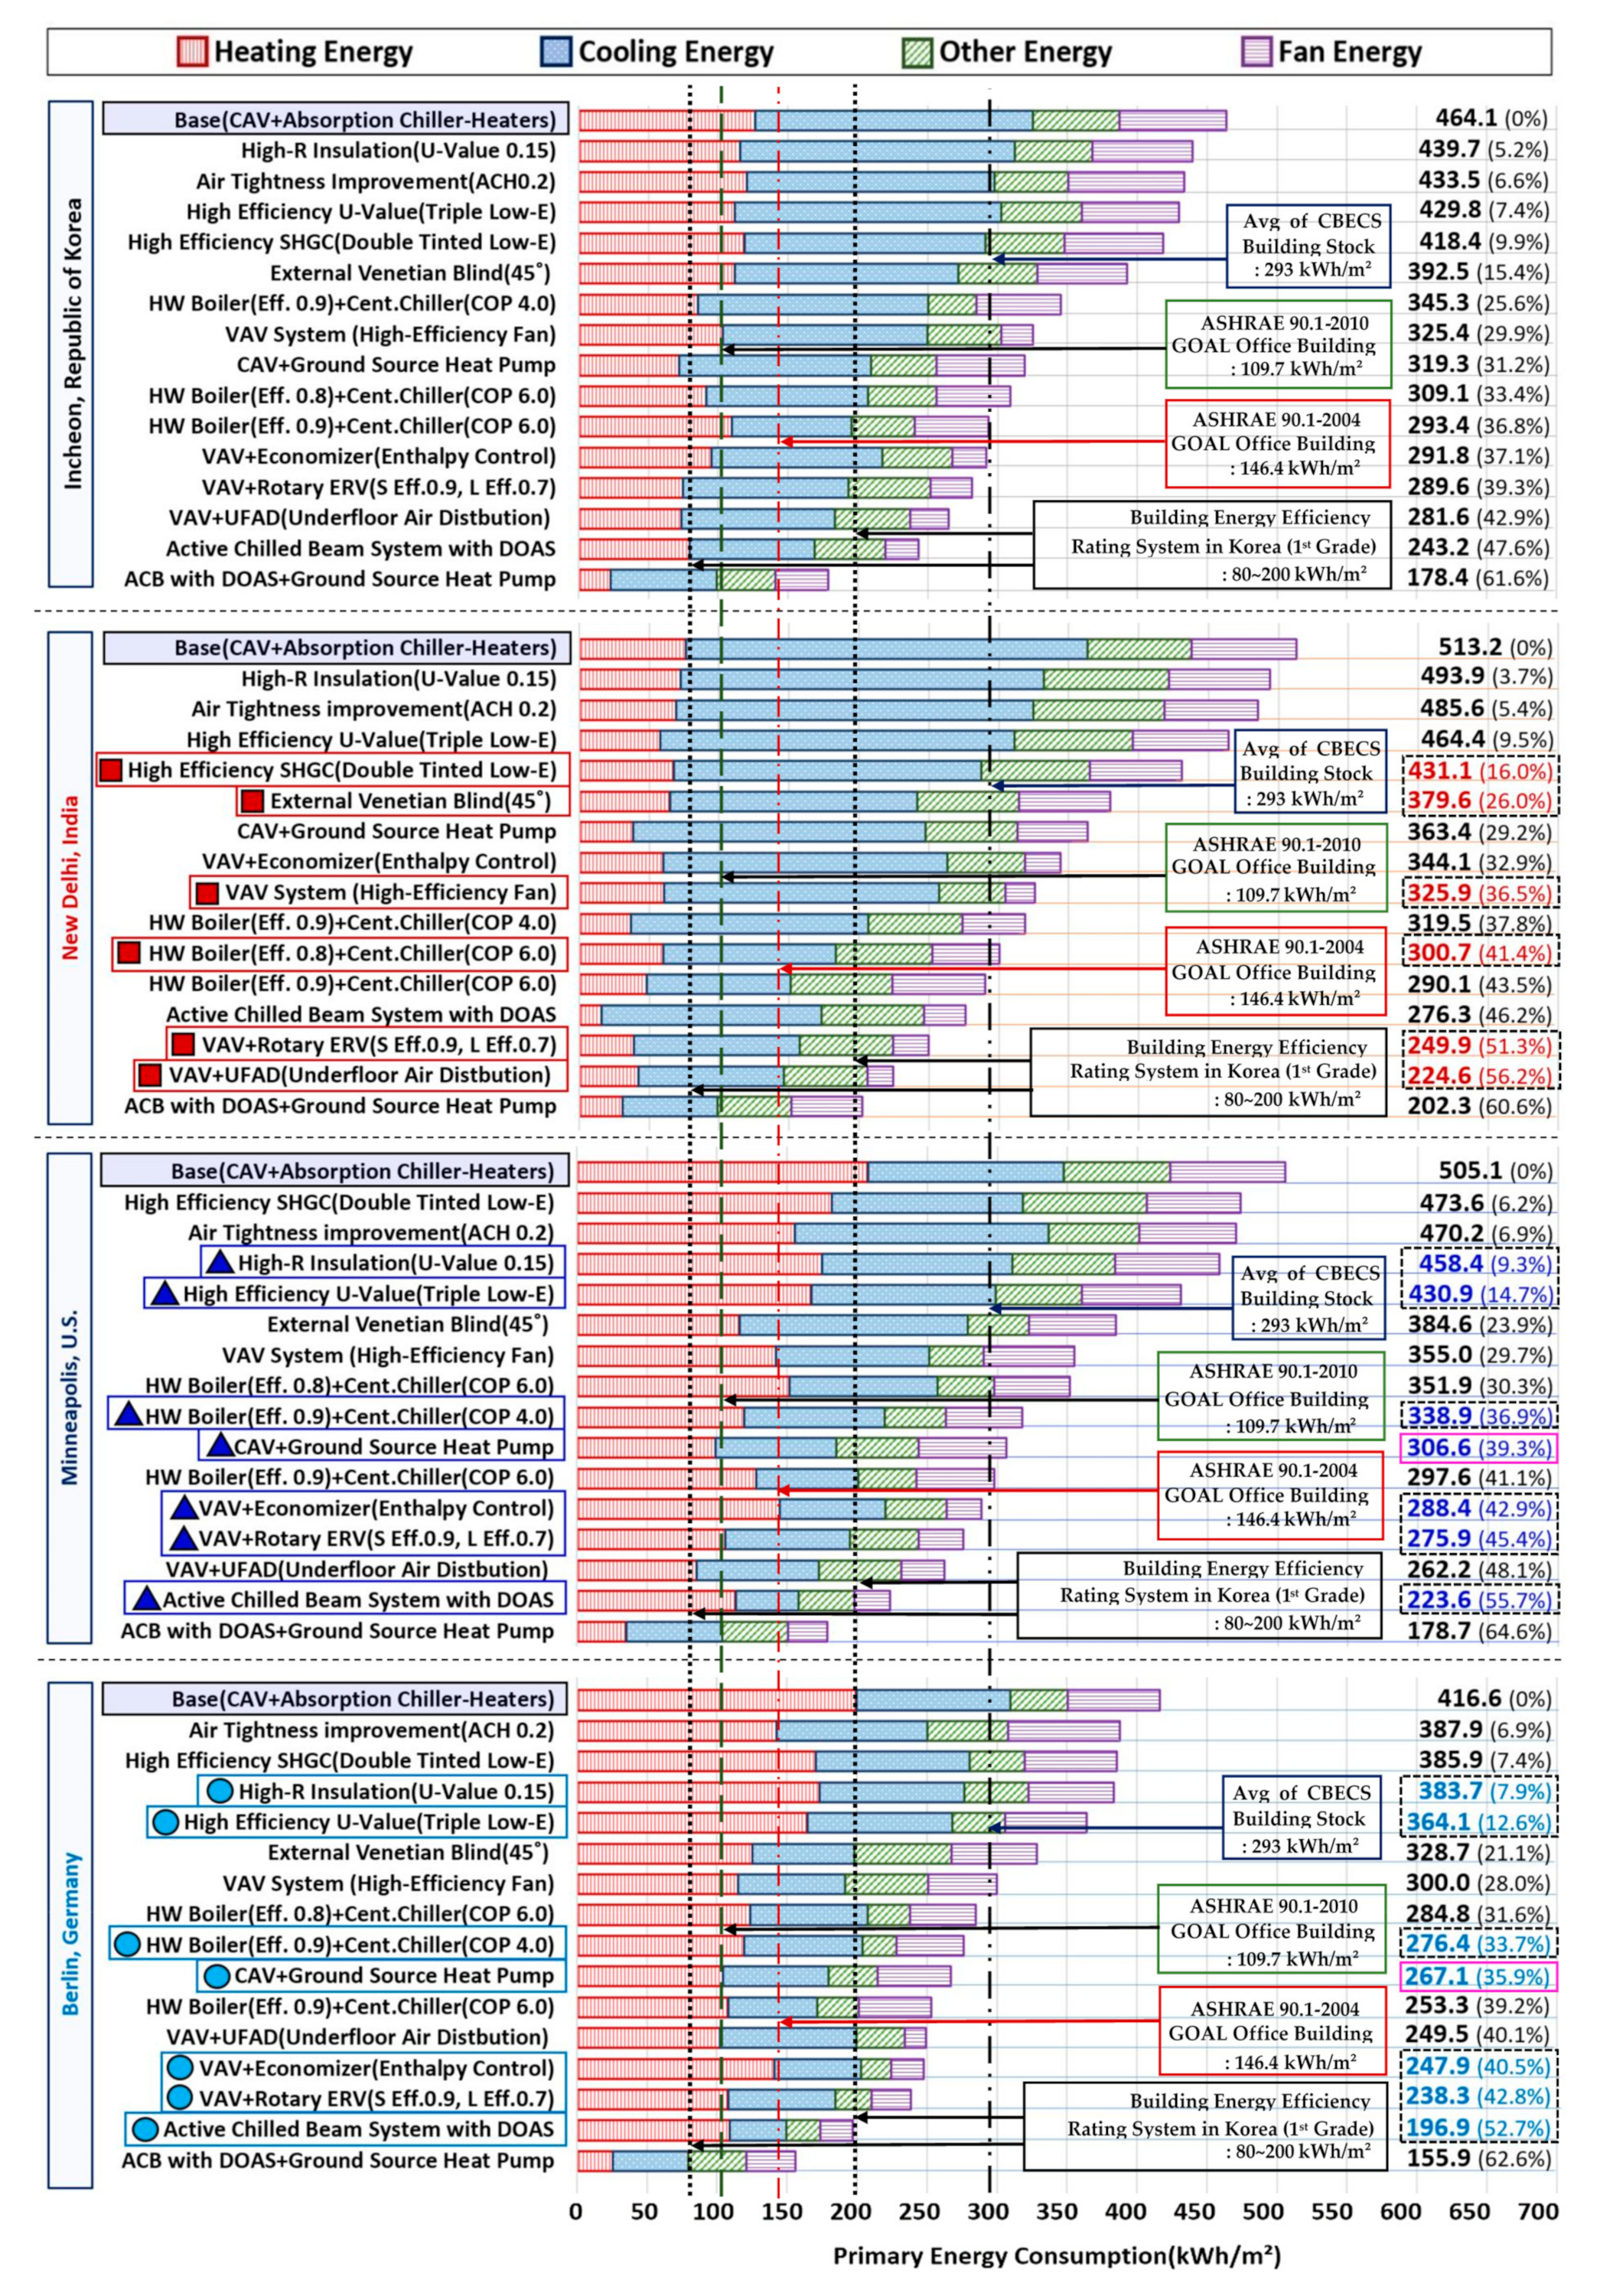
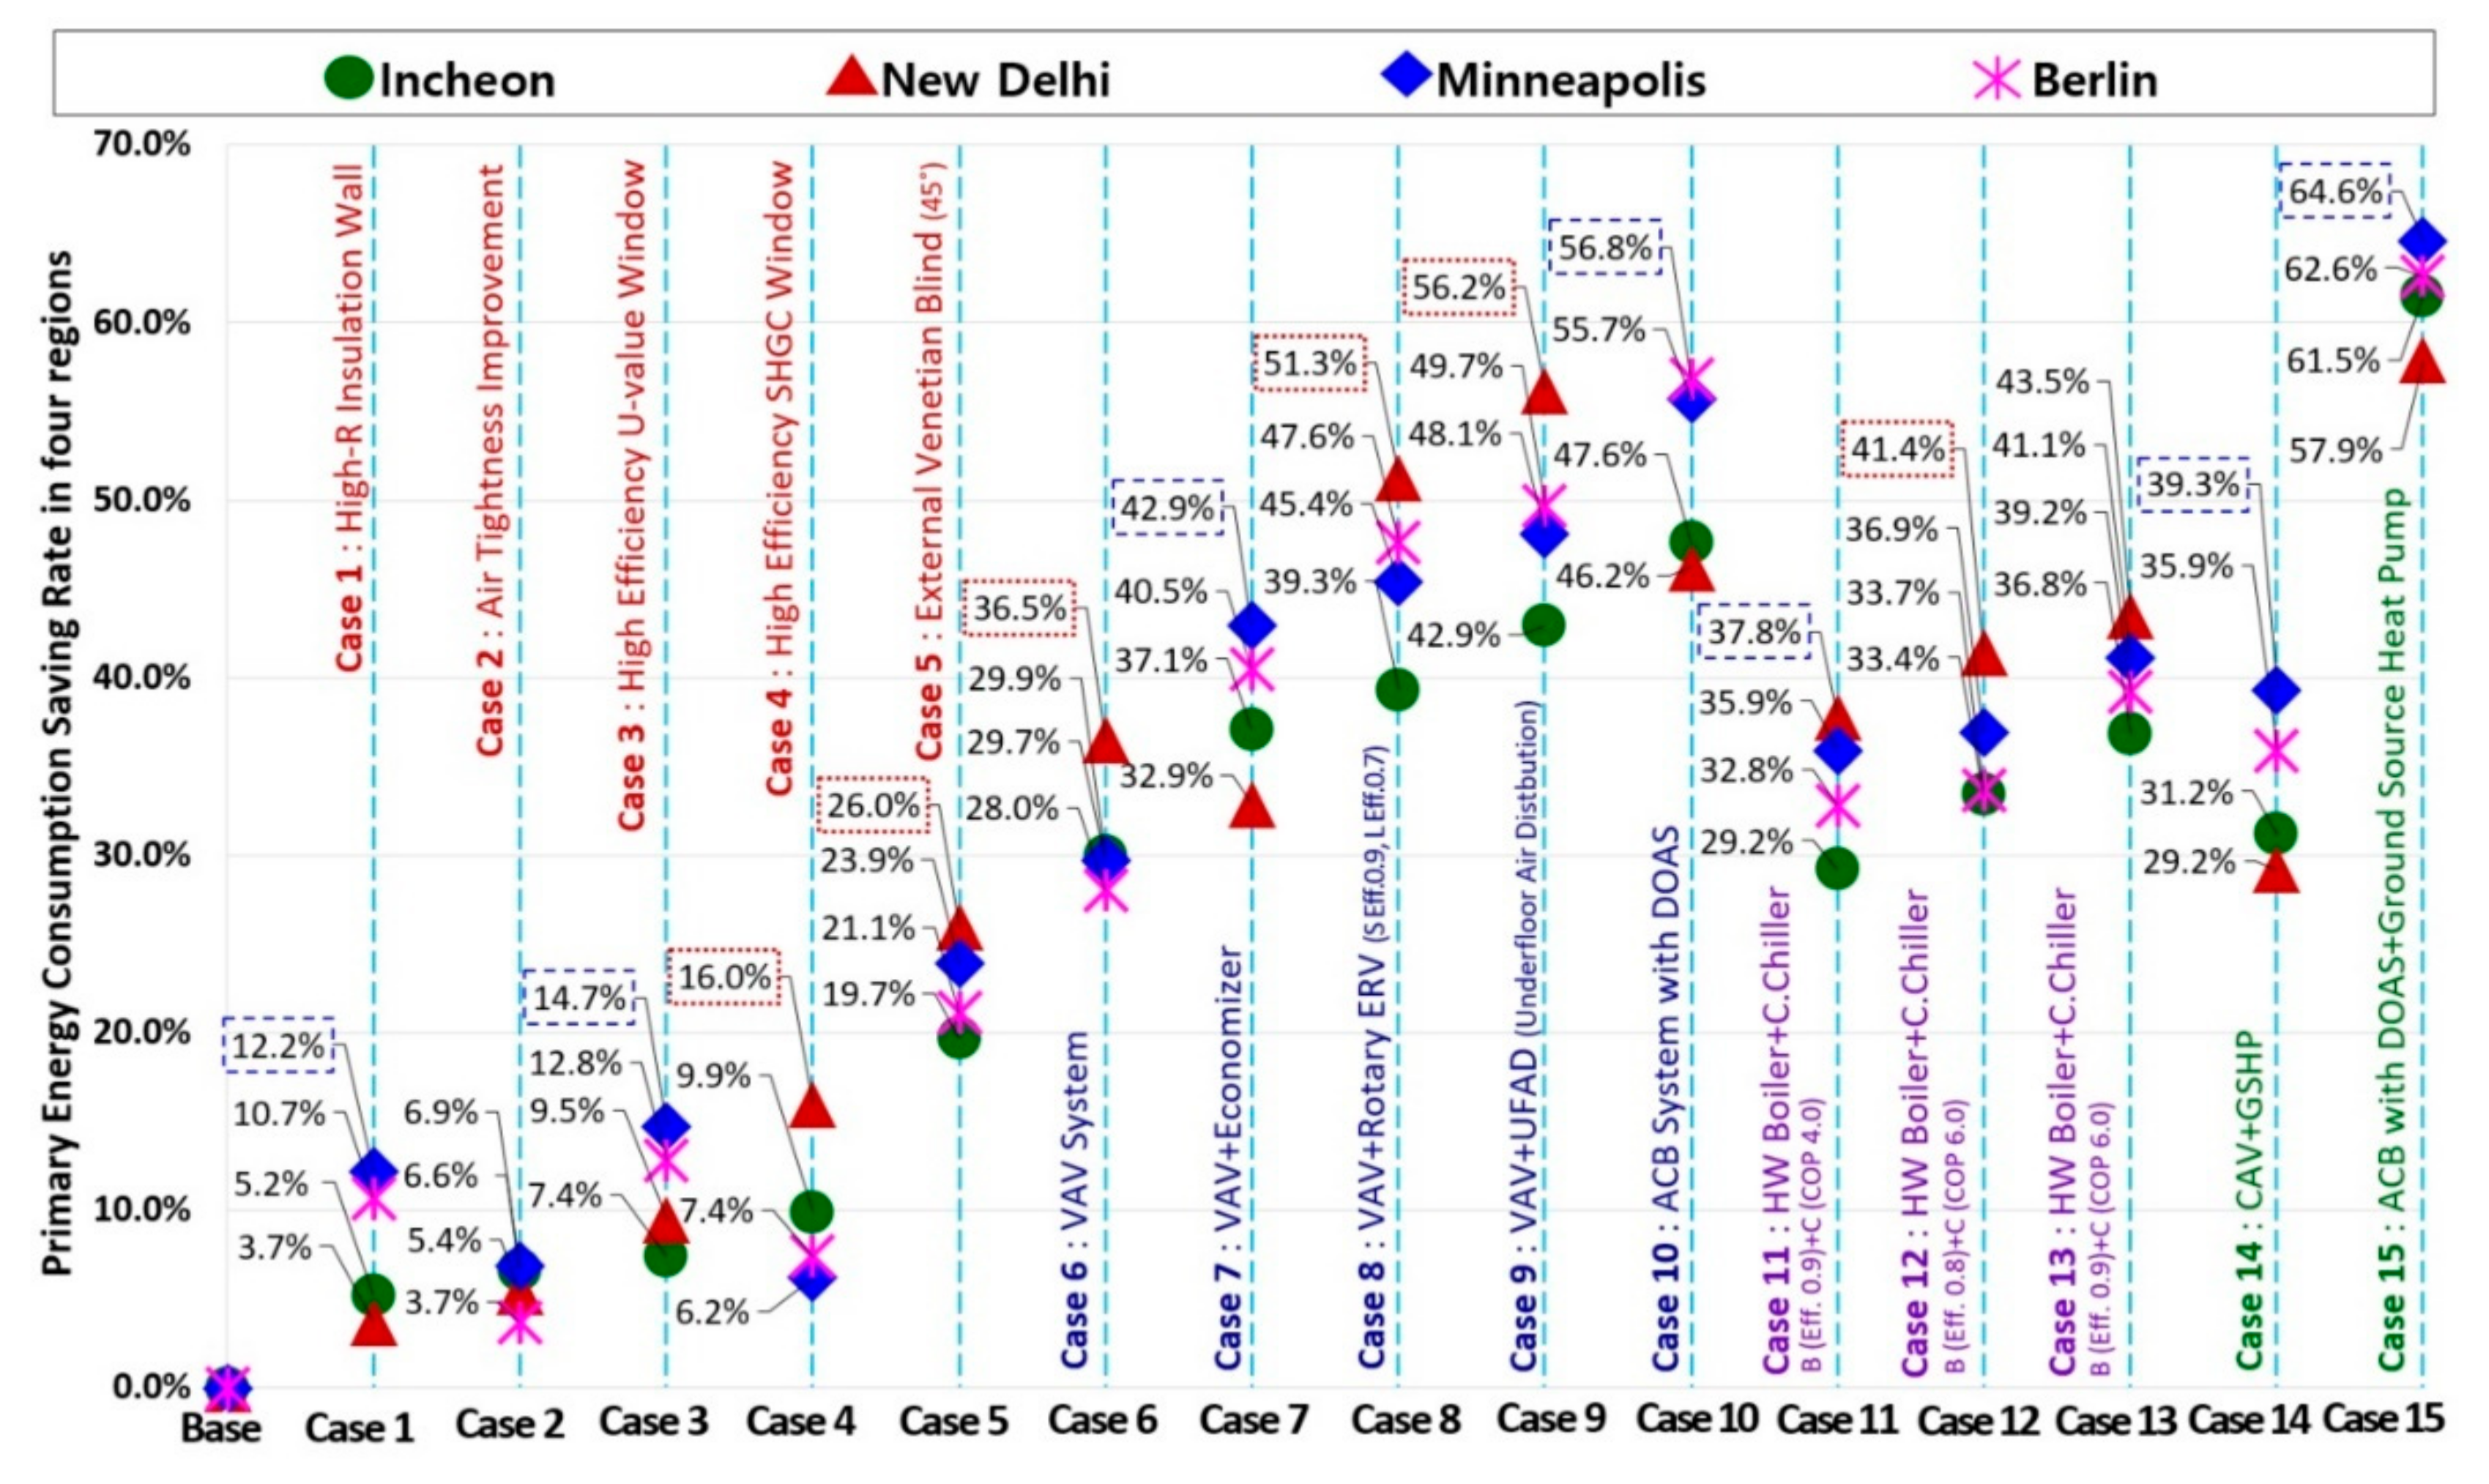
4.1. Analysis of Energy Saving Rate in Different Climate Zones
4.2. Comparison of Specific Energy Performance Simulation Results and Summary of Energy Saving Technologies in Different Climate Zones
5. Conclusions and Discussions
5.1. Summary and Conclusions
5.2. Limitation of Research and Future Work
Supplementary Materials
Author Contributions
Funding
Institutional Review Board Statement
Informed Consent Statement
Data Availability Statement
Acknowledgments
Conflicts of Interest
Abbreviations
| ACH | Air Change per Hour |
| ASHRAE | American Society of Heating, Refrigerating and Air-Conditioning Engineers |
| BLAST | Building Loads Analysis and System Thermodynamics |
| CAV | Constant Air Volume |
| CBECS | Commercial Buildings Energy Consumption Survey |
| CDD | Cooling Degree Days |
| COP | Coefficient of Performance |
| DOAS | Dedicated Outdoor Air System |
| DOE | U.S. Department of Energy |
| EIA | Energy Information Administration |
| ERV | Energy Recovery Ventilation |
| EPW | EnergyPlus Weather File |
| GSHP | Ground Source Heat Pump |
| HDD | Heating Degree Days |
| HVAC | Heating, Ventilation and Air Conditioning |
| HW Boiler | Hot Water Condensing Boiler |
| SHCG | Solar Heat Gain Coefficient |
| UFAD | Underfloor Air Distribution |
| VAV | Variable Air Volume |
| VLT | Visible Light Transmittance |
Appendix A

| Conservation System | Classification | Incheon | Berlin | ||
|---|---|---|---|---|---|
| Primary Energy Consumption (kWh/m2) | Energy Saving Rate | Primary Energy Consumption (kWh/m2) | Energy Saving Rate | ||
| Base | Total | 464.1 | - | 416.6 | - |
| Heating | 126.5 | 208.0 | |||
| Cooling | 198.7 | 139.3 | |||
| Fan | 76.8 | 81.8 | |||
| High-R Insulation Wall (0.15 W/m2·K) | Total | 418.4 | 5.2% | 383.7 | 7.9% |
| Heating | 115.9 | 8.4% | 175.1 | 13.2% | |
| Cooling | 196.3 | 1.2% | 135.9 | 6.1% | |
| Fan | 71.8 | 6.6% | 74.5 | 7.6% | |
| High Efficiency U-value Window | Total | 373.5 | 7.4% | 364.1 | 12.6% |
| Heating | 111.6 | 11.8% | 176.1 | 17.5% | |
| Cooling | 191.1 | 3.8% | 130.7 | 6.2% | |
| Fan | 69.6 | 9.3% | 72.3 | 11.5% | |
| High Efficiency Heating System | Total | 325.4 | 25.6% | 276.4 | 33.7% |
| Heating | 79.5 | 32.6% | 123.5 | 40.6% | |
| Cooling | 157.0 | 17.0% | 106.9 | 23.2% | |
| Fan | 52.7 | 21.0% | 58.2 | 28.9% | |
| CAV + GSHP | Total | 319.3 | 31.2% | 267.1 | 35.9% |
| Heating | 72.2 | 42.9% | 99.6 | 47.9% | |
| Cooling | 137.0 | 31.1% | 95.7 | 31.3% | |
| Fan | 62.8 | 18.2% | 64.7 | 20.9% | |
| VAV + Economizer | Total | 291.9 | 37.1% | 247.9 | 40.5% |
| Heating | 95.1 | 24.8% | 146.6 | 29.5% | |
| Cooling | 122.3 | 38.4% | 78.9 | 43.3% | |
| Fan | 24.1 | 68.7% | 29.1 | 64.4% | |
| VAV + ERV (Energy Recovery Ventilation) | Total | 289.6 | 39.3% | 238.3 | 42.8% |
| Heating | 74.7 | 40.9% | 95.3 | 45.8% | |
| Cooling | 118.8 | 40.2% | 42.9 | 30.8% | |
| Fan | 29.6 | 61.5% | 47.4 | 57.9% | |
| Active Chilled Beam System with DOAS | Total | 189.4 | 47.6% | 176.9 | 52.7% |
| Heating | 43.0 | 37.1% | 113.9 | 45.2% | |
| Cooling | 33,1 | 55.0% | 50.8 | 63.5% | |
| Fan | 21.3 | 69.3% | 28.9 | 64.7% | |
| Systems | ASHRAE Climate Zone | |
|---|---|---|
| Warm-Hot and Mixed Zone (Cooling Season) | Cool-Cold and Mixed Zone (Heating Season) | |
| Passive systems | High efficiency Solar Heat Gain Coefficient (SHGC) window External Venetian blind (shading device) | High-R insulation wall High efficiency U-value window |
| Active and renewable energy systems | VAV system (High-efficiency variable fan) Combined VAV-ERV system (Variable Air Volume, Energy Recovery Ventilation) Combined VAV-UFAD system (Underfloor Air Distribution) High-efficiency cooling equipment (High efficiency centrifugal chiller) | Combined VAV-economizer system Combined VAV-ERV system (Energy recovery ventilation) Active chilled beam with DOAS (Dedicated Outdoor Air System) Ground source heat pump High-efficiency cooling equipment (High efficiency hot water condensing boiler) |
References
- International Energy Agency. Energy conservation in buildings and community systems. In Annex 53: Total Energy Use in Buildings—Analysis and Evaluation Methods; International Energy Agency: Paris, France, 2013. [Google Scholar]
- International Energy Agency (IEA). Key World Energy Statistics International Online World Energy Statistics; IEA: Paris, France, 2016. [Google Scholar]
- Briner, G.; Prag, A. Establishing and Understanding Post-2020 Climate Change Mitigation Commitments; OECD: Paris, France, 2013. [Google Scholar]
- Tavoni, M.; Kriegler, E.; Riahi, K.; Van Vuuren, D.P.; Aboumahboub, T.; Bowen, A.; Calvin, K.; Campiglio, E.; Kober, T.; Jewell, J.; et al. Post-2020 Climate Agreements in the Major Economies Assessed in the Light of Global Models. Nat. Clim. Chang. 2015, 5, 119–126. [Google Scholar] [CrossRef]
- OECD/International Energy Agency. World Energy Outlook; International Energy Agency: Paris, France, 2010. [Google Scholar]
- New Building Institute (NBI). Getting to Zero 2012 Status Update: A First Look at the Costs and Features of Zero Energy Commercial Buildings; New Building Institute: Portland, OR, USA, 2012. [Google Scholar]
- Li, D.H.W.; Yang, L.; Lam, J.C. Zero energy buildings and sustainable development implications—A review. Energy 2013, 54, 1–10. [Google Scholar] [CrossRef]
- Ramseur, J.L. U.S. Greenhouse Gas Emissions: Recent Trends and Factors; Library of Congress, Congressional Research Service: Washington, DC, USA, 2014. [Google Scholar]
- Olivier, J.G.J.; Janssens-Maenhout, G.; Muntean, M.; Peters, J.A.H.W. Trends in Global CO2 Emissions: 2015 Report; PBL Netherlands Environmental Assessment Agency: The Hague, The Netherlands, 2015.
- U.S. Department of Energy (DOE). High-Performance Buildings-Value, Messaging, Financial and Policy Mechanisms; U.S. Department of Energy: Washington, DC, USA, 2011.
- National Renewable Energy Laboratory (NREL). Realizing High-Performance Buildings, How to Maintain Energy-Efficient Design Intent during Building Operation; NREL: Golden, CO, USA, 2015.
- Day, J.K.; Gunderson, D.E. Understanding high performance buildings: The link between occupant knowledge of passive design systems, corresponding behaviors, occupant comfort and environmental satisfaction. Build. Environ. 2015, 84, 114–124. [Google Scholar] [CrossRef]
- U.S. Department of Energy (DOE). EnergyPlus documentation engineering reference. In The Reference to EnergyPlus Calculations; U.S. Department of Energy: Washington, DC, USA, 2021. [Google Scholar]
- Li, C.; Hong, T.; Yan, D. An insight into actual energy use and its drivers in high-performance buildings. Appl. Energy 2014, 131, 394–410. [Google Scholar] [CrossRef] [Green Version]
- Hong, T.; Yang, L.; Hill, D.; Feng, W. Data and analytics to inform energy retrofit of high-performance buildings. Appl. Energy 2014, 126, 90–106. [Google Scholar] [CrossRef] [Green Version]
- Bahria, S.; Amirat, M.; Hamidat, A.; El Ganaoui, M.; Slimani, M.E. Parametric study of solar heating and cooling systems in different climates of Algeria—A comparison between conventional and high-performance buildings. Energy 2016, 113, 521–535. [Google Scholar] [CrossRef]
- Kim, C.-H.; Lee, S.-E.; Kim, K.-S. Analysis of Energy Saving Potential in High-Performance Building Technologies under Korean Climatic Conditions. Energies 2018, 11, 884. [Google Scholar] [CrossRef] [Green Version]
- Kim, C.-H.; Lee, S.-E.; Lee, K.-H.; Kim, K.-S. Detailed Comparison of the Operational Characteristics of Energy-Conserving HVAC Systems during the Cooling Season. Energies 2019, 12, 4160. [Google Scholar] [CrossRef] [Green Version]
- U.S. Department of Energy (DOE). Reference Commercial Buildings Report, Prototype Building Model Package. 2016. Available online: https://www.energycodes.gov/development/commercial/prototype_models (accessed on 26 July 2021).
- U.S. Department of Energy’s (DOE). Building Technologies Office (BTO) EnergyPlus Weather Data Source. 2017. Available online: https://energyplus.net/weather/sources (accessed on 26 July 2021).
- U.S. Energy Information Administration (EIA). Commercial Buildings Energy Consumption Survey (CBECS). 2017. Available online: https://www.eia.gov/consumption/commercial/ (accessed on 26 July 2021).
- ASHRAE. Energy Standard for Buildings Except Low-Rise Residential Buildings; ANSI/ASHRAE/IESNA Standard 90.1-2004; American Society of Heating, Refrigerating and Air-Conditioning Engineers: Peachtree Corners, GA, USA, 2004. [Google Scholar]
- ASHRAE. Energy Standard for Buildings Except Low-Rise Residential Buildings; ANSI/ASHRAE/IESNA Standard 90.1-2010; American Society of Heating, Refrigerating and Air-Conditioning Engineers: Peachtree Corners, GA, USA, 2010. [Google Scholar]
- Korea Ministry of Land, Infrastructure and Transport & Korea Energy Agency. Building Energy Saving Design Standards; Korea Ministry of Land, Infrastructure and Transport & Korea Energy Agency: Gyeonggi-do, Korea, 2018.
- United States Government Printing Office (GPO). Energy Policy Act of 2005, Public Law 109–58, Section 914; Building Standards; 109th Congress; GPO: Washington, DC, USA, 2011.
- United States Government Printing Office (GPO). Energy Independence and Security Act of 2007, Public Law 110–140, Title IV-Energy Savings in Buildings and Industry, Section 401; Definitions; 110th Congress; GPO: Washington, DC, USA, 2011.
- Krarti, M.; Deneuville, A. Comparative evaluation of optimal energy efficiency designs for French and U.S. office buildings. Energy Build. 2015, 93, 332–344. [Google Scholar] [CrossRef]
- Boyano, A.; Hernandez, P.; Wolf, O. Energy demands and potential savings in European office buildings: Case studies based on EnergyPlus simulations. Energy Build. 2013, 65, 19–28. [Google Scholar] [CrossRef]
- Jiang, B.; Mao, P.; Tan, Y.; Yao, X. A study of climate-responsive building technologies in different climate regions of China, Advancement of Construction Management and Real Estate. In Proceedings of the 20th International Symposium on Advancement of Construction Management and Real Estate; Springer: Berlin, Germany, 2016. [Google Scholar]
- Hurtado, L.A.; Rhodes, J.D.; Nguyen, P.H.; Kamphuis, I.G.; Webber, M.E. Quantifying demand flexibility based on structural thermal storage and comfort management of non-residential buildings: A comparison between hot and cold climate zones. Appl. Energy 2017, 195, 1047–1054. [Google Scholar] [CrossRef]
- Lam, J.C.; Wan, K.K.W.; Tsang, C.L.; Yang, L. Building energy efficiency in different climates. Energy Convers. Manag. 2008, 49, 2354–2366. [Google Scholar] [CrossRef]
- Thornton, B.A.; Wang, W.; Lane, M.D.; Rosenberg, M.I.; Liu, B. Technical Support Document: 50% Energy Savings Design Technology Packages for Medium Office Buildings; U.S. Department of Energy: Washington, DC, USA, 2009.
- Deru, M.; Field, K.; Studer, D.; Benne, K.; Griffith, B.; Torcellini, P.U.S. Department of Energy Commercial Reference Building Models of the National Building Stock; NREL (National Renewable Energy Laboratory: Golden, CO, USA, 2011.
- Korea Energy Agency (KEA); Korea Institute of Civil Engineering and Building Technology (KICT). Establishing Data Base of Building Energy Design Situation and Developing High Efficiency Building Design Guideline; KEA: Gyeonggi-Do, Korea, 2017. [Google Scholar]
- Korea Energy Agency, Korea Appraisal Board. Development of Building Energy Integrated Support System for the Spread of Low-Energy Building Workshop; Korea Energy Agency and Korea Appraisal Board DB: Ulsan, Korea, 2016. [Google Scholar]
- Ministry of Land, Infrastructure and Transport (MOLIT). Architecture Data Private Open System. Available online: https://open.eais.go.kr/main/main.do (accessed on 26 July 2021).
- Ministry of Land, Infrastructure and Transport. Building Energy Efficiency Certification System of Korea. 2017. Available online: http://www.molit.go.kr/USR/I0204/m_45/dtl.jsp?idx=14790 (accessed on 26 July 2021).
- DOE, US. M&V Guidelines: Measurement and Verification for Federal Energy Projects Version 3.0; US Department of Energy: Washington, DC, USA, 2008.
- American Society of Heating, Refrigerating and Air-Conditioning Engineers (ASHRAE). ASHRAE 90.1-2010 International Climate Zone Definitions; ASHRAE: Peachtree Corners, GA, USA, 2010. [Google Scholar]
- Mui, K.W. Energy policy for integrating the building environmental performance model of an air conditioned building in a subtropical climate. Energy Convers. Manag. 2006, 47, 2059–2069. [Google Scholar] [CrossRef]
- Rasouli, M.; Simonson, C.J.; Besant, R.W. Applicability and optimum control strategy of energy recovery ventilators in different climatic conditions. Energy Build. 2010, 42, 1376–1385. [Google Scholar] [CrossRef]
- Zhang, J.; Fung, A.S.; Jhingan, S. Analysis and feasibility study of residential integrated heat and energy recovery ventilator with built-in economizer using an excel spreadsheet program. Energy Build. 2014, 75, 430–438. [Google Scholar] [CrossRef]
- Alajmi, A.; El-Amer, W. Saving energy in commercial buildings by using underfloor air distribution (UFAD) system. Energy Convers. Manag. 2010, 51, 1637–1642. [Google Scholar] [CrossRef]
- Linden, P.F.; Keun, Y.J.; Tom, W.; Fred, B.; Ho, L.K.; Stefano, S.; Allan, D. Simulation of Energy Performance of Underfloor Air Distribution (UFAD) Systems; Center for the Built Environment, Building Energy Research Grant (BERG) Program: Berkeley, CA, USA, 2009. [Google Scholar]
- Khmelenko, V. Performance and Optimization of an Underfloor Air Distribution System in an Educational Building in a Hot and Humid Climate. Master’s Thesis, Texas A&M University, College Station, TX, USA, 2015. [Google Scholar]
- Li, X.; Malkawi, A. Multi-objective optimization for thermal mass model predictive control in small and medium size commercial buildings under summer weather conditions. Energy 2016, 112, 1194–1206. [Google Scholar] [CrossRef]
- Melo, A.P.; Lamberts, R.; de Souza Versage, R.; Zhang, Y. Is Thermal insulation always beneficial in hot climate. In Proceedings of the BS2015: 14th Conference of International Building Performance Simulation Association, Hyderabad, India, 7–9 December 2015; Volume 14. [Google Scholar]
- Jaber, S.; Ajib, S. Thermal and economic windows design for different climate zones. Energy Build. 2011, 43, 3208–3215. [Google Scholar] [CrossRef]
- Manz, H.; Menti, U.-P. Energy performance of glazings in European climates. Renew. Energy 2012, 37, 226–232. [Google Scholar] [CrossRef]
- Ozyurt, O.; Ekinci, D.A. Experimental study of vertical ground-source heat pump performance evaluation for cold climate in Turkey. Appl. Energy 2011, 88, 1257–1265. [Google Scholar] [CrossRef]
- Gschwenda, A.; Menzia, T.; Caskeyb, S.; Grollb, E.A.; Bertscha, S.S. Energy consumption of cold climate heat pumps in different climates—Comparison of single-stage and two-stage systems. Int. J. Refrig. 2016, 62, 193–206. [Google Scholar] [CrossRef]
- Miara, M.; Russ, C.; Günther, D.; Kramer, T.; Henning, H.M. Henning, Efficiency of heat pump systems under real operating conditions results of three monitoring campaigns in Germany. In Proceedings of the 10th IEA Heat Pump Conference, Tokyo, Japan, 16–19 May 2011. [Google Scholar]
- Wang, L.; Curcija, D.; Breshears, J. The energy saving potentials of zone-level membrane-based enthalpy recovery ventilators for VAV systems in commercial buildings. Energy Build. 2015, 109, 47–52. [Google Scholar] [CrossRef]
- McDowell, T.P.; Emmerich, S.J. Analysis of dedicated outdoor air systems for different climates. In Proceedings of the Ninth International IBPSA Conference, Montreal, QC, Canada, 15–18 August 2005. [Google Scholar]
- Saber, E.M.; Iyengar, R.; Mast, M.; Meggers, F.; Tham, K.W.; Leibundgut, H. Thermal comfort and IAQ analysis of a decentralized DOAS system coupled with radiant cooling for the tropics. Build. Environ. 2014, 82, 361–370. [Google Scholar] [CrossRef]
- Deng, S. Energy Benefits of Different Dedicated Outdoor Air Systems Configurations in Various Climates. Master’s Thesis, The Graduate College at the University of Nebraska, Lincoln, NE, USA, 2014. [Google Scholar]

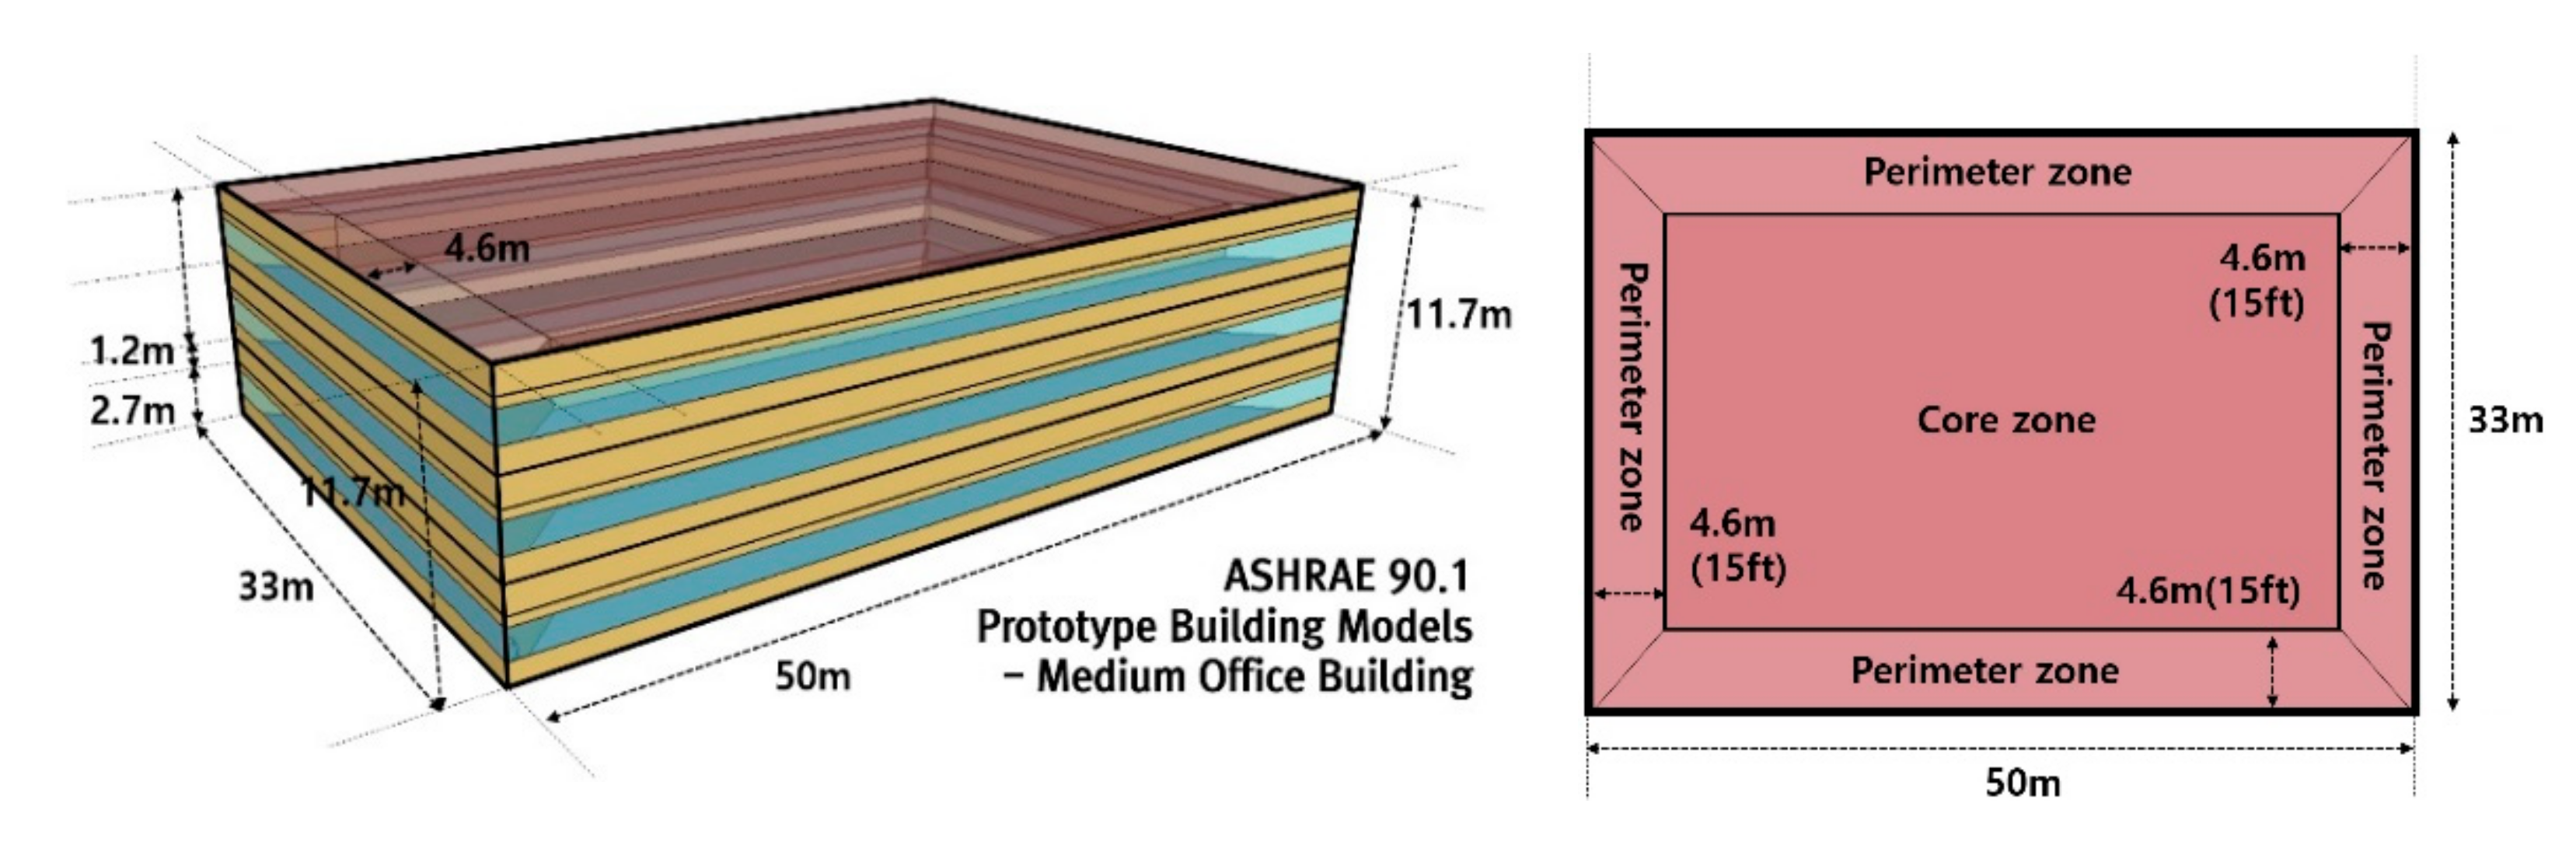

| Division | Specifications of Base Model | |
|---|---|---|
| Usage | Office Building | |
| Floor Area and Direction | 1650 m2 (50 m × 33 m × 11.7 m) and South | |
| Simulation Program | EnergyPlus v9.5.0 (Dynamic simulation tool) | |
| Base Model Envelope | U-Value of Wall | 0.26 W/m2·K |
| The Korean energy saving design standards | ||
| U-Value of Floor | 0.22 W/m2·K | |
| The Korean energy saving design standards | ||
| U-Value of Roof | 0.15 W/m2·K | |
| The Korean energy saving design standards | ||
| Glazing Type (Low-E 6T + 12A + 6CL) | Double Low-E Pane Glazing (U-value = 1.5 W/m2·K, SHGC = 0.458, VLT = 0.698) | |
| The Korean energy saving design standards | ||
| Base Model System | Terminal Unit | CAV System |
| AHU Fan type | Constant Air Volume | |
| SA Setpoint Temp. Relative Humidity | Cooling Temp. 20 °C, Heating Temp. 26 °C/Relative Humidity 50~60% | |
| The Korean energy saving design standards | ||
| Cooling/Heating Operation Schedule | Cooling Operation (May—Oct): 07:00~18:00 (26.0 °C) | |
| Heating Operation (Nov—Apr): 07:00~18:00 (20.0 °C) | ||
| Plant System | Absorption chiller-heaters (heating COP 0.8, cooling COP 1.0) | |
| Pump Efficiency | 0.6 (Default) | |
| Lighting and Equipment Occupancy density | 12 W/m2, 11 W/m2 | |
| 0.2 person/m2 | ||
| The Korean energy saving design standards, The MOTIE and KICT report | ||
| Infiltration | 3.0 ACH50 | |
| The Korean energy saving design standards | ||
| Schedule | Weekday—08:00~18:00, Weekend—Off | |
| The Korean energy saving design standards | ||
| Weather Data | Incheon, South Korea (ASHRAE climate zone 4) | |
| New Delhi, India (ASHRAE climate zone 2) | ||
| Berlin, Germany (ASHRAE climate zone 5) | ||
| Minneapolis, U.S. (ASHRAE climate zone 6) | ||
| Model | Building Envelope | HVAC System | |||
|---|---|---|---|---|---|
| Wall (U-Value) | Glazing and Solar Shading System | Infiltration | Air-Conditioning System | Plant System | |
| Base | 0.47 W/m2·K | Double Low-E (No Blind) (U-value 1.5 W/m2·K, SHGC 0.458, VLT 0.698) | 3.0 ACH | CAV System | Absorption Chiller-Heaters (Cooling COP 1.0, Heating COP 0.8) |
| Case 1 * | 0.15 W/m2·K | Double Low-E (No Blind) | 3.0 ACH | CAV System | Absorption Chiller-Heaters (Cooling COP 1.0, Heating COP 0.8) |
| Case 2 * | 0.47 W/m2·K | Double Low-E (No Blind) | 0.2 ACH | ||
| Case 3 * | Double Tinted Low-E (U-value 1.4 W/m2·K, SHGC 0.353, VLT 0.511) | 3.0 ACH | |||
| Case 4 * | Triple Low-E (U-value 1.1 W/m2·K, SHGC 0.433, VLT 0.527) | ||||
| Case 5 * | External Venetian Blind 45° (Double Low-E) | ||||
| Case 6 ** | 0.47 W/m2·K | Double Low-E (No Blind) | 3.0 ACH | VAV System (Fan Pressure: 1000 Pa, Minimum air flow rate: 30%) | Absorption Chiller-Heaters (Cooling COP 1.0, Heating COP 0.8) |
| Case 7 ** | VAV + Economizer (Fixed dry bulb control, Maximum limit dry bulb T: 24 °C) | ||||
| Case 8 ** | VAV + Rotary ERV (Sensible eff. 0.9, Latent eff. 0.7) | ||||
| Case 9 ** | VAV +UFAD (Underfloor Air Distribution) | ||||
| Case 10 ** | Active Chilled Beam with DOAS (Entering water T: 14~16 °C, Mean coil temperature to room design temperature difference: 2~4 °C) | ||||
| Case 11 *** | 0.47 W/m2·K | Double Low-E (No Blind) | 3.0 ACH | CAV System | HW Boiler (Eff.90%) + Cent. Chiller (COP 4.0) |
| Case 12 *** | HW Boiler (Eff.80%) + Cent. Chiller (COP 6.0) | ||||
| Case 13 *** | HW Boiler (Eff.90%) + Cent. Chiller (COP 6.0) | ||||
| Case 14 **** | 0.47 W/m2·K | Double Low-E (No Blind) | 3.0 ACH | CAV System | GSHP (Heat Exchanger: Vertical ground-coupled, GSHP Capacity: 280 RT, System COP 3.75 (Cooling), System COP 3.15 (Heating)) |
| Case 15 **** | Active Chilled Beam with DOAS | GSHP (Heat Exchanger: Vertical ground-coupled, GSHP Capacity: 280 RT, System COP 3.75 (Cooling), System COP 3.15 (Heating)) | |||
| Building Name | Area | Energy (kWh) | Monthly Site Energy Consumption | ||||||||||||
|---|---|---|---|---|---|---|---|---|---|---|---|---|---|---|---|
| Jan. | Feb. | Mar. | Apr. | May. | Jun. | Jul. | Aug. | Sep. | Oct. | Nov. | Dec. | Total | |||
| 1 | 2032 (m2) | Elec. | 36.5 | 35.9 | 27.6 | 25.7 | 20.6 | 25.7 | 31.0 | 34.2 | 31.8 | 21.7 | 23.6 | 29.1 | 345.5 |
| Jonghap | Gas | 20.7 | 17.1 | 13.6 | 8.8 | 1.9 | 2.3 | 10.4 | 16.7 | 21.9 | 5.3 | 0.2 | 3.0 | 121.9 | |
| Total Primary Consumption | 467.5 | ||||||||||||||
| 2 | 20,409 (m2) | Elec. | 28.3 | 23.6 | 24.6 | 21.3 | 22.9 | 30.7 | 35.2 | 35.5 | 30.9 | 27.8 | 26.7 | 33.7 | 341.2 |
| Imkwang | Gas | 16.7 | 13.8 | 9.7 | 1.3 | 2.0 | 12.4 | 16.6 | 21.7 | 14.0 | 2.8 | 3.5 | 15.9 | 130.4 | |
| Total Primary Consumption | 471.6 | ||||||||||||||
| 3 | 4253 (m2) | Elec. | 31.2 | 25.1 | 27.3 | 23.0 | 25.2 | 32.6 | 34.5 | 32.1 | 25.9 | 21.3 | 22.7 | 32.5 | 333.2 |
| Chunglim | Gas | 15.9 | 18.4 | 14.2 | 13.1 | 2.7 | 4.7 | 14.0 | 15.4 | 15.8 | 8.3 | 0.4 | 7.4 | 130.4 | |
| Total Primary Consumption | 463.4 | ||||||||||||||
| 4 | 3671 (m2) | Elec. | 27.8 | 29.3 | 28.2 | 27.9 | 23.3 | 27.2 | 27.2 | 24.9 | 26.1 | 22.0 | 25.0 | 26.6 | 315.4 |
| Gomuas | Gas | 16.6 | 13.2 | 9.3 | 3.5 | 8.6 | 18.1 | 19.3 | 22.8 | 13.0 | 9.4 | 3.5 | 15.8 | 153.2 | |
| Total Primary Consumption | 468.6 | ||||||||||||||
| 5 | 10,465 (m2) | Elec. | 35.8 | 34.1 | 27.0 | 24.5 | 21.3 | 27.3 | 35.2 | 40.0 | 35.1 | 24.7 | 22.8 | 22.8 | 350.6 |
| Wooshin | Gas | 15.5 | 15.3 | 9.9 | 8.7 | 0.4 | 1.7 | 12.2 | 18.2 | 20.2 | 12.3 | 1.0 | 6.5 | 122.1 | |
| Total Primary Consumption | 472.6 | ||||||||||||||
| 6 | 6218 (m2) | Elec. | 31.7 | 33.6 | 25.5 | 23.9 | 20.1 | 23.4 | 24.9 | 25.1 | 25.3 | 21.3 | 23.5 | 26.1 | 304.2 |
| KOITA | Gas | 24.1 | 21.9 | 17.4 | 10.8 | 2.4 | 6.6 | 17.8 | 20.5 | 20.8 | 13.4 | 5.4 | 8.8 | 169.9 | |
| Total Primary Consumption | 474.1 | ||||||||||||||
| 7 | 8157 (m2) | Elec. | 30.0 | 29.7 | 23.1 | 24.2 | 21.1 | 26.7 | 31.4 | 35.1 | 32.5 | 22.0 | 20.0 | 22.5 | 318.3 |
| Bangbae | Gas | 26.3 | 19.4 | 14.0 | 5.7 | 4.5 | 13.9 | 16.1 | 19.1 | 7.0 | 0.7 | 7.7 | 17.0 | 151.5 | |
| Total Primary Consumption | 469.8 | ||||||||||||||
| Simulation Result | Area | Energy (kWh) | Monthly Site Energy Consumption | ||||||||||||
| Jan. | Feb. | Mar. | Apr. | May. | Jun. | Jul. | Aug. | Sep. | Oct. | Nov. | Dec. | Total | |||
| 4500 (m2) | Elec. | 29.9 | 27.6 | 25.2 | 24.3 | 23.3 | 29.5 | 32.1 | 32.3 | 28.2 | 22.8 | 24.9 | 31.9 | 332.0 | |
| Gas | 18.2 | 15.2 | 11.5 | 5.1 | 3.6 | 7.5 | 17.8 | 19.3 | 14.7 | 5.3 | 3.7 | 10.2 | 132.1 | ||
| Total Primary Consumption | 464.1 | ||||||||||||||
| Regions | ASHRAE Climate | Köppen Climate | Latitude N(°) | Longitude E(°) | Outdoor Air Temperature (Average Monthly) Min. Avg. Max (°C) | Relative Humidity (Average Monthly) Min. Avg. Max (%) | HDD (18 °C) | CDD (18 °C) |
|---|---|---|---|---|---|---|---|---|
| Incheon | 4A | Dwa | 37.48 | 126.55 | −2.2/11.8/25.0 | 46.5/68.8/86.3 | 2762 | 611 |
| New Delhi | 2A | Aw | 26.62 | 77.20 | 14.1/24.7/33.2 | 63.1/73.5/86.6 | 286 | 3010 |
| Berlin | 5A | Cfb | 52.52 | 13.39 | 0.3/9.8/19.1 | 38.4/62.5/74.6 | 3283 | 147 |
| Minneapolis | 6A | Dfb | 46.97 | −93.26 | −9.9/4.8/17.5 | 49.7/67.3/77.2 | 4202 | 417 |
| Conservation System | Classification | Incheon | New Delhi | ||
|---|---|---|---|---|---|
| Primary Energy Consumption (kWh/m2) | Energy Saving Rate | Primary Energy Consumption (kWh/m2) | Energy Saving Rate | ||
| Base | Total | 464.1 | - | 513.2 | - |
| Heating | 126.5 | 76.3 | |||
| Cooling | 198.7 | 287.1 | |||
| Fan | 76.8 | 75.2 | |||
| High Efficiency SHGC Window | Total | 418.4 | 9.9% | 431.1 | 16.0% |
| Heating | 118.8 | 6.1% | 67.7 | 11.2% | |
| Cooling | 172.8 | 13.1% | 215.8 | 23.4% | |
| Fan | 70.5 | 8.2% | 65.8 | 12.5% | |
| External Venetian Blind | Total | 392.5 | 15.4% | 379.6 | 26.0% |
| Heating | 112.0 | 11.5% | 64.8 | 15.1% | |
| Cooling | 159.7 | 19.6% | 180.9 | 38.4% | |
| Fan | 63.7 | 17.1% | 65.1 | 13.5% | |
| VAV System | Total | 325.4 | 29.9% | 325.9 | 36.5% |
| Heating | 103.1 | 18.5% | 60.9 | 20.2% | |
| Cooling | 157.0 | 26.1% | 199.5 | 31.6% | |
| Fan | 52.7 | 70.5% | 20.9 | 72.2% | |
| High Efficiency Cooling System | Total | 319.3 | 31.2% | 300.7 | 41.4% |
| Heating | 72.2 | 27.8% | 59.9 | 21.4% | |
| Cooling | 137.0 | 41.8% | 123.5 | 56.9% | |
| Fan | 62.8 | 31.4% | 48.2 | 35.9% | |
| VAV + ERV (Energy Recovery Ventilation) | Total | 289.6 | 39.3% | 249.9 | 51.3% |
| Heating | 74.7 | 40.9% | 39.0 | 48.8% | |
| Cooling | 118.8 | 40.2% | 122.6 | 58.7% | |
| Fan | 29.6 | 61.5% | 25.3 | 66.4% | |
| VAV + UFAD | Total | 243.2 | 42.9% | 224.6 | 56.2% |
| Heating | 79.5 | 41.8% | 42.5 | 44.3% | |
| Cooling | 89.4 | 44.8% | 105.0 | 63.8% | |
| Fan | 23.6 | 63.8% | 18.4 | 75.5% | |
| Conservation System | Classification | Incheon | Minneapolis | ||
|---|---|---|---|---|---|
| Primary Energy Consumption (kWh/m2) | Energy Saving Rate | Primary Energy Consumption (kWh/m2) | Energy Saving Rate | ||
| Base | Total | 464.1 | - | 505.1 | - |
| Heating | 126.5 | 208.0 | |||
| Cooling | 198.7 | 139.3 | |||
| Fan | 76.8 | 81.8 | |||
| High-R Insulation Wall (0.15 W/m2·K) | Total | 418.4 | 5.2% | 458.4 | 9.3% |
| Heating | 115.9 | 8.4% | 175.1 | 15.8% | |
| Cooling | 196.3 | 1.2% | 135.9 | 2.4% | |
| Fan | 71.8 | 6.6% | 74.5 | 8.9% | |
| High Efficiency U-value Window | Total | 373.5 | 7.4% | 430.9 | 14.7% |
| Heating | 111.6 | 11.8% | 167.2 | 19.6% | |
| Cooling | 191.1 | 3.8% | 131.8 | 5.3% | |
| Fan | 69.6 | 9.3% | 61.8 | 13.4% | |
| High Efficiency Heating System | Total | 325.4 | 25.6% | 338.9 | 36.9% |
| Heating | 79.5 | 32.6% | 119.2 | 42.7% | |
| Cooling | 157.0 | 17.0% | 100.6 | 27.8% | |
| Fan | 52.7 | 21.0% | 54.3 | 33.6% | |
| CAV + GSHP | Total | 319.3 | 31.2% | 306.6 | 39.3% |
| Heating | 72.2 | 42.9% | 98.8 | 52.5% | |
| Cooling | 137.0 | 31.1% | 86.3 | 38.0% | |
| Fan | 62.8 | 18.2% | 62.4 | 23.7% | |
| VAV + Economizer | Total | 291.9 | 37.1% | 288.4 | 42.9% |
| Heating | 95.1 | 24.8% | 144.7 | 30.4% | |
| Cooling | 122.3 | 38.4% | 75.2 | 45.9% | |
| Fan | 24.1 | 61.7% | 24.6 | 69.9% | |
| VAV + ERV (Energy Recovery Ventilation) | Total | 289.6 | 39.3% | 275.9 | 45.4% |
| Heating | 74.7 | 40.9% | 105.6 | 49.1% | |
| Cooling | 118.8 | 40.2% | 88.9 | 36.1% | |
| Fan | 29.6 | 53.5% | 32.1 | 60.8% | |
| Active Chilled Beam System with DOAS | Total | 189.4 | 59.2% | 223.6 | 55.7% |
| Heating | 43.0 | 64.9% | 113.5 | 45.4% | |
| Cooling | 33,1 | 54.2% | 44.9 | 67.8% | |
| Fan | 21.3 | 72.2% | 25.4 | 68.9% | |
Publisher’s Note: MDPI stays neutral with regard to jurisdictional claims in published maps and institutional affiliations. |
© 2021 by the authors. Licensee MDPI, Basel, Switzerland. This article is an open access article distributed under the terms and conditions of the Creative Commons Attribution (CC BY) license (https://creativecommons.org/licenses/by/4.0/).
Share and Cite
Kim, C.-H.; Park, M.-K.; Kang, W.-H. Energy Saving Quantitative Analysis of Passive, Active, and Renewable Technologies in Different Climate Zones. Appl. Sci. 2021, 11, 7115. https://doi.org/10.3390/app11157115
Kim C-H, Park M-K, Kang W-H. Energy Saving Quantitative Analysis of Passive, Active, and Renewable Technologies in Different Climate Zones. Applied Sciences. 2021; 11(15):7115. https://doi.org/10.3390/app11157115
Chicago/Turabian StyleKim, Chul-Ho, Min-Kyeong Park, and Won-Hee Kang. 2021. "Energy Saving Quantitative Analysis of Passive, Active, and Renewable Technologies in Different Climate Zones" Applied Sciences 11, no. 15: 7115. https://doi.org/10.3390/app11157115
APA StyleKim, C.-H., Park, M.-K., & Kang, W.-H. (2021). Energy Saving Quantitative Analysis of Passive, Active, and Renewable Technologies in Different Climate Zones. Applied Sciences, 11(15), 7115. https://doi.org/10.3390/app11157115