Article

Gait Kinematics Analysis of Flatfoot Adults

by
Joel Marouvo
1,2,*,
Filipa Sousa
2,3,
Orlando Fernandes
4,5,
Maria António Castro
6,7 and
Szczepan Paszkiel
8
1
RoboCorp Laboratory, i2A, Polytechnic Institute of Coimbra, 3045-093 Coimbra, Portugal
2
Faculty of Sport (FADEUP), CIFI2D, University of Porto, 4200-450 Porto, Portugal
3
Porto Biomechanics Laboratory (LABIOMEP-UP), University of Porto, 4200-450 Porto, Portugal
4
Departamento de Desporto e Saúde, Escola de Saúde e Desenvolvimento Humano, Universidade de Évora, 7000-727 Évora, Portugal
5
Comprehensive Health Research Center (CHRC), Universidade de Évora, 7000-849 Évora, Portugal
6
Sector of Physiotherapy, School of Health Sciences, Polytechnic Institute of Leiria, 2411-901 Leiria, Portugal
7
Centre for Mechanical Engineering, Materials and Processes (CEMMPRE), University of Coimbra, 3030-788 Coimbra, Portugal
8
Faculty of Electrical Engineering, Automatic Control and Informatics, Opole University of Technology, Prószkowska 76 Street, 45-758 Opole, Poland
*
Author to whom correspondence should be addressed.
Appl. Sci. 2021, 11(15), 7077; https://doi.org/10.3390/app11157077
Submission received: 14 July 2021 / Revised: 24 July 2021 / Accepted: 28 July 2021 / Published: 30 July 2021
(This article belongs to the Section Applied Biosciences and Bioengineering)

Abstract

:
Background: Foot postural alignment has been associated with altered gait pattern. This study aims to investigate gait kinematic differences in flatfoot subjects’ regarding all lower limb segments compared to neutral foot subjects. Methods: A total of 31 participants were recruited (age: 23.26 yo ± 4.43; height: 1.70 m ± 0.98; weight: 75.14 kg ± 14.94). A total of 15 subjects were integrated into the flatfoot group, and the remaining 16 were placed in the neutral foot group. All of the particpants were screened using the Navicular Drop Test and Resting Calcaneal Stance Position test to characterize each group, and results were submitted to gait analysis using a MOCAP system. Results: Significant kinematic differences between groups were found for the ankle joint dorsiflexion, abduction, and internal and external rotation (p < 0.05). Additionally, significant differences were found for the knee flexion, extension, abduction, and external rotation peak values (p < 0.001). Significant differences were also found for the hip flexion, extension, external rotation, pelvis rotation values (p < 0.02). Several amplitude differences were found concerning ankle abduction/adduction, knee flexion/extension and abduction/adduction, hip flexion/extension and rotation, and pelvis rotation (p < 0.01). Conclusion: Flatfooted subjects showed kinematic changes in their gait patterns. The impact on this condition on locomotion biomechanical aspects is clinically essential, and 3D gait biomechanical analysis use could be advantageous in the early detection of health impairments related to foot posture.

1. Introduction

Foot posture is usually classified into three categories: neutral (NF), cavus, and flatfoot (FF) with normal, high, and low medial longitudinal arch height, respectively. A FF is often characterized by calcaneus plantarflexion and eversion relative to the tibia, talus plantarflexion, navicular dorsiflexion, and forefoot supination [1,2,3,4]. FF subjects present greater foot and ankle mobility with subjacent higher risks of developing adjacent mechanical overloading injuries [5,6]. Additionally, regarding static analysis, this condition presented an anterior pelvic tilt, internal hip and tibia rotation, knee valgus, and extended lower back [3,7,8,9,10]. Through altered lower limb motion patterns, foot posture can induce injuries [5,6] and has been associated with abnormal foot motion during gait [7,8,11,12,13,14]. Regarding FF subjects, the medial longitudinal arch varies and can modify plantar pressure along the foot, affecting shock absorption, muscular activity, and gait pattern [15,16]. Moreover, foot sole afferent input affects postural awareness and FF triggered by neurological or muscular restrictions, ligament or joint laxity, excessive motion, and muscle activity [13]. For every daily living activity, both static and dynamic postural control are required [17]. However, foot posture can induce altered plantar pressure patterns and, therefore alter the motion of adjacent joints. The neuromuscular function as well as the biomechanics of the lower limbs can be affected by an altered afferent sensory input. The Central Nervous system uses the muscle coactivation system through the neuromotor response, a motor control mechanism used to modulate joint stiffness, postural stability, and gait pattern [16]. Muscle joint coactivation varies during the gait cycle, reaching higher heel-strike and unilateral weight-bearing values during the balance transition phase and lower values in mid-stance [18].
Buldt et al. (2015) stated that during gait pattern, FF subjects exhibit more motion compared to NF subjects, and cavus foot subjects exhibit less motion when compared to FF subjects. Those alterations can reveal abnormal biomechanical parameters that, as previously stated, influence injury appearance throughout the entire lower limb. These injuries can be due to lesser energy dissipation due to the reduced movement of FF, inducing impact attenuation impairment [5]. In a systematic review, Buldt et al. (2013) found that FF subjects showed alterations in plantar pressure characteristics, specifically higher pressure, force, and contact area values relative to the medial arch, central forefoot, and the hallux, while the same parameters were minor in the lateral and medial forefoot [6]. Additionally, the authors investigated the kinematic variables of the foot complex. They stated that FF subjects presented significantly higher rearfoot inversion and adduction motion during the last 20% of the stance phase. They also found a positive correlation regarding condition subjects and the rearfoot peak eversion in the first half of the stance phase [6].
Based on gait analysis, other authors identified differences among FF subjects compared to neutral ones. They seemingly investigated ground reaction forces through the aid of a force platform and analyzed the collected variables like Center of Pressure excursion and velocity maximum values using linear methods. For instance, Buldt et al. (2018, 2018a) found significant differences in FF subjects, i.e., smaller lateral medial range during the terminal gait stance, faster Center of Pressure excursion velocity in terminal stance, and specific plantar pressure characteristics [14,19]. Some authors investigated FF characteristics in pediatrics or neurological impairments. For instance, Twomey et al. (2012) and Kerr et al. (2019) examined the kinematic differences among asymptomatic pediatric FF subjects. The authors found several differences among FF subjects when considering lower limb biomechanics [20,21]. Addiontally, Galli et al. (2014) showed several gait pattern characteristics differences between FF and NF among Down Syndrome children [22]. Other authors have analyzed the kinematic differences in adult subjects. However, they have only focussed their investigation on the foot, ankle joint, or the tibia bone [5,6,23,24,25]. However, no study has analyzed the kinematic gait pattern differences in FF subjects regarding the lower limbs compared to NF subjects. Therefore, concerning the lack of evidence, the purpose of this study was to analyze the kinematic gait pattern differences in FF subjects compared to NF subjects considering all segments of the lower limb.

2. Materials and Methods

2.1. Participants

This descriptive observational study was conducted at RoboCorp Laboratory at the Polytechnic Institute of Coimbra after the approval of the Ethics Committee of Polytechnic Institute of Coimbra based on the revised version of the 2013 Declaration of Helsinki [26,27], where it was recorded with the number 13_CEPC2/2019. Additionally, the recommendations for the communication of observational studies recommendations were followed (Strengthening the Reporting of Observational Studies in Epidemiology—STROBE) [27]. The sample size was calculated using G*power 3.1.9 software (G* power 3.1.9, Kiel, Germany) based on the study previously published by Resende et al. (2015). The sample size was determined as the number of participants necessary to reach a statistical power of 80%, an estimated alpha level of 0.05, considering a moderate effect size (d = 0.6) [28]. Therefore, a sample size of 28 subjects was required, and consequently, forty-three volunteers were recruited for this study. Before any assessment, all subjects were informed about the purpose of the study and the related procedures benefits, and all of involved risks were explained to each subject. Participants were guaranteed that they could withdraw at any time without justification, and all of the particpants were asked to read and provide informed consent, agreeing to participate in the study. A total of thirty-one subjects aged between 18 and 35 years old met the eligibility criteria (Table 1). The inclusion criteria for the study was limited to subjects who presented bilateral FF or NF who were aged between 18 to 40 years old. The FF group were included subjects who presented a >9 mm Navicular Drop Test score and >4° Resting Calcaneal Stance Position scores. The NF group were incorporated subjects with a 5–9 mm Navicular Drop Test and <4° Resting Calcaneal Stance Position scores. To identify whether they had a FF or a NF condition, all participants were submitted to the Navicular Drop Test and the Resting Calcaneal Stance Position test, as those are clinically used by practitioners worldwide. All of the procedures were realized by a single practitioner with more than 6 years of experience in the use of these techniques. Following this, participants who presented the following criteria were not excluded from this study: (a) any disturbance that might affect gait pattern like orthopedic, neurological or visual impairment among impairments, including current injury, pain, active ulceration, or previous amputation; (b) participation in a physiotherapy treatment program; (c) bone fracture; (d) injury or surgery to the spine, hip, knee, or ankle; (e) aged less than 18 and more than 40 years old; and(f) medication intake that can affect gait and muscle activity. Therefore, 15 bilateral FF participants were assigned to the FF group, comprising a total of 30 feet, and 16 bilateral NF subjects were assigned to the NF group, comprising a total of 32 feet.

2.2. Assessment

Foot posture was diagnosed based on clinical procedures including the Navicular Drop Test and the Resting Calcaneal Stance Position test, as those are clinically used by practitioners worldwide [29,30,31]. They were performed by a single physiotherapist with more than 6 years of experience in the use of these techniques. The same procedure was used for both groups. Before data collection, subjects were asked to maintain a weight-bearing barefoot stance position to perform both tests. First, the navicular drop was evaluated using the Navicular Drop Test, where the mean of three measurement values define the drop severity. A rigid plastic-made ruler was placed by the practitioner perpendicularly to the ground that registers the distance between the ground and the navicular bone (millimetres). The talus was then inverted into a neutral position by the practitioner, and the procedure was repeated. The assessment of the differences in the positions quantifies the navicular drop severity [29]. Afterward, the angle between the rearfoot and the leg was assessed by the same practitioner using the Resting Calcaneal Stance Position test, where the mean of three measurement values define the angle. This angle was formed by the longitudinal bisecting line of the calcaneus and the longitudinal bisecting line of the distal third of the leg, which was drawn by the investigator in a prone position. A rigid goniometer was used to measure this angle (Enraf-Nonius B.V, Rotterdam, The Netherlands) [31].
Following the aforementioned tests, three-dimensional computerized gait analysis was performed on both the FF and NF groups to assess movement characteristics such as joint angular kinematics and spatiotemporal gait parameters. Data were captured with a 10-camera Qualisys® 3D Motion Capture System (Qualisys AB, Götebor, Sweden) with a predictive error of 25 mm and a maximum residual set at 6 mm. A full-body marker setup based on the IOR model [32] comprising fifty-three reflective kinematic markers was used on specific anatomical positions on the partcipants, namely on the thorax, the head, and the lower limbs. Tracking markers, i.e., four marker clusters, were placed over the thighs and shanks to improve segment tracking accuracy. Therefore, kinematic data were collected in a previously calibrated volume, with a calibration error bellow 0.7 mm and recorded at a 200 Hz sampling frequency. Before gait acquisition, subjects were asked to perform a bilateral stance posture assessment regarding model creation processing. Therefore, all subjects were instructed to walk barefoot at a self-selected and comfortable pace across an 8 -meter walkway, which allowed them to reproduce their daily gait. To standardize the gait initiation, a starting point was established so that participants could perform four gait cycles before reaching the force platforms to stabilize gait velocity. No other restrictions were placed on participants. At least fifteen passages were collected at a comfortable speed to generate sufficient data to obtain a mean value for each parameter being measured. There was a ten second rest period between trials. If any participants failed to produce a daily gait behaviour that could be perceived by the researchers, the trial was discarded and a new trial was performed without warning the subject. Trials in which all of the markers were clear and possible to identify were defined as valid and finally, ten valid passages were selected for further processing.

2.3. Data Processing and Analysis

Initially, the recorded data were pre-processed using the Qualisys Track Manager v2.15 (Qualisys AB, Götebor, Sweden) software. The resulting data were then exported to Visual3D (C-Motion, Germantownm, MD, USA) for further analysis. The marker trajectories were then filtered with a 6-Hz low-pass Butterworth filter, and gait events (heel strike and toe-off) were automatically identified by the software’s routine. A 3D model was created to analyze the relative angles of the ankle, knee, and hip joints. Finally, Visual 3D (C-Motion, Germantownm, MD, USA) software commands were computed and identically replicated for each subject to identify outcomes measures, namely joint angular kinematics (ankle, knee, hip, and pelvis angle), gait spatiotemporal parameters, and vertical center of mass displacement.

2.4. Statistical Analysis

The data were statistically processed with the IBM SPSS Statistics 27.0 software (IBM Corporation, New York, NY, USA). In this observational descriptive study, the appropriate summary statistics were applied to the descriptive analysis of the sample. Before any further statistical procedure, the normality of the distribution was explored. The sample presented a non-normal distribution using the Kolmogorov–Smirnov (p < 0.001, t > 0.041) regarding all variables. Continuous variables were described using the median and variance based on the non-normal distribution of the variables. The Mann–Whitney U test was used to test the hypotheses in two independent samples. The level of significance was set at 5% (p < 0.05) for all hypothesis tests.

3. Results

3.1. Sample and Groups Characteristics

The following data ire presented for both groups, the FF and NF groups. In Table 1, the distribution of age (p = 0.045), height (p = 0.200), the weight (p = 0.772) of all participants alongside Navicular Drop Test and Resting Calcaneal Stance Position scores are presented. As expected, regarding both groups separately, both groups presented the mean score of the Navicular Drop Test and Resting Calcaneal Stance Position scores in concordance with the cut-off value previously established and selected in the method section with significant differences between them (p = 0.000). Those can be described with a value higher than 9 mm and a 4° cut-off value for the FF group and lower than 9 mm and a 4° in the NF group.

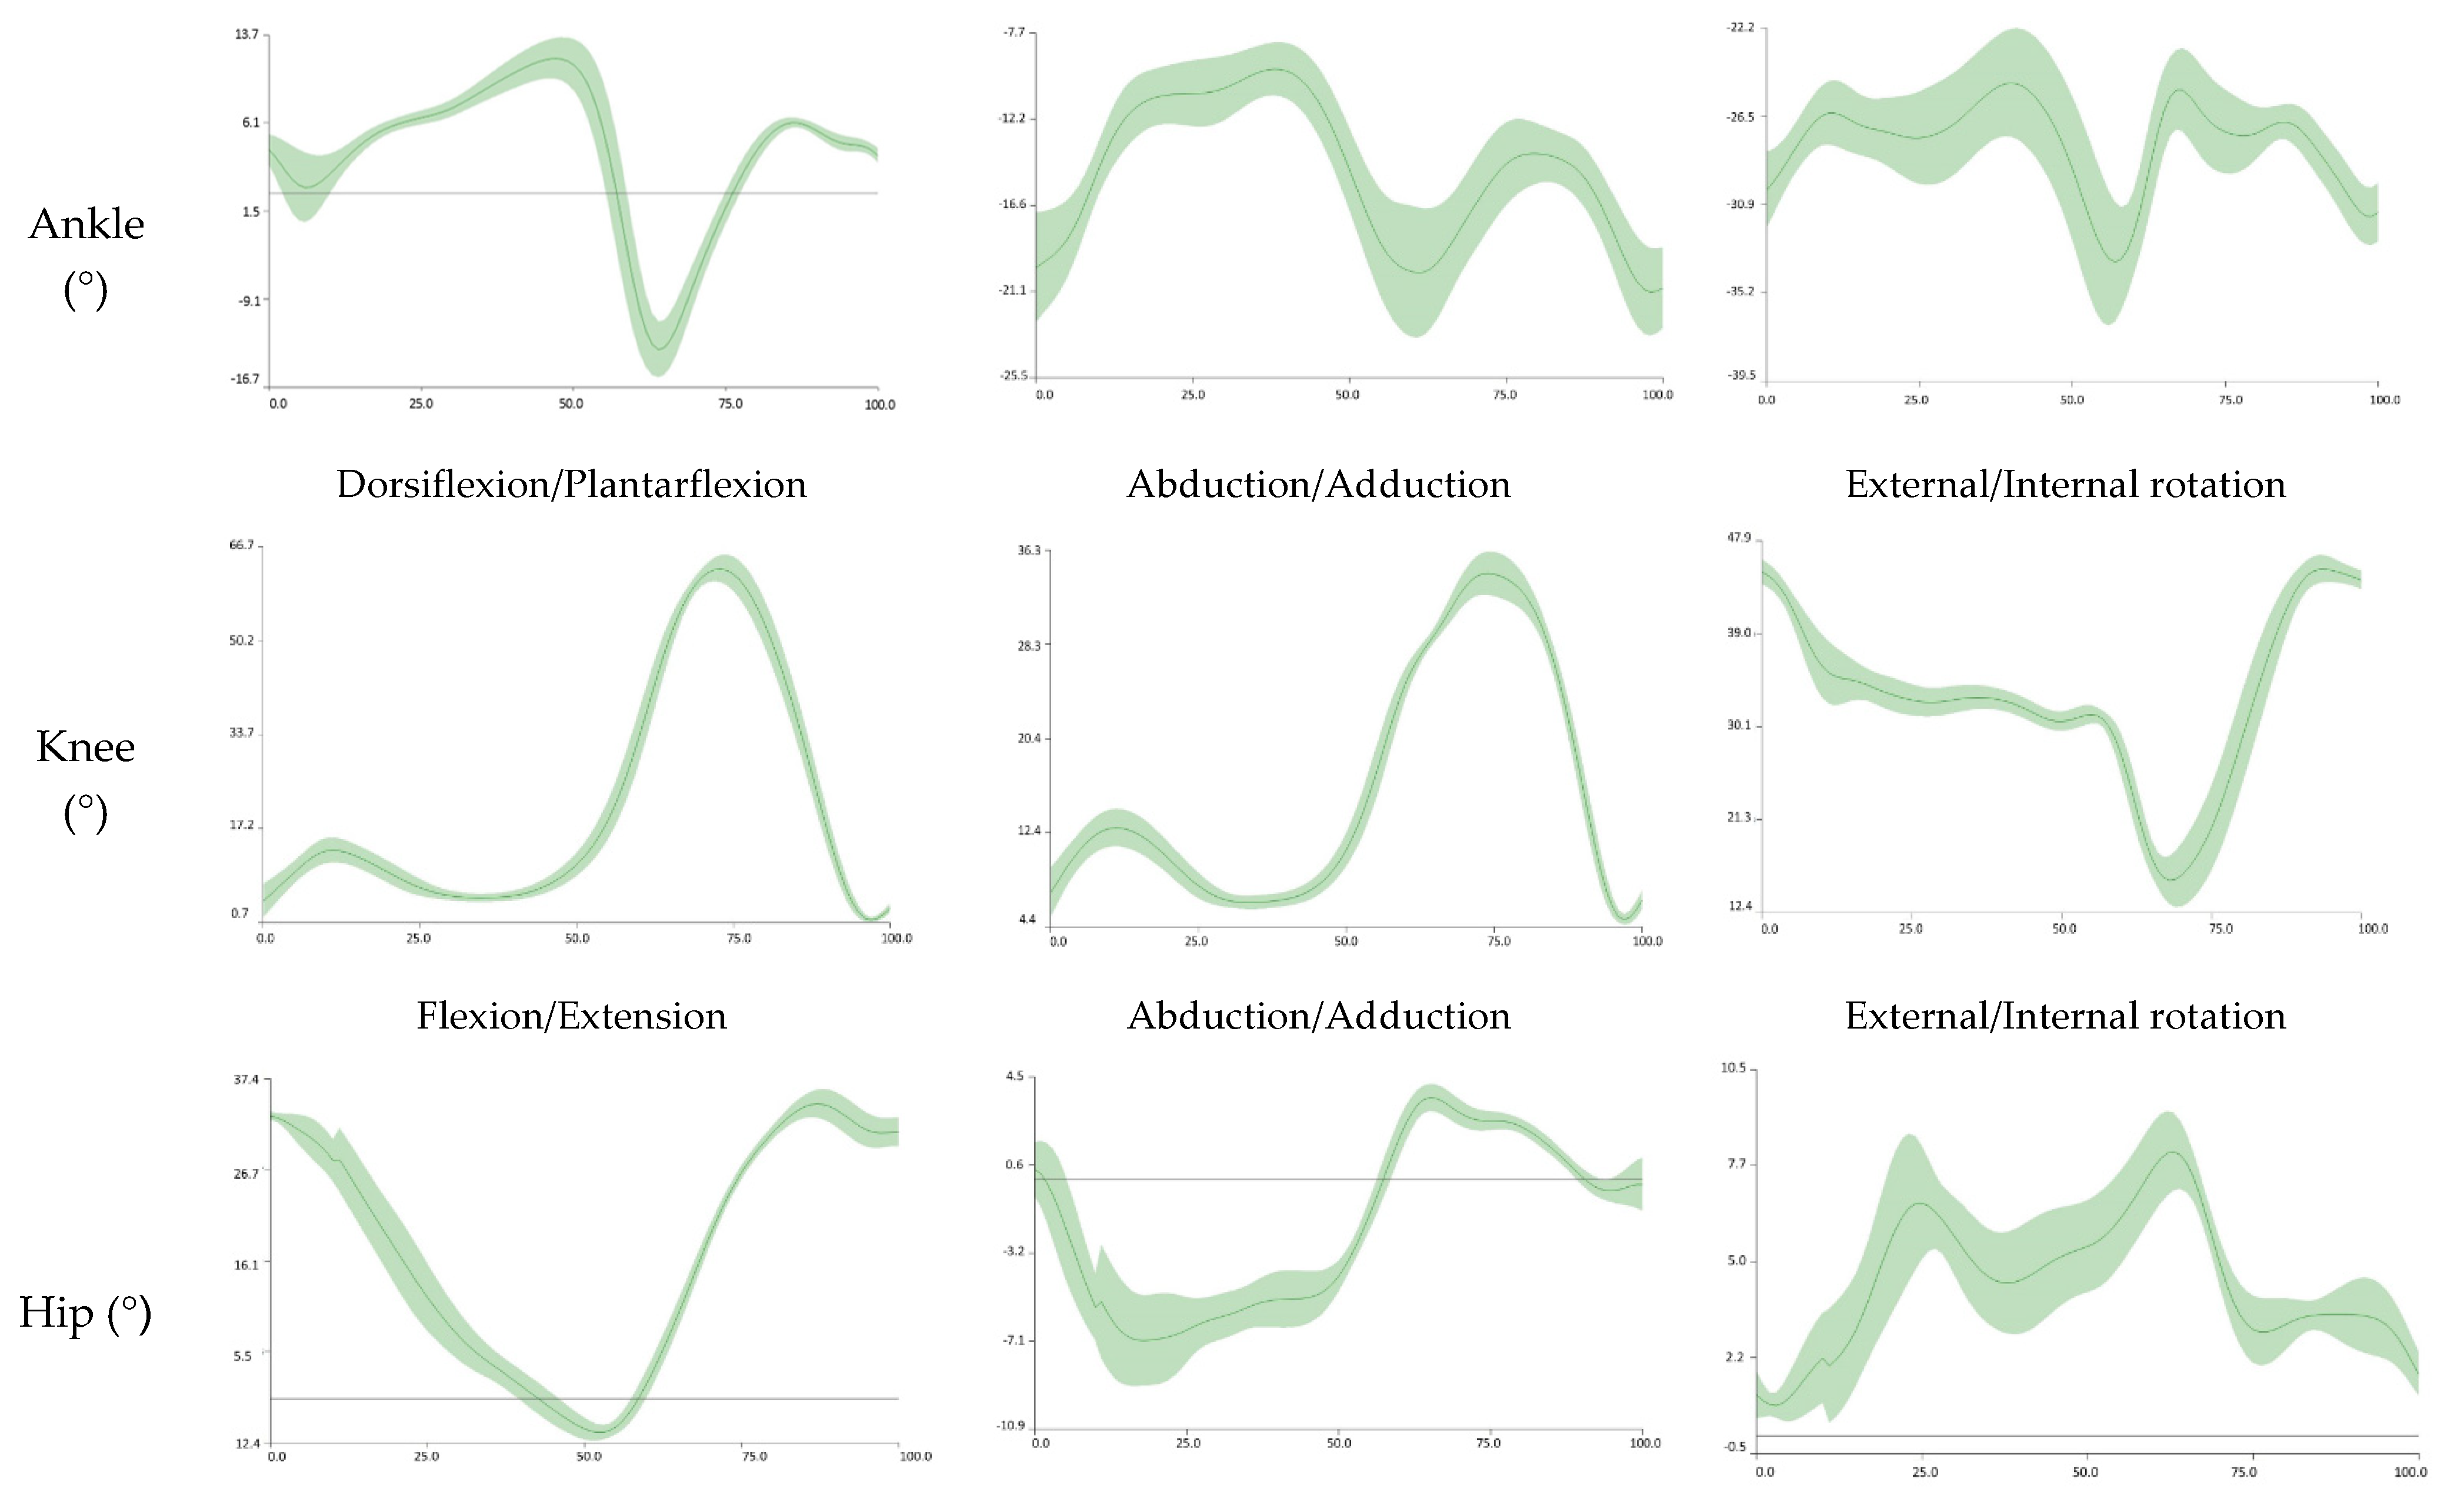
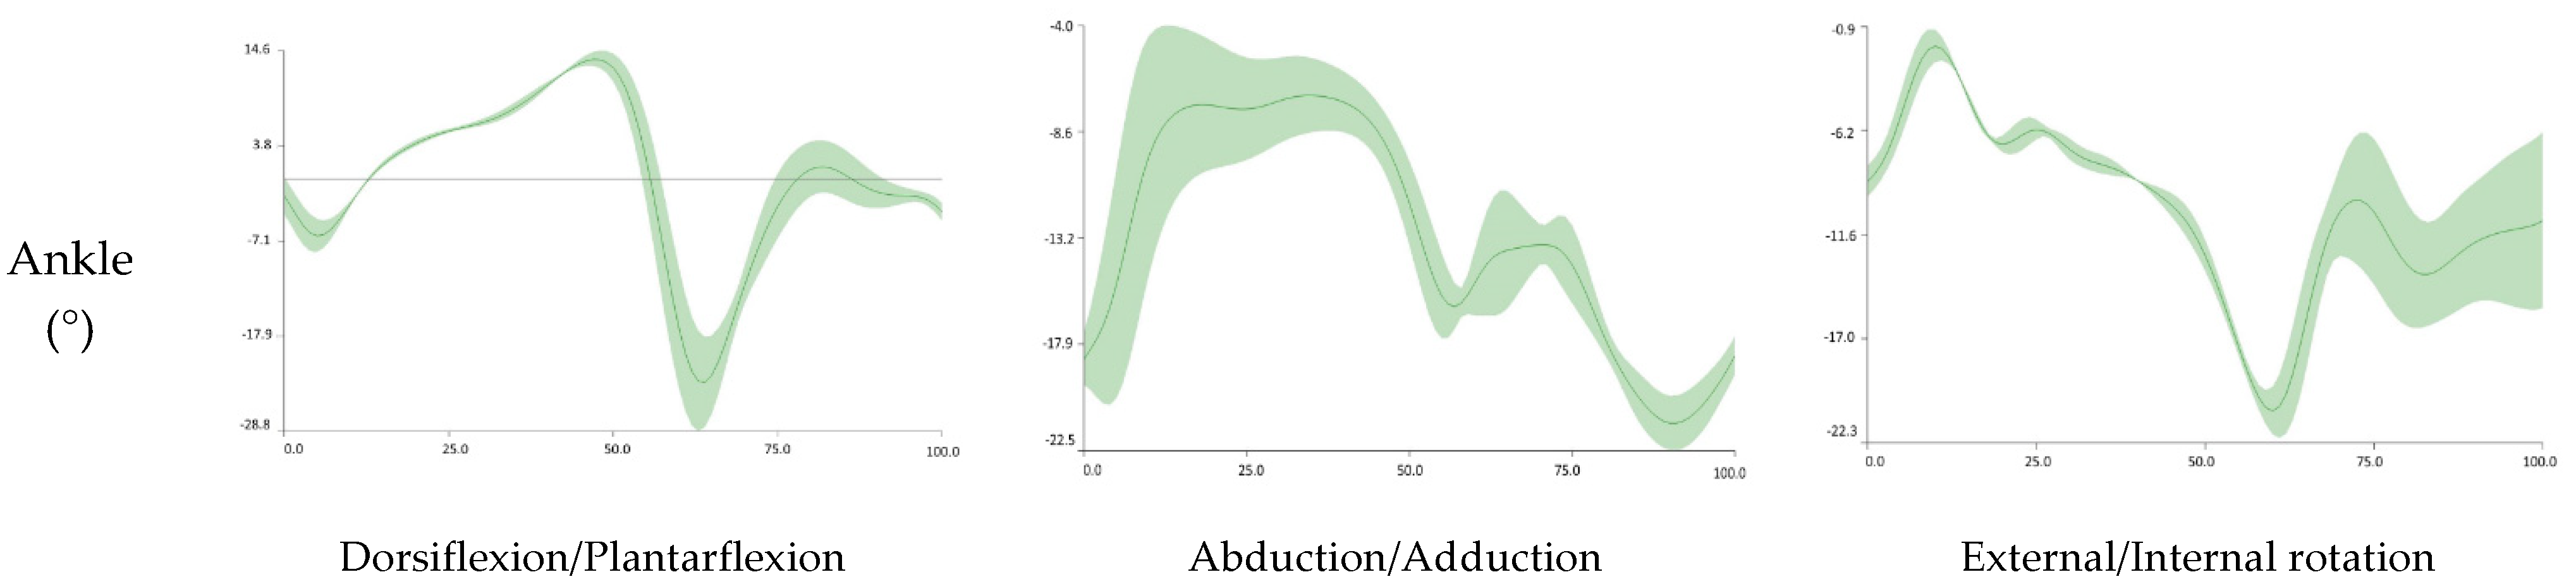
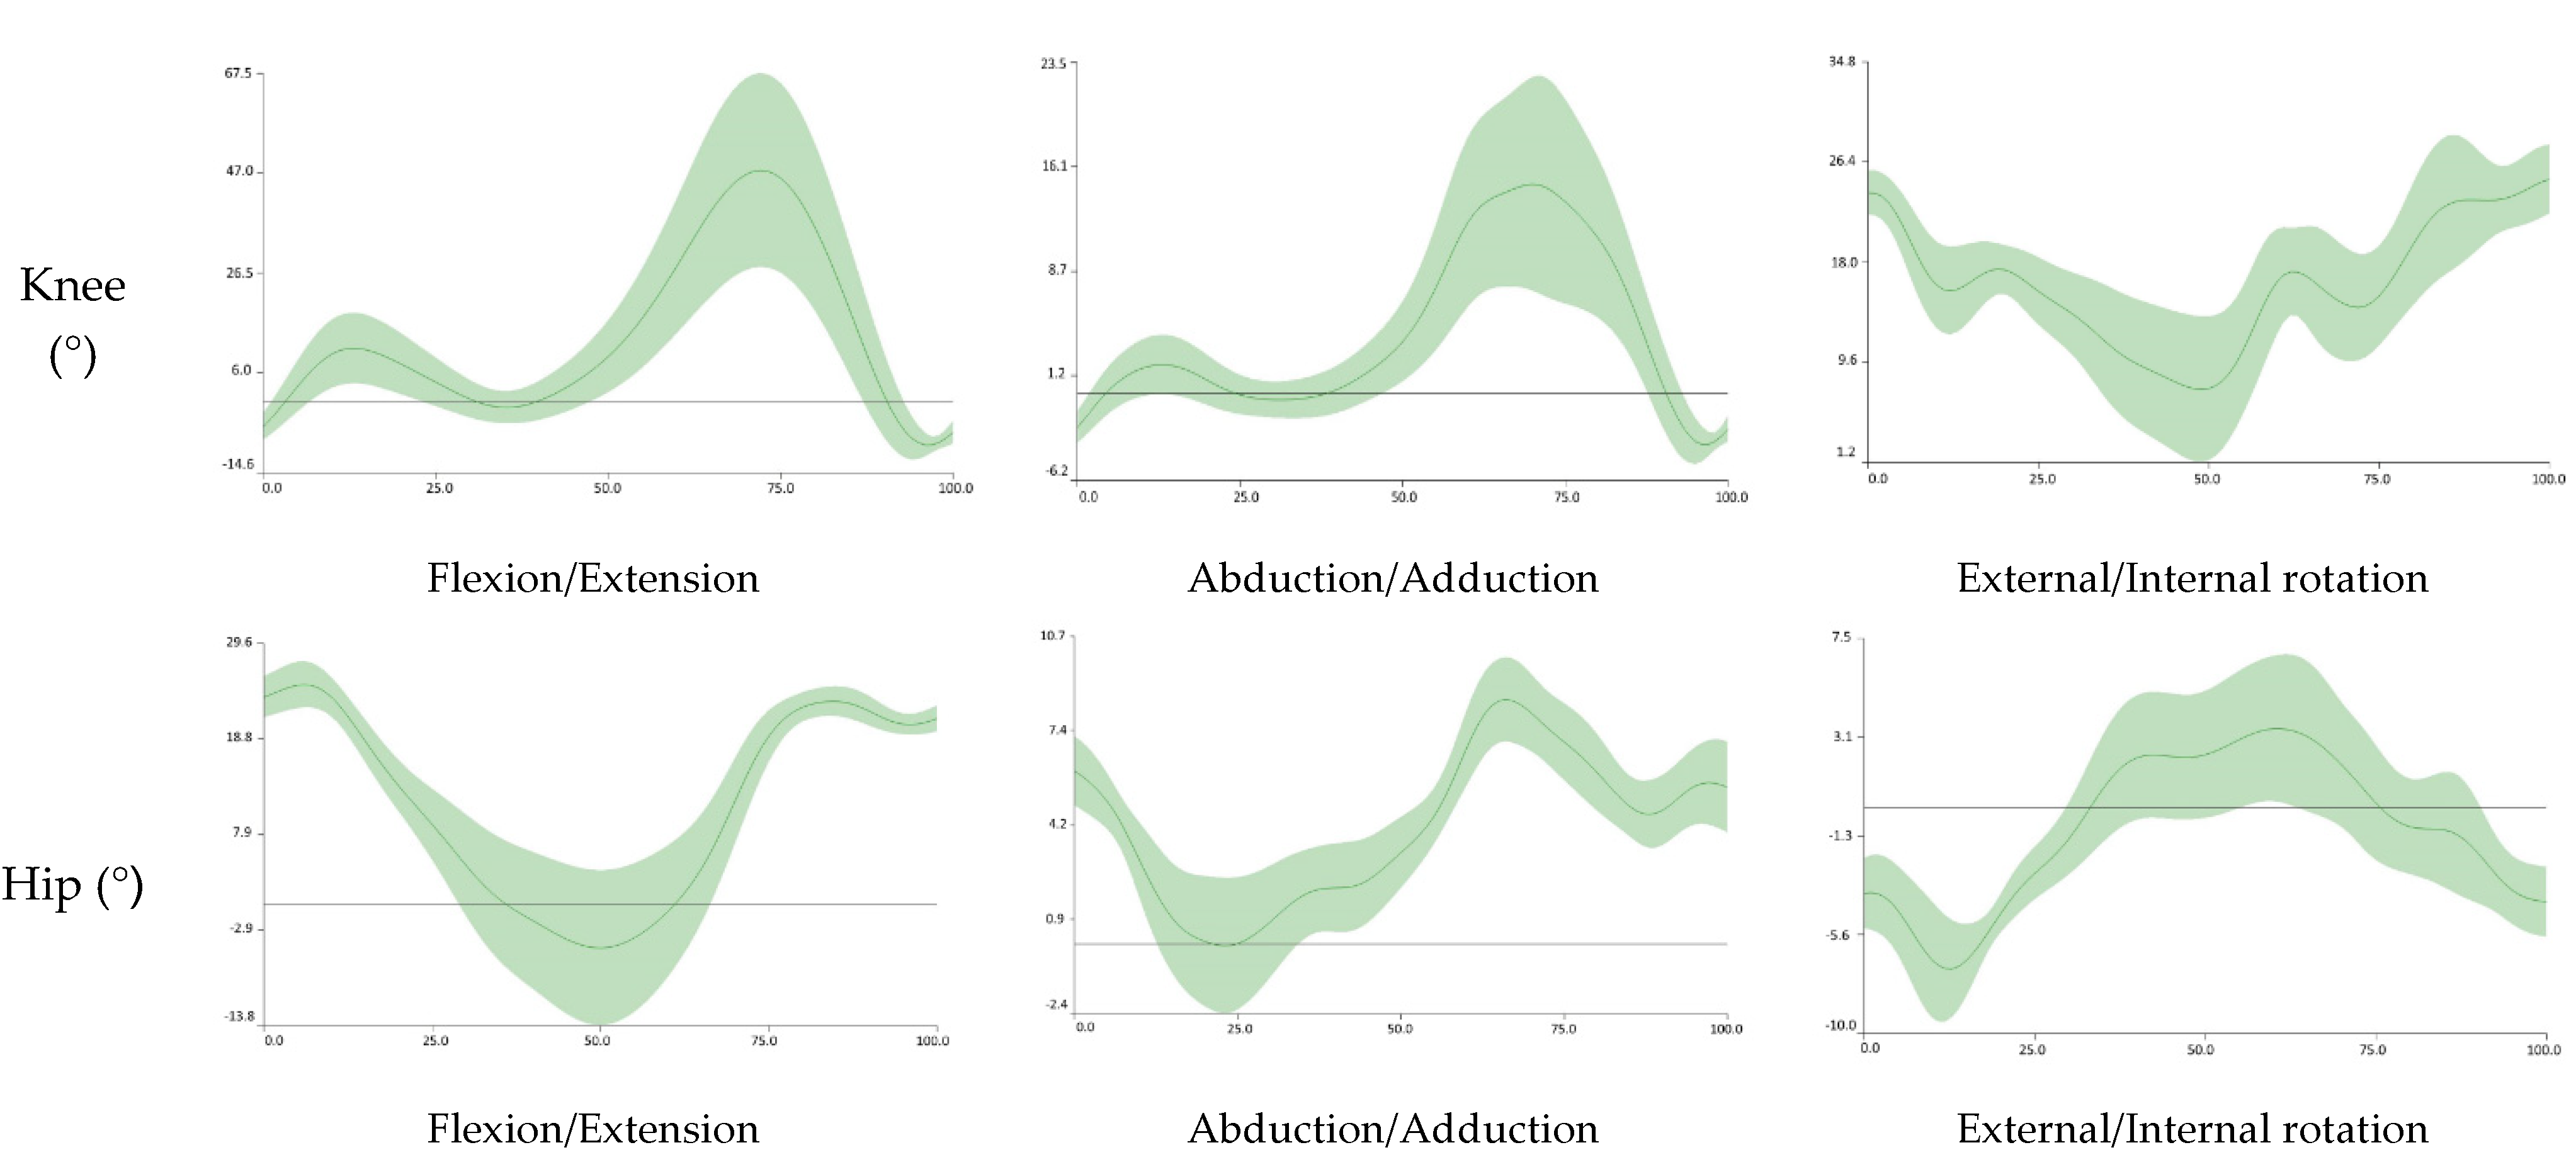
3.2. Kinematics Analysis

For the kinematic parameters, 16 participants were included in the NF group (32 feet) and 15 participants were included in the FF group (30 feet). The ankle, knee, hip, and pelvis angles of each lower limb (right/left) were analyzed and are presented in Table 2. For each segment, the movement is described in the sagittal (x), frontal (y), and transverse (z) planes. Significant differences between the groups are observed in the ankle, knee, hip, and pelvis during the gait. The FF group is characterized by less ankle peak dorsiflexion (p = 0.029), abduction (p = 0.033), and internal and external rotation (p < 0.001). The FF group tends to exhibit less knee and hip peak extension (p < 0.001), external (p < 0.001, p = 0.012) rotation, and knee abduction (p < 0.001). A higher peak value in the FF group was found for knee (p < 0.001) and hip flexion (p = 0.002), hip internal rotation, and pelvis right rotation (p = 0.017). Additionally, the FF group is also characterized by a smaller range of motion (ROM) concerning ankle abduction/adduction (p = 0.003), knee abduction/adduction (p < 0.001), and hip rotation (p = 0.007). Additionally, the FF group exhibits a higher ROM value concerning knee (p = 0.000) and hip flexion/extension (p = 0.002) and pelvis rotation (p = 0.009). Concerning the center of mass displacement, significant differences the among groups are found for the maximum value as well as for the amplitude (p < 0.001).
Figure 1 and Figure 2 illustrate the mean curve of the joint angles of the ankle, knee, and hip during gait (NF and FF subjects, respectively respectively).
The Center of Mass variation over gait is illustrated in Figure 3 and Figure 4 (NF and FF subjects respectively).

4. Discussion

FF is a condition that can be triggered by several reasons, namely, neurological or muscular restrictions, ligament laxity, joint laxity, excessive motion, and muscle activity [13,33,34,35]. It is present in children, targets 10–25% of adults, and can be disastrous for patients as the foot problems prevalence has been reported to be from 46% to 80% in both clinical and institutional situations. This leads to several injuries, often accompanied by pain affecting gait pattern and speed, balance, and decreasing function, consequently increasing fall risk [1,2,3,33,36,37,38] The purpose of the present study was to characterize the gait kinematics during the entire gait cycle of subjects with FF conditions. Comparative observations of lower extremity kinematics during a walking task were performed between individuals with FF compared to those with NF. Gait was characterized in all three dimensions by employing a Motion Capture system.
In this study, the group comparison showed statistically significant differences between most of the studied kinematic variables, more specifically for the ankle, knee, and hip joints. However, the Motion Capture analysis of gait kinematics and the complete lower limb analysis for FF subjects are not easily found in the literature. The current study provided a full assessment of the pelvis and the lower limbs to better characterize the movement in all three planes during gait. ROM differences have been found in the kinematics of both groups concerning the pelvis and all lower-limbs joints.
In this study, FF participants presented lower ankle dorsiflexion (p = 0.029), abduction (p = 0.033), external and internal rotation (p < 0.001) during gait. Additionally, only the ankle abduction/adduction ROM presented a statistically significant increase in the NF group (p = 0.003). Those results follow those found by Twomey et al. (2012), who stated no significant differences (p > 0.05) between members of the the same group in the ankle kinematics during gait [20]. However, we need to highlight the fact that those results were found in children. In another study in children realized by Twomey et al. (2010), they found significant differences relative to the forefoot supination angle (p < 0.003). On the other hand, Levinger et al. (2010) investigated kinematic changes of the foot and the ankle along with the gait task in FF subjects compared to neutral ones in adults. They found a greater forefoot abduction (p = 0.002) and internal rotation (p = 0.018) in FF subjects. The authors found a significantly greater peak forefoot plantarflexion (p = 0.004) and adduction (p = 0.004). However, we found no adduction differences between the groups during the gait cycle (p = 0.398). This can be due to ankle stabilization during gait, namely during the propulsion phase in the late stance phase of the gait cycle. As noted by Levinger et al. (2010), the electromyography activity of the tibialis posterior is greater in FF subjects, which may explain the joint stabilization, not inducing a change both in foot pronation and ankle adduction [10]. Additionally, Buldt et al. (2015) investigated the kinematics of ankle and foot differences between FF and NF groups during gait. Their findings support a significantly smaller inversion/eversion ROM (p < 0.05) in the FF group as well as a significantly smaller peak plantarflexion value (p < 0.05). The authors performed a in systematic review concerning foot and ankle kinematics analysis during gait by comparing FF and NF subjects. Few papers were included in their review, and the authors stated that there was some evidence for increased motion in the FF subjects, but this was limited by small effect sizes. They also stated some evidence of increasing FF posture was positively correlated with an increased frontal plane motion of the rearfoot and therefore translated into the navicular bone drop present in FF subjects. As previously noted, we did not find greater ankle adduction or abduction in the FF subjects. Our results do not always match the several studies that have analyzed the static posture of FF subjects that found those correlations between joints kinematics [20,33,34,39,40,41]. They stated that during the medial longitudinal arch drop, the foot is forced to maintain exaggerated pronation, and through the coupling kinematics between the foot, tibia, and femur, subjects presented an increased internal rotation of the hip.
FF subjects only showed a greater knee peak flexion peak (p < 0.001) during gait. Even so, those subjects showed a lesser knee peak extension (p < 0.001), abduction (p < 0.001), and external rotation (p < 0.001) with significant differences compared to NF participants. However, knee flexion/extension ROM (p = 0.000) is higher in FF subjects, while the NF group presents a higher abduction/adduction ROM (p < 0.001). In children aged 11–12 years of age, Twomey et al. (2012) found a significant difference between the two groups regarding the adduction/abduction peak value (p = 0.01), with a greater value for the FF group concerning the condition of the valgus. Additionally, the authors did not find any significant results in the sagittal or transverse plane of the knee.
Additionally, FF subjects presented a higher hip peak flexion (p = 0.002) alongside a higher internal rotation peak value (p < 0.001). However, the NF participants presented higher peak values of hip extension (p = 0.006) and hip external rotation (p = 0.012) with significance. Thus, the FF subjects showed a significantly less ROM concerning hip flexion/extension (p = 0.002) and internal/external rotation (p = 0.007). Our results are in contrast to those stated by Twomey et al. (2012), who related greater hip external rotation peak (p < 0.05) to the FF group. A gait pattern is considered a cyclic movement, where the coordination of several joint movements concerning the same plane is necessary to optimize gait efficiency [42]. The increase in knee and hip flexion along gait for the FF subjects can result from a greater need to absorb impact that, in FF, are not absorbed at the foot level. This occurs because the FF subjects showed lesser ankle dorsiflexion and knee extension peak, corresponding to a lack of mobility.
Finally, regarding the pelvic kinematics, the only significant difference concerning peak values was found relative to the pelvic rotation with an increased value in the FF over the NF group (p = 0.017). Finally, the FF group showed a significantly higher pelvic rotation ROM (p = 0.009). As stated by Levinger et al. (2010), our findings, regrouped with the comparison of the other studies related to an altered ankle and foot motion associated with foot posture, namely the FF condition, can induce altered motion over gait pattern [10]. The FF subjects exhibited a greater abduction and pronation in both static posture and during gait, which can increase injury risk. However, the FF subjects did not a present greater frontal plane motion ROM, i.e., abduction/adduction ROM. Therefore, without an increased amplitude, we can hypothesize that the FF subjects did not present greater ankle mobility during gait, which is contradictory to The key findings of several authors. In the systematic review concerning the kinematic differences between FF and NF subjects during gait conducted by Buldt et al. (2013), the authors provide some evidence of the relationship between the FF condition and lower limb motion during the gait. However, they only focus their analysis on the foot and ankle kinematics without an entire lower limb analysis. However, they stated that their study was not conclusive, as the included papers presented several limitations [6].
Finally, in our study, we found a statistically significant increase in the vertical maximum center of mass value in the NF compared to the FF (p < 0.001). The FF subjects presented a lower mean value corresponding to the minimum vertical score during the double stance support phase of the gait cycle and the medial longitudinal arch drop. As stated, we did not find any significant increase concerning ankle abduction, but this can also result in less impact absorption by the foot, and therefore, this absorption is conducted by the joints above, such as the knee and hip, and with this, the maximum displacement of the centre of mass is smaller. However, additional study needs to be conducted on FF subjects, as no papers were found in the literature that focused on this content.
This study presented several limitations. The Navicular Drop Test and the Resting Calcaneal Stance Position were used to assess the foot condition. As those are considered to be mobility tests, the entire foot contact area was not considered, which is a parameter that is usually used in the study of FF subjects. It will be interesting to evaluate the same results using the FootPrint parameters as an inclusion criterion. Additionally, only bilateral conditions, both FF and NF, were included. Therefore, unilateral FF or NF were not recruited to exclude the temporary or functional alterations presented in unilateral conditions. Finally, the non-characterization of the participants’ weight was not realized in this study.
Due to the several complications associated with FF, the insight into the impact of this condition on the biomechanical aspects of human locomotion is clinically essential. Therefore, the use of 3D gait biomechanical analysis could be advantageous and crucial in the early detection of health impairments related to foot posture. According to our knowledge, this is the first study that investigates overall lower-limb kinematic characteristics during gait in FF subjects. Additionally, for instance, as FF participants presented lower ankle dorsiflexion, abduction, external and internal rotation, we can hypothesize the fact that those subjects presented a decreased mobility of the ankle joint, a result that is contradictory to others conclusions found in the literature.

5. Conclusions

Considering the overall kinematics of the lower limbs, this study showed that FF subjects did present few alterations compared to NF participants and exhibited a different gait pattern throughout the entire gait cycle. The differences were present in the ankle, knee, hip, and pelvis joints and ROM variations were seen along all different planes.

Author Contributions

Conceptualization, J.M., M.A.C. and F.S.; methodology, J.M., M.A.C., S.P. and O.F.; software, J.M., M.A.C. and O.F.; validation, J.M. and M.A.C.; formal analysis, J.M. and M.A.C.; investigation, J.M. and M.A.C.; resources, M.A.C. and S.P.; data curation, J.M. and M.A.C.; writing—original draft preparation, J.M.; writing—review and editing, M.A.C., F.S., S.P. and O.F.; visualization, J.M.; supervision, M.A.C. and F.S. All authors have read and agreed to the published version of the manuscript.

Funding

This research received no external funding.

Institutional Review Board Statement

The study was conducted according to the guidelines of the Declaration of Helsinki and approved by the Ethics Committee of Polytechnic Institute of Coimbra (13_CEPC2/2019 -19/09/2019).

Informed Consent Statement

Informed consent was obtained from all subjects involved in the study.

Data Availability Statement

The data presented in this study are available on request from the corresponding author.

Acknowledgments

ROBOCORP laboratory—i2a is co-funded by QREN under the Programa Mais Centro of the Coordination Commission of the Central Region and the European Union through the European Regional Development Fund.

Conflicts of Interest

The authors declare no conflict of interest.

References

  1. Kosashvili, Y.; Fridman, T.; Backstein, D.; Safir, O.; Ziv, Y.B. The Correlation between Pes Planus and Anterior Knee or Intermittent Low Back Pain. Foot Ankle Int. 2008, 29, 910–913. [Google Scholar] [CrossRef]
  2. Angin, S.; Crofts, G.; Mickle, K.J.; Nester, C.J. Ultrasound evaluation of foot muscles and plantar fascia in pes planus. Gait Posture 2014, 40, 48–52. [Google Scholar] [CrossRef] [PubMed] [Green Version]
  3. Caravaggi, P.; Sforza, C.; Leardini, A.; Portinaro, N.; Panou, A. Effect of plano-valgus foot posture on midfoot kinematics during barefoot walking in an adolescent population. J. Foot Ankle Res. 2018, 11, 55. [Google Scholar] [CrossRef] [PubMed]
  4. López-López, D.; Becerro-De-Bengoa-Vallejo, R.; Losa-Iglesias, M.E.; Palomo-López, P.; Rodríguez-Sanz, D.; Brandariz-Pereira, J.M.; Calvo-Lobo, C. Evaluation of foot health related quality of life in individuals with foot problems by gender: A cross-sectional comparative analysis study. BMJ Open 2018, 8, e023980. [Google Scholar] [CrossRef] [PubMed] [Green Version]
  5. Buldt, A.K.; Levinger, P.; Murley, G.S.; Menz, H.; Nester, C.J.; Landorf, K.B. Foot posture is associated with kinematics of the foot during gait: A comparison of normal, planus and cavus feet. Gait Posture 2015, 42, 42–48. [Google Scholar] [CrossRef]
  6. Buldt, A.K.; Murley, G.S.; Butterworth, P.; Levinger, P.; Menz, H.; Landorf, K.B. The relationship between foot posture and lower limb kinematics during walking: A systematic review. Gait Posture 2013, 38, 363–372. [Google Scholar] [CrossRef]
  7. Douglas Gross, K.; Felson, D.T.; Niu, J.; Hunter, D.J.; Guermazi, A.; Roemer, F.W.; Dufour, A.B.; Gensure, R.H.; Hannan, M.T. Association of flat feet with knee pain and cartilage damage in older adults. Arthritis Care Res. 2011, 63, 937–944. [Google Scholar] [CrossRef] [Green Version]
  8. Levinger, P.; Zeina, D.; Teshome, A.; Skinner, E.; Begg, R.; Abbott, J.H. A real time biofeedback using Kinect and Wii to improve gait for post-total knee replacement rehabilitation: A case study report. Disabil. Rehabil. Assist. Technol. 2016, 11, 251–262. [Google Scholar] [CrossRef]
  9. Powell, D.W.; Long, B.; Milner, C.; Zhang, S. Frontal plane multi-segment foot kinematics in high- and low-arched females during dynamic loading tasks. Hum. Mov. Sci. 2011, 30, 105–114. [Google Scholar] [CrossRef] [PubMed]
  10. Levinger, P.; Murley, G.S.; Barton, C.; Cotchett, M.P.; McSweeney, S.R.; Menz, H. A comparison of foot kinematics in people with normal- and flat-arched feet using the Oxford Foot Model. Gait Posture 2010, 32, 519–523. [Google Scholar] [CrossRef] [PubMed]
  11. Eslami, M.; Damavandi, M.; Ferber, R. Association of Navicular Drop and Selected Lower-Limb Biomechanical Measures during the Stance Phase of Running. J. Appl. Biomech. 2014, 30, 250–254. [Google Scholar] [CrossRef]
  12. Twomey, D.; McIntosh, A.; Simon, J.; Lowe, K.; Wolf, S. Kinematic differences between normal and low arched feet in children using the Heidelberg foot measurement method. Gait Posture 2010, 32, 1–5. [Google Scholar] [CrossRef]
  13. Hunt, A.E.; Smith, R.M. Mechanics and control of the flat versus normal foot during the stance phase of walking. Clin. Biomech. 2004, 19, 391–397. [Google Scholar] [CrossRef] [PubMed]
  14. Buldt, A.K.; Forghany, S.; Landorf, K.B.; Levinger, P.; Murley, G.S.; Menz, H.B. Foot posture is associated with plantar pressure during gait: A comparison of normal, planus and cavus feet. Gait Posture 2018, 62, 235–240. [Google Scholar] [CrossRef]
  15. Zuil-Escobar, J.C.; Martínez-Cepa, C.B.; Martín-Urrialde, J.A.; Gómez-Conesa, A. Evaluating the Medial Longitudinal Arch of the Foot: Correlations, Reliability, and Accuracy in People with a Low Arch. Phys. Ther. 2019, 99, 364–372. [Google Scholar] [CrossRef] [PubMed]
  16. Angin, S.; Mickle, K.J.; Nester, C.J. Contributions of foot muscles and plantar fascia morphology to foot posture. Gait Posture 2018, 61, 238–242. [Google Scholar] [CrossRef] [PubMed]
  17. Nagai, K.; Yamada, M.; Uemura, K.; Yamada, Y.; Ichihashi, N.; Tsuboyama, T. Differences in muscle coactivation during postural control between healthy older and young adults. Arch. Gerontol. Geriatr. 2011, 53, 338–343. [Google Scholar] [CrossRef] [Green Version]
  18. Varrecchia, T.; Rinaldi, M.; Serrao, M.; Draicchio, F.; Conte, C.; Conforto, S.; Schmid, M.; Ranavolo, A. Global lower limb muscle coactivation during walking at different speeds: Relationship between spatio-temporal, kinematic, kinetic, and energetic parameters. J. Electromyogr. Kinesiol. 2018, 43, 148–157. [Google Scholar] [CrossRef]
  19. Buldt, A.K.; Forghany, S.; Landorf, K.B.; Murley, G.S.; Levinger, P.; Menz, H.B. Centre of pressure characteristics in normal, planus and cavus feet. J. Foot Ankle Res. 2018, 11, 3. [Google Scholar] [CrossRef] [Green Version]
  20. Twomey, D.; McIntosh, A. The effects of low arched feet on lower limb gait kinematics in children. Foot 2012, 22, 60–65. [Google Scholar] [CrossRef] [PubMed]
  21. Kerr, C.; Zavatsky, A.; Theologis, T.; Stebbins, J. Kinematic differences between neutral and flat feet with and without symptoms as measured by the Oxford foot model. Gait Posture 2019, 67, 213–218. [Google Scholar] [CrossRef]
  22. Galli, M.; Cimolin, V.; Pau, M.; Costici, P.; Albertini, G. Relationship between flat foot condition and gait pattern alterations in children with Down syndrome. J. Intellect. Disabil. Res. 2014, 58, 269–276. [Google Scholar] [CrossRef] [PubMed]
  23. Shin, H.S.; Lee, J.H.; Kim, E.J.; Kyung, M.G.; Yoo, H.J.; Lee, D.Y. Flatfoot deformity affected the kinematics of the foot and ankle in proportion to the severity of deformity. Gait Posture 2019, 72, 123–128. [Google Scholar] [CrossRef] [PubMed]
  24. Yazdani, F.; Razeghi, M.; Ebrahimi, S. A comparison of the free moment pattern between normal and hyper-pronated aligned feet in female subjects during the stance phase of gait. J. Biomed. Phys. Eng. 2018, 10, 93–102. [Google Scholar] [CrossRef]
  25. Saraswat, P.; MacWilliams, B.; Davis, R.B.; D’Astous, J.L. Kinematics and kinetics of normal and planovalgus feet during walking. Gait Posture 2014, 39, 339–345. [Google Scholar] [CrossRef] [PubMed]
  26. Holt, G.R. Declaration of Helsinki—The World’s Document of Conscience and Responsibility. South Med. J. 2014, 107, 407. [Google Scholar] [CrossRef] [PubMed]
  27. Vandenbroucke, J.P.; von Elm, E.; Altman, D.G.; Gøtzsche, P.C.; Mulrow, C.D.; Pocock, S.J.; Poole, C.; Schlesselman, J.J.; Egger, M.; STROBE Initiative. Strengthening the Reporting of Observational Studies in Epidemiology (STROBE): Explanation and elaboration. Int. J. Surg. 2014, 12, 1500–1524. [Google Scholar] [CrossRef] [Green Version]
  28. Resende, R.A.; Deluzio, K.J.; Kirkwood, R.N.; Hassan, E.A.; Fonseca, S.T. Increased unilateral foot pronation affects lower limbs and pelvic biomechanics during walking. Gait Posture 2015, 41, 395–401. [Google Scholar] [CrossRef]
  29. Sung, P.S. The Sensitivity of Thresholds by Ground Reaction Force and Postural Stability in Subjects with and without Navicular Drop. J. Foot Ankle Surg. 2018, 57, 742–746. [Google Scholar] [CrossRef]
  30. Kim, J.A.; Lim, O.B.; Yi, C.H. Difference in static and dynamic stability between flexible flatfeet and neutral feet. Gait Posture 2015, 41, 546–550. [Google Scholar] [CrossRef]
  31. Tsai, L.-C.; Yu, B.; Mercer, V.S.; Gross, M.T. Comparison of Different Structural Foot Types for Measures of Standing Postural Control. J. Orthop. Sports Phys. Ther. 2006, 36, 942–953. [Google Scholar] [CrossRef] [Green Version]
  32. Wilken, J.M.; Rodriguez, K.M.; Brawner, M.; Darter, B.J. Reliability and minimal detectible change values for gait kinematics and kinetics in healthy adults. Gait Posture 2012, 35, 301–307. [Google Scholar] [CrossRef] [PubMed]
  33. Farokhmanesh, K.; Shirzadian, T.; Mahboubi, M.; Shahri, M.N. Effect of Foot Hyperpronation on Lumbar Lordosis and Thoracic Kyphosis in Standing Position Using 3-Dimensional Ultrasound-Based Motion Analysis System. Glob. J. Health Sci. 2014, 6, 254–260. [Google Scholar] [CrossRef] [Green Version]
  34. Tahmasebi, R.; Karimi, M.T.; Satvati, B.; Fatoye, F. Evaluation of Standing Stability in Individuals with Flatfeet. Foot Ankle Spéc. 2015, 8, 168–174. [Google Scholar] [CrossRef]
  35. López, D.; Pérez-Ríos, M.; Ruano-Ravina, A.; Losa-Iglesias, M.E.; Becerro-de-Bengoa-Vallejo, R.; Romero-Morales, C.; Calvo-Lobo, C.; Navarro-Flores, E. Impact of quality of life related to foot problems: A case–control study. Sci. Rep. 2021, 11, 14515. [Google Scholar] [CrossRef] [PubMed]
  36. Sung, P.S. The ground reaction force thresholds for detecting postural stability in participants with and without flat foot. J. Biomech. 2016, 49, 60–65. [Google Scholar] [CrossRef] [PubMed]
  37. Sung, P.S.; Zipple, J.T.; Andraka, J.M.; Danial, P.; Information, P.E.K.F.C.; Zipple, T.J. The kinetic and kinematic stability measures in healthy adult subjects with and without flat foot. Foot 2017, 30, 21–26. [Google Scholar] [CrossRef]
  38. López-López, D.; Vilar, J.M.; Barros-García, G.; Losa-Iglesias, M.E.; Palomo-López, P.; Becerro-De-Bengoa-Vallejo, R.; Calvo-Lobo, C. Foot Arch Height and Quality of Life in Adults: A Strobe Observational Study. Int. J. Environ. Res. Public Health 2018, 15, 1555. [Google Scholar] [CrossRef] [PubMed] [Green Version]
  39. Ghasemi, M.S.; Koohpayehzadeh, J.; Kadkhodaei, H.; Ehsani, A.A. The effect of foot hyperpronation on spine alignment in standing position. Med. J. Islam. Repub. Iran 2016, 30, 466. [Google Scholar] [PubMed]
  40. Khamis, S.; Dar, G.; Peretz, C.; Yizhar, Z. The Relationship between Foot and Pelvic Alignment While Standing. J. Hum. Kinet. 2015, 46, 85–97. [Google Scholar] [CrossRef] [Green Version]
  41. Lee, H.-C.; Huang, C.-L.; Ho, S.-H.; Sung, W.-H. The Effect of a Virtual Reality Game Intervention on Balance for Patients with Stroke: A Randomized Controlled Trial. Games Health J. 2017, 6, 303–311. [Google Scholar] [CrossRef] [PubMed]
  42. Dietz, V. Spinal cord pattern generators for locomotion. Clin. Neurophysiol. 2003, 114, 1379–1389. [Google Scholar] [CrossRef]
Figure 1. Kinematics of various NF lower limb joints during gait.
Applsci 11 07077 g001
Figure 2. Kinematics of various of FF lower limb joints during gait.
Applsci 11 07077 g002aApplsci 11 07077 g002b
Figure 3. Center of mass variation of NF subjects alongside gait pattern.
Applsci 11 07077 g003
Figure 4. Center of mass variation of FF subjects alongside gait pattern.
Applsci 11 07077 g004
Table 1. Groups characteristics.
TotalNFFFp-Value
n3116
(37.5% Women)
15
(46.6% Women)
k623230
NDT (mm) * 5.06 ± 2.4211.35 ± 1.430.000
RCSP (°) *1.44 ± 1.195.52 ± 2.220.000
Age (years) *23.26 ± 4.4321.69 ± 2.9824.93 ± 5.170.045
Height (m) *1.70 ± 0.981.72 ± 0.091.68 ± 0.100.200
Weight (kg) *75.14 ± 14.9475.92 ± 17.0374.32 ± 12.900.772
n = sample; k = lower limb number; NF = Neutral Foot; FF = Flatfoot; * Mean ± Standard Deviation.
Table 2. Groups kinematics characteristics.
Maximum and Minimum ValueRange of MOTION
FFNFp-ValueFFNFp-Value
Ankle (°)Dorsiflexion12.49 ± 3.5213.58 ± 6.940.02927.87 ± 6.2829.29 ± 8.470.163
Plantarflexion−15.67 ± 6.61−16.09 ± 8.360.541
Abduction0.38 ± 4.091.59 ± 9.950.03316.81 ± 4.0617.79 ± 10.510.003
Adduction−16.61 ± 5.20−16.43 ± 6.430.398
External rotation−3.35 ± 5.48−7.05 ± 8.08<0.00115.85 ± 5.0017.16 ± 7.890.105
Internal−19.36 ± 5.42−19.63 ± 23.56<0.001
Knee (°)Flexion60.60 ± 4.6856.87 ± 12.41<0.00165.64 ± 5.0561.28 ± 8.930.000
Extension−5.04 ± 4.53−5.16 ± 10.71<0.001
Abduction18.04 ± 5.7121.21 ± 9.60<0.00118.84 ± 6.5724.24 ± 11.20<0.001
Adduction−0.81 ± 5.61−1.92 ± 8.340.236
External rotation29.19 ± 7.9433.71 ± 15.30<0.00123.77 ± 8.4026.83 ± 5.690.079
Internal5.42 ± 10.370.15 ± 32.890.342
Hip (°)Flexion30.67 ± 8.8227.36 ± 10.900.00240.88 ± 7.8139.79 ± 7.540.002
Extension−10.21 ± 8.34−12.42 ± 10.360.006
Abduction18.18 ± 14.4817.79 ± 13.600.55214.80 ± 5.7015.91 ± 7.050.156
Adduction−9.27 ± 5.99−9.34 ± 6.310.883
External rotation7.48 ± 7.2111.91 ± 12.710.01215.80 ± 5.3416.64 ± 10.260.007
Internal−7.79 ± 7.08−2.61 ± 13.63<0.001
Pelvis (°)Anterior Tilt−4.13 ± 12.49−4.23 ± 10.900.9057.83 ± 6.808.25 ± 6.720.744
Posterior Tilt3.70 ± 10.934.02 ± 11.910.900
Lateral Tilt5.09 ± 3.634.71 ± 2.830.48910.28 ± 4.449.81 ± 3.220.720
−5.18 ± 3.14−5.10 ± 3.150.909
Rotation10.66 ± 4.708.79 ± 6.330.01720.98 ± 11.5318.01 ± 7.810.009
−10.67 ± 8.20−9.22 ± 5.940.125
Center of Mass (height %)Vertical Maximum55.07 ± 1.2355.67 ± 0.85<0.0012.38 ± 0.412.62 ± 0.39<0.001
Vertical Minimum52.68 ± 1.4053.04 ± 0.910.243
Mean ± Standard Deviation; NF = Neutral Foot; FF = Flatfoot; Negative value = extension/internal rotation/adduction/anterior tilt; positive value = flexion/external rotation/abduction/posterior tilt.
Publisher’s Note: MDPI stays neutral with regard to jurisdictional claims in published maps and institutional affiliations.

