Article

A New Method for Haptic Shape Discriminability Detection

1
Cognitive Neuroscience Laboratory, Graduate School of Interdisciplinary Science and Engineering in Health Systems, Okayama University, 1 Chome-1-1 Tsushimanaka, Kita Ward, Okayama 700-8530, Japan
2
The School of Psychological and Cognitive Sciences, Peking University, Beijing 100871, China
3
Department of Psychology, Suzhou University of Science and Technology, 99 Xuefu Road, Huqiu District, Suzhou 205009, China
4
Research Center for Medical Artificial Intelligence, Shenzhen Institute of Advanced Technology, Chinese Academy of Sciences, Shenzhen 518055, China
*
Authors to whom correspondence should be addressed.
Appl. Sci. 2021, 11(15), 7049; https://doi.org/10.3390/app11157049
Submission received: 26 May 2021 / Revised: 26 July 2021 / Accepted: 28 July 2021 / Published: 30 July 2021
(This article belongs to the Section Applied Neuroscience and Neural Engineering)

Abstract

:
Touch shape discrimination is not only closely related to tactile mechanoreceptors but also higher cognitive function. However, previous shape discrimination methods are difficult to complete in a short time, and the devices are complicated to operate and not user-friendly for nonprofessionals. Here, we propose a new method, the evaluation quantity of which is the angle discrimination threshold. In addition, to make this method easy to use for nonprofessionals, we designed a haptic angle sorting system, including the device and software. To evaluate this method, the angle sorting and two-angle discrimination experiments were compared, and it was found that participants spent significantly less time in the former experiment than in the latter. At the same time, there is a strong correlation between the performance of angle sorting and two-angle discrimination, which shows that the angle threshold obtained by the new method can also be used to evaluate the ability of touch discrimination. Moreover, the angle sorting results of different age groups also further demonstrate the feasibility of the method. The efficiency of this new method and the effectiveness of the system also provide a convenient means for evaluating haptic shape discrimination, which may have potential clinical application value in the early diagnosis of peripheral neuropathy and even in the evaluation of cognitive function.

1. Introduction

Tactile shape discrimination plays an important role in the process of human exploration of the outside world [1]. In the process of shape discrimination, the human cerebral network activates the primary and secondary somatosensory cortex for sensing spatial information [2,3,4,5], a part of the parietal sulcus for advanced cognition such as the higher-level areas for computation and elaborate reconstruction of shapes [6,7,8,9] and the prefrontal cortex for tactile working memory processing [6,10]. Previous studies have demonstrated that shape discriminability changes with age [11,12] and is impaired by neurodegenerative diseases such as Alzheimer’s disease (AD) [13,14]. Thus, an appropriate set of shape discrimination tests is expected to distinguish the cognitive functions of healthy older individuals and patients with neurodegenerative disease, which may serve as a preclinical screening test. The present study aims to develop an efficient and convenient shape discriminability detection paradigm and device.
Touch shape discriminability is commonly used clinically to assess tactile perception and even to estimate higher-level functions such as working memory [15,16,17]. In our previous studies, tactile angle discrimination was found to be related to higher cognitive functions, where the impairment of working memory significantly reduced tactile angle discriminability [13,14]. Therefore, we developed an angle stimuli presentation device [18] for the evaluation of cognitive impairment by testing tactile angle discriminability. In that experiment, the two-alternative forced-choice (2AFC) method was used. We presented 20 pairs of angle stimuli in pseudorandom order and calculated the angle discrimination threshold [13,19]. However, there are still two problems in our previous research on angle threshold discrimination. (1) The 2AFC paradigm needs many pairwise comparisons, which are necessary for an accurate discrimination threshold, consequently, it takes approximately 2.5 h for each participant to complete the task. In particular, it is difficult for some groups to concentrate on long-term tests. (2) The device was controlled using an extra computer to code and required a technician to run the control program, which makes these complex operations difficult for the device to be used clinically, especially by nonprofessionals.
To solve these two problems, we proposed a new method in which participants are asked to sort a series of five angle stimuli. By using the obtained angle sorting data, we derived the discrimination thresholds ( D T s ), enabling us to evaluate angle discriminability detection efficiently. We explained in detail the paradigm process of angle sorting and the evaluation calculation method in this paradigm. Furthermore, we designed a new integrated automatic control system device that is user-friendly for nonprofessionals. Instead of using the hardware structure of the previous device to rely on the computer, a microcomputer is directly integrated into the new device. Special analysis software is designed for the system, which can collect and analyze data in the paradigm of angle sorting and then display and transmit the results.

2. Angle Sorting

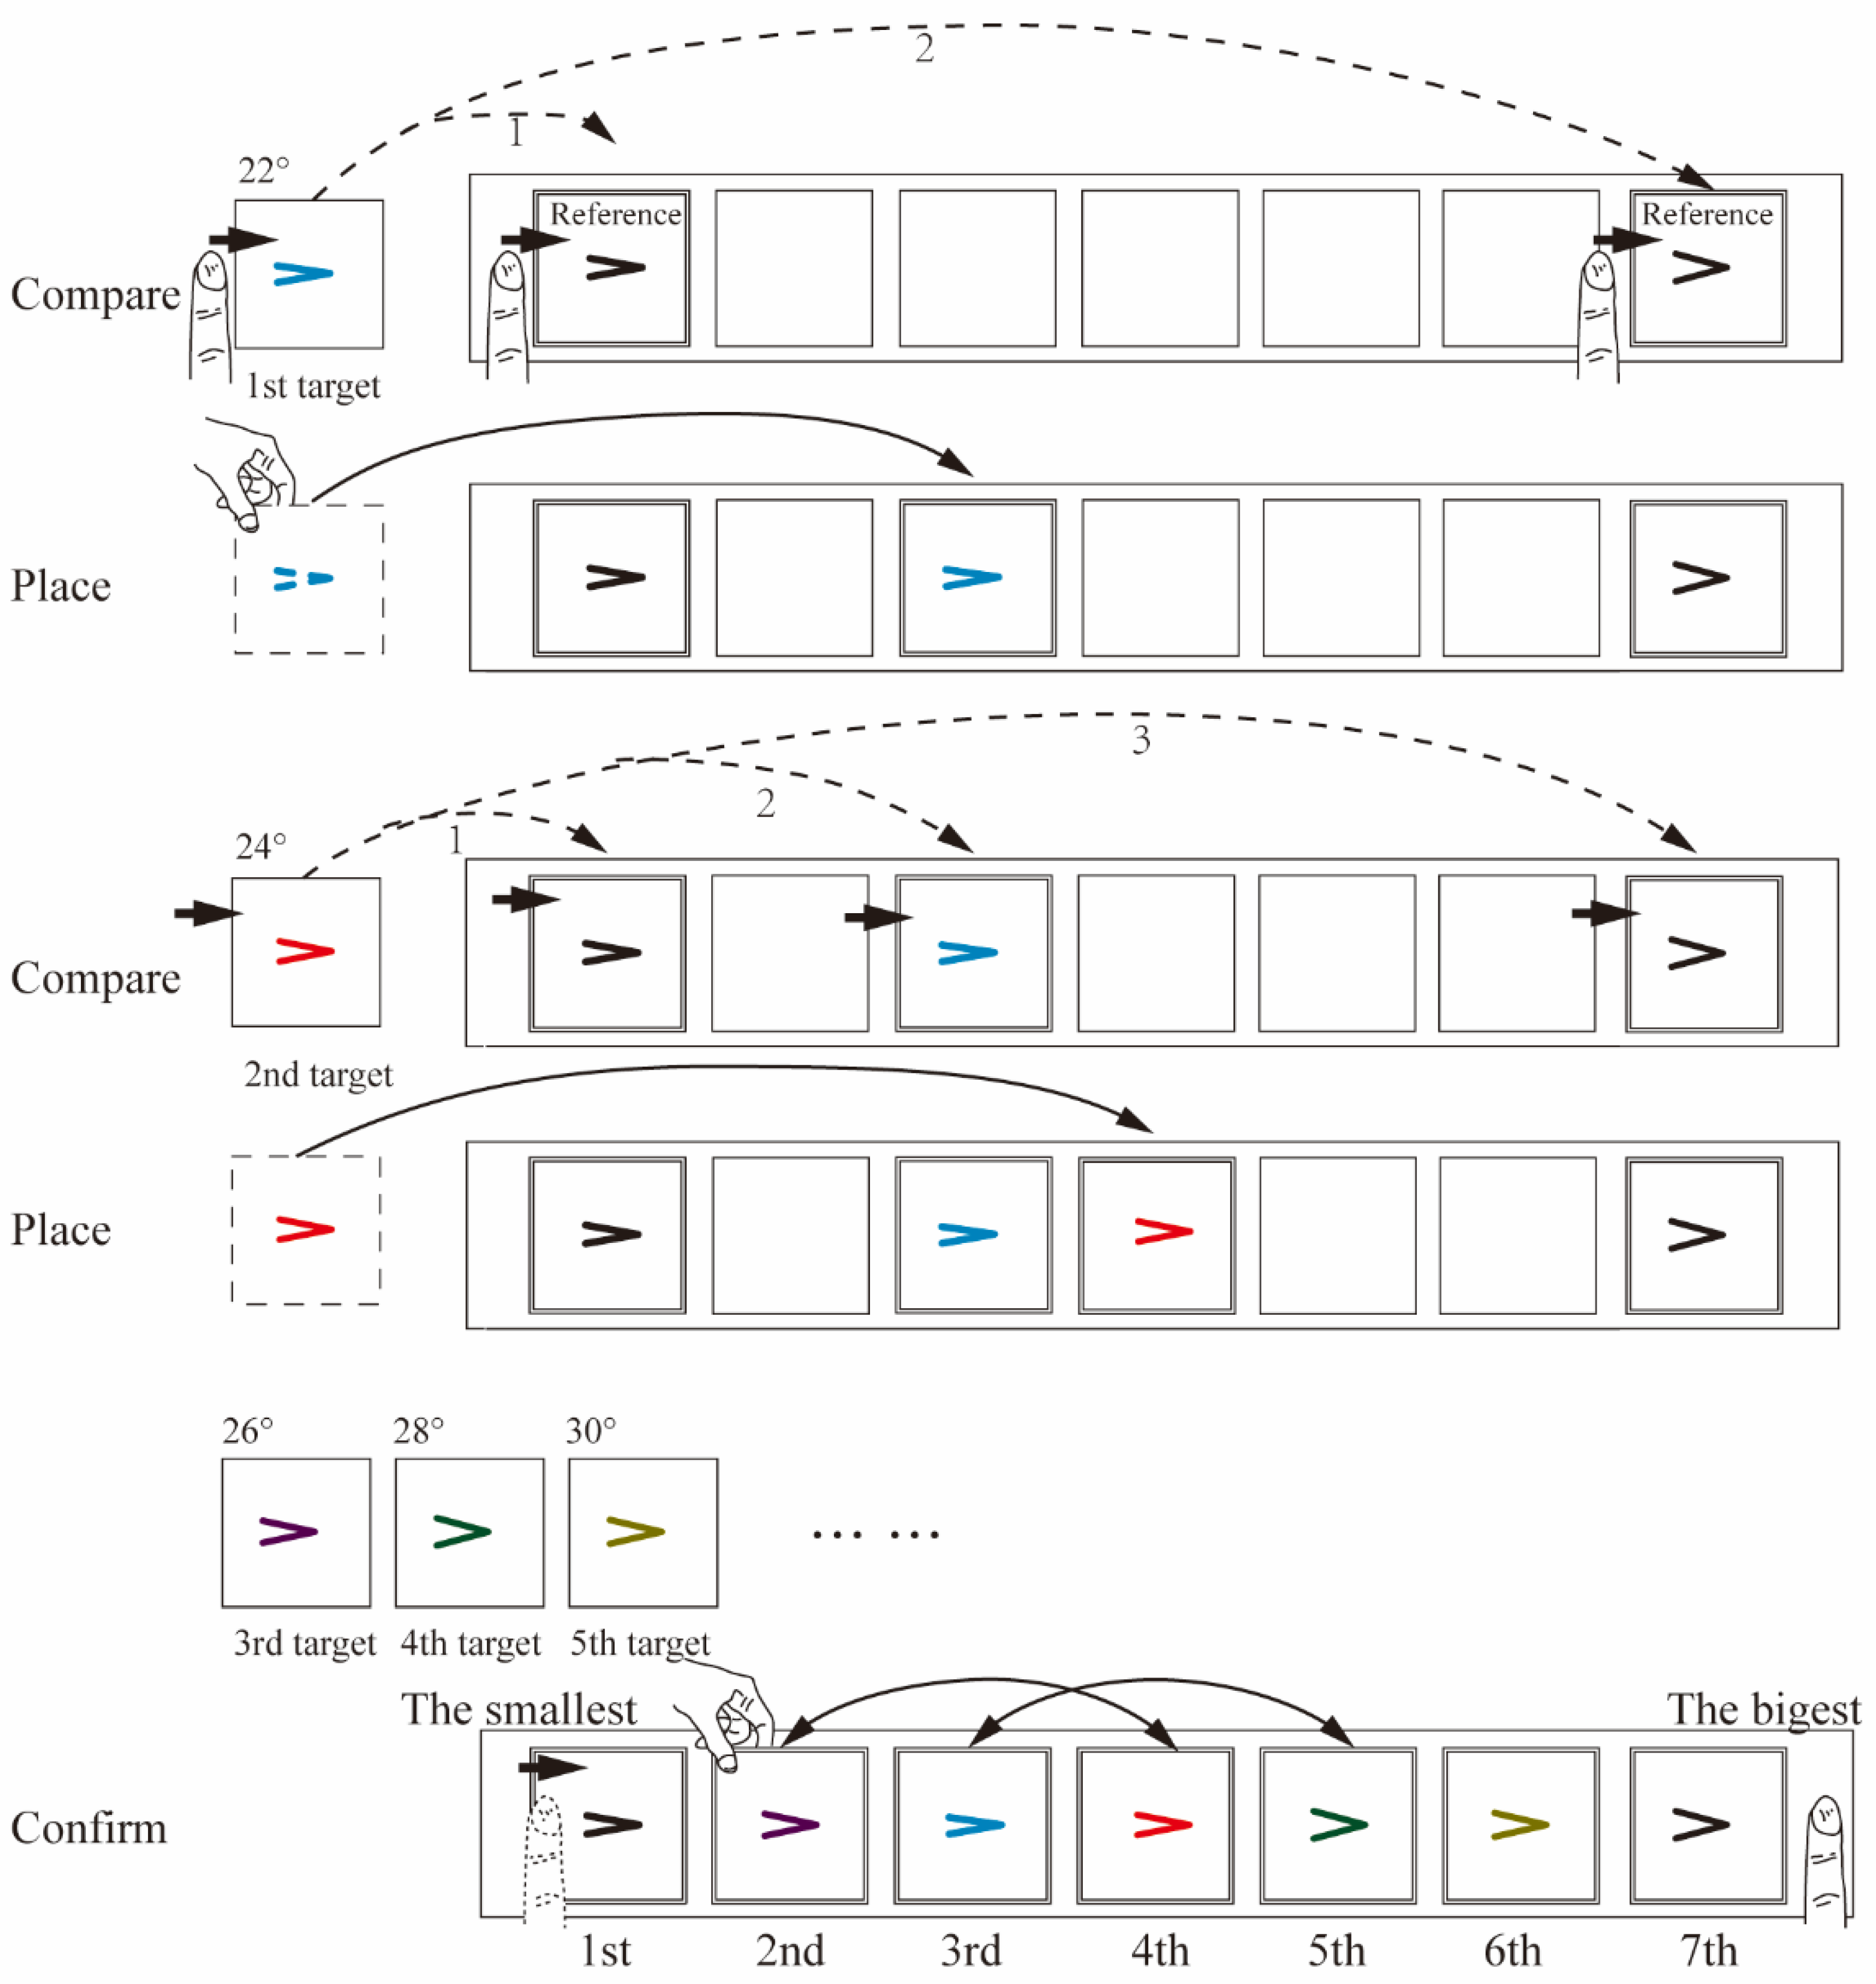
2.1. Procedure of Haptic Angle Sorting

Sorting is an efficient method that can be used for psychophysical measurements [20], such as the 100-hue test for measuring hue discrimination. Referring to this visual test paradigm, we propose a new method of angle sorting for haptic shape discrimination. In the angle sorting paradigm, there are a series of seven angle stimuli, for instance, with an angle difference of 2° in the present study, including the smallest and the largest reference angles, and five angles between these two reference angles.
During the experiment, the participant wore an eye mask, and the heights of the chair and table were adjusted to ensure that the participant’s arms were comfortable. The experimenter placed the angle stimulus at a minimum angle in the first position of the device and a maximum angle in the seventh position, as shown in Figure 1. Then, the remaining five angle stimuli to be sorted were randomly presented to the participant one by one. The participant was asked to discriminate and compare each angle stimulus with the index finger of their right hand and sort it with his/her left hand. The participant placed the angle stimulus in one of the positions from the second to the sixth position and ensured that the angle stimuli were placed from the first to the seventh position in sequence from small to large. All angle stimuli are horizontally placed with the vertex to the right and two rays to the left. Fixing the minimum and maximum angle stimuli at the first and seventh positions provides a very clear reference for the participant and reduces the difficulty of the angle sorting experiment. In addition, the angle stimuli placed by the participant in the second to sixth positions can be adjusted an unlimited number of times, although the direction of the angle stimulus remains the same.
The participant was allowed to touch the angle stimuli of the first and seventh positions in the experiment but could not move their positions. After each adjustment of the stimulus, the participant was asked to confirm the sort of the haptic angles from left to right. From the evaluation experiment, it was found that all the participants submitted results after approximately three to five sorting confirmations. After angle sorting was confirmed and submitted, one trial was complected. A trial of the angle sorting paradigm is shown in Figure 1. With this paradigm, it only takes 3–5 min to get the threshold.

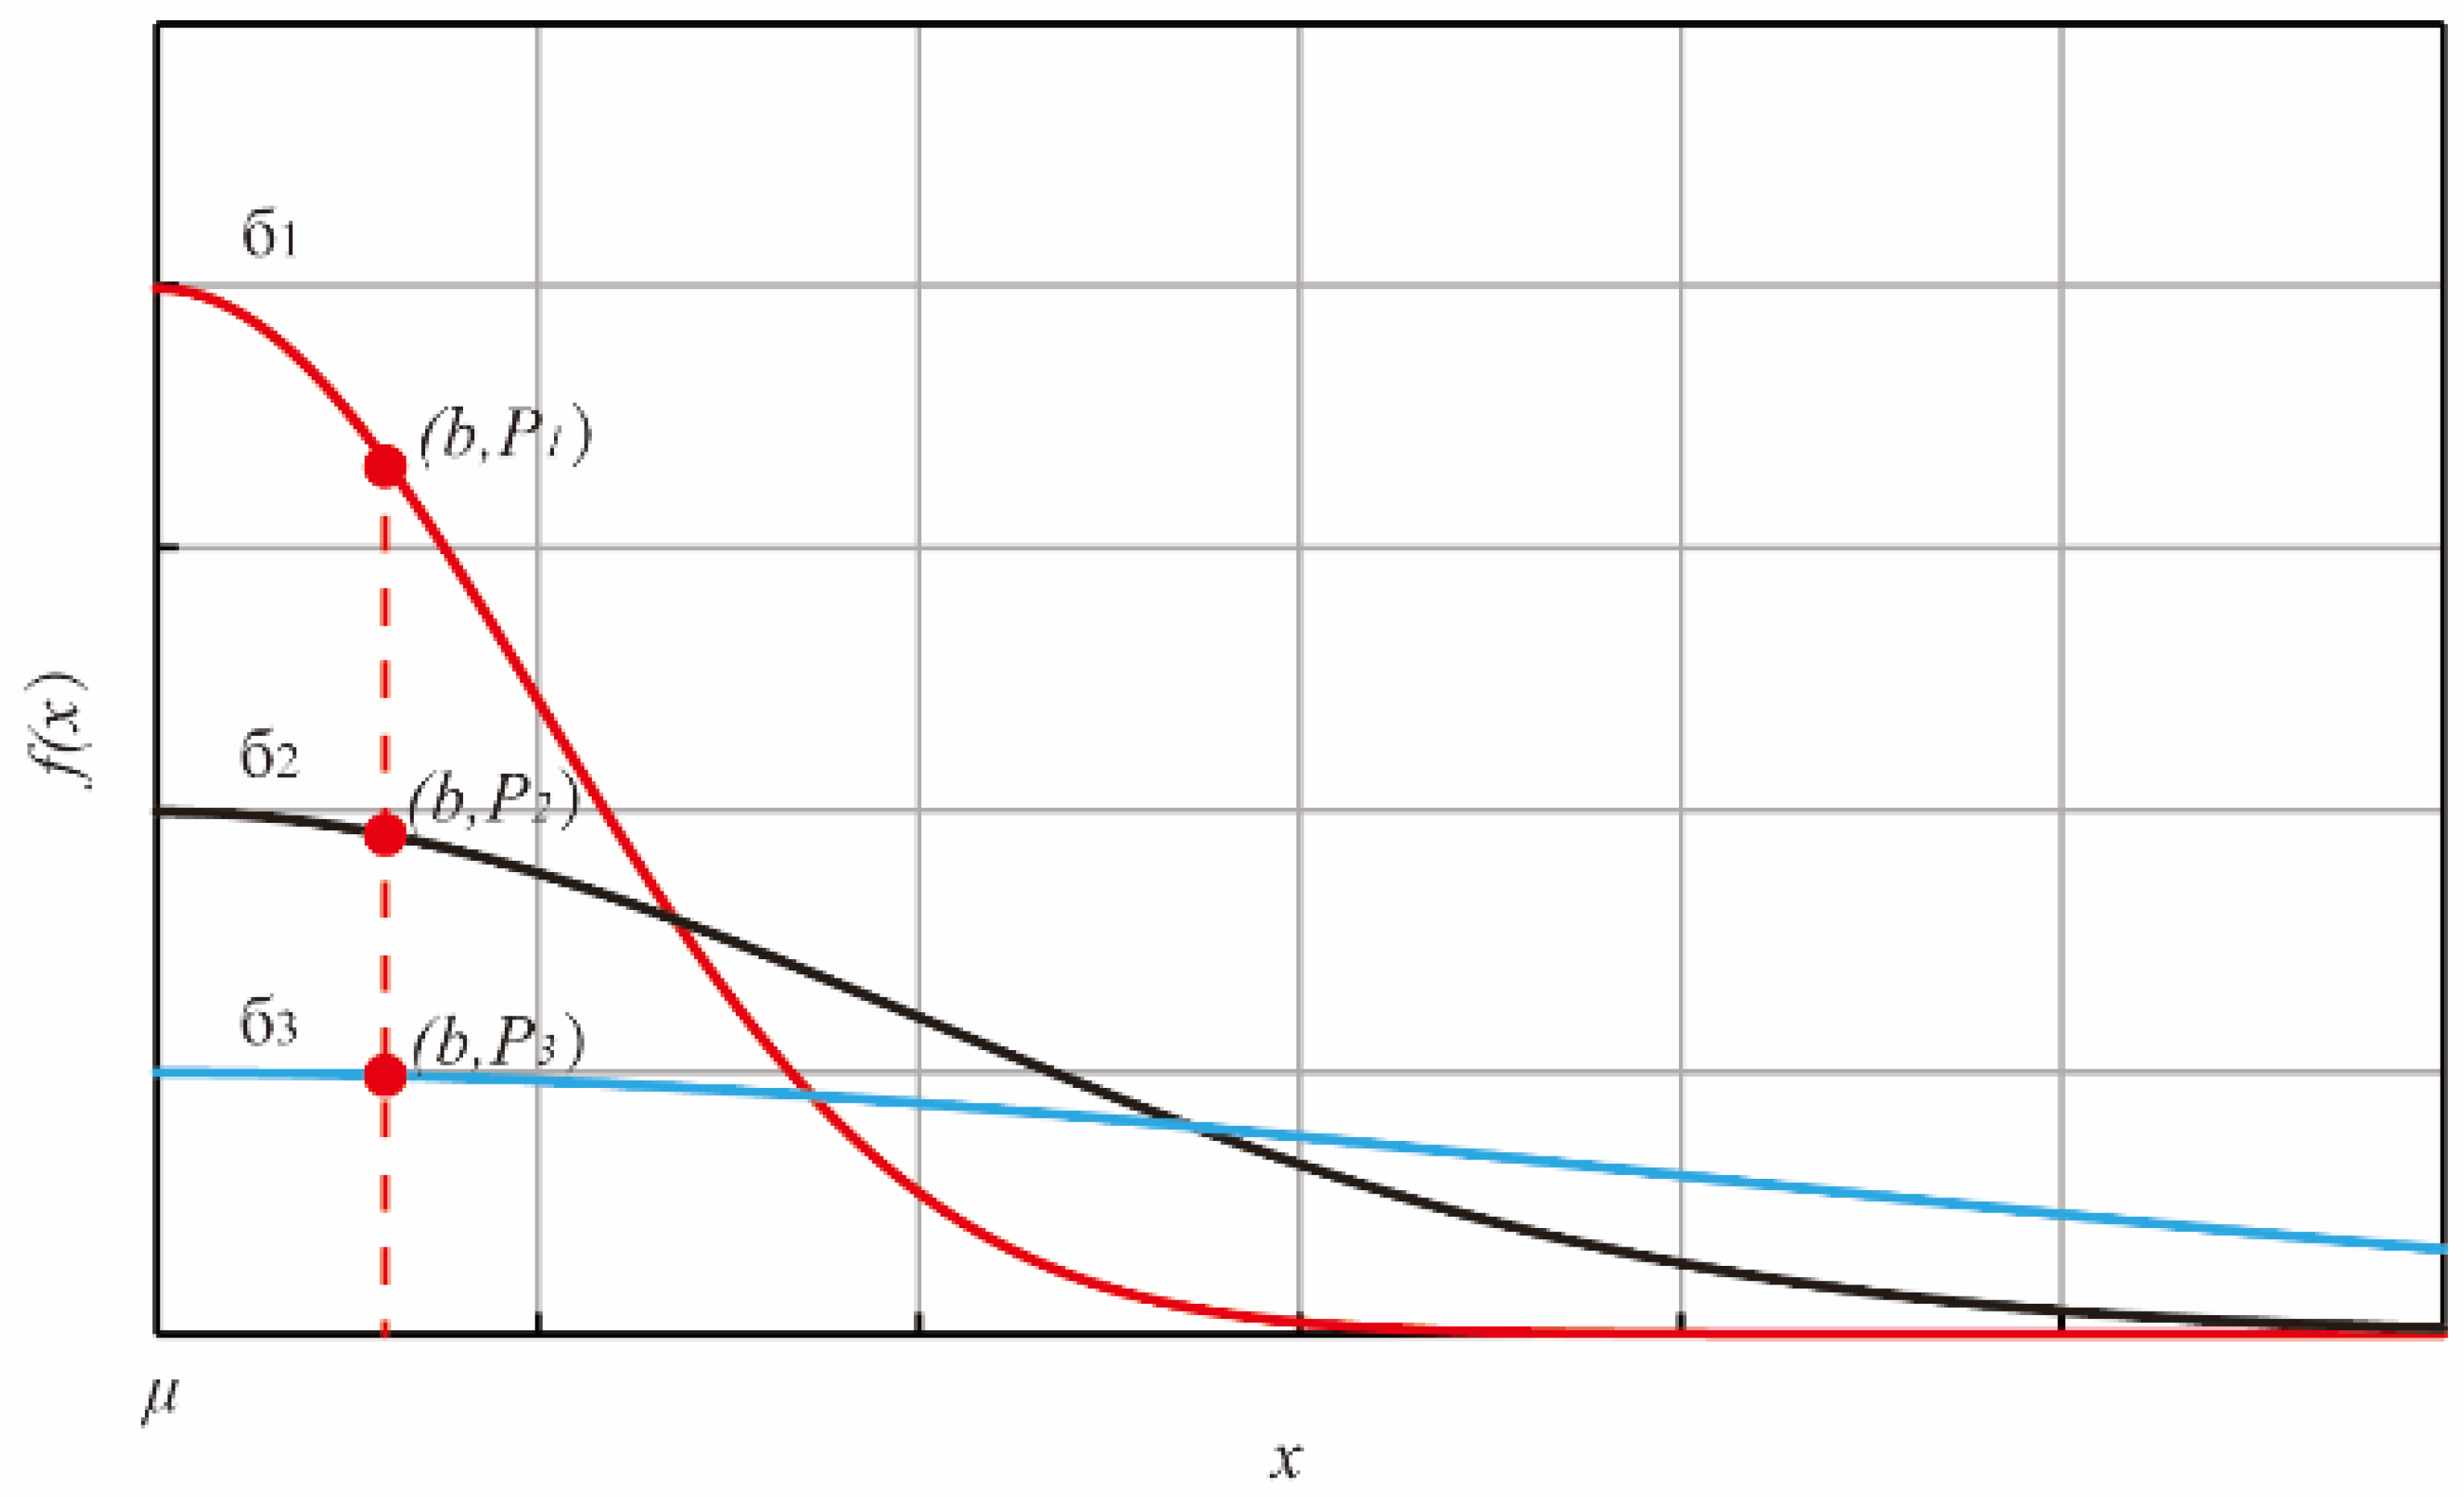
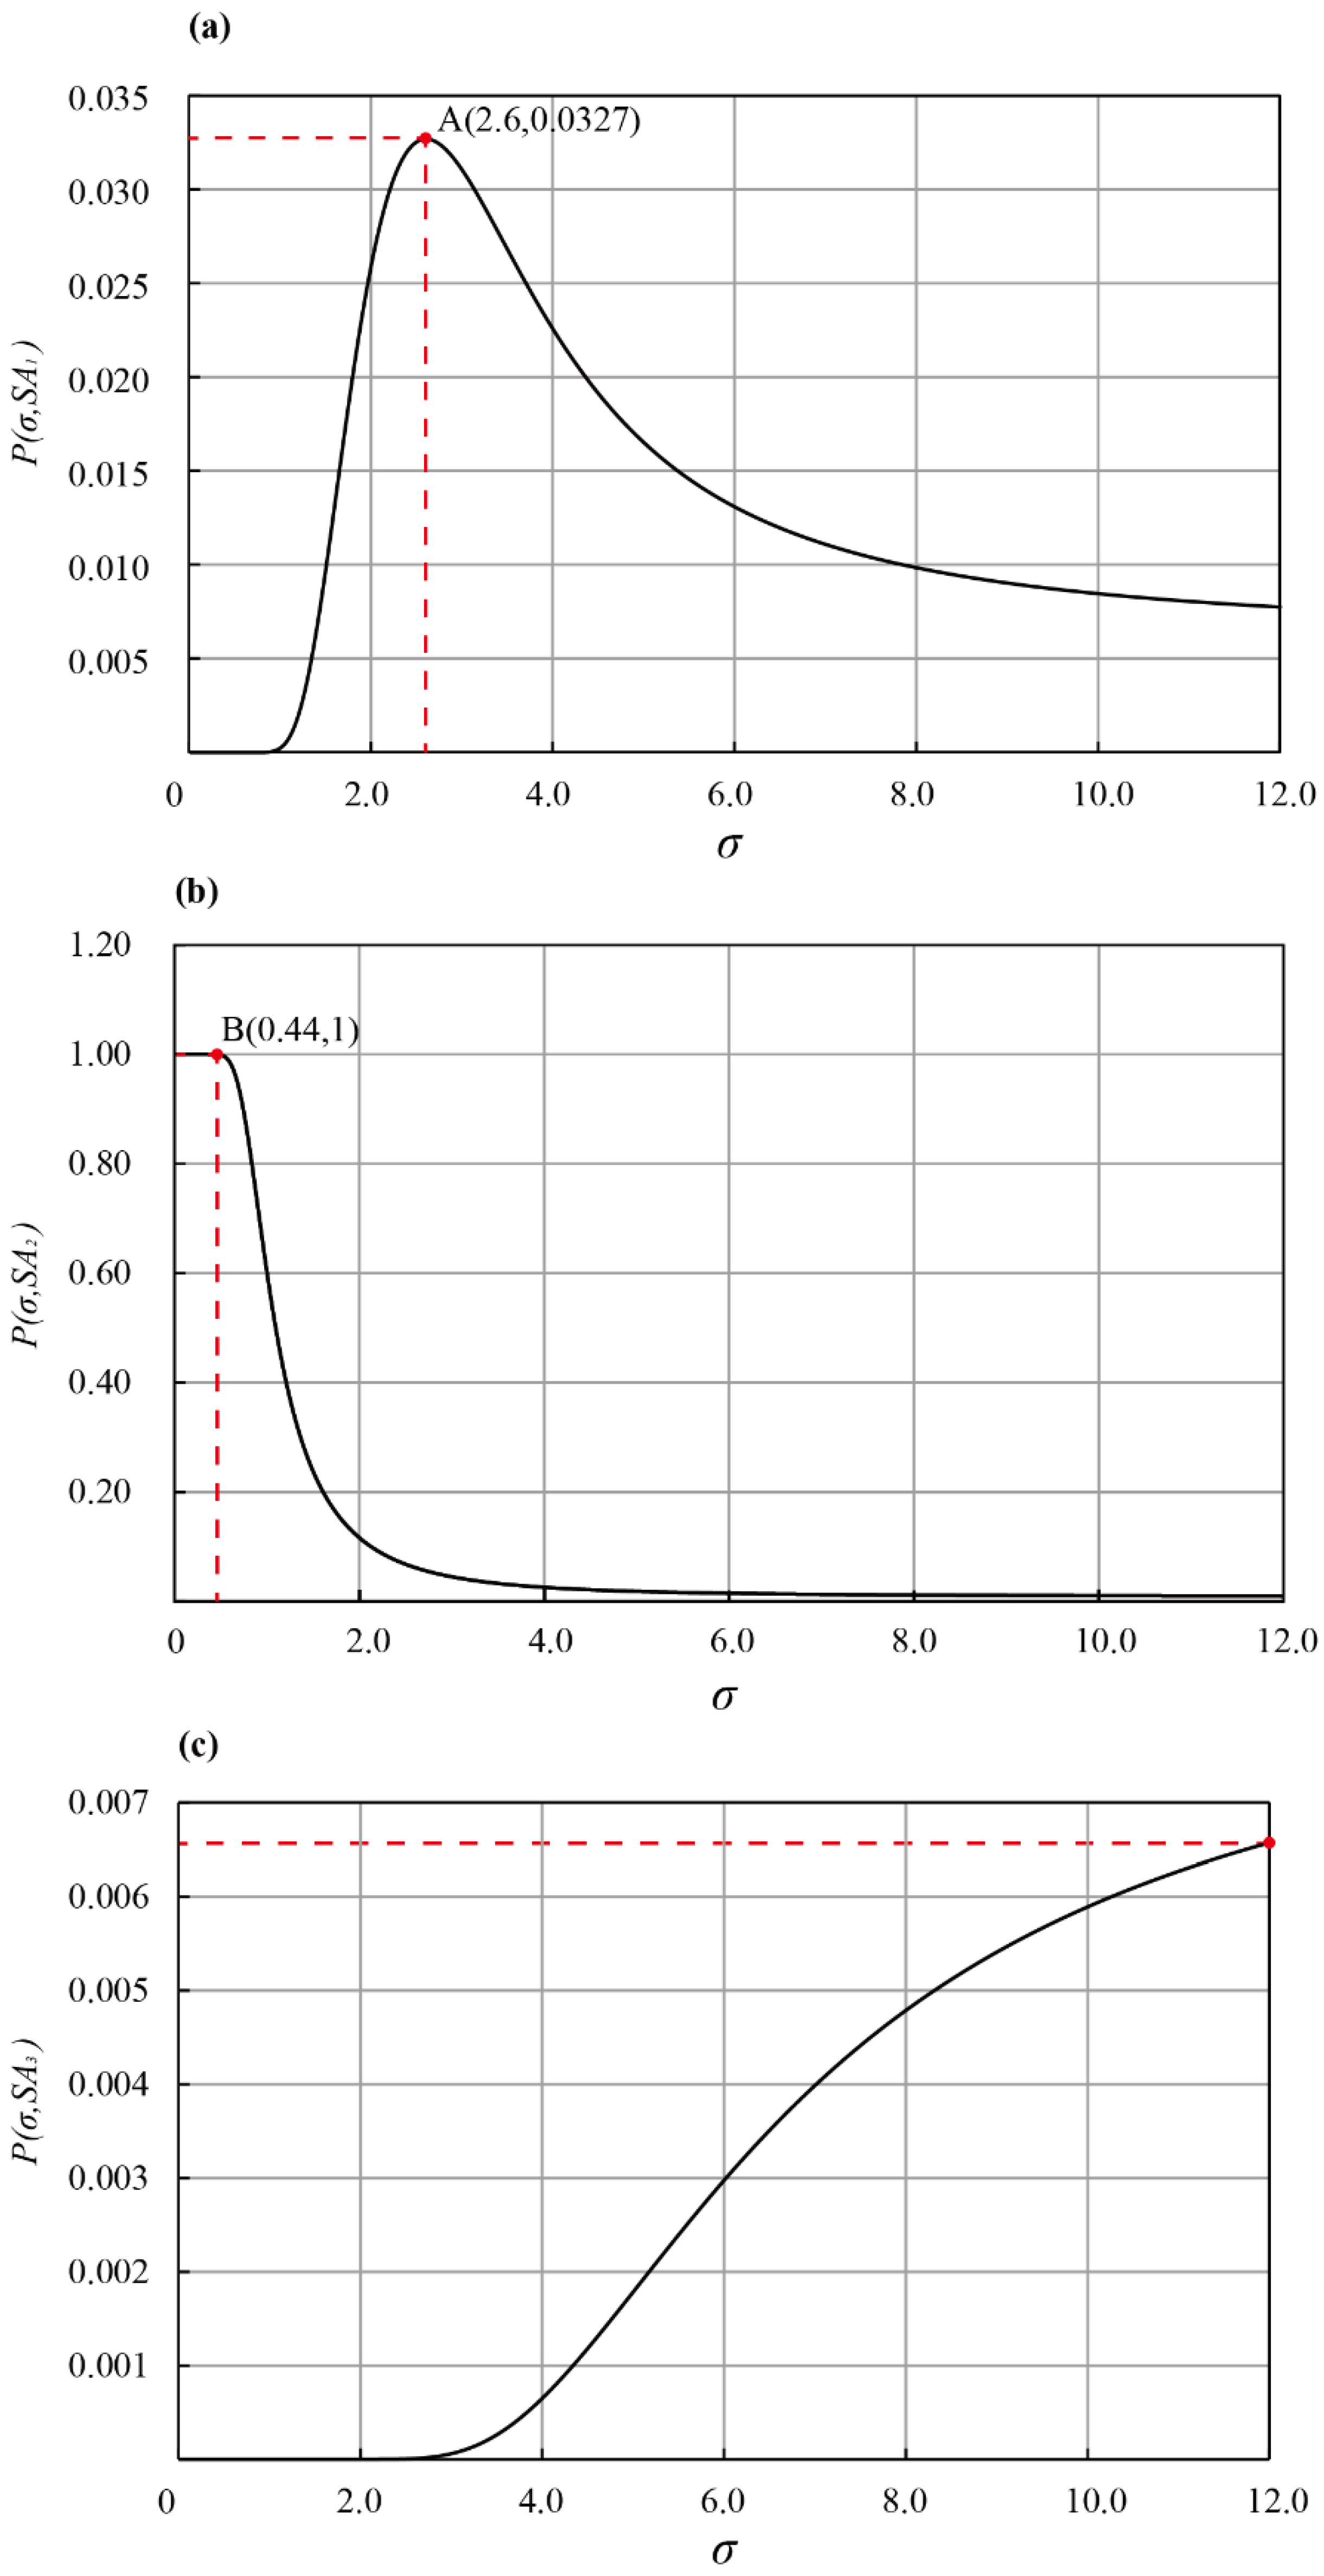
2.2. Estimation of Standard Deviation

The maximum likelihood probability of each sorting result was statistically analyzed. In the data analysis, we hypothesized that the participant always chooses the smallest from the unplaced angle every time starting from the second position when sorting, until the last one is placed in the sixth position, and that once each stimulus was selected, they could not be selected again. The participant’s angle discrimination ability was constant, and we supposed that the probability of selecting each angle stimulus at the second position was P 2 , n . Assuming that this probability obeys the normal distribution P 2 , n ~ N ( μ , σ 2 ) , according to the central limit theorem of statistics, the probability of choosing the smallest angle at the second position is the largest, that is, the peak value of the normal distribution probability curve; the selection probability of adjacent and spaced angles obeys the normal distribution probability density and decreases with increasing distance. Similarly, at the third, fourth, fifth and sixth positions, the probability that the participant will choose the smallest angle from the rest is still the highest, and the probability is also the peak of the same normal distribution probability curve. The selection probability of the adjacent angle and the interval angle obeys the normal distribution probability density and decreases with increasing distance between them and the minimum angle. It should be noted that this probability is zero if the adjacent angle has been placed before, and the next angle category due to the large difference between it and the smallest angle will still reduce the probability of being selected.
More importantly, it is appropriate to apply the normal distribution to the psychophysical calculations of behavior [21,22,23]. When a normal distribution is used, the haptic angle sorting discriminability between each participant can be assessed by σ in the normal distribution. If μ = a and x = b are determined in the normal distribution; When σ is smaller, the probability density value, f ( x = b ; μ = a ; σ ) , of the normal distribution at x = b is larger, which reflects that participants are more likely to discriminate the smallest angle, that is, the participant has better discrimination of the angle; the larger σ , the smaller the probability density value, the lower the probability of choosing the smallest angle, and the worse the participant’s haptic angle discriminability, as shown in Figure 2. Therefore, according to this meaning of the standard deviation of the normal distribution σ in the psychophysical quantity, σ is the unique standard deviation of the normal distribution curve, of which the mathematical model can be established as follows.
Since the smallest angle stimulus is always selected at each position during sorting, the normal distribution determines that the probability is related to the smallest angle among the remaining angles. For example, a trial of angle sorting ( A S 1 ) is 26°, 22°, 24°, 28° and 30°, as shown in Figure 1. Here, we set up μ = m i n ( A S ) , σ = 1.4 and m i n ( A S ) as the smallest angle value among the remaining angle categories, then
P 2 , n = f ( x ; u ; σ = 1.4 ) = 1 1.4 2 π e 1 2 ( x μ 1.4 ) 2
In Equation (1), P 2 , n is the probability that the remaining angle category stimulus is selected at the second position, n ( 22 ,   24 ,   26 ,   28 ,   30 ) . The smallest angle among the remaining angle categories in the sec ond position is 22°, μ = 22 , and as the peak value of the normal distribution is P 2 , 22 = f ( x = 22 ; u = 22 ; σ = 1.4 ) = 0.2850 , the adjacent and other angle probabilities are P 2 , 24 = f ( x = 24 ; u = 22 ; σ = 1.4 ) = 0.1027 , P 2 , 26 = f ( x = 26 ; u = 22 ; σ = 1.4 ) = 0.0048 , P 2 , 28 = f ( x = 28 ; u = 22 ; σ = 1.4 ) = 0 and P 2 , 30 = f ( x = 30 ; u = 22 ; σ = 1.4 ) = 0 . P 3 , n is also the probability of the remaining angle category stimulus selected in the third position, n ( 22 ,   24 ,   28 ,   30 ) . The smallest angle among the remaining angle categories in the third position is still 22°, μ = 22 , and as the peak value of the normal distribution is P 3 , 22 = f ( x = 22 ; u = 22 ; σ = 1.4 ) = 0.2850 , the adjacent and other angle probabilities are P 3 , 24 = f ( x = 24 ; u = 22 ; σ = 1.4 ) = 0.1027 , P 3 , 26 = 0 , P 3 , 28 = f ( x = 28 ; u = 22 ; σ = 1.4 ) = 0 and P 3 , 30 = f ( x = 30 ; u = 22 ; σ = 1.4 ) = 0 . Here, the stimulus of 26° has been placed in the second position and the probability of P 3 , 26 is 0. In the subsequent position, since each stimulus cannot be selected again once it has been selected, the probability of the angle stimulus selected before is also 0; thus, the probability of being selected in P 4 , n , P 5 , n , and P 6 , n is also 0 in all cases. In addition, the probability of choosing the smallest angle at each position is always the greatest; that is, the probability of the angle being selected is the peak in its probability distribution, f ( x = μ ; μ ; σ = 1.4 ) = 0.2850 ; for example, the smallest angle in the third position is 22°, which is the same as that of the second position. The probability density of the remaining angle selected decreases with increasing distance and obeys the normal distribution. Therefore, we can obtain the probability distributions of P 4 , n , P 5 , n and P 6 , n in the fourth , fifth and sixth   positions , respectively, as shown in Table 1.
In Table 1, the trial angle sorting is 26°, 22°, 24°, 28° and 30°. When we evaluate the probability of being selected at the second position, the probability of each angle is different. And we assume that when participants are asked to choose the smallest angle, the probability of choosing different angles obeys a normal distribution, so μ = m i n ( 22 ,   24 ,   26 ,   28 ,   30 ) = 22 . And the probability of each angle being selected during the process of this category is P 2 , n ( n = 22 , 24 , 26 , 28 , 30 ), as show in Table 1. For instance, the angle of the second position is 26°, and the probability of its occurrence is
P L 2 = f ( x = 26 ; μ = 22 ; σ = 1.4 ) n = 22 30 P 2 , n = 0.0048 0.2850 + 0.1027 + 0.0048 + 0 + 0 = 0.0123
In Equation (2), P L 2 is the probability of choosing this angle (26°) among the remaining angle stimuli (26°, 22°, 24°, 28°, 30°) at the second position. At the third position, the rest angles are 22°, 24°, 28° and 30°, so μ = m i n ( 22 ,   24 ,   28 ,   30 ) = 22 . 26 has been placed in the second position, and according to the assumption that once each stimulus was selected, it could not be selected again, its probability of being selected is 0. However, the rest of angles still obey the normal distribution. Therefore, the probability of each category of angle being selected is P 3 , n ( n = 22 , 24 , 26 , 28 , 30 ), as show in Table 1. The angle of the third position is 22°, and the probability of its occurrence is
P L 3 = f ( x = 22 ; μ = 22 ; σ = 1.4 ) n = 22 30 P 2 , n = 0.2850 0.2850 + 0.1027 + 0 + 0 + 0 = 0.7350
In Equation (3), P L 3 is the probability of choosing this angle (22°) among the remaining angle stimuli (22°, 24°, 28°, 30°). Similarly, we have P L 4 = 0.9833 , P L 5 = 0.7350 ,   P L 6 = 1 . Therefore, when σ = 1.4 and A S 1 = ( 26 ° , 22 ° , 24 ° , 28 ° , 30 ° ) , the probability is P ( σ , A S 1 ) = P L 2 P L 3 P L 4 P L 5 P L 6 = 0.0065 , as shown in Table 1.
Here, we know that this result has nothing to do with the mean μ and x range of the normal distribution and is based on the angle sorting A S 1 = ( 26 ° , 22 ° , 24 ° , 28 ° , 30 ° ) and the assumption of σ = 1.4 . The result, P ( σ , A S 1 ) , changes with each different value chosen for σ . According to the above data analysis model, when A S 1 is determined, we can construct the relationship function of P ( σ , A S 1 ) = f ( σ ) with σ as the independent variable. For example, when A S 1 = ( 26 ° , 22 ° , 24 ° , 28 ° , 30 ° ) , we can obtain the relationship between σ and P ( σ , A S 1 ) , as shown in Figure 3a.
We can see from Figure 3a that when the angle sorting is A S 1 = ( 26 ° , 22 ° , 24 ° , 28 ° , 30 ° ) , P ( σ , A S 1 ) will change with the change of σ ; there is a peak value in the change of P ( σ ,   A S 1 ) , as shown in point A (2.6, 0.0327) in Figure 3a. The probability of P ( σ ,   A S 1 ) corresponding to the peak is the maximum probability in this angle sorting. Therefore, we can obtain the participant’s σ corresponding to the peak value, σ = 2.6 .
Two special situations need to be considered in the standard deviation estimation. First, when the angle sorting is completely correct, A S 2 = ( 22 ° , 24 ° , 26 ° , 28 ° , 30 ° ) , the relationship between P ( σ , A S 2 ) and σ is shown in Figure 3b. Figure 3b shows that when, σ [ 0 , 0.44 ] , the probability P ( σ ,   A S 2 ) is the maximum, which indicates that there are countless kinds of the probability P ( σ ,   A S 2 ) corresponding to σ ; when σ > 0.44 , as shown in B (0.44,1) in Figure 3b, the probability P ( σ , A S 2 ) will gradually decrease. In this case, we set the σ of the correct angle sorting to 0.44. However, if a participant is perfectly discriminating every time in angle sort, the experimenter should consider choosing a series of stimuli with a smaller angle difference.
Second, if the angle sorting is A S 3 = ( 28 ° , 30 ° , 26 ° , 24 ° , 22 ° ) , that is, when the participant mistook the larger angle as the smallest angle during sorting, the relationship between P ( σ , A S 3 ) and σ is shown in Figure 3c. As shown in Figure 3c, P ( σ , A S 3 ) increases with increasing σ , and the result of σ is the upper bound that we set. At this point, we considered that the A S 3 could not be used to evaluate the participant’s σ . If this happens, this series of angle stimuli for the sorting should be replaced by a larger angle difference, larger than 2°; if it still cannot be obtained, σ , which is not the upper bound value, continues to replace the larger value.

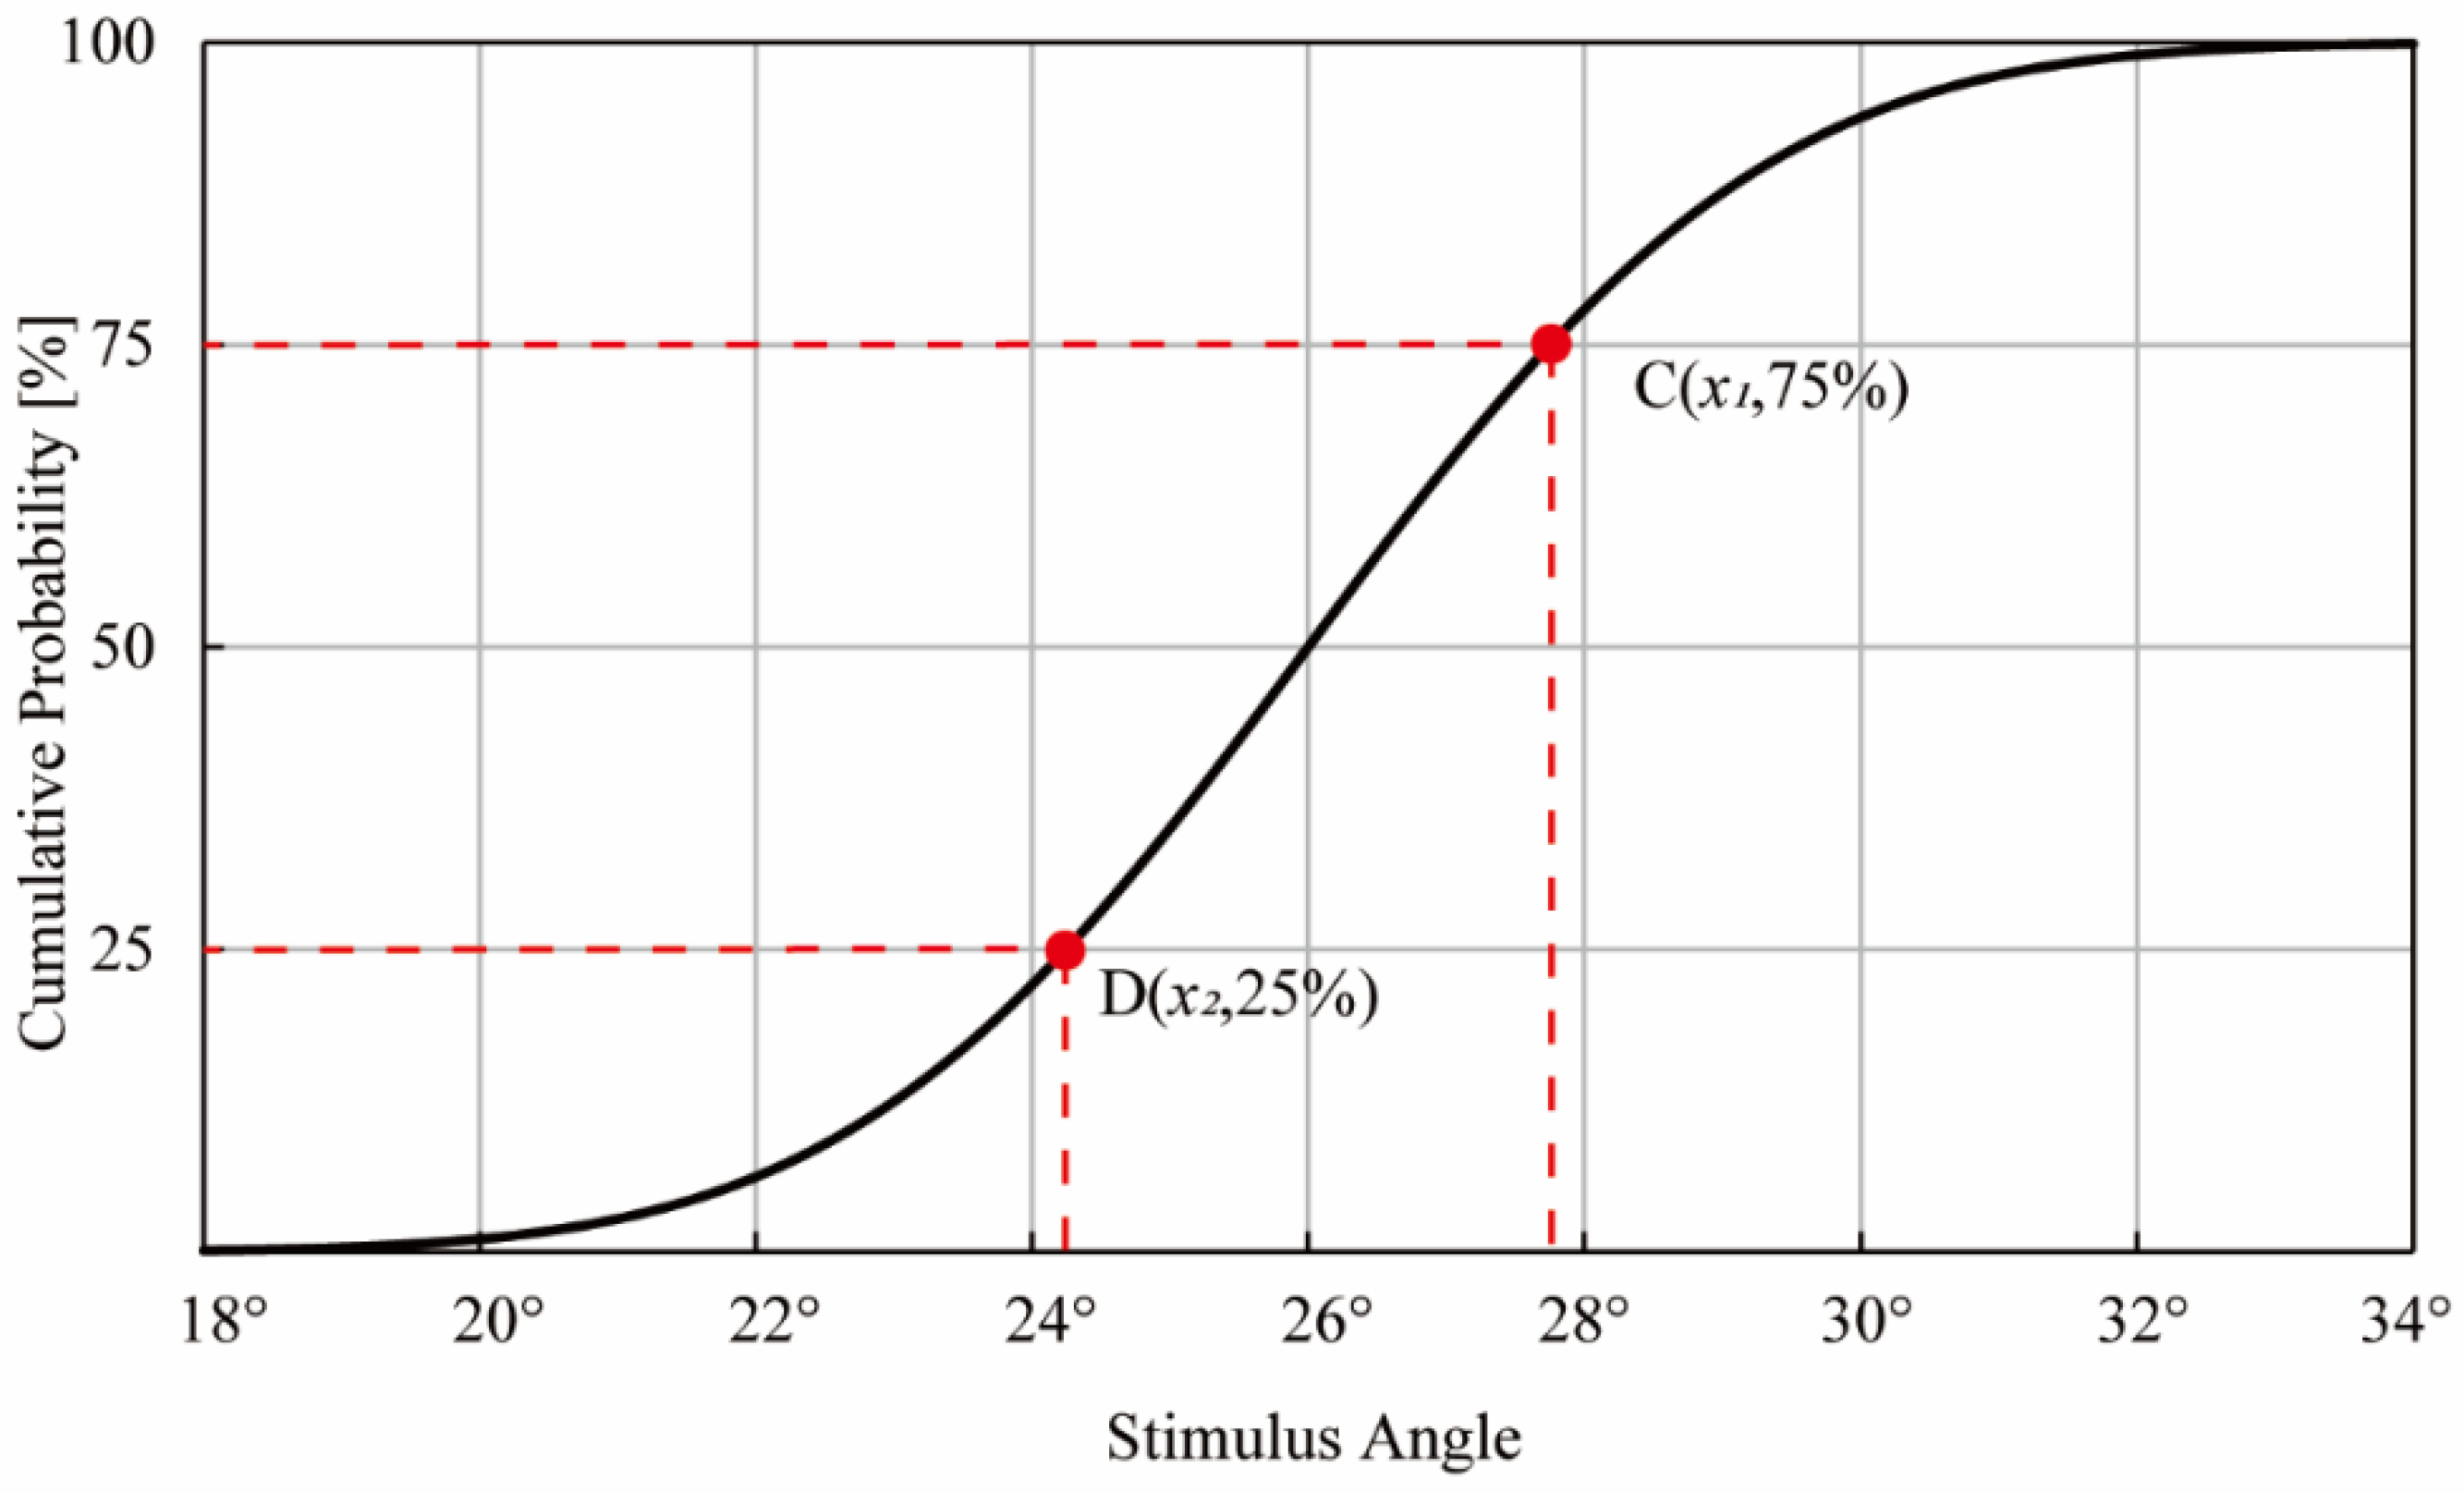
2.3. Angle Discrimination Threshold

In the evaluation of angle sorting, we showed in detail the relationship between the standard deviation of the normal distribution and the participant’s discriminative ability. Indeed, for an example of a sorting result ( 26 ° , 22 ° , 24 ° , 28 ° , 30 ° ), we estimated σ = 2.6 , which indicates the maximum probability of the angle sorting result.
Next, by integrating the normal distribution, for example, with an estimated standard deviation, we derived the normal cumulative distribution function, which indicates the angle discrimination function, as shown in Figure 4. In the figure, we used the σ = 2.6 and the mean angle of 26°. The horizontal axis indicates the stimulus angle, and the vertical axis indicates the cumulative probability. The difference in the cumulative probability between two stimuli indicates the discriminability between the two stimuli. In general, the discrimination threshold from the mean angle is defined by the angle indicating the cumulative probability of 25% or 75%. The cumulative probabilities of 25% and 75% correspond to the horizontal distance multiplied by 0.675 and the standard deviation ( σ = 2.6 ) from the mean angle. Thus, we can calculate the angle discrimination threshold ( D T ) by using the following equation:
D T = x 1 x 2 2 = 0.675 σ
In Equation (4), x 1 and x 2 denote the angle discrimination thresholds from the reference angle, as shown at points C and D in Figure 4. When σ = 2.6 , for example, D T is estimated to be approximately 1.76°.
In the present study, we used the normal cumulative distribution function rather than a logistic function which previous studies [13,19] used to estimate the discrimination thresholds. These two distribution functions are known to be similar except that logistics have heavier tails than the normal cumulative distribution function. Therefore, it is not unreasonable to use the normal probability function and the normal cumulative distribution function to estimate the angle discrimination threshold from the angle sorting result.

3. Angle Sorting System Description
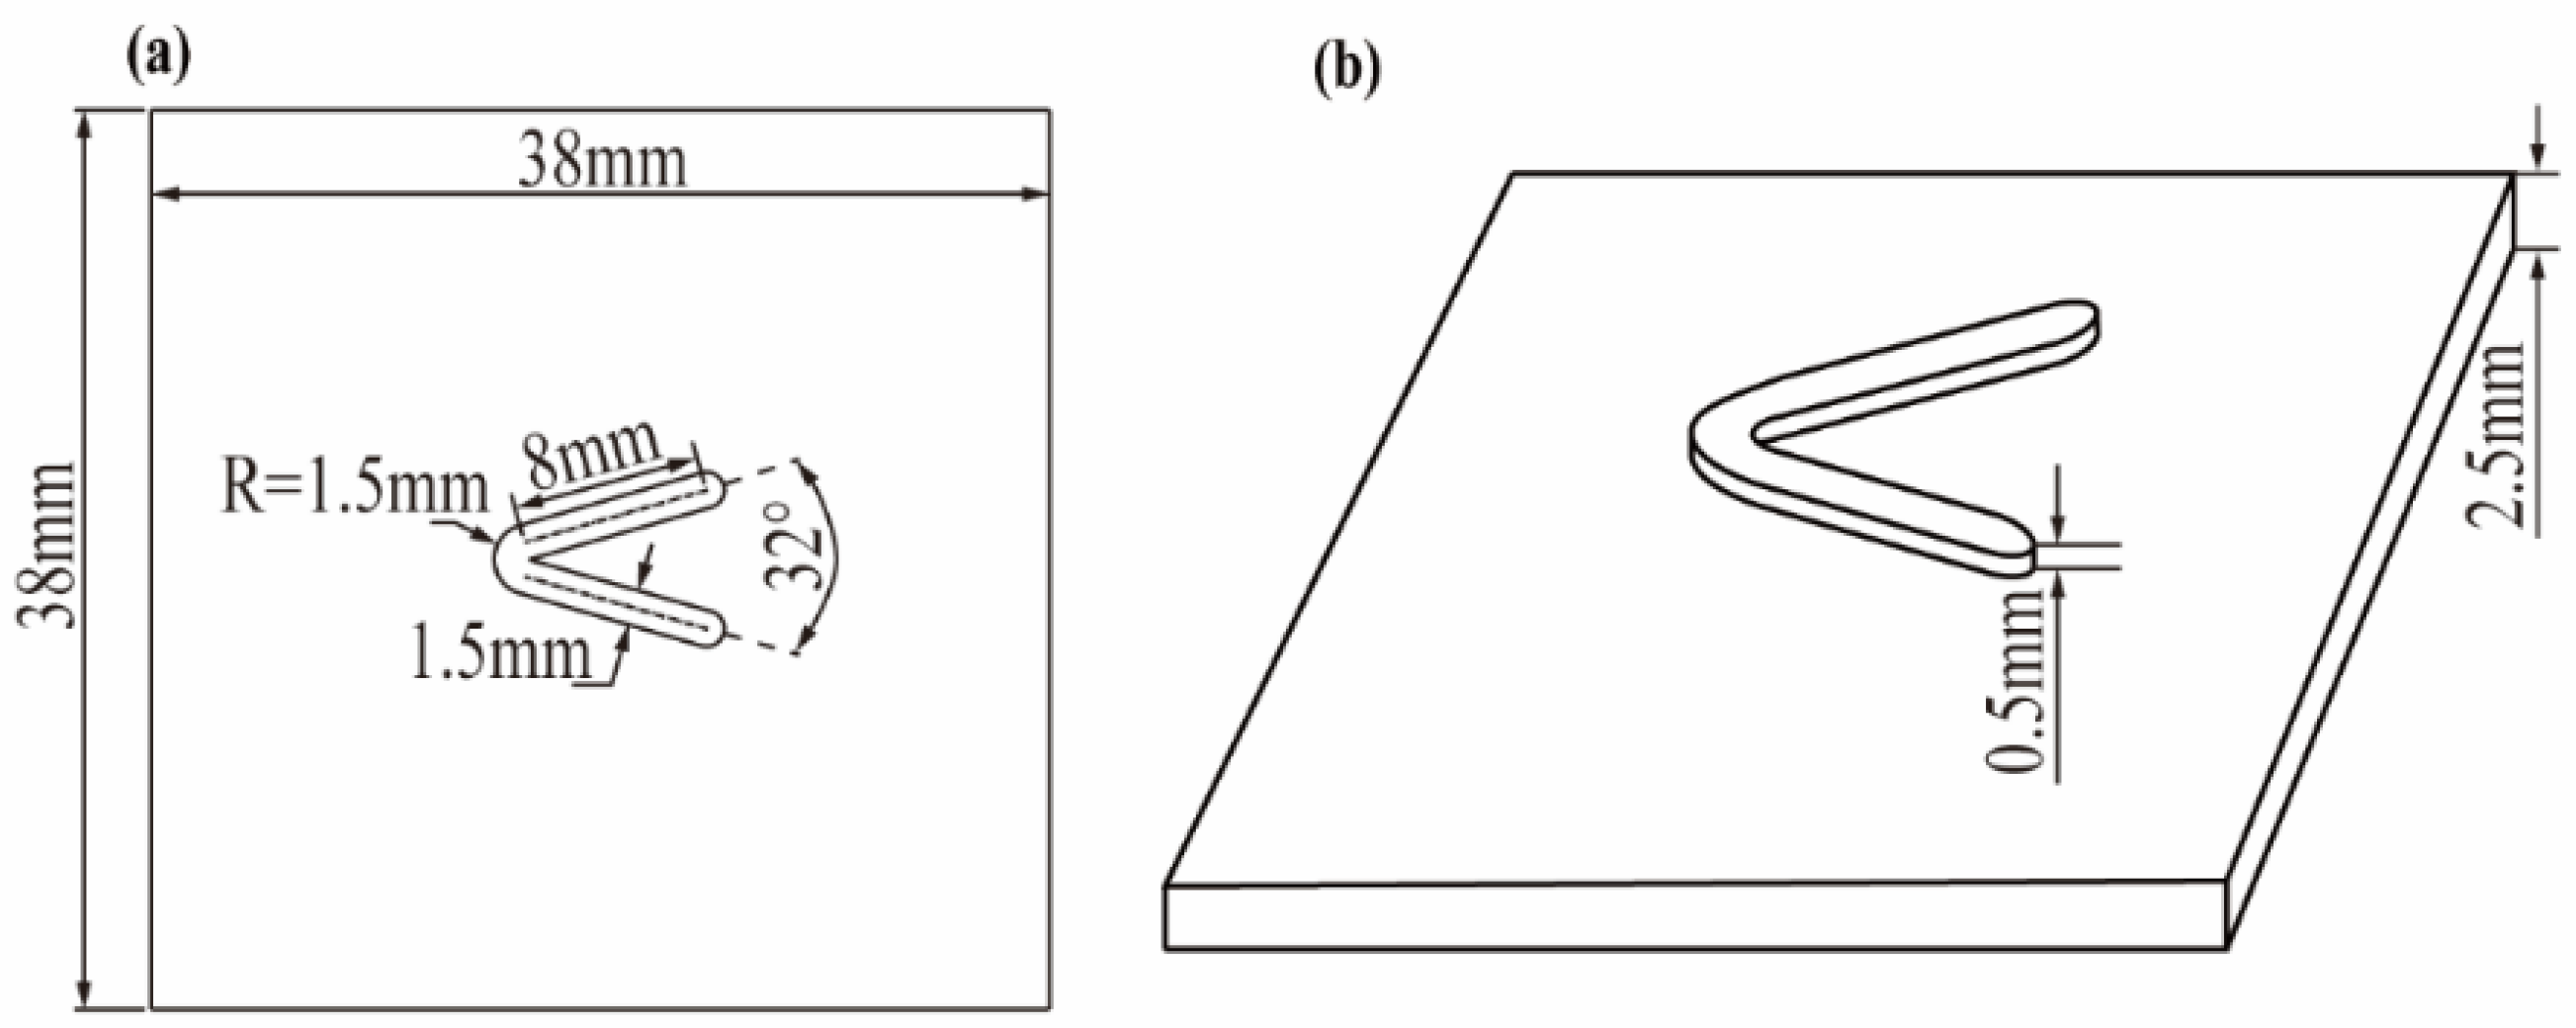
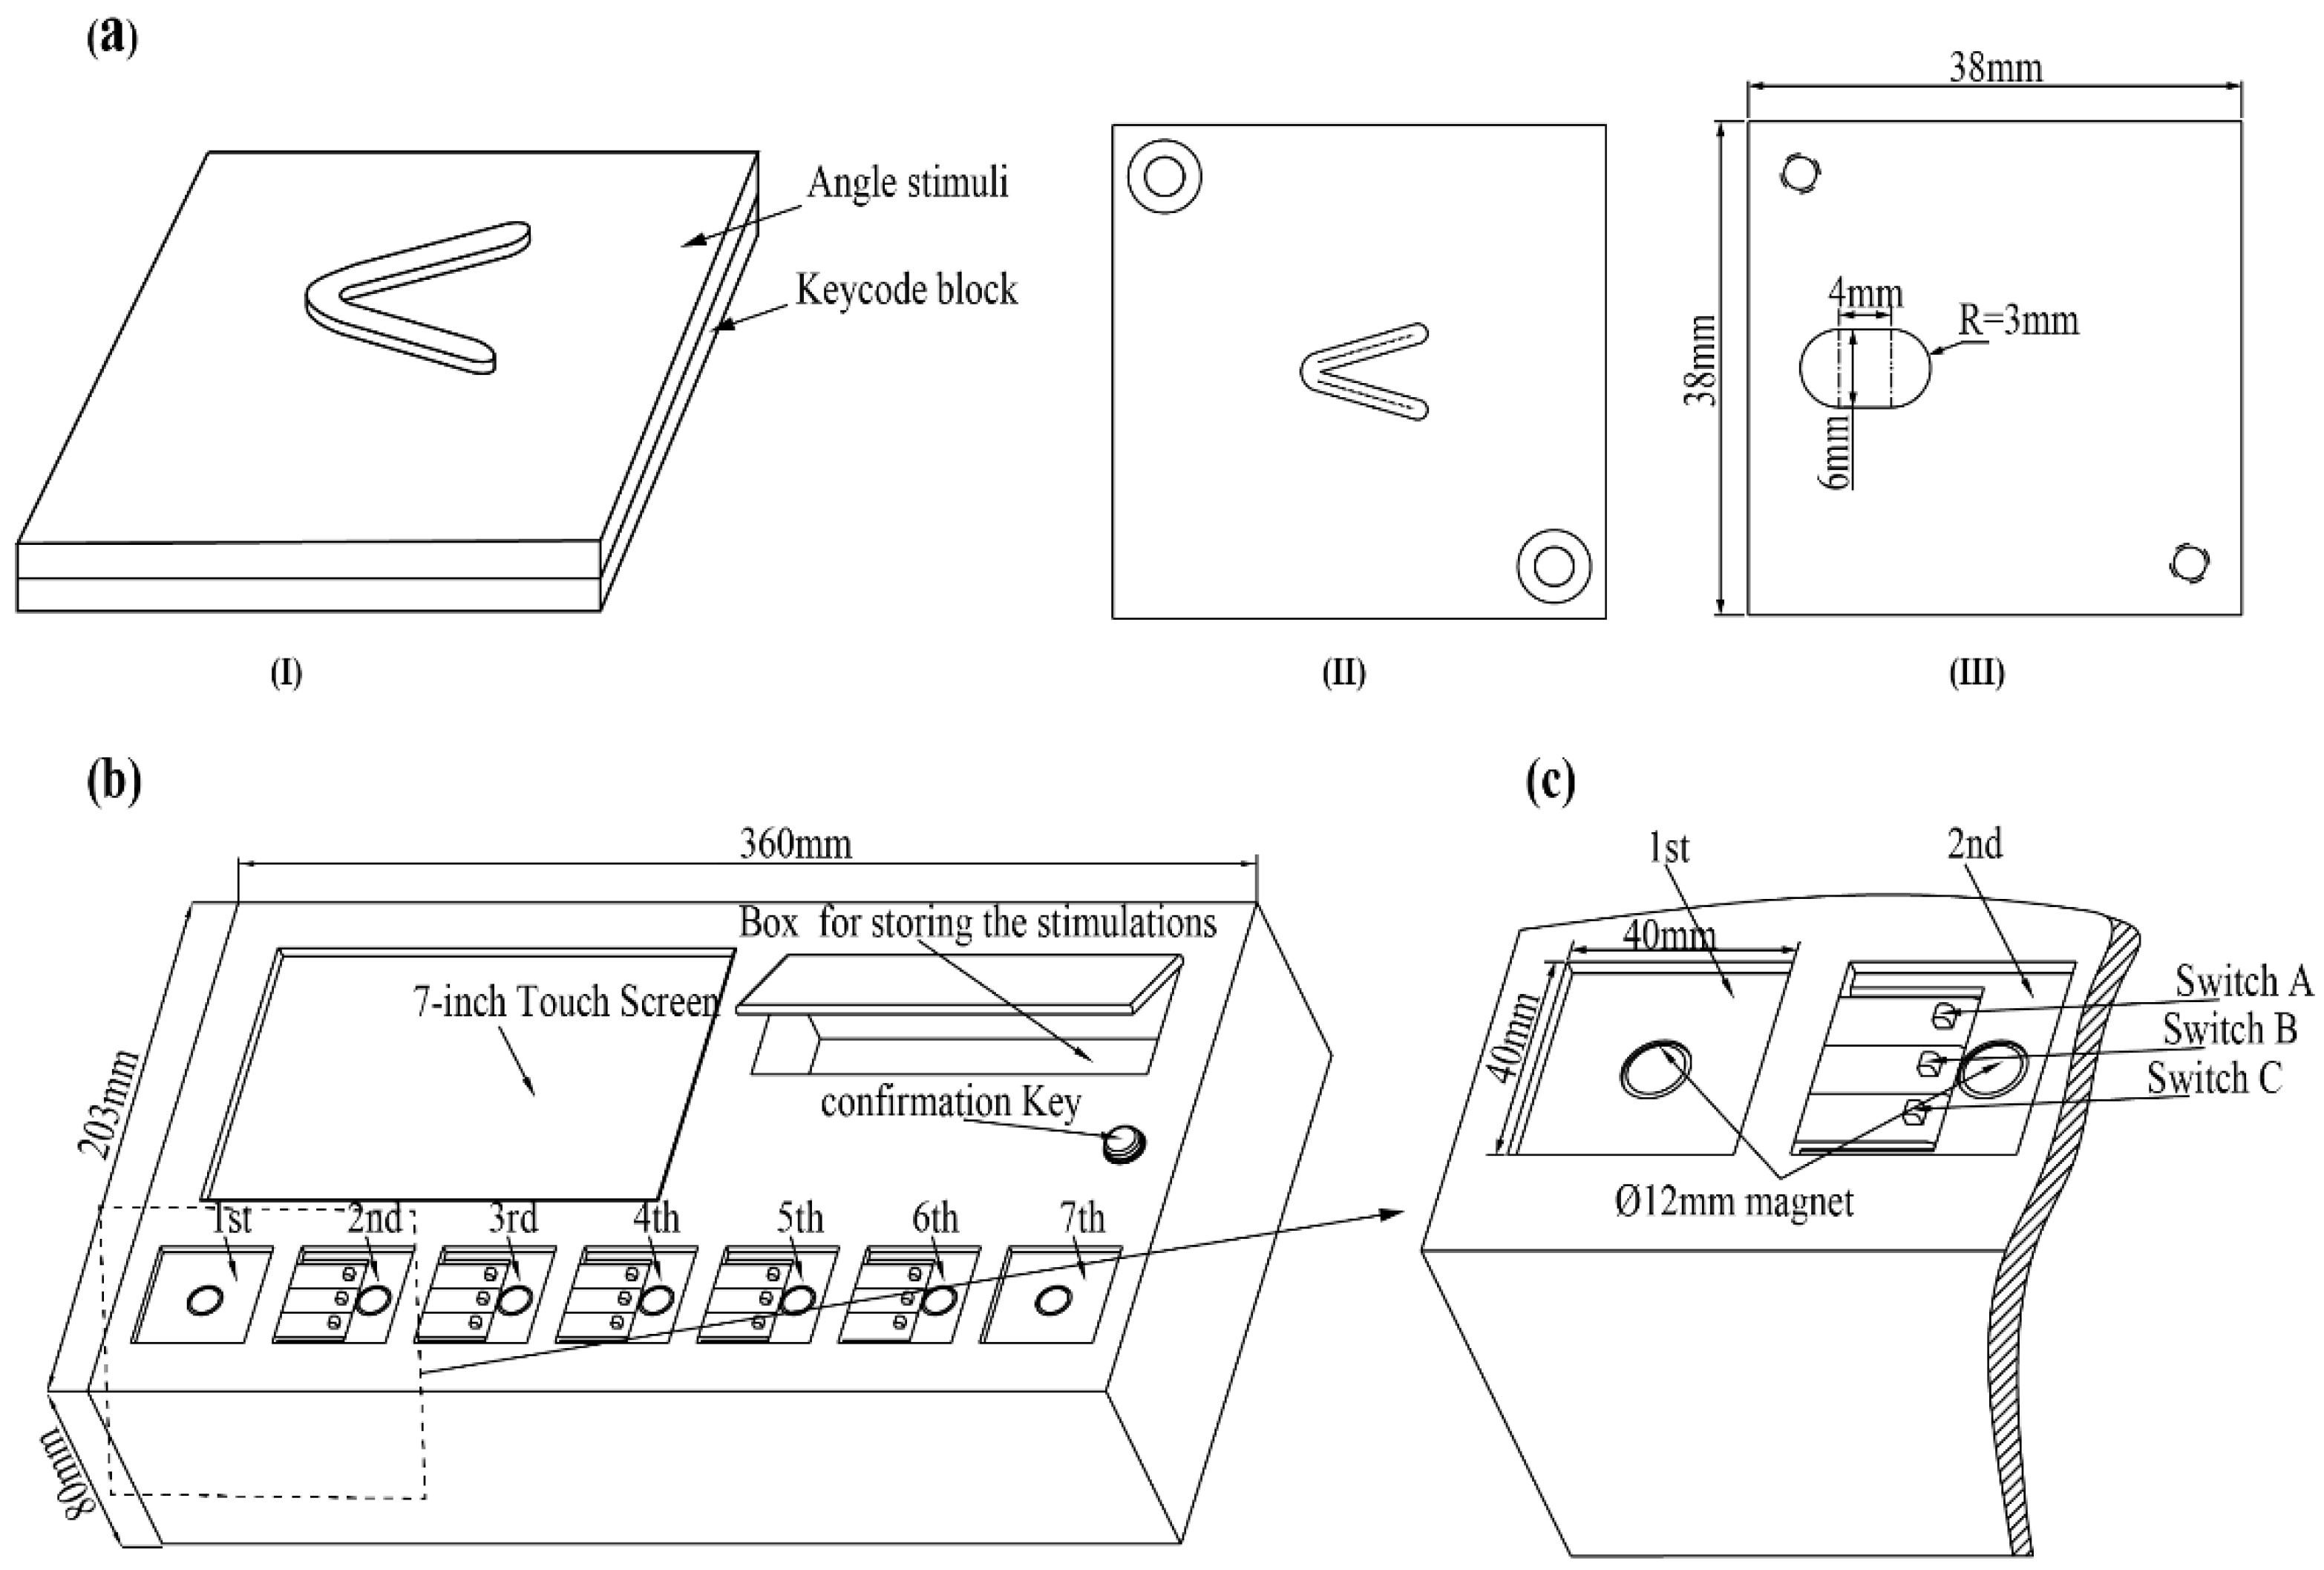
3.1. Haptic Pattern

In some previous studies, stimuli of two-dimensional (2-D) raised-line drawings were used to explore the touch perception process [24,25,26,27]. The accuracy of 2-D raised-line drawings is amenable to control when being designed, and the drawings can remove the information of real objects [28]. Therefore, we designed a 2-D raised-angle stimulus [13,19] for the sorting test, where the angle difference of the 2-D raised-angle is 2°, as shown in Figure 5.

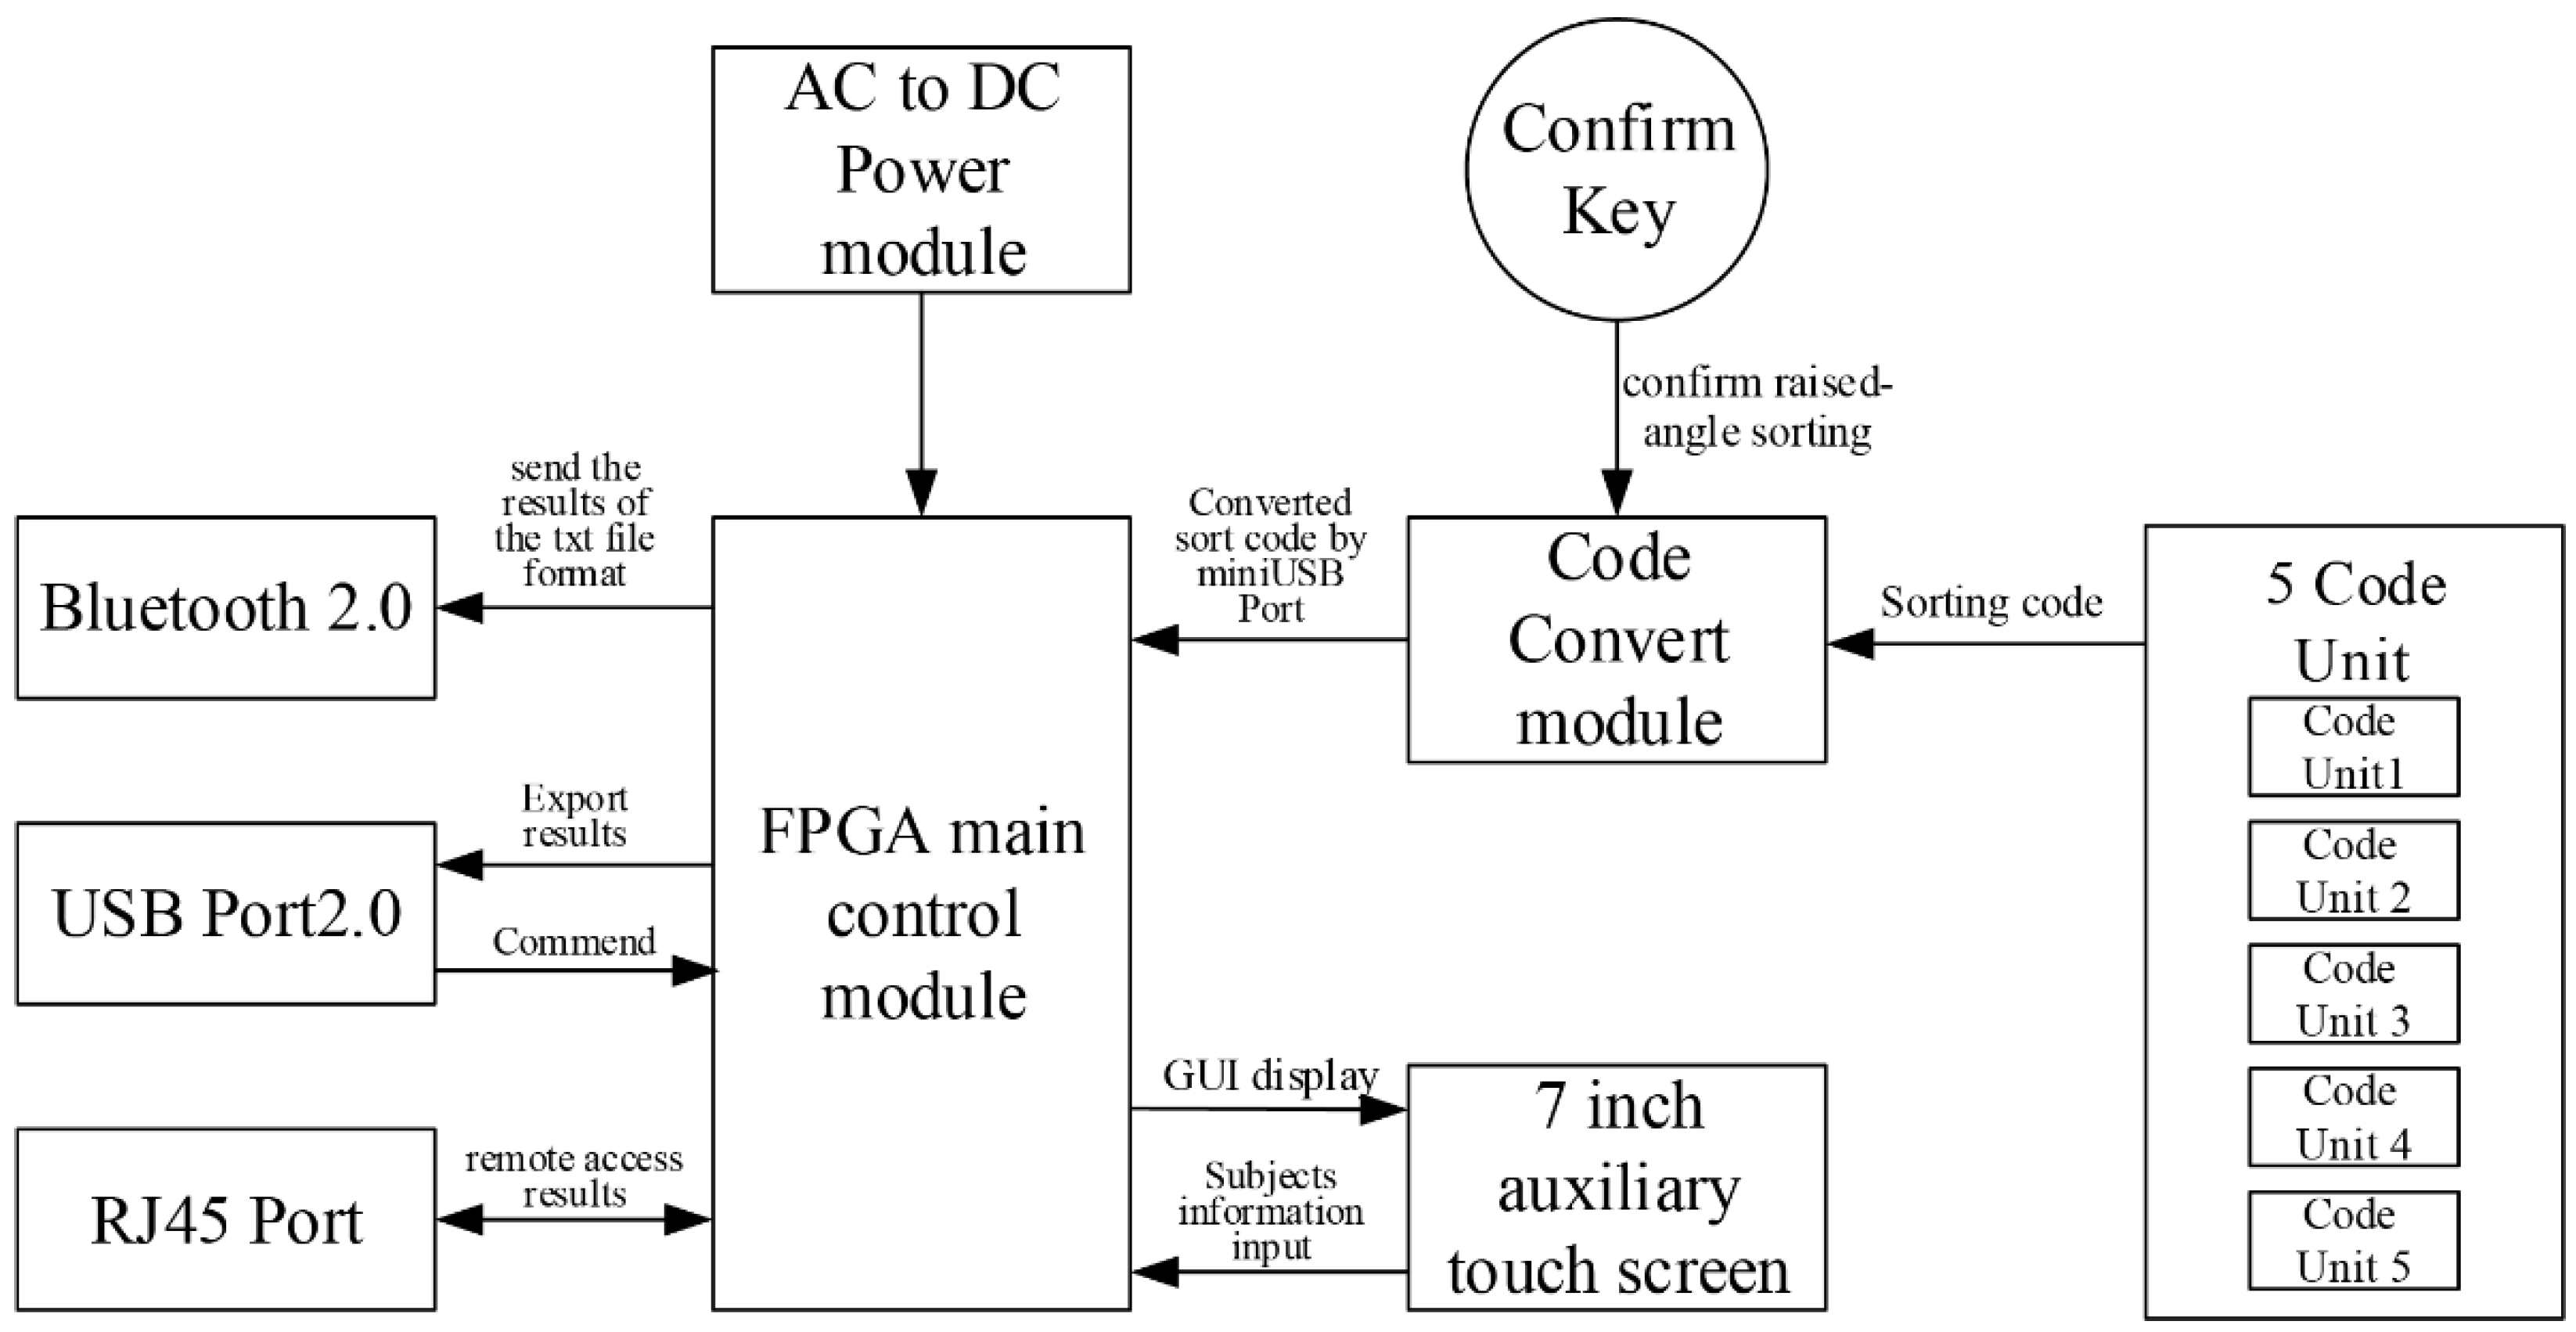
3.2. Design of the Haptic Angle Sorting Device

Figure 6 shows a schematic diagram of the structure of the haptic angle sorting system. The system includes four parts: (1) an interaction part, (2) an angle stimulus detection part, (3) a system control part, and (4) a power supply and data output part. The interactive part consists of a touch screen, which is used by the experimenter for experiments and data manipulation, and five code unit positions where the participants sort the angle stimuli. The angle stimulus detection part is a keycode conversion module (STC89C51, STC Microcontroller Inc., Beijing, China) that can identify five different keycodes of angles of stimuli simultaneously and send the angle stimulus sorting information to the system software control part. The system control part is a field programmable gate array (FPGA) main control module (ZYNQ 7010, Xilinx Inc., San Jose, CA, USA) of the microcomputer. And the reason why FPGA is chosen as the main control is that the functions of this module can be configured according to requirements, and its many interfaces also provide the possibility for later function expansion, including running system software and controlling touch screen. In addition to experimental data calculation, storage and transmission through multiple interfaces.
Figure 7b shows the appearance and structure model diagram of the designed haptic angle sorting device, and all operating parts (except the power button), during the experiment: (1) The 7-inch touch screen is used to input the information of the participants and display the results after the test; (2) a square of seven grooves (40 mm × 40 mm) was placed on the top part of the device; (3) confirmation key; and (4) a box embedded in the device is designed to store angular stimuli to prevent loss during carrying.
Three microswitches are arranged in a group in each position from the grooves of the second to sixth positions to identify each angle stimulus, as shown in Figure 7c. These three microswitches constitute a code unit which is one of the five code units, as shown in Figure 6. In the sorting experiment, the keycodes are triggered by the base of the iron block adsorbed by a magnet, which is combined with an angle stimulus to form a stimulus module. The haptic angle sorting test system must identify five sets of keys to confirm the sequence of angle stimuli in the experiment, as shown in Figure 7b. Each microswitch is connected to an I/O port for processing and transmission efficiency. The haptic angle sorting test system must identify five sets of keys to confirm the sequence of angle stimuli in the angle sort. When each microswitch is connected to an I/O port of the 51 microcontroller unit (MCU) chip, the triggered microswitches can realize high and low levels of the chip at each I/O port so that the MCU can identify the digital signal of the I/O port as 1 or 0. To transform different angle stimulus information into digital code, the three microswitches in the groove will stimulate the trigger switch according to different angles, so the three switches closing or opening combination mode can be converted into three-bit binary, the sole digital signals. The recognition method of angle stimuli is not affected by the environment, and it can quickly and accurately identify different angle stimuli. There are five keycodes (000, 001, 011, 100, 110), corresponding to the value of each angle stimulus and the output binary data value. To obtain those input keycodes, five types of stimulus block bases were designed, as shown in Figure 8a. Among them, the base key codes of the four stimulation blocks (001 and 100, 011 and 110) are symmetrical. Therefore, the same stimulus block base was rotated 180° for installation, which reduced the processing cost of the equipment. When placing the angle stimulation module, which is composed of the angle stimulation and iron base block, the stimulus module at each position is attracted by a 12-mm-diameter magnet and triggers the microswitch in the groove.

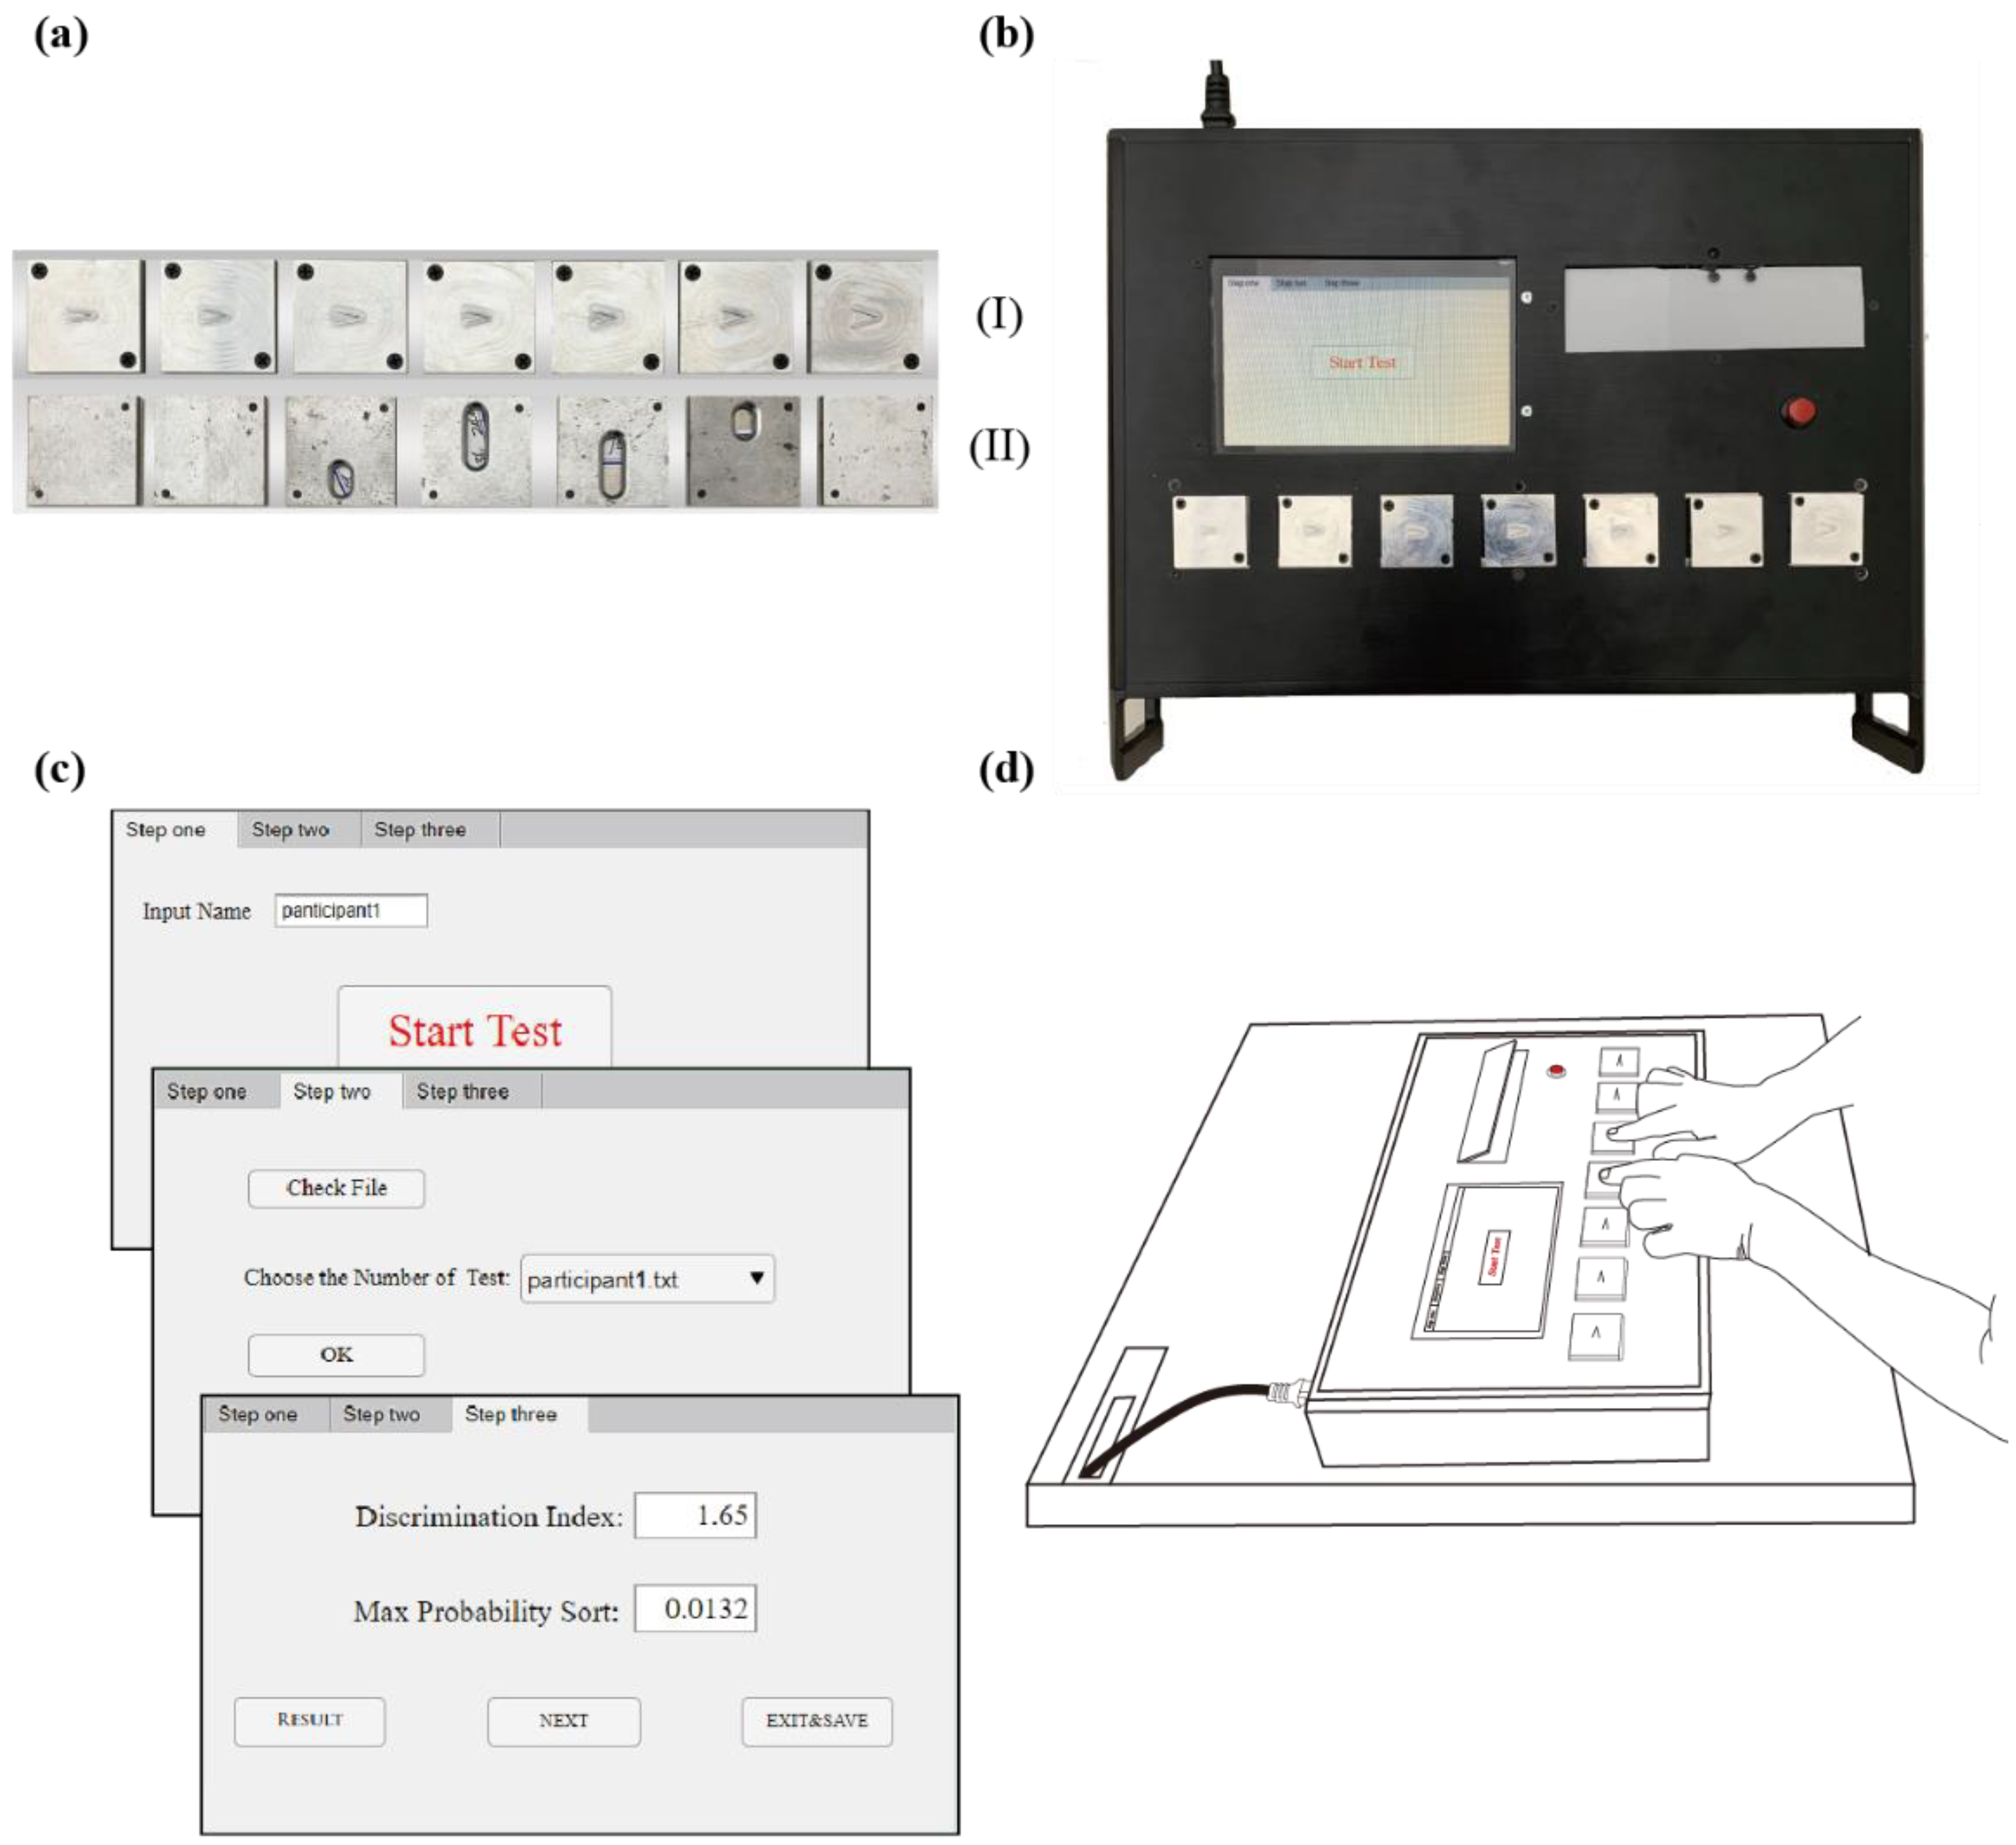
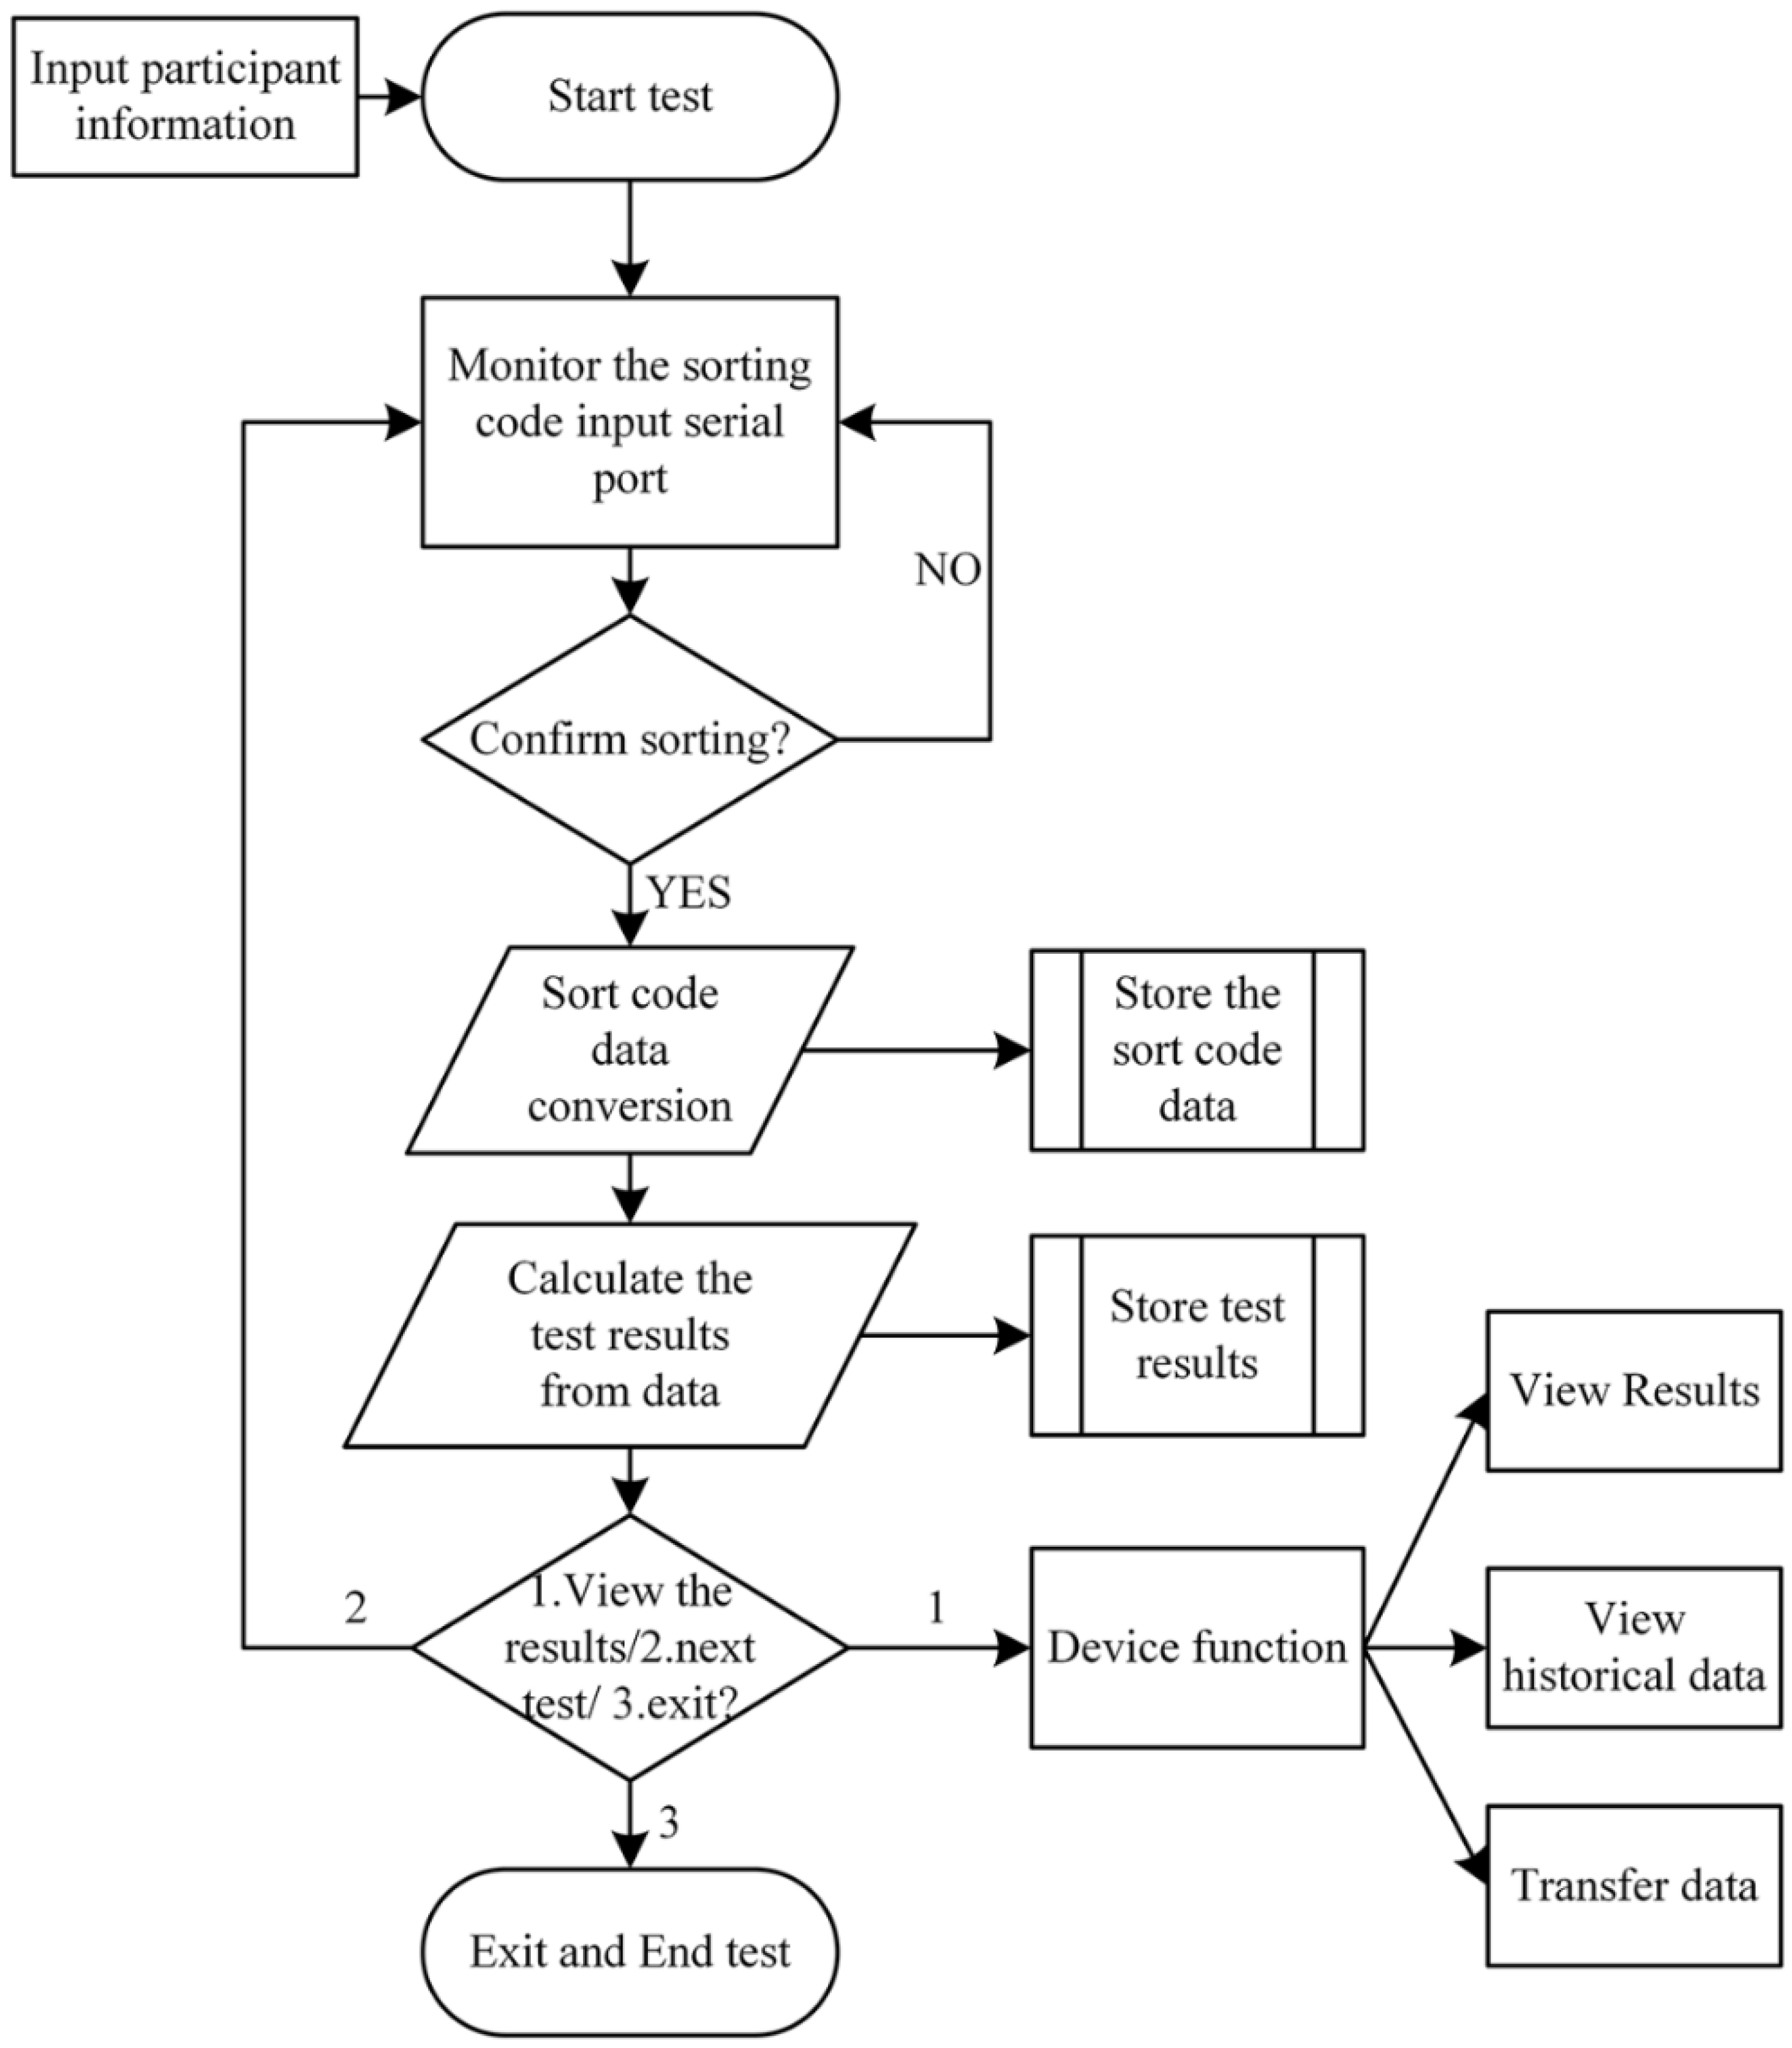
3.3. System Software

The design of the software was based on hardware considerations using MATLAB (The MathWorks, Inc., Natick, MA, USA) App Designer platform. At the same time, to simplify the data processing process, we also added the evaluation algorithm of the angle sorting paradigm in Section 2 into the software. At the end of the experiment, participants were able to obtain the assessment results from the software immediately. The touch screen is very convenient and user-friendly. According to the angle sorting paradigm, the flowchart of the software is shown in Figure 9. The operation of the software is mainly designed to operate in three steps according to the experimental process, as shown in Figure 8c.

3.4. System Implementation

Figure 8 is the implementation of the system. Haptic patterns have seven angle stimulations, including 20°, 22°, 24°, 26°, 28°, 30° and 32°. These angle stimulations prevent wear and reduce accuracy. The device is made of aluminum alloy, and the machining accuracy is ±0.01 mm. The back of the haptic pattern is a keycode block, and the angle stimuli are bolted together. Each haptic pattern that needs to be sorted by participants is different, in which the patterns are angle stimuli other than the maximum and minimum position fixed, as shown in Figure 8a. Figure 8b is the final device. Figure 8c shows the operation interface of the software in the experiment.

4. System Evaluation

We performed two experiments to compare the paradigms of angle sorting and 2AFC. The participants’ two thresholds were calculated for touch shape discriminability detection. Meanwhile, the practicability of the system was verified.

4.1. Participants

Ten healthy right-handed volunteers (five males and five females), ranging in age from 25–35 years with a mean age of 29.5 years, consented to participate in this experiment. Handedness was confirmed by the Edinburgh Handedness Inventory. The research was approved by the Institutional Research Review Board at Okayama University, and all participants signed informed-consent forms. No participants had prior experience with haptic angle sorting devices.

4.2. Methods

In the two-angle discrimination experiment, one standard angle (SA) and six comparison angles (CAs) are selected. The apex of all angles was always pointing to the right. We used the angle stimuli presentation instrument where two angles are clamped horizontally on the electric slide [29]. All participants were blindfolded and seated at a table. The participant’s right hand was fixed with tape to an immobile plate with only the right index finger making contact with the angle stimuli, as shown in Figure 10a. The motion of the electric slide was controlled by a computer and was limited to a maximum range of 200.0 mm. The accuracy of the distance is 0.01 mm, and the movement speed is 0.01 to 100.0 mm/s, both of which were controlled by the computer code.
During the experiment, the experimenter clamped the SA and one of the six CAs on the instrument before each trial. Then, these angles were moved under the participant’s right index finger so that the participant could perceive the size of the angle through the imaginary bisector. In addition, all angles moved from the endpoints toward the apex. After the pair of angles were scanned on the finger of the participant, one trial was completed. The participant was asked to use two digital buttons (NumPad 1 indicates the first touch is larger and NumPad 3 means another is larger) to provide feedback on the larger angle of the pair of angles (two-alternative forced-choice, 2AFC). A pseudorandom order was used to present the SA and CA to the participant. A trial of the paradigm is shown in Figure 10a. In this paradigm, we used the two-angle discrimination method from previous studies to measure the angle DT for the participants. Seven different angles (20°, 22°, 24°, 26°, 28°, 30° and 32°) were used in the comparison discrimination of the two angles [12,18,26,27]. In the experiment, one of seven angles was used as the standard angle (SA), and the other six angles were used as the CAs. Ten trials per SA were performed using the paradigm of 2AFC, and one SA and the same CAs were presented in a pseudorandom order. This experiment consisted of 420 trials, and the participants had a break for at least 5 min after each series of 105 trials. The trial duration, including the time to present the angle and the participant’s response time, was 160 to 180 min.
In the angle sorting experiment, the haptic angle sorting device was horizontally placed on the table directly in front of the participant, who was asked the paradigm of the sort angle, as described in Section 2.1. Angle stimulation was the same at seven angles as in the two-angle discrimination test. The angle sorting experiment was repeated 10 times for each participant. The participants were given a 5 min break after five sorting tests. The sorting time for each participant was 3 to 4 min, and the 10 sorting test durations were 35 to 40 min.

4.3. Data Processing and Analysis

During the two-angle discrimination experiment, the data were automatically recorded, including the values of all angles that the participants selected and the order in which they were presented, and were used to calculate the angle discrimination threshold (SA) of the participant. The accuracy θ for each SA was computed for each participant in each trial. The accuracy data were applied to the logistic function (adapted from [13,19,30,31,32,33]). The DT is defined as the angle difference at an accuracy rate of 75%. Every DT was calculated for each participant using different SAs in this method. The DTs were computed from the logistic function ( X = 75% accuracy), Figure 10b. Each participant gets a DT when using each SA, and seven SAs correspond to seven DTs.
The difference in the DT of all participants in six SAs of the two-angle threshold discrimination experiment was analyzed by repeated-measures analysis of variance (ANOVA). The level of significance was fixed at p < 0.01 for all analyses. Then, we averaged the DTs of the same participant under the different SAs, as shown in Figure 11.
In the angle sorting experiment, the haptic angle sorting device automatically calculates the result of each trial sort according to the evaluation method of the paradigm, the result of which includes the maximum probability of the sort P ( σ , A S n ) and σ . There was no invalid σ in the angle sort experiment results of all participants in each trial. Each trial sort for each participant results obtained the P ( σ , A S n ) and σ , and 10 DTs were obtained for each participant after 10 trials of angle sorting. We also averaged the DTs of the same participant, and then we obtained the estimated discrimination threshold through Equation (4) and D T = 0.675 σ , as shown in Figure 11.

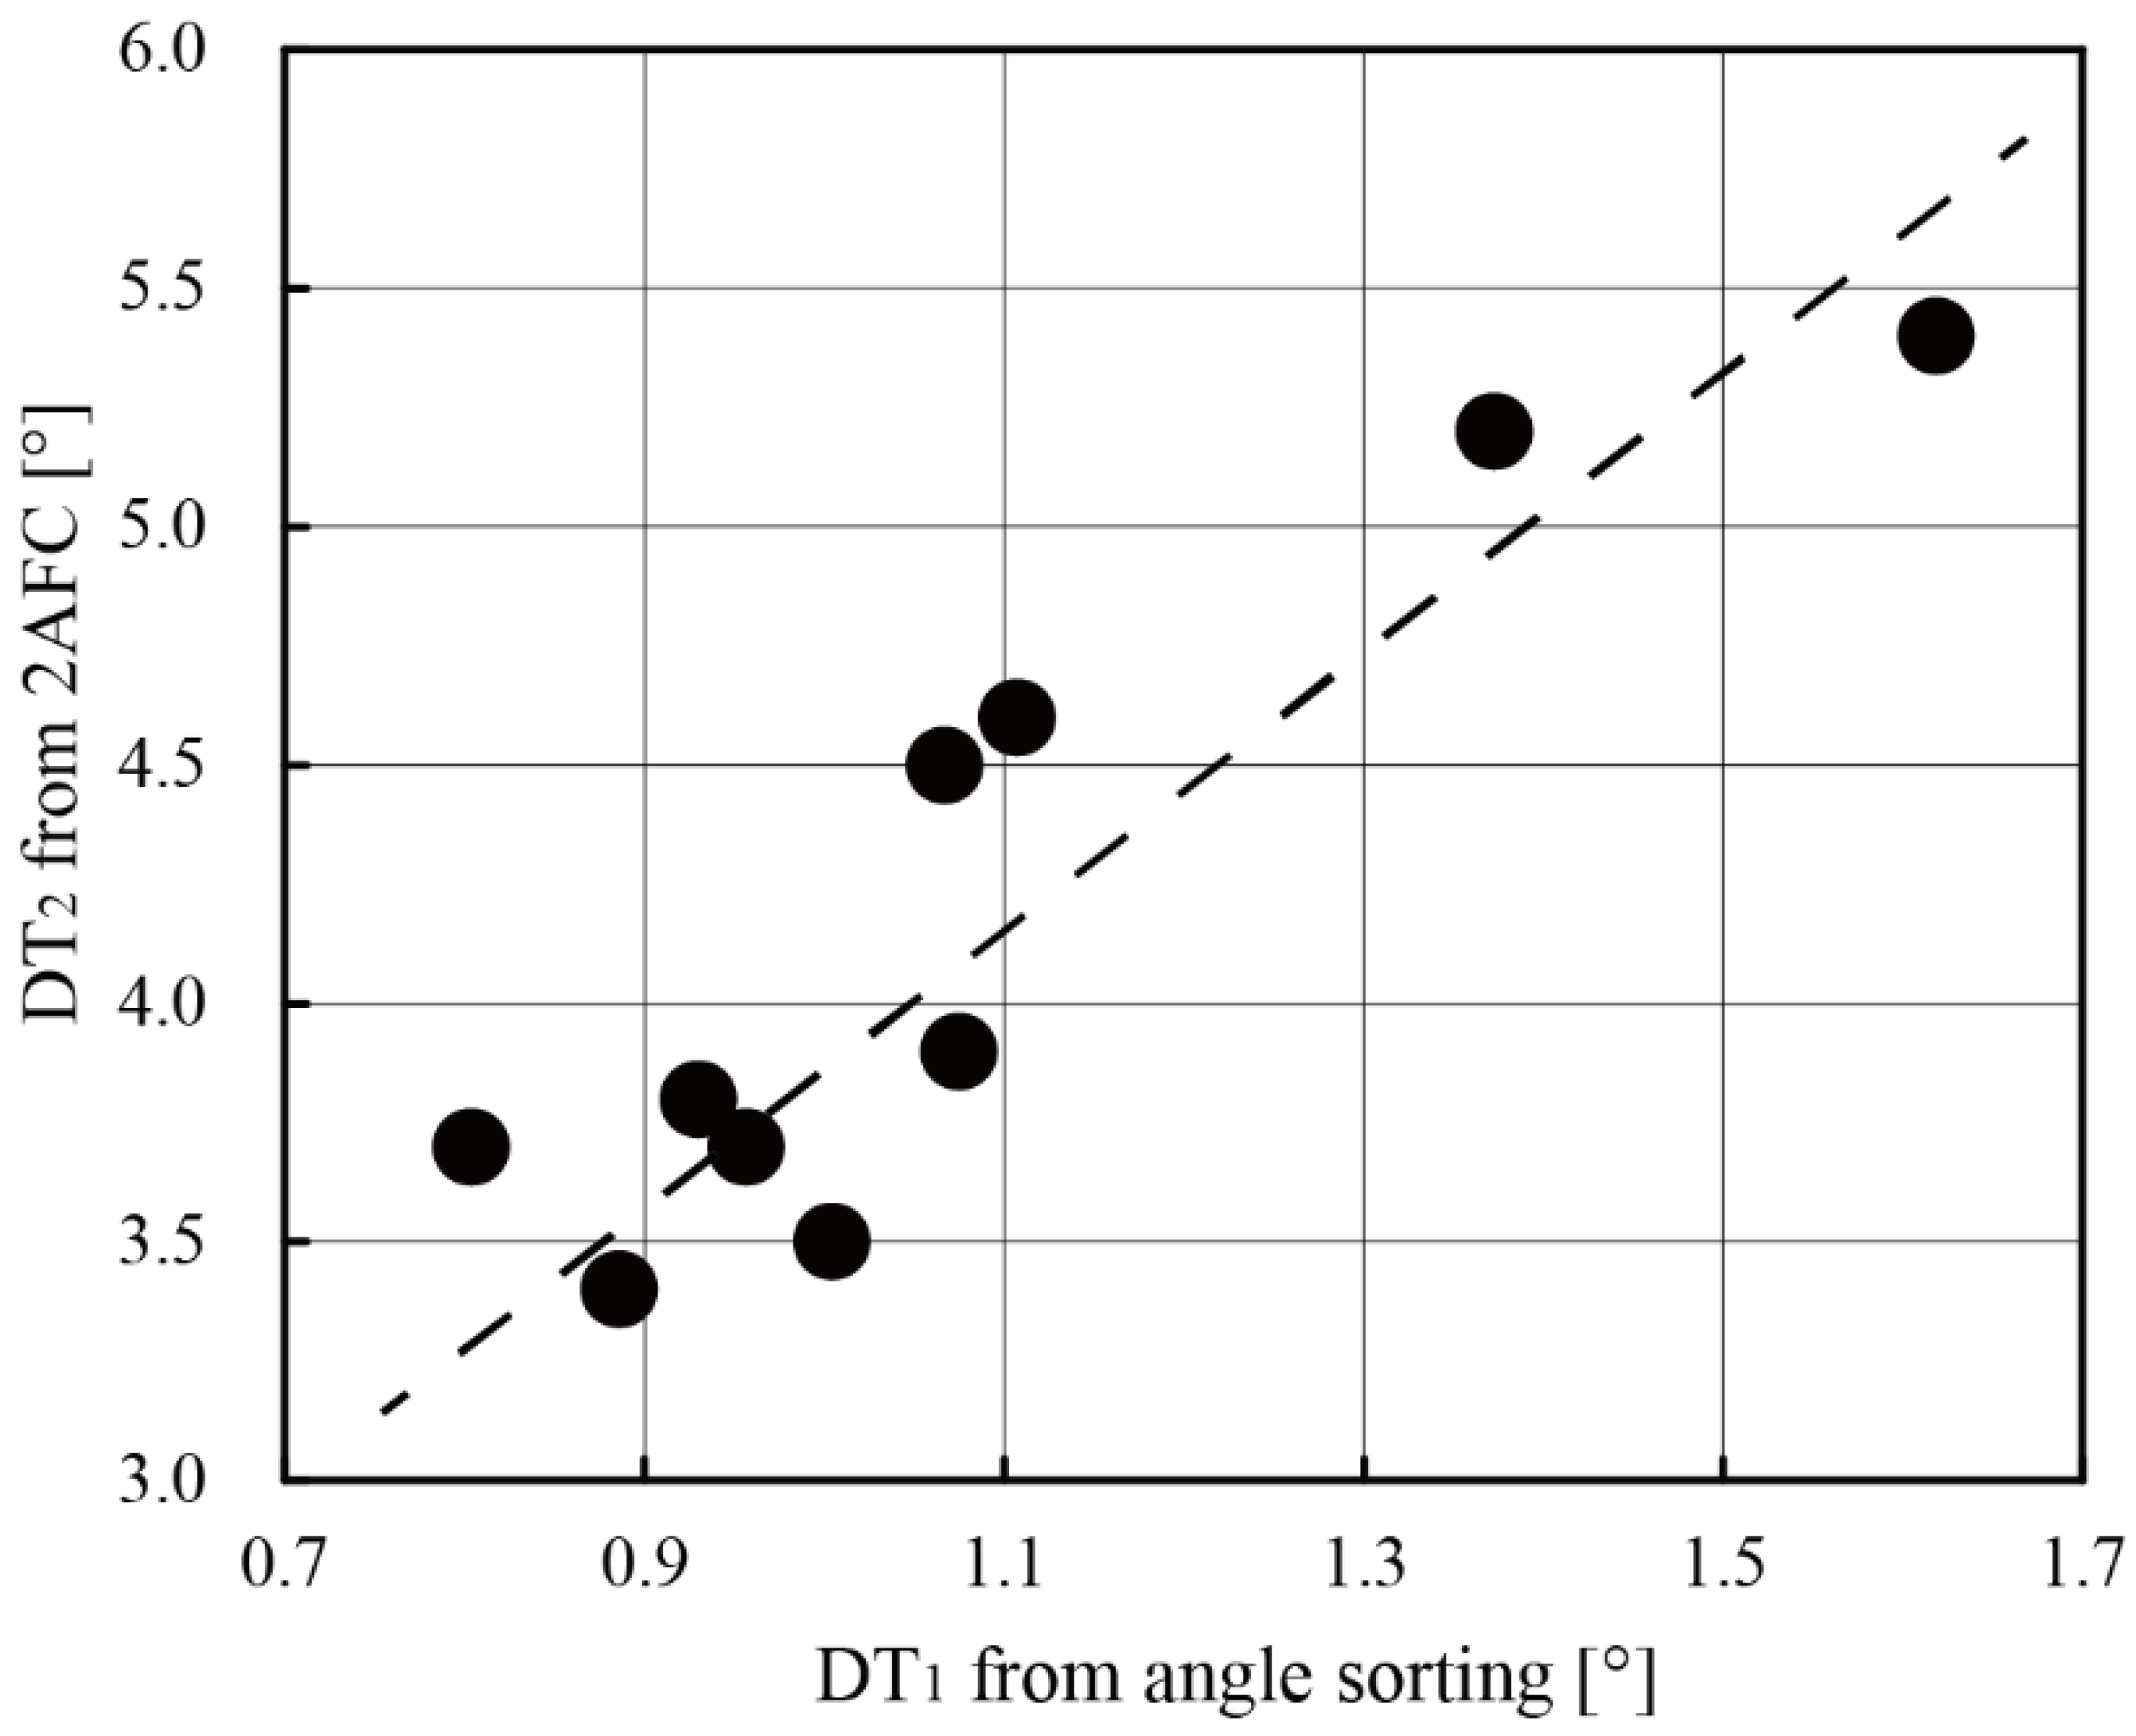
4.4. Results and Discussion

The results of 2AFC indicated that the participant’s ability to discriminate angular size varied by 3.4 to 5.4 when the size of the standard angle varied from 20° to 32°, and the results of the angle sorting varied from 1.61 to 2.75, as shown in Figure 11. We calculated the correlation coefficient between D T 1 from angle sorting and D T 2 from 2AFC and found that the correlation coefficient was R ( D T 1 ,   D T 2 ) = 0.9075 , p = 0.0003 . According to the Pearson correlation coefficient principle, there is a strong correlation, and the p value indicates the significance of the result. The correlation analysis results showed that the angle sorting method can also be used to evaluate the angle discrimination threshold. At the same time, we also made a detailed comparison of the two methods, as shown in Table 2.
The difference between the two DTs is due to the different effects of the 2-D pattern discrimination by active and passive touch. Almost all previous studies have shown that the shape discrimination of active touch sensation of participants’ voluntary movement was better because of the active kinesthetic feedback involved. Our previous studies found that in the case of active kinesthetic feedback, the discrimination threshold reached 84% of the correct answer threshold, while that of passive touch was 75%, but there was a conversion factor of approximately 1.48 between the two groups [19,34]. This conversion factor also applies here; that is, the value corresponding to the accuracy of 75% in the logical function relates to the standard deviation of the estimated normal distribution, which is 0.675 σ . The discriminability of the participants may perform better in the angle sorting than in the pairwise comparison of 2AFC.
In addition, the angle sorting evaluation relates to, but extends beyond, the threshold calculated using 2AFC. The threshold measured by the same participant also changed when the SA changed; that is, the threshold also increased when the SA (SA < 90°) increased [19]. Different SAs will make the results of the DT not unique. However, in the σ of D T 1 = 0.675 σ and the maximum probability of angle sort, P ( σ ,   S A n ) = f ( σ ) is the optimal solution obtained from this model. When the angle difference is appropriate, angle sorting of the participant corresponds only to a unique D T 1 .
This strong correlation may be because the psychological cognitive process is equivalent to the two paradigms. Although each comparison in haptic sorting is not completely independent of the comparison in 2AFC, the two paradigms are identical in touch shape cognition. During the paradigms, they both involved not only the four mechanoreceptive and afferent nerves for shape discrimination [36] but also working memory for contributing to the performance of somatosensory discrimination [6,10,37]. These properties reflect the individual’s cognitive ability, especially haptic working memory, which probably involves functional interactions with many brain regions, including the parietal operculum [37], the left anterior prefrontal cortex [38,39], the parieto-occipital cortex, the posterior parietal regions, the left ventral premotor cortex and the anterior medial frontal gyrus [40,41,42,43].

5. Comparative Evaluation between Young and Old Groups

To further verify the stability and practicability of the angle sorting paradigm, we recruited participants of different ages (young vs. old) in the present experiment. We expect the differences between young and old to be reflected in the angle sorting task.

5.1. Participants

Fifty-one healthy volunteers, including 30 Okayama University students (26 males and four females, ranging in age from 20–23 years with a mean age of 21.7 years, two males were left-handed and the rest were right-hand) and 21 elderly retirees (six males and 15 females, ranging in age from 64–88 years with a mean age of 72.9 years, four females were left-handed and the rest were right-hand), consented to participate in the angle sorting test. Handedness was confirmed by the Edinburgh Handedness Inventory. The research was approved by the Institutional Research Review Board at Okayama University, and all participants signed informed consent forms. No participants had prior experience with haptic angle sorting devices.

5.2. Methods

The haptic angle sorting device was placed horizontally on the table directly in front of the participant, who was asked the paradigm of the sorting angle, as described in Section 2.1. The same angle stimulus was selected for a 2° angle difference (20°, 22°, 24°, 26°, 28°, 30° and 32°, among these, 20° and 32° were the reference angles.). The angle sorting experiment was repeated three times for each participant. The angle sorting time for each participant was 12 to 15 min.

5.3. Data Processing and Analysis

The haptic angle sorting device automatically calculates the result of each trial sorting according to the evaluation method in Section 2.2, the result of which includes the maximum probability of the sorting P ( σ , A S n ) , and σ . There was also no invalid σ for all participants in each sorting. After angle sorting three times, we averaged the DTs of the same participant, and then we obtained the estimated discrimination threshold through Equation (4) and D T = 0.675 σ . An independent samples T-Test was used to determine whether there were any statistically significant differences in the discrimination thresholds between the two groups. T-Test analyses were performed using SPSS version 26.0.

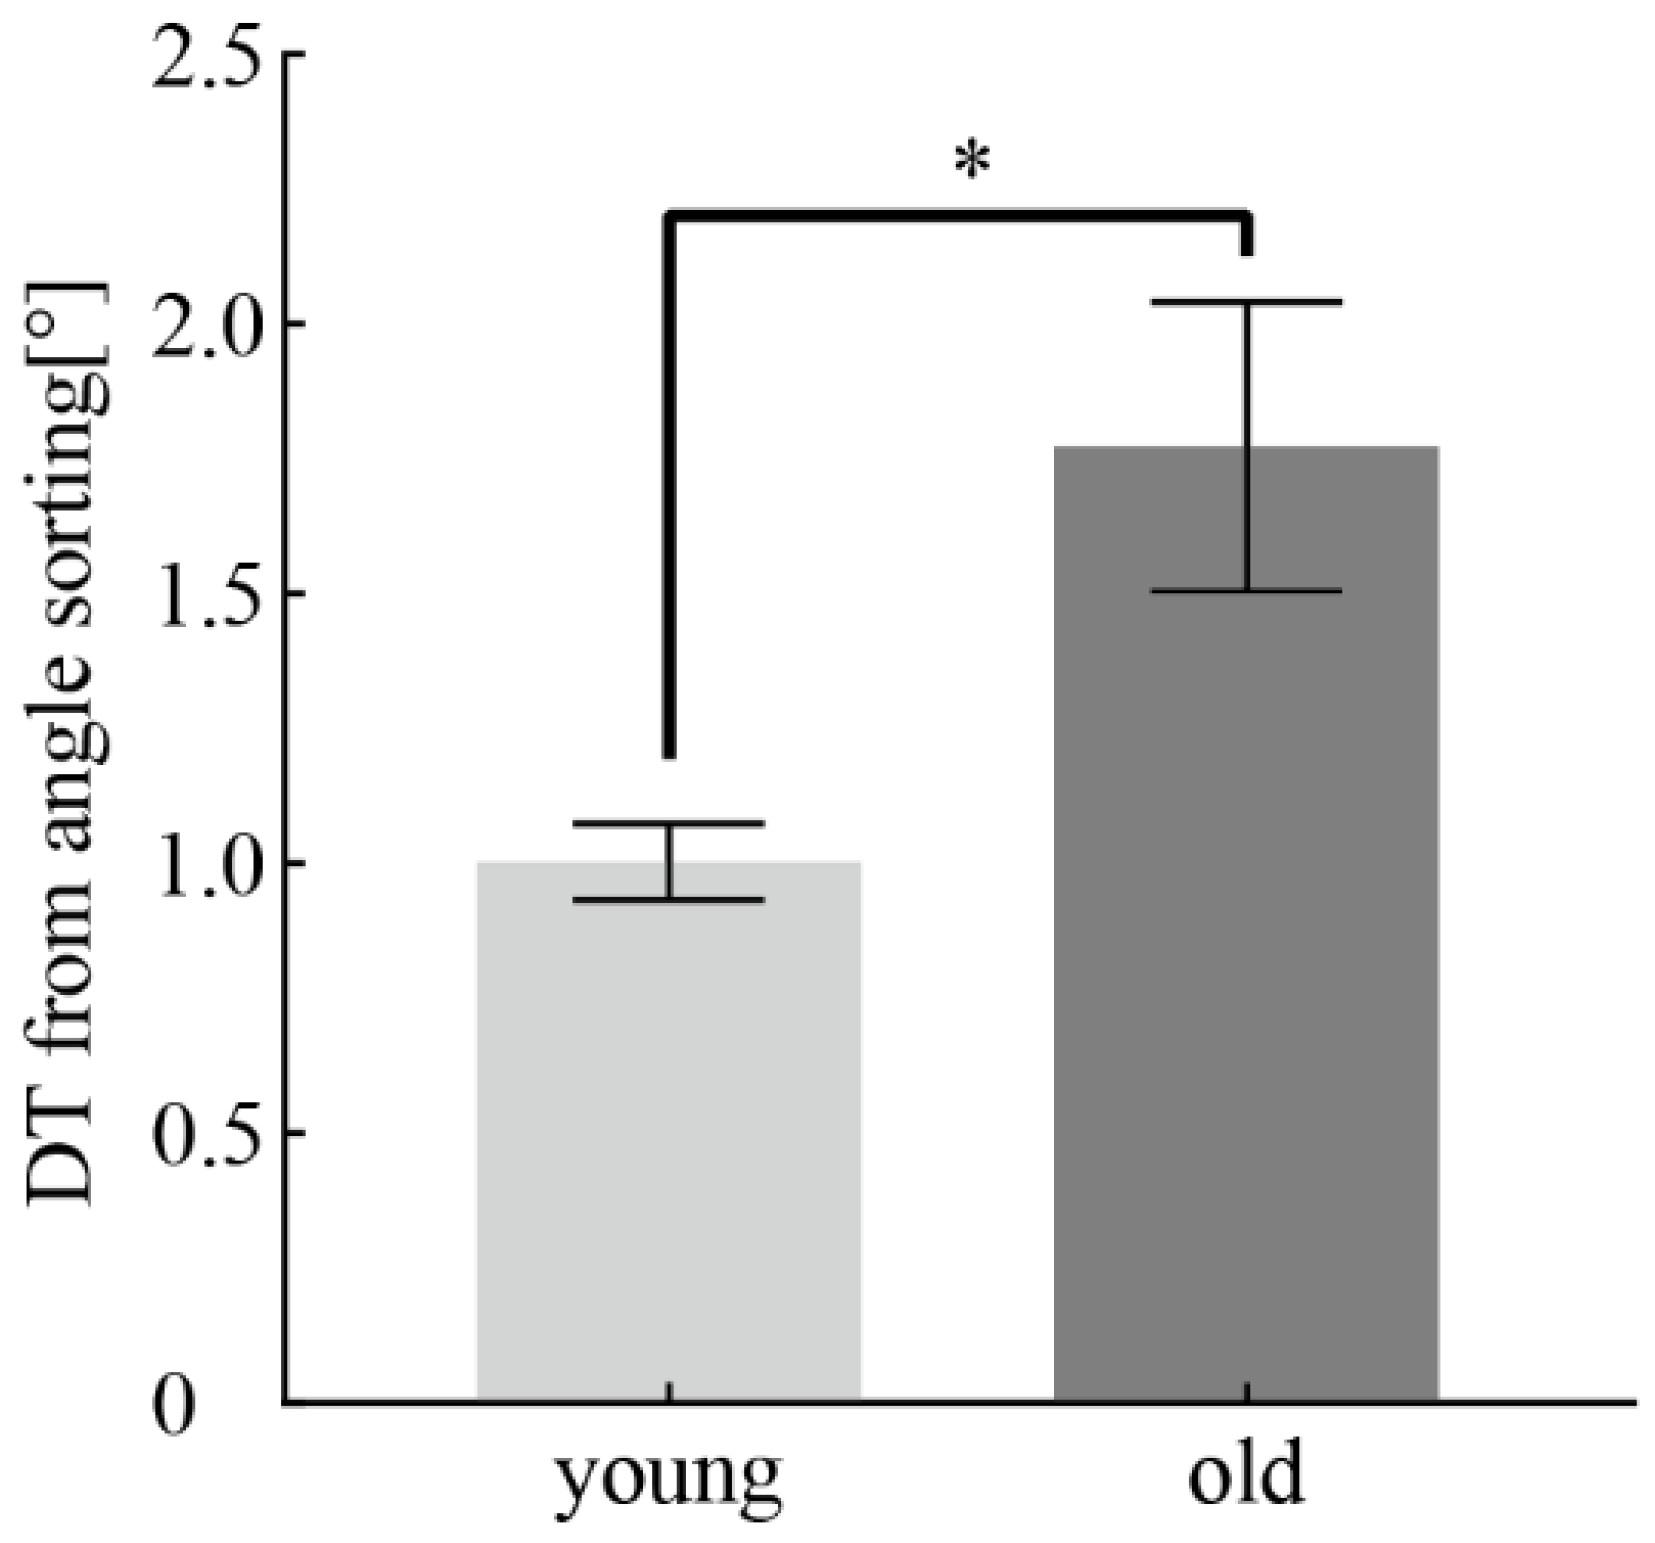
5.4. Results and Discussion

The experimental results show that young and old groups have significant differences in the performance of angle sorting tasks, as shown in Figure 12. Moreover, compared with the younger group, the performance of the elderly group has experienced a significant decline [ t 22.79 = 2.784 , p = 0.011 , Cohen’s d = 1.166 ], which is consistent with previous research showing that the ability to discern the angle decreases with age [44,45].
It is well known and confirmed that since cognitive ability declines with age, the angle discrimination ability of elderly subjects is significantly weaker than that of younger participants [46,47,48]. The results of the experiment are the same as our expectations, which were to see significant differences in the performance of the angle sorting task between participants of different ages. Similar to the previous study, the discrimination threshold of angle sorting of the elderly was also significantly lower than that of the young. This result strongly supports our aim for this device that we want to use for cognitive diagnosis and the like. At the same time, it also proves the convenience and stability that relatively stable results can be obtained in a short time.

6. Conclusions

In this work, we have presented a new method for haptic angle discrimination. The method includes an efficient angle sorting paradigm and an effective angle sorting system. The angle sorting paradigm has high efficiency for testing haptic shape discrimination ability. In the angle sorting and 2AFC experiments, it was found that it takes 3–5 min for one trial to obtain D T 1 , but it takes 160–180 min to obtain D T 2 . In addition, according to the correlation between D T 1 and D T 2 , the relationship between the two methods, and the similarity of cognitive processes, all indicated that the results of both the haptic angle sorting method can also be used to evaluate haptic shape discrimination. Moreover, the angle sort D T 1 is stable, and its evaluation result is better than the angle threshold evaluation in 2AFC. The system is easy to use for both the experimenters and participants in the evaluation experiments. The contribution of the system is to unify the experimental procedure, simplify the operation, and be convenient for analyzing the raw experimental data to form a meaningful parameter that reflects the discrimination abilities. In comparing the two-angle discrimination method, the user only needs to operate the software, and the results are obtained in a few seconds from the angle sorting system. Moreover, this method could also be used to evaluate the angle discriminability of people of different ages.
Through the two experiments of the present study, the system evaluation and the comparison of population differences, we demonstrated the practicality of our system. We also showed that the new method may have potential application value in the evaluation of haptic discrimination ability, haptic cognitive function and even early clinical evaluation.
Our future work will entail designing more series of haptic angle patterns with different angular differences, such as 3°, 4° and 5° differentials, to satisfy a larger D T 1 demands and even serve as a preclinical screening test.

Author Contributions

Conceptualization, Y.E., Y.L., J.Y. and Q.W.; methodology, Y.Y. (Yiyang Yu), Y.E.; software, Y.L.; formal analysis, Y.L.; investigation, J.Y. and Y.Y. (Yinghua Yu); data curation, Y.L. and J.Y.; writing—original draft preparation, Y.L.; writing—review and editing, Y.L., J.Y., Y.Y. (Yinghua Yu), W.W., H.L., S.T., Y.E. and Q.W.; supervision, J.Y. and J.W.; project administration, J.Y., Q.W. and J.W.; funding acquisition, J.Y., Q.W. and J.W. All authors have read and agreed to the published version of the manuscript.

Funding

This study was supported by the JAPAN SOCIETY FOR THE PROMOTION OF SCIENCE (JSPS) KAKENHI grant numbers JP20K07722, JP18H01411, JP18K18835, a Grant-in-Aid for Strategic Research Promotion from Okayama University and the Social Science Project of Suzhou University of Science and Technology (341922905), and the Shenzhen Overseas Innovation Team Project (No. KQTD20180413181834876).

Institutional Review Board Statement

Not applicable.

Informed Consent Statement

Informed consent was obtained from all participants involved in the study.

Data Availability Statement

All the data used to support the findings of this study are available from the corresponding author upon request.

Conflicts of Interest

The authors declare no conflict of interest.

Abbreviations

2AFCTwo-Alternative Forced Choice
2-DTwo-Dimensional
MCUMicrocontroller Unit
ACAlternating Current
DCDirect Current
FPGAField Programmable Gate Array
SAStandard Angle
CAsComparison Angles
A S n The result of n th time Angle Sort
D T Discrimination Threshold

References

  1. Kalisch, T.; Kattenstroth, J.C.; Kowalewski, R.; Tegenthoff, M.; Dinse, H.R. Cognitive and tactile factors affecting human haptic performance in later life. PLoS ONE 2012, 7, e30420. [Google Scholar] [CrossRef] [Green Version]
  2. Blatow, M.; Nennig, E.; Durst, A.; Sartor, K.; Stippich, C. fMRI reflects functional connectivity of human somatosensory cortex. NeuroImage 2007, 37, 927–936. [Google Scholar] [CrossRef] [PubMed]
  3. Roland, P.E.; O’Sullivan, B.; Kawashima, R. Shape and roughness activate different somatosensory areas in the human brain. Proc. Natl. Acad. Sci. USA 1998, 95, 3295–3300. [Google Scholar] [CrossRef] [Green Version]
  4. Yu, Y.; Huber, L.; Yang, J.; Jangraw, D.C.; Handwerker, D.A.; Molfese, P.J.; Chen, G.; Ejima, Y.; Wu, J.; Bandettini, P.A. Layer-specific activation of sensory input and predictive feedback in the human primary somatosensory cortex. Sci. Adv. 2019, 5, eaav9053. [Google Scholar] [CrossRef] [PubMed] [Green Version]
  5. Dowell, C.J.; Norman, J.F.; Moment, J.R.; Shain, L.M.; Norman, H.F.; Phillips, F.; Kappers, A.M.L. Haptic shape discrimination and interhemispheric communication. Sci. Rep. 2018, 8, 377. [Google Scholar] [CrossRef] [PubMed]
  6. Bodegård, A.; Geyer, S.; Grefkes, C.; Zilles, K.; Roland, P.E. Hierarchical processing of tactile shape in the human brain. Neuron 2001, 31, 317–328. [Google Scholar] [CrossRef] [Green Version]
  7. Yang, J.; Molfese, P.J.; Yu, Y.; Handwerker, D.A.; Chen, G.; Taylor, P.A.; Ejima, Y.; Wu, J.; Bandettini, P.A. Different activation signatures in the primary sensorimotor and higher-level regions for haptic three-dimensional curved surface exploration. NeuroImage 2021, 231, 117754. [Google Scholar] [CrossRef]
  8. Yu, Y.; Yang, J.; Ejima, Y.; Fukuyama, H.; Wu, J. Asymmetric functional connectivity of the contra- and ipsilateral secondary somatosensory cortex during tactile object recognition. Front. Hum. Neurosci. 2018, 11, 662. [Google Scholar] [CrossRef] [PubMed] [Green Version]
  9. Yang, J.; Yu, Y.; Kunita, A.; Huang, Q.; Wu, J.; Sawamoto, N.; Fukuyama, H. Tactile priming modulates the activation of the fronto-parietal circuit during tactile angle match and non-match processing: An fMRI study. Front. Hum. Neurosci. 2014, 8, 926. [Google Scholar] [CrossRef] [Green Version]
  10. Kitada, R.; Kito, T.; Saito, D.N.; Kochiyama, T.; Matsumura, M.; Sadato, N.; Lederman, S.J. Multisensory activation of the intraparietal area when classifying grating orientation: A functional magnetic resonance imaging study. J. Neurosci. 2006, 26, 7491–7501. [Google Scholar] [CrossRef]
  11. Bruce, M.F. The relation of tactile thresholds to histology in the fingers of elderly people. J. Neurol. Neurosurg. Psychiatry 1980, 43, 730–734. [Google Scholar] [CrossRef]
  12. Thornbury, J.M.; Mistretta, C.M. Tactile sensitivity as a function of age. J. Gerontol. 1981, 36, 34–39. [Google Scholar] [CrossRef]
  13. Yang, J.; Ogasa, T.; Ohta, Y.; Abe, K.; Wu, J. Decline of human tactile angle discrimination in patients with mild cognitive impairment and Alzheimer’s disease. J. Alzheimers Dis. 2010, 22, 225–234. [Google Scholar] [CrossRef] [PubMed]
  14. Zhang, Z.; Chen, G.; Zhang, J.; Yan, T.; Go, R.; Fukuyama, H.; Wu, J.; Han, Y.; Li, C. Tactile Angle Discrimination Decreases due to Subjective Cognitive Decline in Alzheimer’s Disease. Curr. Alzheimer Res. 2020, 17, 168–176. [Google Scholar] [CrossRef] [PubMed]
  15. Craig, J.C. Grating orientation as a measure of tactile spatial acuity. Somatosens. Mot. Res. 1999, 16, 197–206. [Google Scholar] [CrossRef]
  16. Craig, J.C.; Johnson, K.O. The two-point threshold: Not a measure of tactile spatial resolution. Curr. Dir. Psychol. Sci. 2000, 9, 29–32. [Google Scholar] [CrossRef]
  17. Shooter, D. Use of two-point discrimination as a nerve repair assessment tool: Preliminary report. ANZ J. Surg. 2005, 75, 866–868. [Google Scholar] [CrossRef]
  18. Yang, J.; Syafiq, M.U.; Yu, Y.; Takahashi, S.; Zhang, Z.; Wu, J. Development and Evaluation of a Tactile Cognitive Function Test Device for Alzheimer ’ s Disease Early Detection. Neurosci. Biomed. Eng. 2015, 3, 58–65. [Google Scholar] [CrossRef]
  19. Wu, J.; Yang, J.; Ogasa, T. Raised-angle discrimination under passive finger movement. Perception 2010, 39, 993–1006. [Google Scholar] [CrossRef]
  20. Wu, Q.; Liu, Y.; Liu, Y.; Wu, J.; Go, R. Development and performance evaluation of automatic measuring apparatus for sorting haptic angle stimulus. In Proceedings of the 2020 IEEE International Conference on Mechatronics and Automation, ICMA 2020, Beijing, China, 2–5 August 2020; pp. 1467–1472. [Google Scholar]
  21. Skinner, C.J.; Anderson, T.W. An Introduction to Multivariate Statistical Analysis. J. R. Stat. Soc. Ser. A 1985, 148, 164. [Google Scholar] [CrossRef]
  22. Thurstone, L.L. A law of comparative judgment. Psychol. Rev. 1927, 34, 273–286. [Google Scholar] [CrossRef]
  23. Green, D.M.; Swets, J.A. Signal Detection Theory and Psychophysics; Wiley: New York, NY, USA, 1966; Volume 1. [Google Scholar]
  24. Gibson, E.J.; Gibson, J.J.; Pick, A.D.; Osser, H. A developmental study of the discrimination of letter-like forms. J. Comp. Physiol. Psychol. 1962, 55, 897–906. [Google Scholar] [CrossRef]
  25. Loo, C.K.; Hall, L.A.; McCloskey, D.I.; Rowe, M.J. Proprioceptive contributions to tactile identification of figures: Dependence on figure size. Behav. Brain Res. 1983, 7, 383–386. [Google Scholar] [CrossRef]
  26. Klatzky, R.L.; Lederman, S.J.; Hamilton, C.; Grindley, M.; Swendsen, R.H. Feeling textures through a probe: Effects of probe and surface geometry and exploratory factors. Percept. Psychophys. 2003, 65, 613–631. [Google Scholar] [CrossRef] [PubMed] [Green Version]
  27. Toderita, I.; Bourgeon, S.; Voisin, J.I.A.; Chapman, C.E. Haptic two-dimensional angle categorization and discrimination. Exp. Brain Res. 2014, 232, 369–383. [Google Scholar] [CrossRef]
  28. Klatzky, R.L.; Loomis, J.M.; Lederman, S.J.; Wake, H.; Fujita, N. Haptic identification of objects and their depictions. Percept. Psychophys. 1993, 54, 170–178. [Google Scholar] [CrossRef]
  29. Wang, W.; Yang, J.; Yu, Y.; Wu, Q.; Takahashi, S.; Ejima, Y.; Wu, J. Tactile semiautomatic passive-finger angle stimulator (TSPAS). J. Vis. Exp. 2020, 2020, 1–11. [Google Scholar] [CrossRef] [PubMed]
  30. Voisin, J.; Benoit, G.; Chapman, C.E. Haptic discrimination of object shape in humans: Two-dimensional angle discrimination. Exp. Brain Res. 2002, 145, 239–250. [Google Scholar] [CrossRef]
  31. Weder, B.; Nienhusmeier, M.; Keel, A.; Leenders, K.L.; Ludin, H.P. Somatosensory discrimination of shape: Prediction of success in normal volunteers and parkinsonian patients. Exp. Brain Res. 1998, 120, 104–108. [Google Scholar] [CrossRef]
  32. Voisin, J.; Lamarre, Y.; Chapman, E.C. Haptic discrimination of object shape in humans: Contribution of cutaneous and proprioceptive inputs. Exp. Brain Res. 2002, 145, 251–260. [Google Scholar] [CrossRef]
  33. Voisin, J.; Michaud, G.; Chapman, C.E. Haptic shape discrimination in humans: Insight into haptic frames of reference. Exp. Brain Res. 2005, 164, 347–356. [Google Scholar] [CrossRef]
  34. Wijntjes, M.W.A.; Kappers, A.M.L. Angle discrimination in raised-line drawings. Perception 2007, 36, 865–879. [Google Scholar] [CrossRef]
  35. Wang, W.; Yang, J.; Yu, Y.; Wu, Q.; Yu, J.; Takahashi, S.; Ejima, Y.; Wu, J. Tactile angle discriminability improvement: Roles of training time intervals and different types of training tasks. J. Neurophysiol. 2019, 122, 1918–1927. [Google Scholar] [CrossRef]
  36. Johnson, K.O. The roles and functions of cutaneous mechanoreceptors. Curr. Opin. Neurobiol. 2001, 11, 455–461. [Google Scholar] [CrossRef]
  37. Maule, F.; Barchiesi, G.; Brochier, T.; Cattaneo, L. Haptic working memory for grasping: The role of the parietal operculum. Cereb. Cortex 2015, 25, 528–537. [Google Scholar] [CrossRef] [PubMed]
  38. Kaas, A.L.; Van Mier, H.; Goebel, R. The neural correlates of human working memory for haptically explored object orientations. Cereb. Cortex 2007, 17, 1637–1649. [Google Scholar] [CrossRef] [PubMed] [Green Version]
  39. Gurtubay-Antolin, A.; León-Cabrera, P.; Rodríguez-Fornells, A. Neural Evidence of Hierarchical Cognitive Control during Haptic Processing: An fMRI Study. eNeuro 2019, 5, ENEURO.0295-18.2018. [Google Scholar] [CrossRef]
  40. Fiehler, K.; Burke, M.; Engel, A.; Bien, S.; Rösler, F. Kinesthetic working memory and action control within the dorsal stream. Cereb. Cortex 2008, 18, 243–253. [Google Scholar] [CrossRef] [Green Version]
  41. Servos, P.; Lederman, S.; Wilson, D.; Gati, J. fMRI-derived cortical maps for haptic shape, texture, and hardness. Cogn. Brain Res. 2001, 12, 307–313. [Google Scholar] [CrossRef]
  42. Burton, H.; Sinclair, R.J.; Lin, W.; MacLeod, A.K. PET and fMRI scans of the cerebral cortex in humans and single neuron responses from SI in monkeys to rubbing embossed dot and grating patterns across a fingerpad. In Somesthesis and the Neurobiology of the Somatosensory Cortex; Franzén, O., Johansson, R., Terenius, L., Eds.; Birkhäuser: Basel, Switzerland, 1996; pp. 339–349. ISBN 978-3-0348-9016-8. [Google Scholar]
  43. Deibert, E.; Kraut, M.; Kremen, S.; Hart, J. Neural pathways in tactile object recognition. Neurology 1999, 52, 1413–1417. [Google Scholar] [CrossRef] [PubMed]
  44. Norman, J.F.; Adkins, O.C.; Hoyng, S.C.; Dowell, C.J.; Pedersen, L.E.; Gilliam, A.N. Aging and the Haptic Perception of Material Properties. Perception 2016, 45, 1387–1398. [Google Scholar] [CrossRef] [PubMed]
  45. Cakrt, O.; Slabý, K.; Kmet, J.; Kolár, P.; Jerábek, J. Subjective visual and haptic vertical in young and elderly. J. Vestib. Res. Equilib. Orientat. 2016, 25, 195–199. [Google Scholar] [CrossRef]
  46. Giudice, N.A.; Bennett, C.R.; Klatzky, R.L.; Loomis, J.M. Spatial Updating of Haptic Arrays Across the Life Span. Exp. Aging Res. 2017, 43, 274–290. [Google Scholar] [CrossRef] [PubMed]
  47. Konczak, J.; Sciutti, A.; Avanzino, L.; Squeri, V.; Gori, M.; Masia, L.; Abbruzzese, G.; Sandini, G. Parkinson’s disease accelerates age-related decline in haptic perception by altering somatosensory integration. Brain 2012, 135, 3371–3379. [Google Scholar] [CrossRef] [Green Version]
  48. Andrews, B.; d’Avossa, G.; Sapir, A. Aging changes 3D perception: Evidence for hemispheric rebalancing of lateralized processes. Neuropsychologia 2017, 99, 121–127. [Google Scholar] [CrossRef] [PubMed] [Green Version]
Figure 1. The procedure of a haptic angle sorting paradigm. Each target is randomly selected and submitted to the participant for comparison. After touching the first target, the participant compared it with the reference angle and placed it in a suitable ranking position according to the angle difference. Then, all angles that were placed on the device were used as references to determine the position of the new target. When all five angle stimuli were placed, the participant was required to touch the angle stimuli again from small to large to confirm whether the order was correct. When the participant thought that it was incorrect, he could adjust the sorting as many times as desired. When the participant thought that it was correct, he/she submitted the final result to end the test.
Applsci 11 07049 g001
Figure 2. In the angle sorting paradigm, when μ = a and x = b are determined in the normal distribution, σ relates the participant’s haptic angle discriminability. The smaller σ 1 is, the larger the probability density value, which reflects that the participants are more likely to discriminate the smallest angle, that is, the participant has better discrimination of the angle. The larger σ 3 is, the smaller the probability density value, the lower the probability of choosing the smallest angle, and the worse the participant’s haptic angle discriminability.
Applsci 11 07049 g002
Figure 3. The relationship between σ and the probability of the angle sorting result P ( σ , A S n ) . (a) When the angle sorting A S 1 is wrong, the relationship between the σ and the probability of the angle sort result P ( σ , A S 1 ) is A S 1 = ( 26 ° , 22 ° , 24 ° , 28 ° , 30 ° ) . (b) When the angle sort A S 2 is completely correct, the relationship between the σ and the probability of the angle sort result P ( σ , A S 2 ) is,   A S 2 = ( 22 ° , 24 ° , 26 ° , 28 ° , 30 ° ) . (c) When the angle sort A S 3 is wrong, treating the larger angle as the smaller angle, the relationship between σ and the probability of the angle sorting result P ( σ , A S 3 ) . The relationship between σ and the probability of the angle sorting result P ( σ , A S 3 ) is A S 3 = ( 28 ° , 30 ° , 26 ° , 24 ° , 22 ° ) .
Applsci 11 07049 g003
Figure 4. The relationship between the cumulative probability and stimulus angle for the condition of the reference stimulus angle 26° and σ = 2.6 . The horizontal axis indicates the stimulus angle, and the vertical axis indicates the cumulative probability. C ( x 1 , 75%) and D ( x 2 , 25%) denote the threshold coordinates. x 1 and x 2 denote the angle discrimination thresholds from the reference angle.
Applsci 11 07049 g004
Figure 5. The design of a haptic pattern. (a) The size of angle stimuli; (b) The thickness of the haptic pattern.
Applsci 11 07049 g005
Figure 6. Schematic diagram of the structure of the haptic angle sorting system.
Applsci 11 07049 g006
Figure 7. The configuration of the haptic angle sorting device: (a) design of the haptic pattern (I), which includes the angle stimulus at the front (II) and keycode base at the back (III); (b) interface design of the haptic angle device and (c) design of the haptic angle stimulus position in a fixed position and a sequence position.
Applsci 11 07049 g007
Figure 8. The implementation of the system: (a) angular stimulus module: the raised-angle drawing (I) on the front side and different trigger keycodes (II) on the backside; (b) interface design of the haptic angle device; (c) software interface to operate in the experiment and (d) operation of the angle sorting device by the participant in the experiment.
Applsci 11 07049 g008
Figure 9. The flowchart of the software design.
Applsci 11 07049 g009
Figure 10. In the two-angle discrimination experiment, the instrument, the procedure and the DT of the calculation were used: (a) experiment method (1) the angle stimuli presentation instrument; (2) one trial procedure of angle discrimination and (b) the logistic function curve fitted from accuracy under an SA. The DT is the value with 75% accuracy.
Applsci 11 07049 g010
Figure 11. Each participant’s DT from angle sorting and 2AFC.
Applsci 11 07049 g011
Figure 12. The average of DT from angle sorting in the young and old groups showed that the performance of young participants was significantly better than that of old participants. Values are means ± SEM. (* p < 0.05).
Applsci 11 07049 g012
Table 1. An example of the method to calculate angle sorting.
Angle CategoriesSecondThirdFourthFifthSixth
P 2 , n P L 2 ( 26 ° ) P 3 , n P L 3 ( 22 ° ) P 4 , n P L 4 ( 24 ° ) P 5 , n P L 4 ( 28 ° ) P 6 , n P L 6 ( 30 ° )
22°0.2850 0.28500.73500 0 0
24°0.1027 0.1027 0.28500.98330 0
26°0.00480.01230 0 0 0
28°0 0 0.0048 0.28500.73500
30°0 0 0 0.1027 0.28501.0000
0.3925 0.3877 0.2898 0.3877 0.2850
P ( σ , A S 1 ) = P L 2 P L 3 P L 4 P L 5 P L 6 = 0.0065
In the table, Angle Categories is the angle category sorted by the participant; P 2 , n is the probability distributions from all angle categories in the second position; P 3 , n , P 4 , n , P 5 , n and P 6 n are the same as before; P L 2 is the probability of choosing the angle (26°) when the probability distribution is P 2 , n ; and P L 3 , P L 4 , P L 5 and P L 6 are the same.
Table 2. Comparison of angle sorting and 2AFC.
MethodNumber of Comparisons (Times/Person)Spend Time (Min/Person)
angle sorting13–5
2AFC (present) 420160–180
2AFC (Wijntjes et al., 2007) [34]Mean 39560
2AFC (Wu et al., 2010) [19]Mean 64090–180
2AFC (Wang et al., 2019) [35]10040
Publisher’s Note: MDPI stays neutral with regard to jurisdictional claims in published maps and institutional affiliations.

