
Numerical Study on Thermal Damage Behavior and Heat Insulation Protection in a High-Temperature Tunnel


Abstract
:1. Introduction
2. Methodology
2.1. Governing Equations
2.1.1. Heat Conduction Equation
2.1.2. Deformation Compatibility Equation
2.2. Heterogeneity of Rock Materials
2.3. Mechanical Property and Thermophysical Property Evolution
2.4. Numerical Model and Associated Conditions
3. Results and Analysis
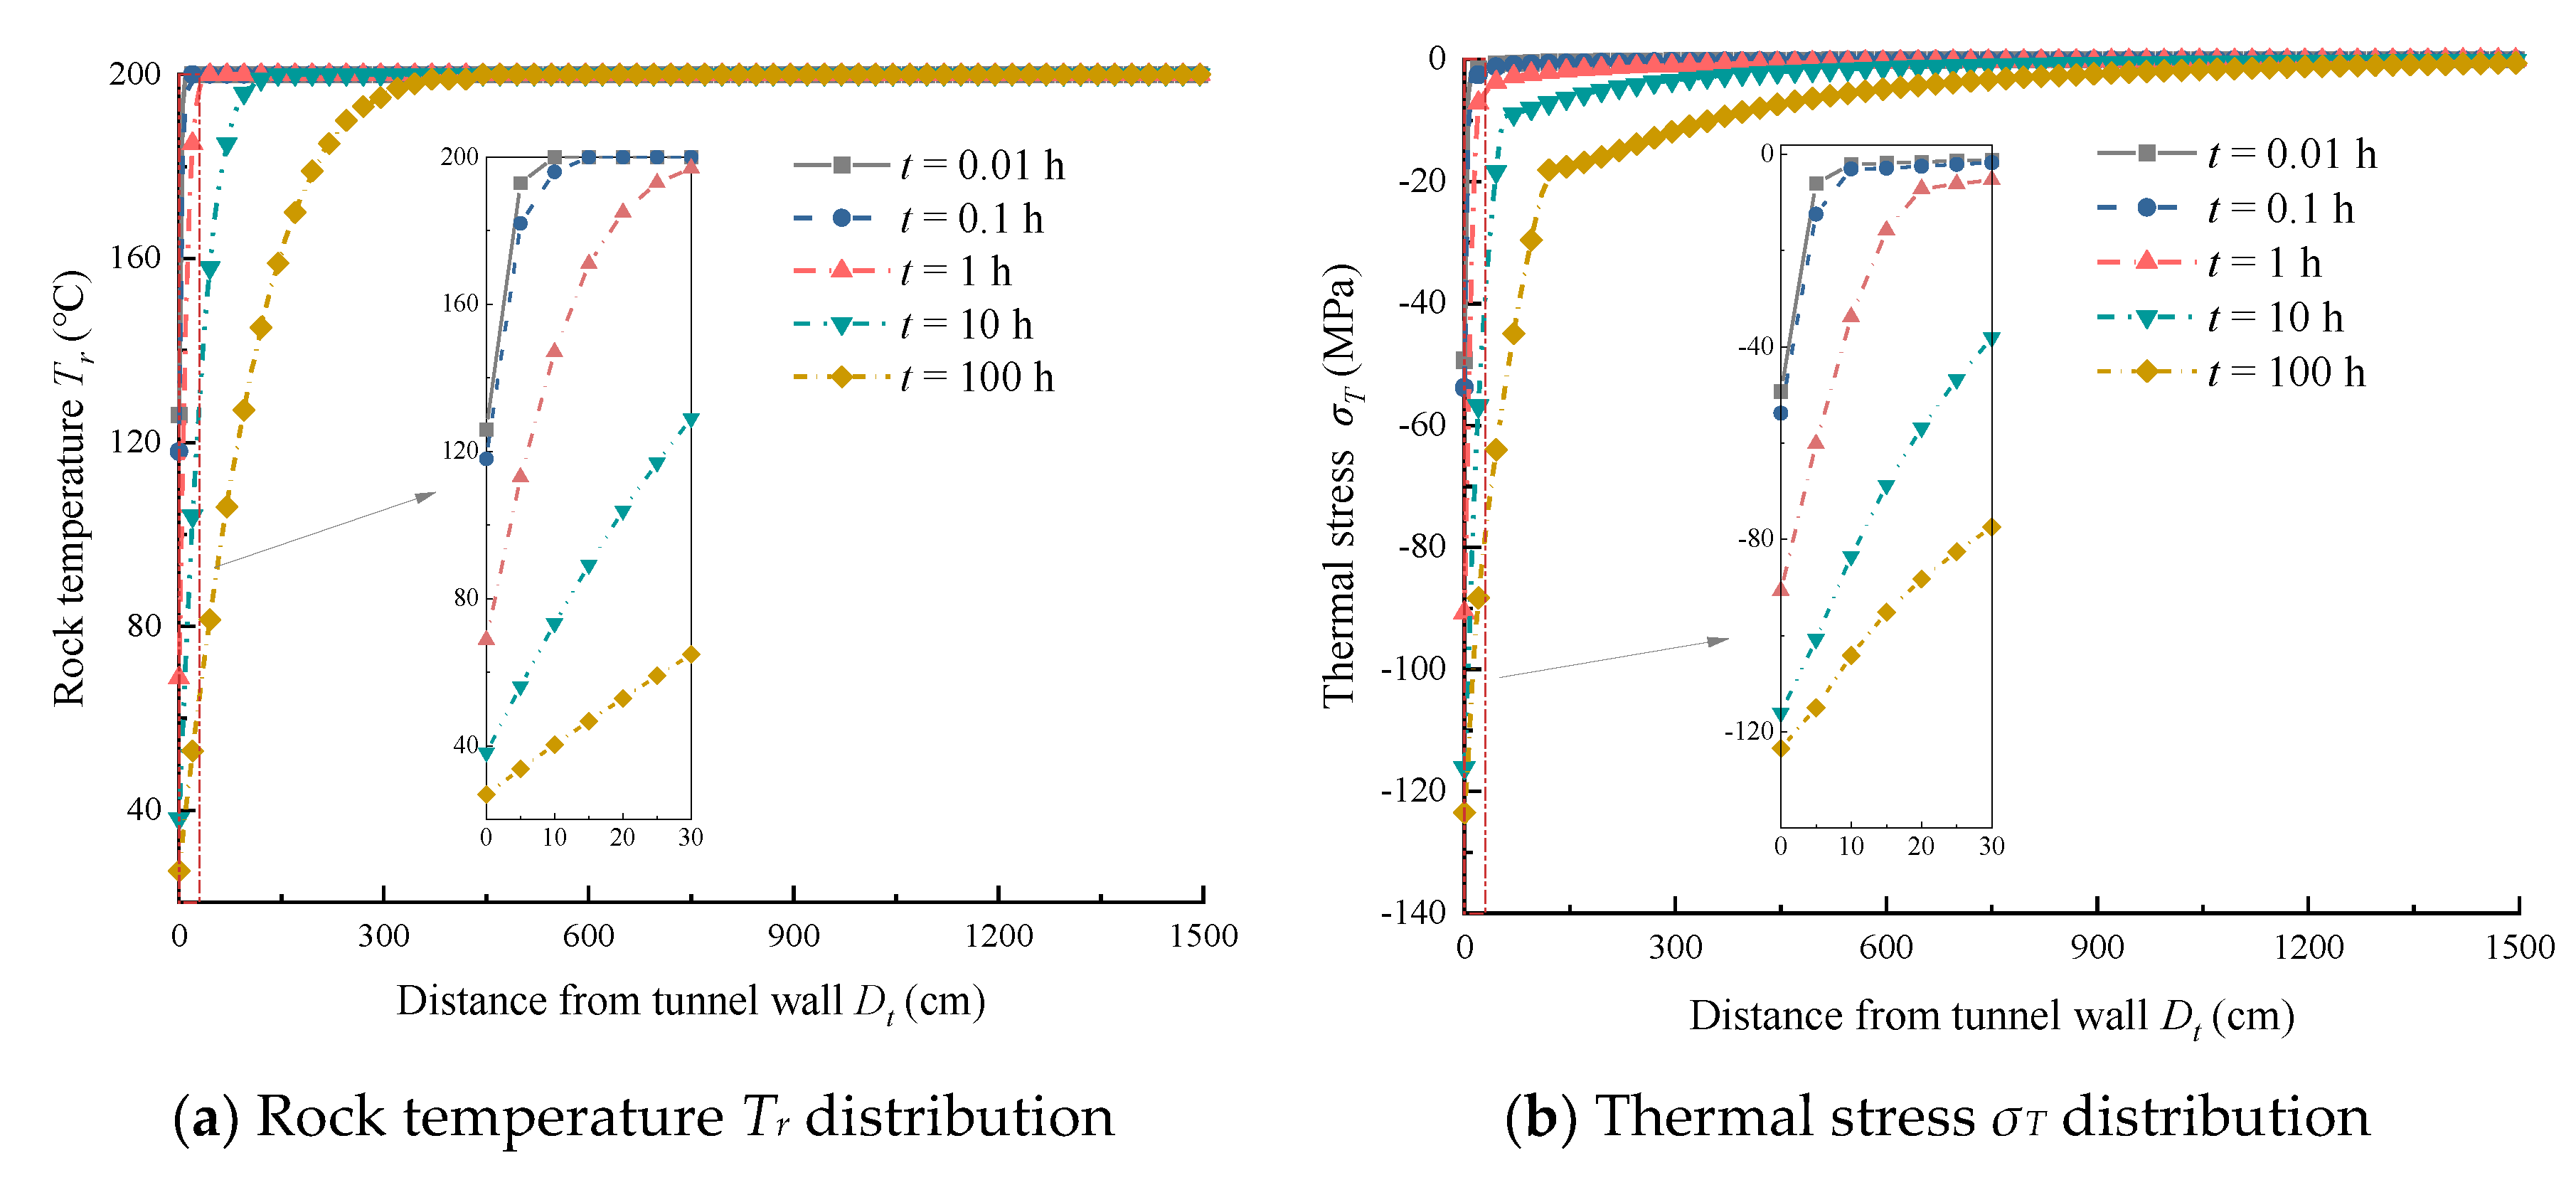
3.1. Temperature and Stress Distribution of Tunnel under Ventilation without TIL
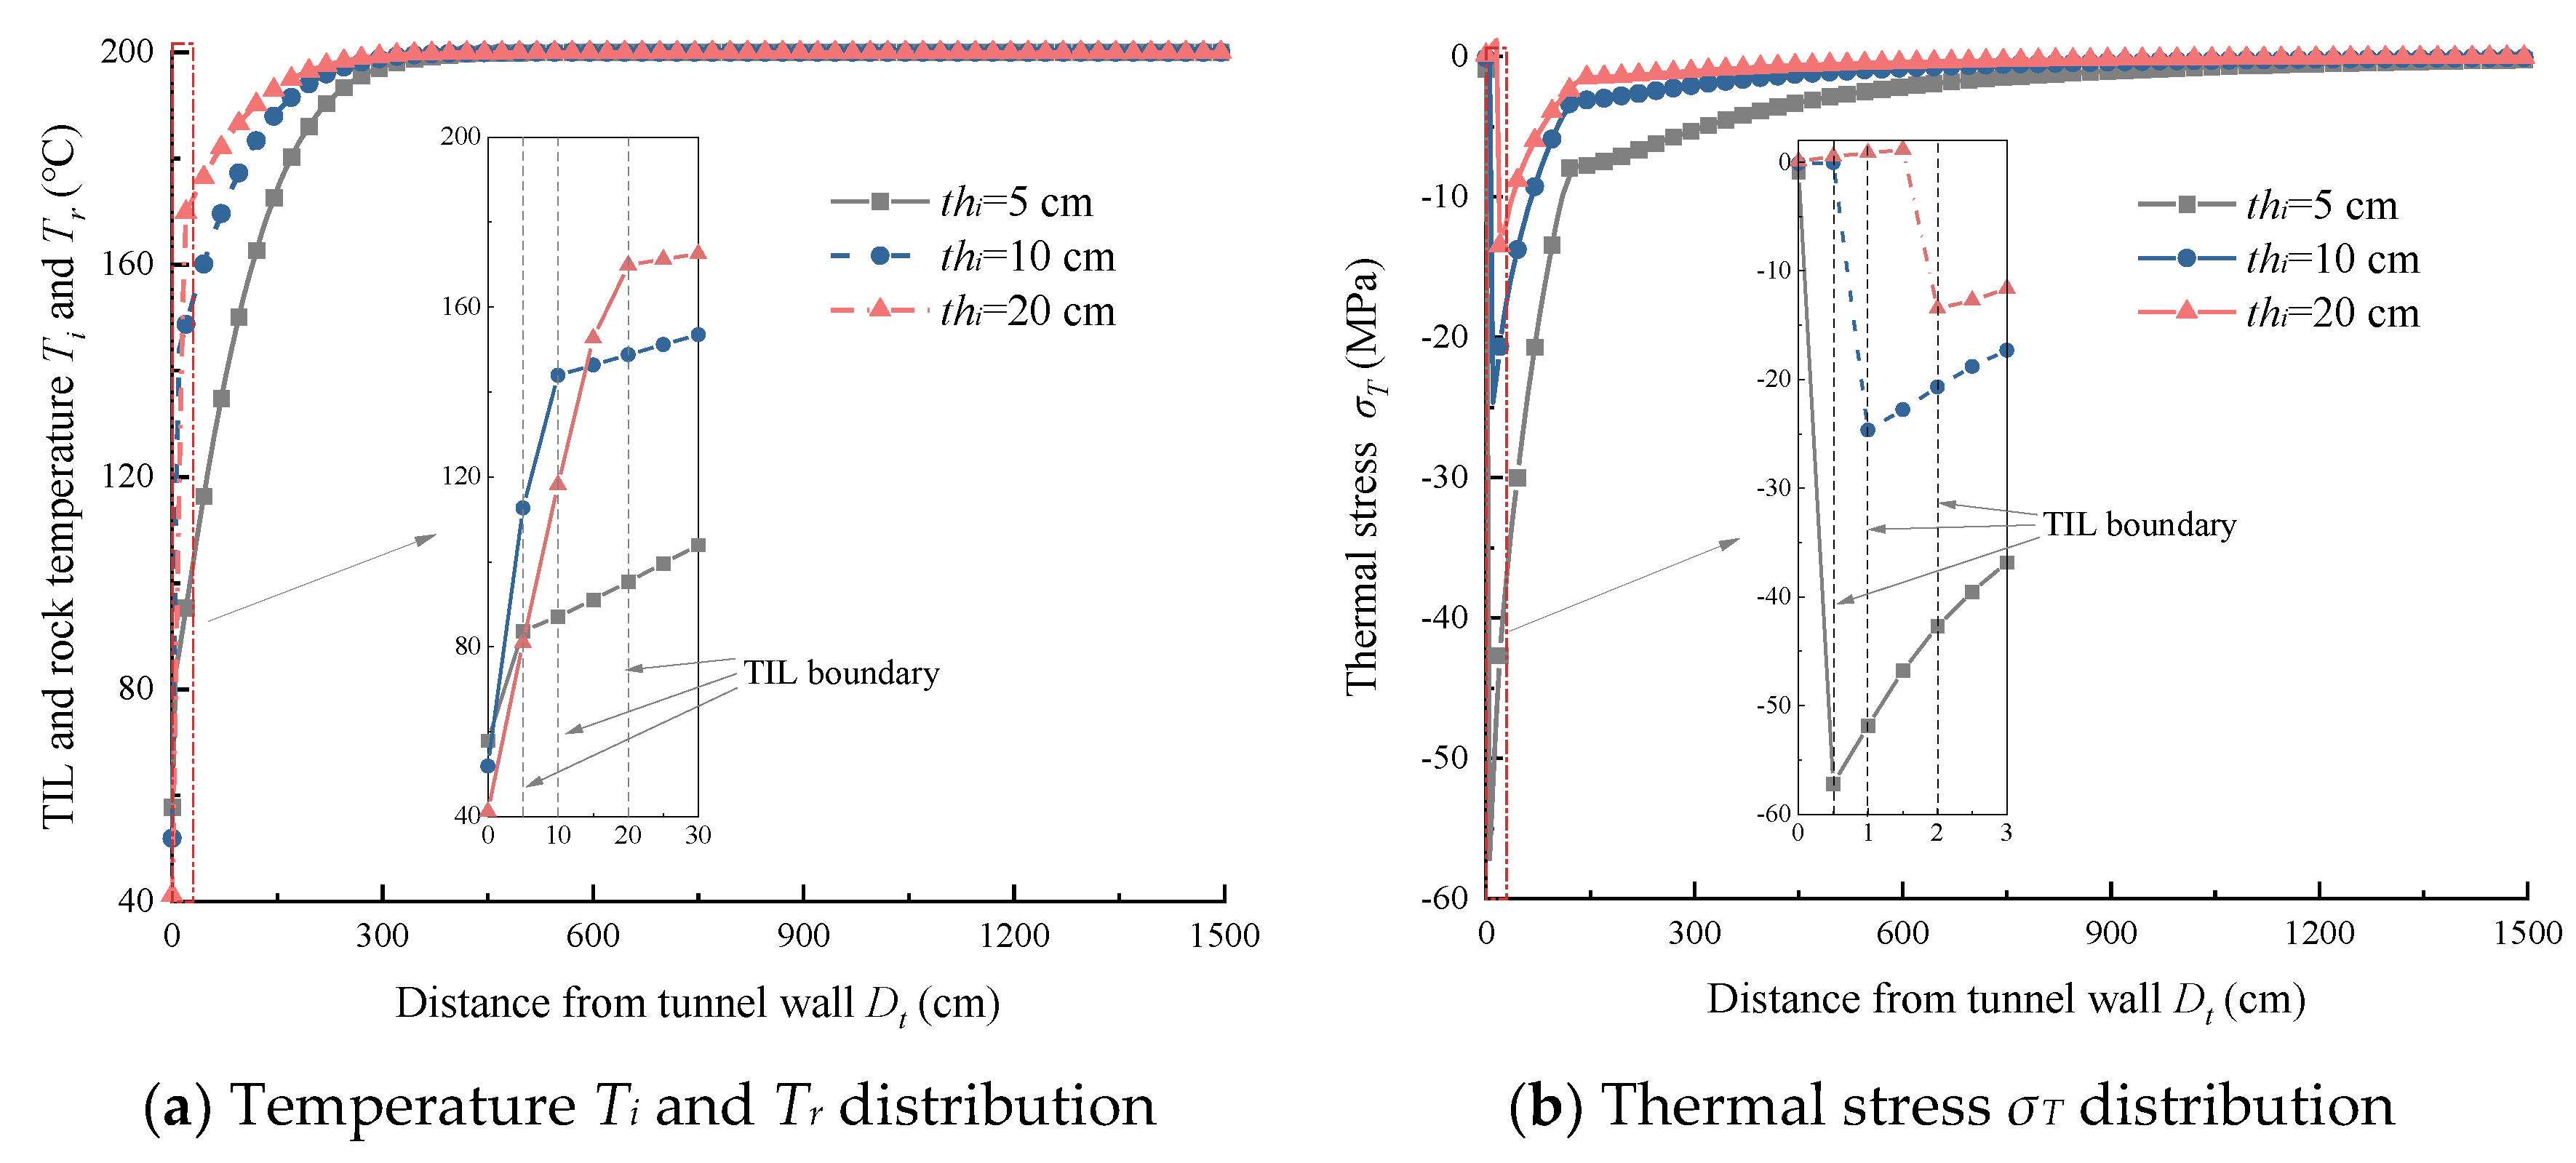
3.2. Temperature and Stress Distribution of Tunnel with TIL
3.3. Influence of TIL and Airflow Parameters on Temperature and Thermal Stress Evolution
3.3.1. Influence of TIL Thickness
3.3.2. Influence of TIL Thermal Conductivity
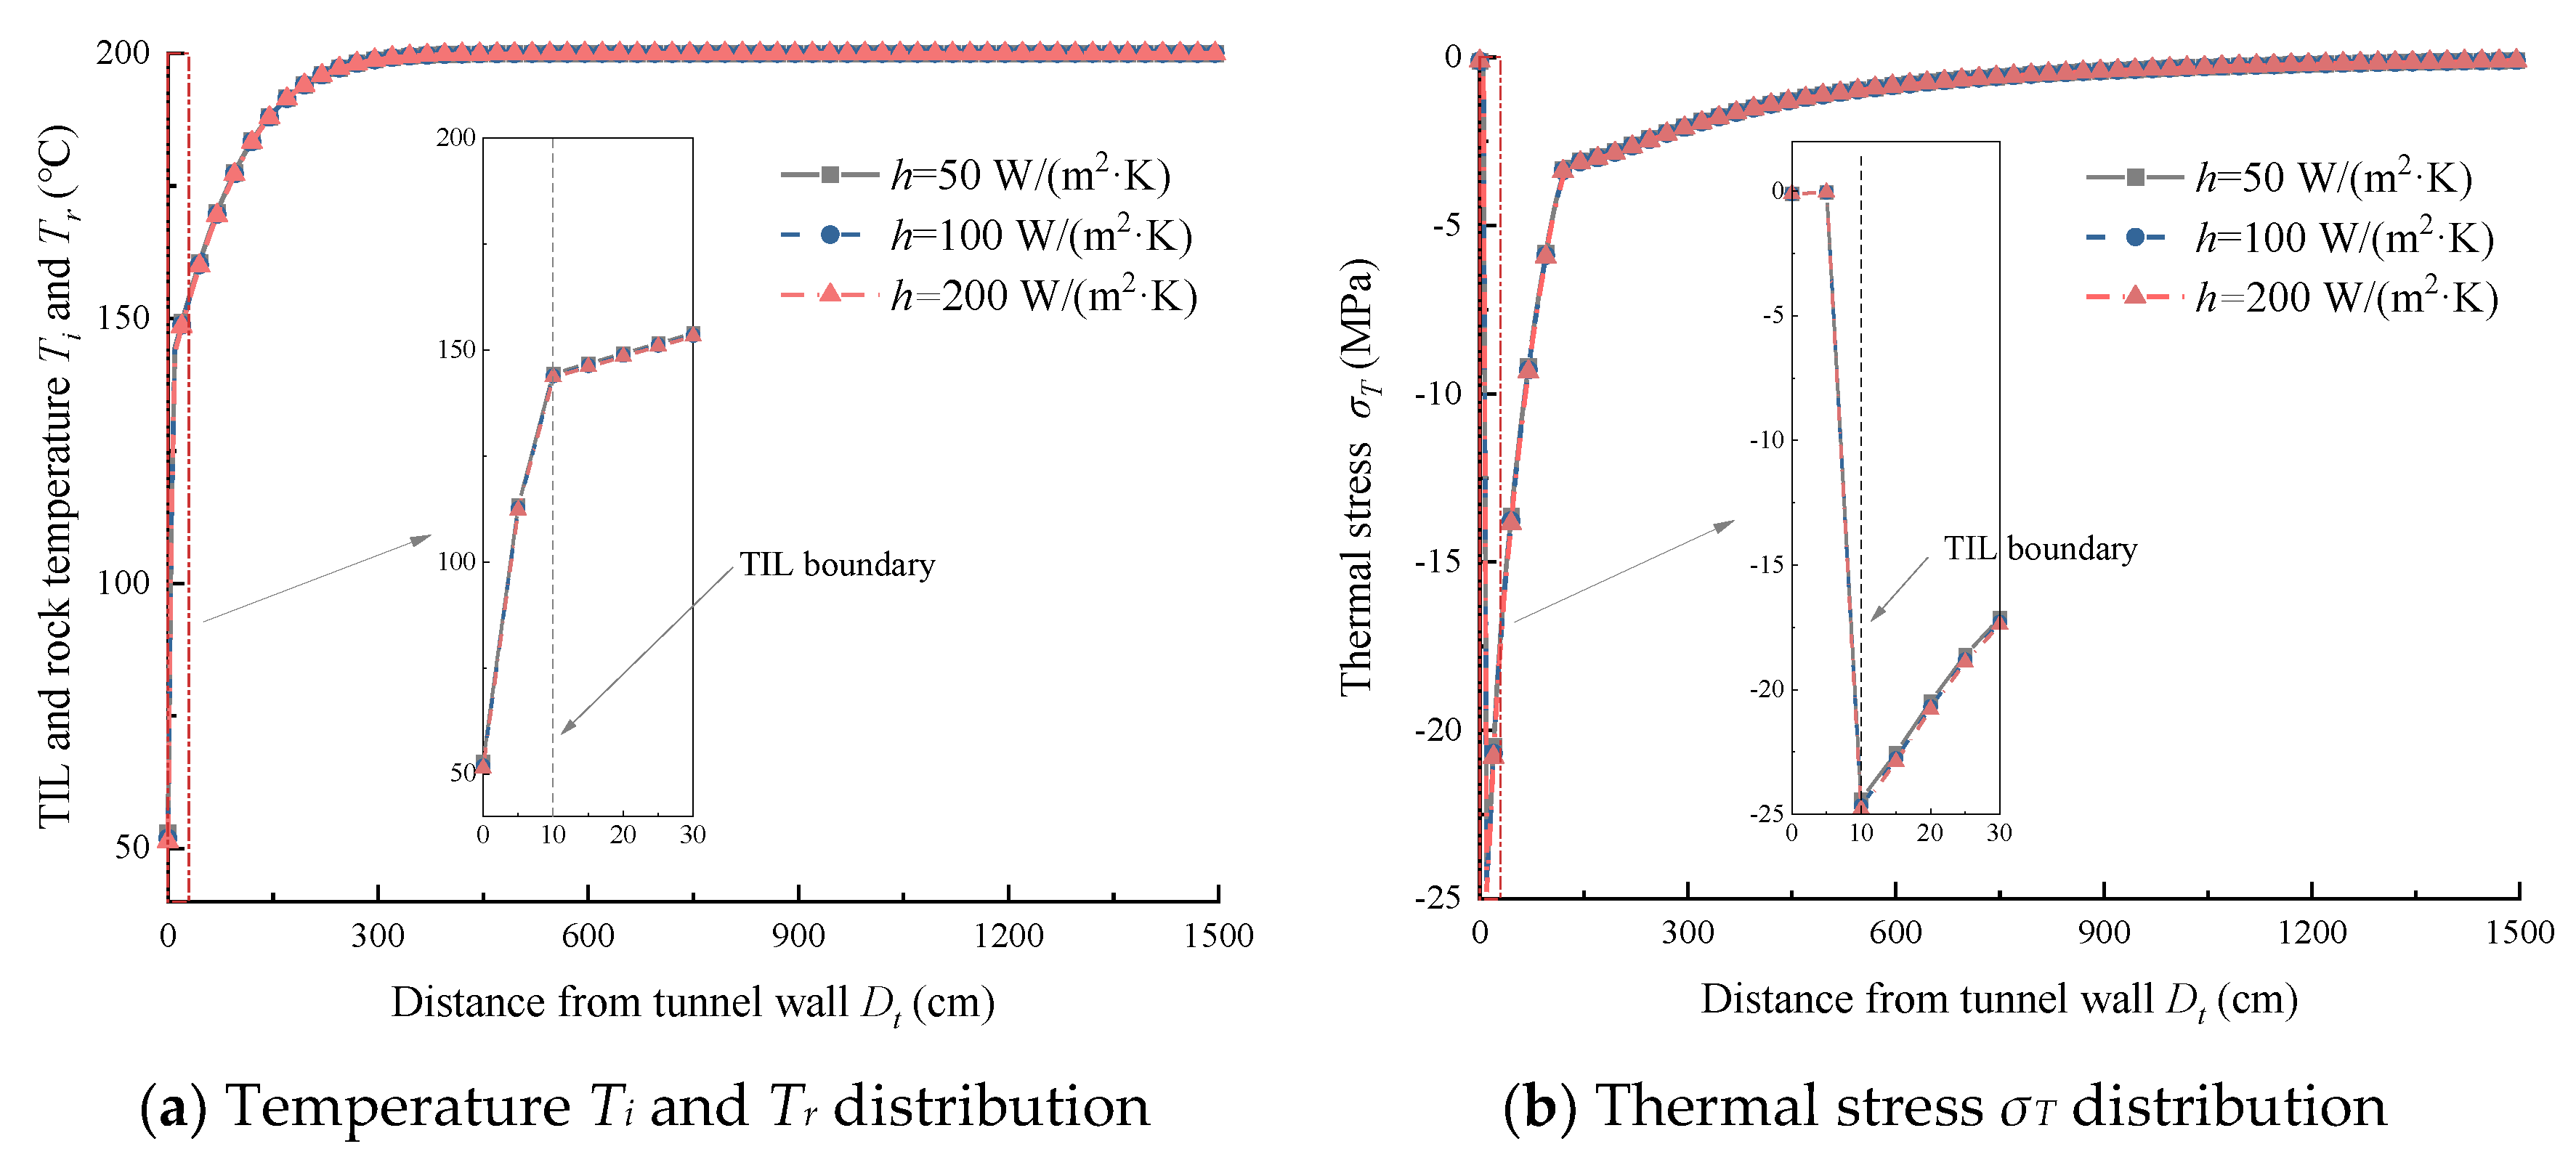
3.3.3. Influence of Airflow Parameters
3.4. Thermal Creaks Evolution in Tunnels under Cold Ventilation
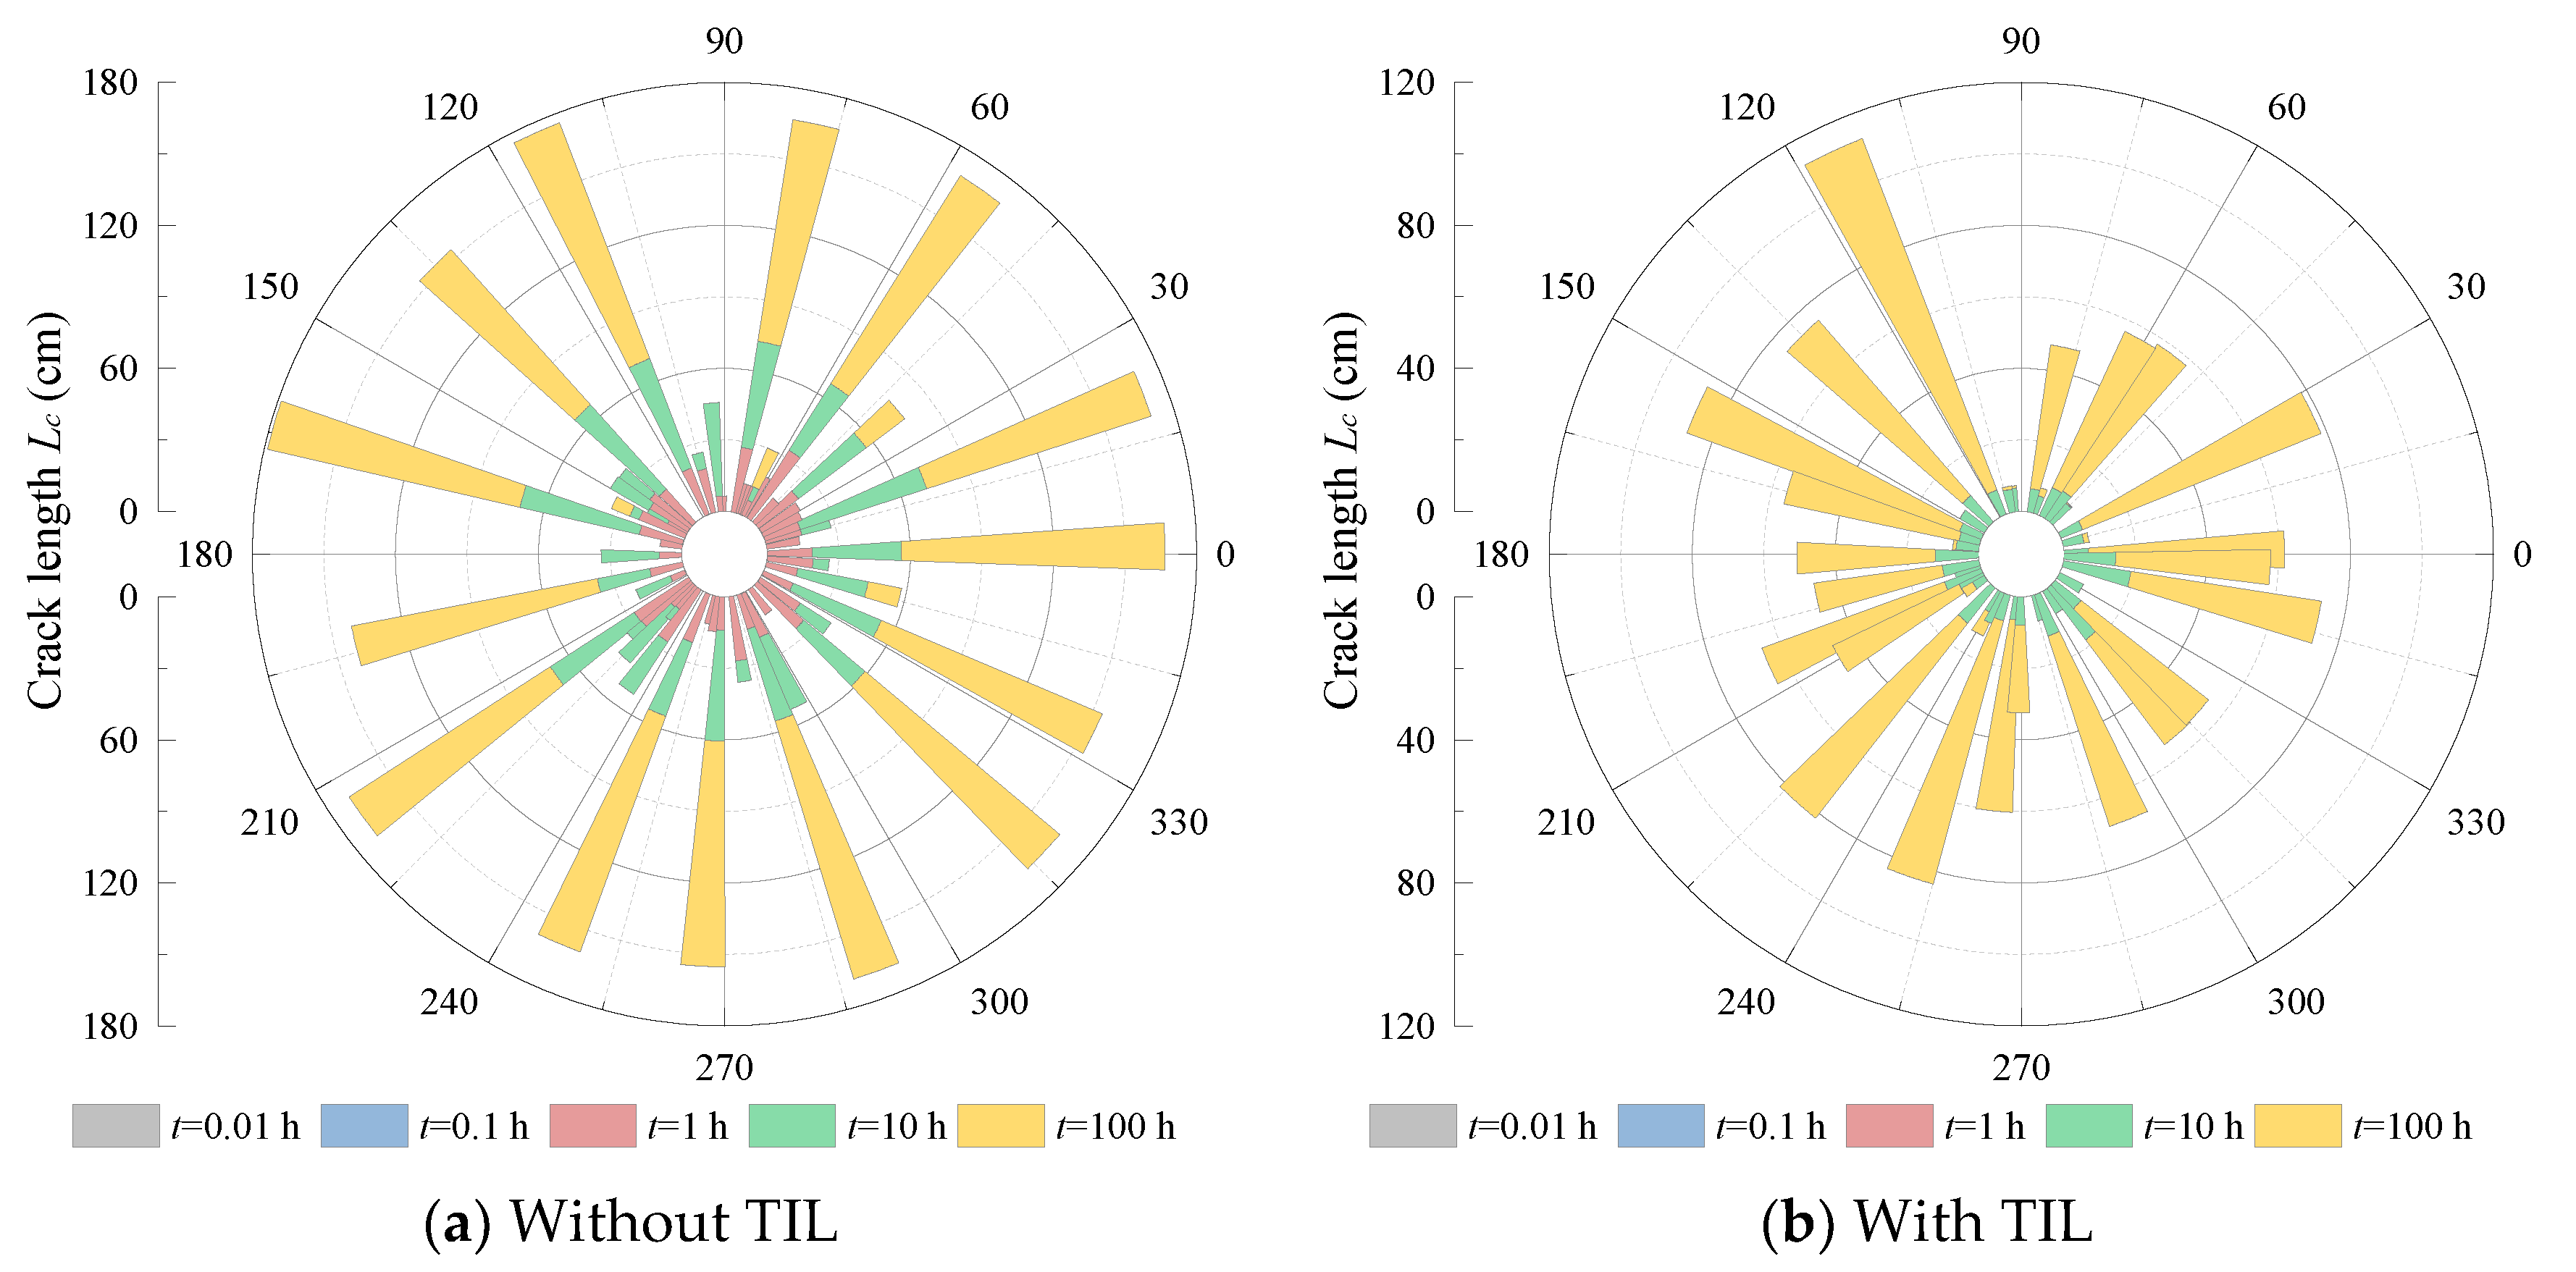
3.4.1. Creaks Propagation in Tunnels with and without TIL
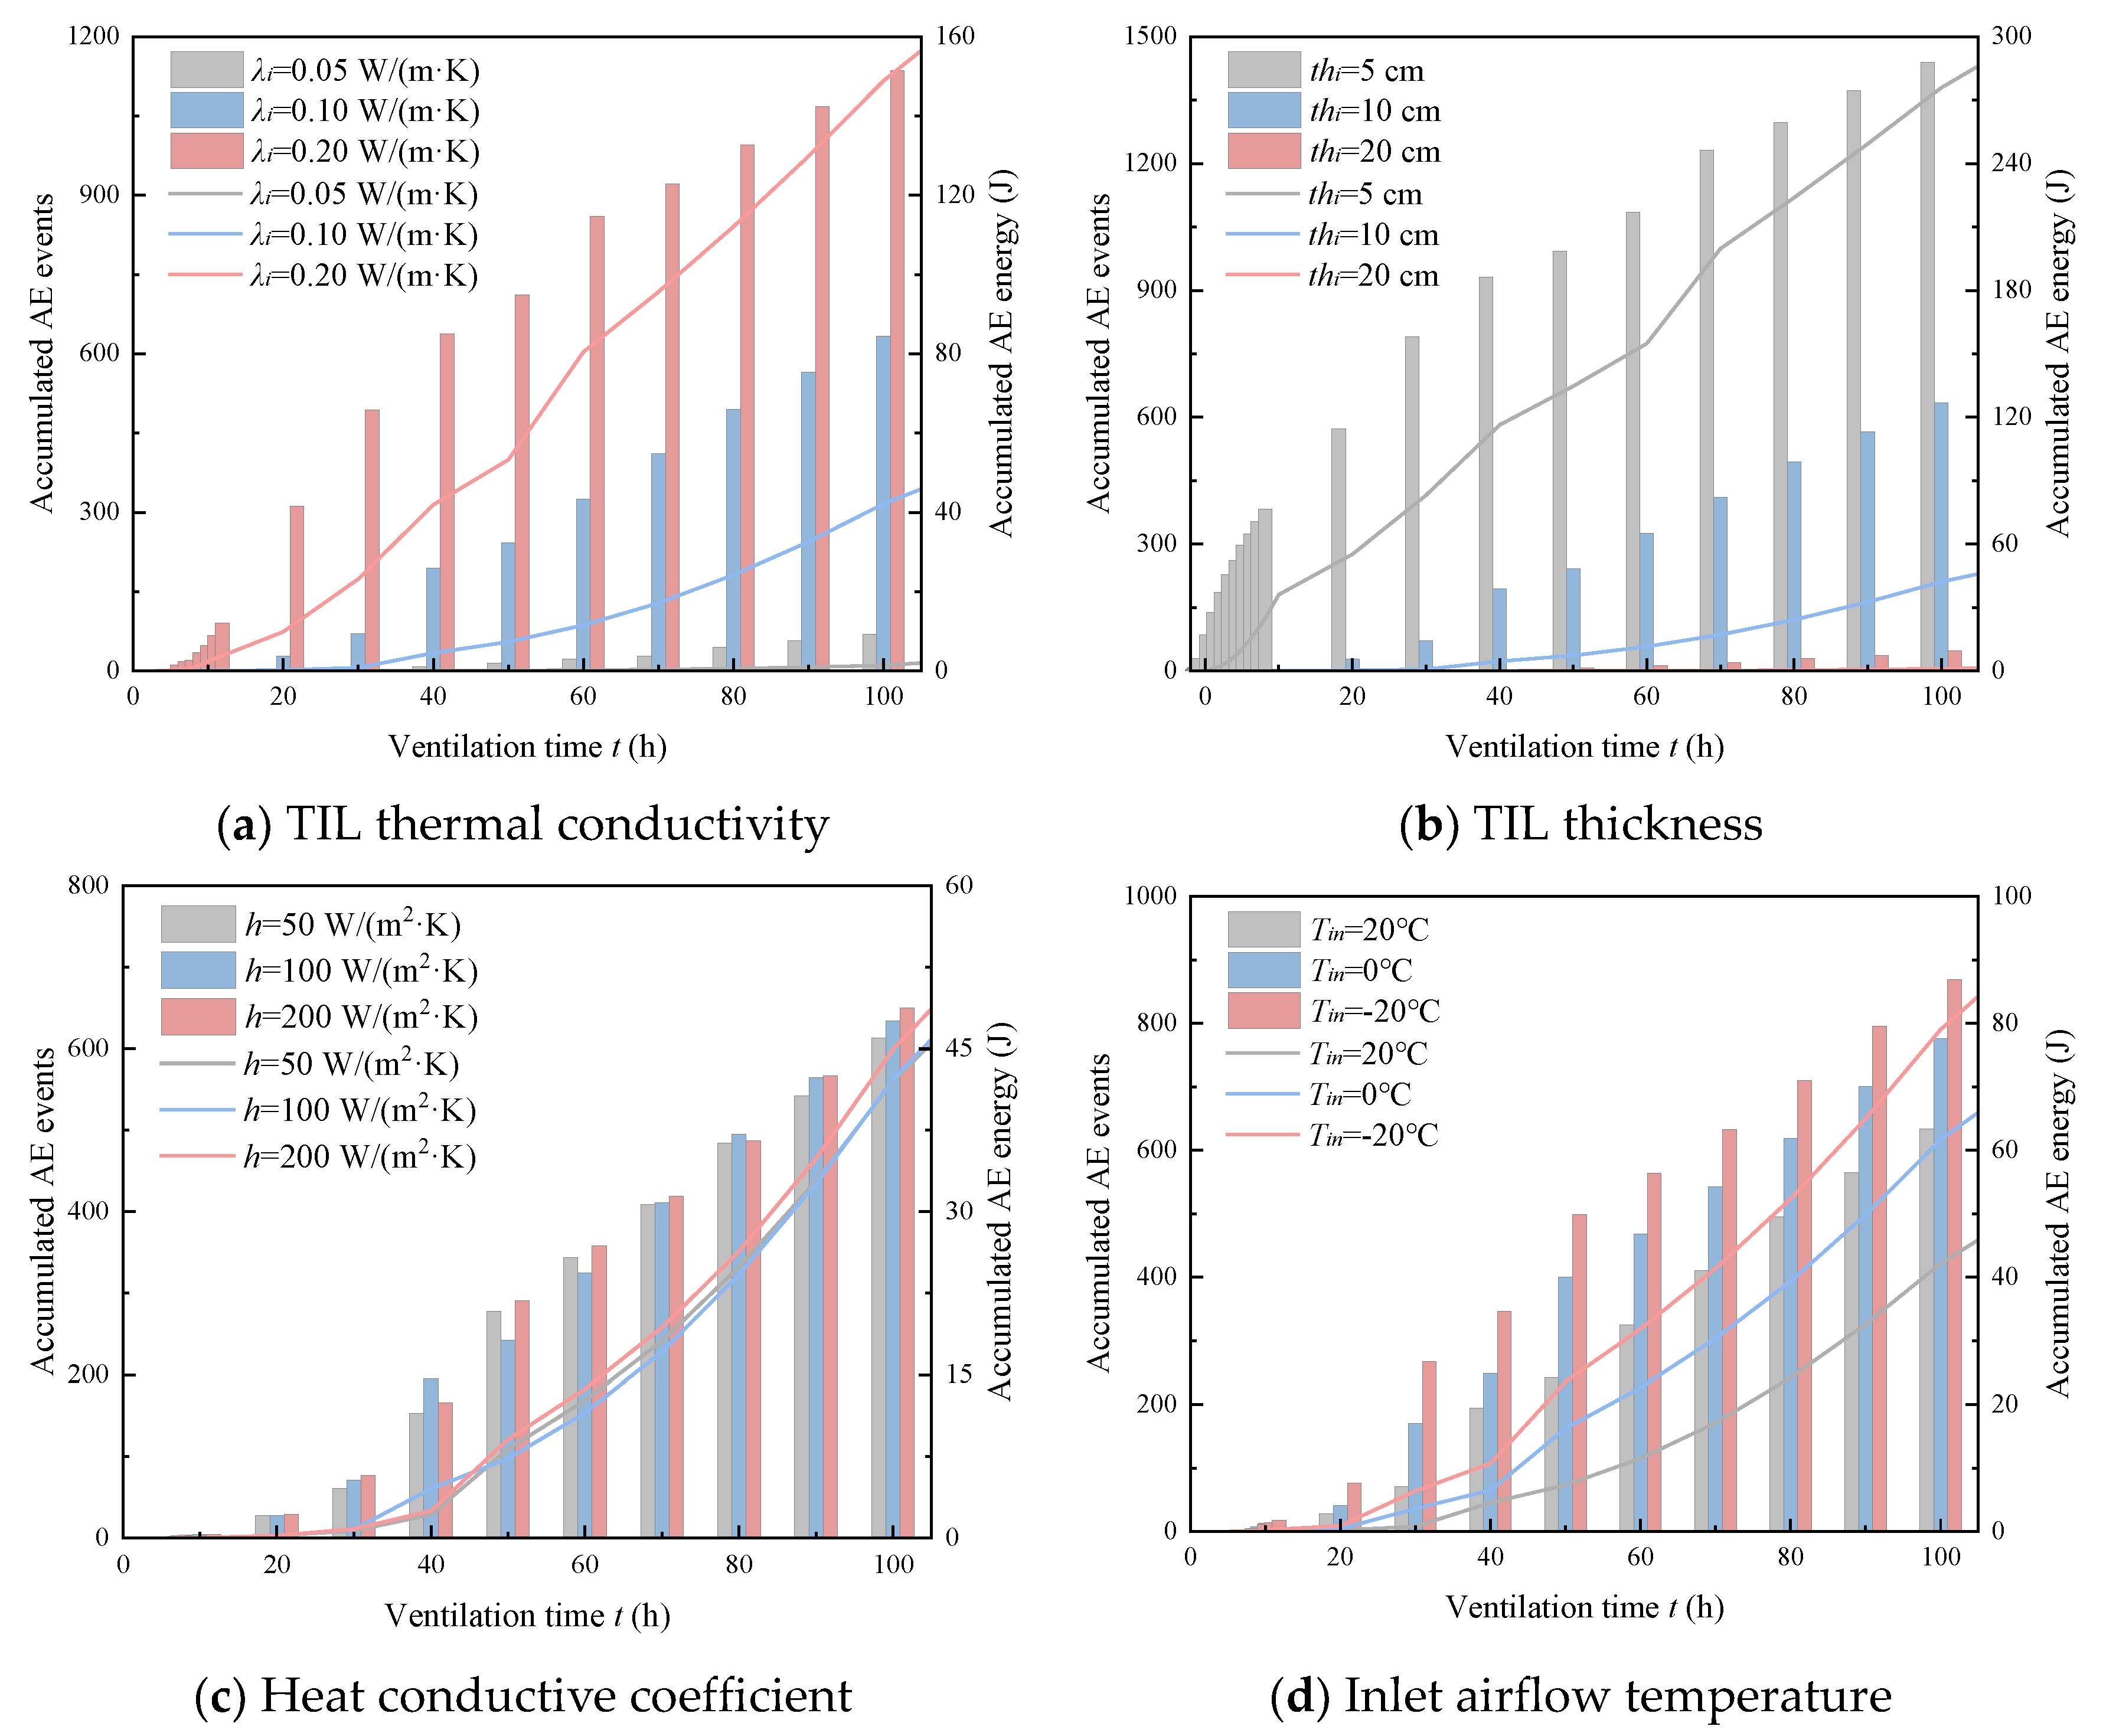
3.4.2. Influences of TIL and Airflow Parameters on Crack Propagation
4. Discussion
5. Conclusions
- (1)
- The thermal stress is induced in the high-temperature tunnel rock ventilated by the cold airflow, damaging the rock unit when it exceeds the tensile strength of the tunnel rock. Such damaged units increase as the ventilation time grows and coalesces to visible cracks in the tunnel rock, reducing the tunnel stability.
- (2)
- Paving a TIL on the tunnel wall weakens the cold shock from the airflow, postponing crack initiation and reducing the total crack number and length. Visual cracks are discovered in the tunnel without TIL after ventilation for 1 h; however, the initiation time grows to 10 h in the tunnel with TIL. The total crack length under 100 h of ventilation decreases from 3214.02 cm to 1505.11 cm, a reduction of 53.17%.
- (3)
- Thickening TIL and decreasing TIL thermal conductivity remarkedly enhanced the insulation effect on thermal damage, whereas descending the inlet temperature and ascending the heat transfer conductive coefficient has little insulation effect. This sensitivity analysis is helpful in designs to prevent thermal damage in high-temperature tunnels.
Author Contributions
Funding
Acknowledgments
Conflicts of Interest
References
- Zeng, Y.; Liu, K.; Zhou, X.; Fan, L. Tunnel temperature fields analysis under the couple effect of convection-conduction in cold regions. Appl. Therm. Eng. 2017, 120, 378–392. [Google Scholar] [CrossRef]
- Zhou, X.; Zeng, Y.; Fan, L. Temperature field analysis of a cold-region railway tunnel considering mechanical and train-induced ventilation effects. Appl. Therm. Eng. 2016, 100, 114–124. [Google Scholar] [CrossRef]
- Kang, F.; Li, Y.; Tang, C. Numerical study on airflow temperature field in a high-temperature tunnel with insulation layer. Appl. Therm. Eng. 2020, 179, 115654. [Google Scholar] [CrossRef]
- Guo, P.; He, M.; Zheng, L.; Zhang, N. A geothermal recycling system for cooling and heating in deep mines. Appl. Therm. Eng. 2017, 116, 833–839. [Google Scholar] [CrossRef]
- Tang, M.; Li, H.; Tang, C. Study on preliminarily estimating performance of elementary deep underground engineering structures in future large-scale heat mining projects. Geofluids 2019, 2019, 1–10. [Google Scholar] [CrossRef]
- Qi, P.; Zhang, J.; Mei, Z.R.; Wu, Y.X. Study on the range of freeze-thaw of surrounding rock from a cold-region tunnel and the effects of insulation material. Adv. Mater. Res. 2011, 399-401, 2222–2225. [Google Scholar] [CrossRef]
- Tan, X.; Chen, W.; Tian, H.; Cao, J. Water flow and heat transport including ice/water phase change in porous media: Numerical simulation and application. Cold Reg. Sci. Technol. 2011, 68, 74–84. [Google Scholar] [CrossRef]
- Tan, X.; Chen, W.; Wu, G.; Yang, J. Numerical simulations of heat transfer with ice–water phase change occurring in porous media and application to a cold-region tunnel. Tunn. Undergr. Space Technol. 2013, 38, 170–179. [Google Scholar] [CrossRef]
- Feng, Q.; Jiang, B.-S.; Zhang, Q.; Wang, G. Reliability research on the 5-cm-thick insulation layer used in the Yuximolegai tunnel based on a physical model test. Cold Reg. Sci. Technol. 2016, 124, 54–66. [Google Scholar] [CrossRef]
- Li, S.; Niu, F.; Lai, Y.; Pei, W.; Yu, W. Optimal design of thermal insulation layer of a tunnel in permafrost regions based on coupled heat-water simulation. Appl. Therm. Eng. 2017, 110, 1264–1273. [Google Scholar] [CrossRef]
- Ma, Q.; Luo, X.; Lai, Y.; Niu, F.; Gao, J. Numerical investigation on thermal insulation layer of a tunnel in seasonally frozen regions. Appl. Therm. Eng. 2018, 138, 280–291. [Google Scholar] [CrossRef]
- Zhao, P.; Chen, J.; Luo, Y.; Chen, L.; Li, Y.; Wang, C. Investigation of the insulation effect of thermal insulation layer in the seasonally frozen region tunnel: A case study in the Zuomutai tunnel, China. Adv. Civ. Eng. 2019, 2019, 1–14. [Google Scholar] [CrossRef]
- Liu, W.V.; Apel, D.B.; Bindiganavile, V.S.; Szymanski, J.K. Analytical and numerical modeling for the effects of thermal insulation in underground tunnels. Int. J. Min. Sci. Technol. 2016, 26, 267–276. [Google Scholar] [CrossRef]
- Zhang, X.; Zhou, Z.; Li, J.; Zhou, Y.; Han, F. A physical model experiment for investigating into temperature redistribution in surrounding rock of permafrost tunnel. Cold Reg. Sci. Technol. 2018, 151, 47–52. [Google Scholar] [CrossRef]
- Li, Y.; Wang, H.; Yang, L.; Su, S. Study on water absorption and thermal conductivity of tunnel insulation materials in a cold region under freeze-thaw conditions. Adv. Mater. Sci. Eng. 2020, 2020, 1–11. [Google Scholar] [CrossRef]
- Zhang, X.; Lai, Y.; Yu, W.; Zhang, S. Non-linear analysis for the freezing–thawing situation of the rock surrounding the tunnel in cold regions under the conditions of different construction seasons, initial temperatures and insulations. Tunn. Undergr. Space Technol. 2002, 17, 315–325. [Google Scholar] [CrossRef]
- Wang, Z.; Dong, C.-S.; Han, C.-L.; Li, Y. Service performance prediction model of tunnel structure in alpine freezing-thawing environment. Jiaotong Yunshu Gongcheng Xuebao/J. Traffic Transp. Eng. 2016, 16, 133–140. [Google Scholar]
- Zhou, Y.; Zhang, X. Optimization design of parameters for the thermal insulation layer in permafrost tunnelling. Mod. Tunn. Technol. 2014, 51, 127–132. [Google Scholar] [CrossRef]
- Liu, L.; Li, Z.; Liu, X.; Li, Y. Frost front research of a cold-region tunnel considering ventilation based on a physical model test. Tunn. Undergr. Space Technol. 2018, 77, 261–279. [Google Scholar] [CrossRef]
- Tan, X.; Chen, W.; Yang, D.; Dai, Y.; Wu, G.; Yang, J.; Yu, H.; Tian, H.; Zhao, W. Study on the influence of airflow on the temperature of the surrounding rock in a cold region tunnel and its application to insulation layer design. Appl. Therm. Eng. 2014, 67, 320–334. [Google Scholar] [CrossRef]
- Wang, Y.-J.; Zhou, G.-Q.; Wu, L. Unsteady heat-moisture transfer of wet airway in deep mining. J. Cent. South Univ. 2013, 20, 1971–1977. [Google Scholar] [CrossRef]
- Liu, W.; Feng, Q.; Wang, C.; Lu, C.; Xu, Z.; Li, W. Analytical solution for three-dimensional radial heat transfer in a cold-region tunnel. Cold Reg. Sci. Technol. 2019, 164, 102787. [Google Scholar] [CrossRef]
- Zhou, Y.; Zhang, X.; Deng, J. A mathematical optimization model of insulation layer’s parameters in seasonally frozen tunnel engineering. Cold Reg. Sci. Technol. 2014, 101, 73–80. [Google Scholar] [CrossRef]
- Zhang, G.; Guo, Y.; Zhou, Y.; Ye, M.; Chen, R.; Zhang, H.; Yang, J.; Chen, J.; Zhang, M.; Lian, Y.; et al. Experimental study on the thermal performance of tunnel lining GHE under groundwater flow. Appl. Therm. Eng. 2016, 106, 784–795. [Google Scholar] [CrossRef]
- Bahadori, A.; Vuthaluru, H.B. A simple correlation for estimation of economic thickness of thermal insulation for process piping and equipment. Appl. Therm. Eng. 2010, 30, 254–259. [Google Scholar] [CrossRef]
- Li, Y.; Sun, Y.; Zhuang, Y.; Duan, L.; Xie, K. Thermal conductivity characteristics of thermal insulation materials immersed in water for cold-region tunnels. Adv. Mater. Sci. Eng. 2020, 2020, 1–15. [Google Scholar] [CrossRef] [Green Version]
- Al-Homoud, M.S. Performance characteristics and practical applications of common building thermal insulation materials. Build. Environ. 2005, 40, 353–366. [Google Scholar] [CrossRef]
- Tang, S.; Luo, J.; Tang, C. Theoretical and numerical study on the cryogenic fracturing in rock. Rock Mech. Rock Eng. 2018, 37, 1596–1607. [Google Scholar]
- Tang, S.; Wang, J.; Chen, P. Theoretical and numerical studies of cryogenic fracturing induced by thermal shock for reservoir stimulation. Int. J. Rock Mech. Min. Sci. 2020, 125, 104160. [Google Scholar] [CrossRef]
- Huang, X.; Tang, C.; Tang, S.; Xie, L.M. Numerical Test of Thermal Cracking Behavior in a Nuclear Waste Disposal; International Society for Rock Mechanics: Jeju, Korea, 2017; pp. 159–162. ISBN 9791156103158. [Google Scholar]
- Kang, F.; Li, Y.; Tang, C. Grain size heterogeneity controls strengthening to weakening of granite over high-temperature treatment. Int. J. Rock Mech. Min. Sci. 2021, 145, 104848. [Google Scholar] [CrossRef]
- Kang, F.; Tang, C. Overview of enhanced geothermal system (EGS) based on excavation. Earth Sci. Front. 2020, 27, 185–193. [Google Scholar]
- Tang, C. Numerical simulation of progressive rock failure and associated seismicity. Int. J. Rock Mech. Min. Sci. 1997, 34, 249–261. [Google Scholar] [CrossRef]
- Tang, C.; Kaiser, P.K. Numerical simulation of cumulative damage and seismic energy release during brittle rock fail-urepart I: Fundamentals. Int. J. Rock Mech. Min. Sci. 1998, 35, 113–121. [Google Scholar] [CrossRef]
- Kaiser, P.; Tang, C. Numerical simulation of damage accumulation and seismic energy release during brittle rock failure—part II: Rib pillar collapse. Int. J. Rock Mech. Min. Sci. 1998, 35, 123–134. [Google Scholar] [CrossRef]
- Huang, X.; Tang, S.; Tang, C.; Xie, L.; Tao, Z. Numerical simulation of cracking behavior in artificially designed rock models subjected to heating from a central borehole. Int. J. Rock Mech. Min. Sci. 2017, 98, 191–202. [Google Scholar] [CrossRef]
- Tang, S.; Zhang, H.; Tang, C.; Liu, H. Numerical model for the cracking behavior of heterogeneous brittle solids subjected to thermal shock. Int. J. Solids Struct. 2016, 80, 520–531. [Google Scholar] [CrossRef]
- Burkan Isgor, O.; Razaqpur, A. Finite element modeling of coupled heat transfer, moisture transport and carbonation processes in concrete structures. Cem. Concr. Compos. 2004, 26, 57–73. [Google Scholar] [CrossRef]
- Li, T.; Tang, C.; Rutqvist, J.; Hu, M. TOUGH-RFPA: Coupled thermal-hydraulic-mechanical Rock Failure Process Analysis with application to deep geothermal wells. Int. J. Rock Mech. Min. Sci. 2021, 142, 104726. [Google Scholar] [CrossRef]
- Tomiczek, K. A note on the damage variable D for selected rocks in uniaxial tension. 2006; Unpublished. [Google Scholar]
- Vosteen, H.-D.; Schellschmidt, R. Influence of temperature on thermal conductivity, thermal capacity and thermal diffusivity for different types of rock. Phys. Chem. Earth Parts A/B/C 2003, 28, 499–509. [Google Scholar] [CrossRef]
- Yu, W.; Lu, Y.; Han, F.; Liu, Y.; Zhang, X. Dynamic process of the thermal regime of a permafrost tunnel on Tibetan Plateau. Tunn. Undergr. Space Technol. 2018, 71, 159–165. [Google Scholar] [CrossRef]
- Nematchoua, M.K.; Raminosoa, R.; Chrysostome, R.; Mamiharijaona, R.; René, T.; Orosa, J.A.; Elvis, W.; Meukam, P. Study of the economical and optimum thermal insulation thickness for buildings in a wet and hot tropical climate: Case of Cameroon. Renew. Sustain. Energy Rev. 2015, 50, 1192–1202. [Google Scholar] [CrossRef] [Green Version]
- Daouas, N.; Hassen, Z.; Ben Aissia, H. Analytical periodic solution for the study of thermal performance and optimum insulation thickness of building walls in Tunisia. Appl. Therm. Eng. 2010, 30, 319–326. [Google Scholar] [CrossRef]
- Çomaklı, K.; Yüksel, B. Environmental impact of thermal insulation thickness in buildings. Appl. Therm. Eng. 2004, 24, 933–940. [Google Scholar] [CrossRef]
- Lai, Y.; Zhang, X.; Yu, W.; Zhang, S.; Liu, Z.; Xiao, J. Three-dimensional nonlinear analysis for the coupled problem of the heat transfer of the surrounding rock and the heat convection between the air and the surrounding rock in cold-region tunnel. Tunn. Undergr. Space Technol. 2005, 20, 323–332. [Google Scholar] [CrossRef]
- Rosti, B.; Omidvar, A.; Monghasemi, N. Optimum position and distribution of insulation layers for exterior walls of a building conditioned by earth-air heat exchanger. Appl. Therm. Eng. 2019, 163, 114362. [Google Scholar] [CrossRef]
- Oka, Y.; Oka, H. Velocity and temperature attenuation of a ceiling-jet along a horizontal tunnel with a flat ceiling and natural ventilation. Tunn. Undergr. Space Technol. 2016, 56, 79–89. [Google Scholar] [CrossRef]
- Kerezsi, B.B.; Kotousov, A.G.; Price, J.W.H. Features of fatigue crack growth due to repeated thermal shock. Fatigue Fract. Eng. Mater. Struct. 2002, 25, 215–222. [Google Scholar] [CrossRef]
- Król, R.; Kisielewski, W. Research of loading carrying idlers used in belt conveyor-practical applications. Diagnostyka 2014, 15, 67–74. [Google Scholar]
- Krol, R. Studies of the durability of belt conveyor idlers with working loads taken into account. IOP Conf. Ser.: Earth Environ. Sci. 2017, 95, 42054. [Google Scholar] [CrossRef] [Green Version]
- Król, R.; Kawalec, W.; Gladysiewicz, L. An effective belt conveyor for underground ore transportation systems. IOP Conf. Ser.: Earth Environ. Sci. 2017, 95, 42047. [Google Scholar] [CrossRef]


| Parameters | Values | Parameters | Values |
|---|---|---|---|
| Rock compressive strength σsr | 233.05 MPa | TIL compressive strength σsi | 200 MPa |
| Rock tensile strength σtr | 11.61 MPa | TIL tensile strength σti | 30 MPa |
| Rock thermal conductivity λr | 2.86 W/m/K | TIL thermal conductivity λi | 0.1 W/m/K |
| Rock specific heat capacity cr | 0.85 × 10⁶ J/(m3·K) | TIL specific heat capacity ci | 1 × 10⁶ J/(m3·K) |
| Rock Young’s modulus Er | 37.46 GPa | TIL Young’s modulus Ei | 20 GPa |
| Rock Poisson’s ratio | 0.25 | TIL Poisson’s ratio | 0.25 |
| Rock thermal expansion coefficient αr | 8 × 10⁻⁵ 1/K | TIL thermal expansion Coefficient αi | 1 × 10⁻⁵ 1/K |
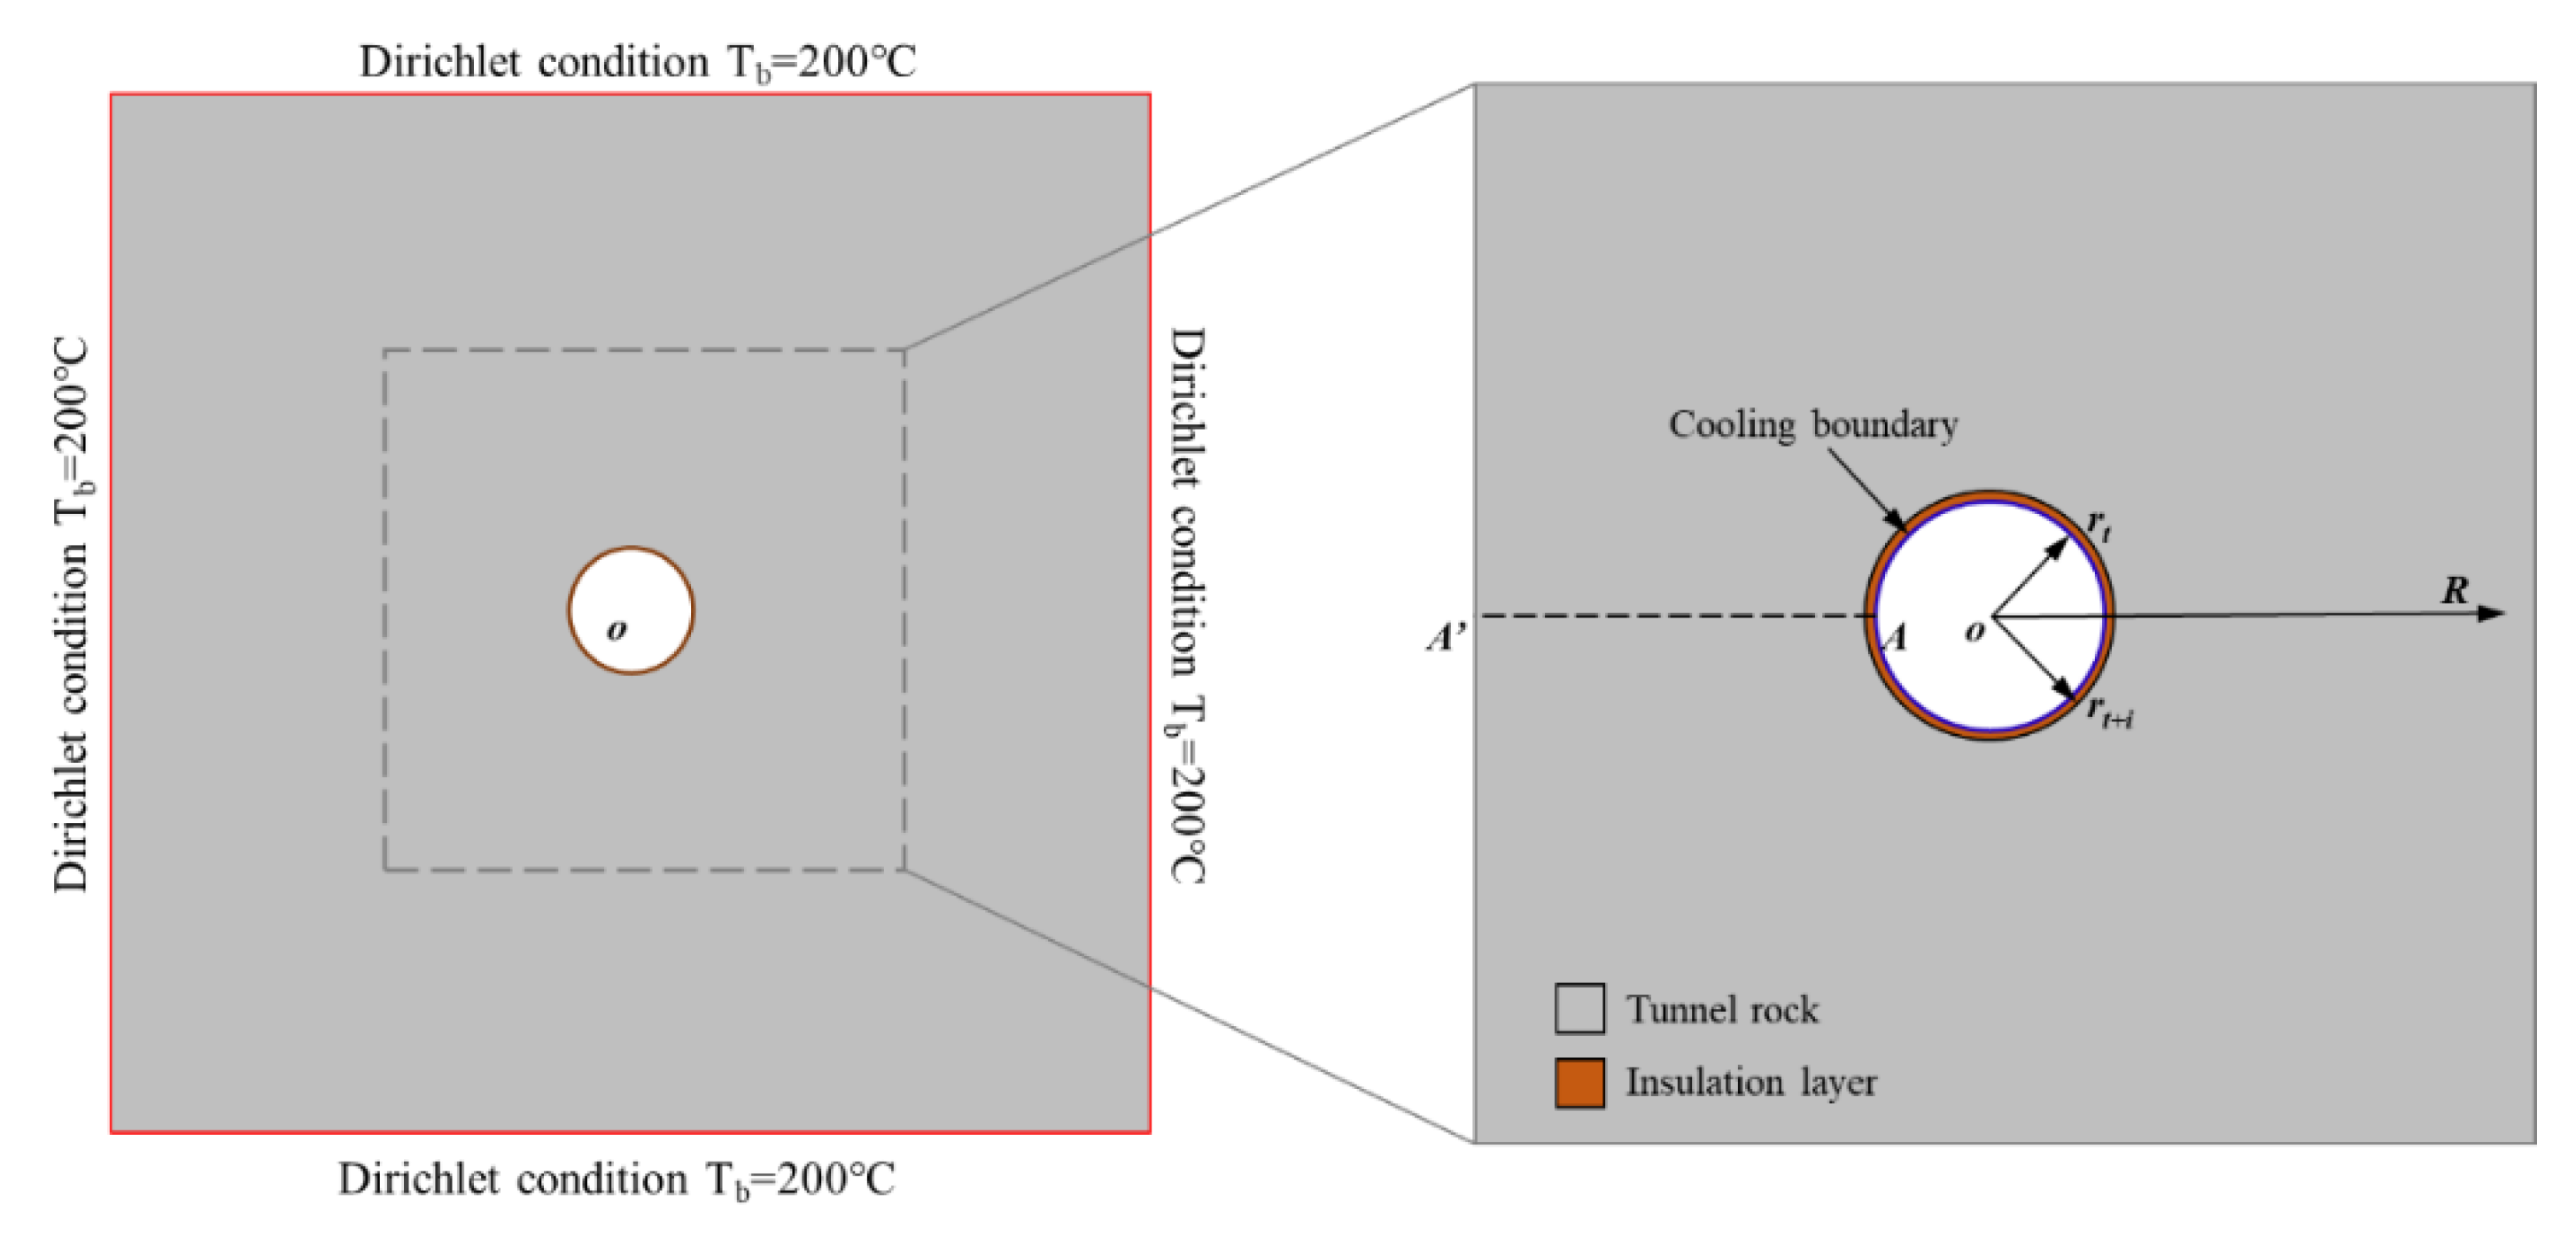
| Rock initial temperature Tr | 200 °C | TIL initial temperature Ti | 200 °C |
Publisher’s Note: MDPI stays neutral with regard to jurisdictional claims in published maps and institutional affiliations. |
© 2021 by the authors. Licensee MDPI, Basel, Switzerland. This article is an open access article distributed under the terms and conditions of the Creative Commons Attribution (CC BY) license (https://creativecommons.org/licenses/by/4.0/).
Share and Cite
Kang, F.; Li, Y.; Tang, C.; Li, T.; Wang, K. Numerical Study on Thermal Damage Behavior and Heat Insulation Protection in a High-Temperature Tunnel. Appl. Sci. 2021, 11, 7010. https://doi.org/10.3390/app11157010
Kang F, Li Y, Tang C, Li T, Wang K. Numerical Study on Thermal Damage Behavior and Heat Insulation Protection in a High-Temperature Tunnel. Applied Sciences. 2021; 11(15):7010. https://doi.org/10.3390/app11157010
Chicago/Turabian StyleKang, Fangchao, Yingchun Li, Chun’an Tang, Tianjiao Li, and Kaikai Wang. 2021. "Numerical Study on Thermal Damage Behavior and Heat Insulation Protection in a High-Temperature Tunnel" Applied Sciences 11, no. 15: 7010. https://doi.org/10.3390/app11157010
APA StyleKang, F., Li, Y., Tang, C., Li, T., & Wang, K. (2021). Numerical Study on Thermal Damage Behavior and Heat Insulation Protection in a High-Temperature Tunnel. Applied Sciences, 11(15), 7010. https://doi.org/10.3390/app11157010