
HMP-Coffee: A Hierarchical Multicriteria Model to Estimate the Profitability for Small Coffee Farming in Colombia

 , ,
, ,
Abstract
1. Introduction
2. Background and Related Work
2.1. Hierarchical Multicriteria Model
2.2. Hierarchical Multicriteria Approaches
3. Material and Methods
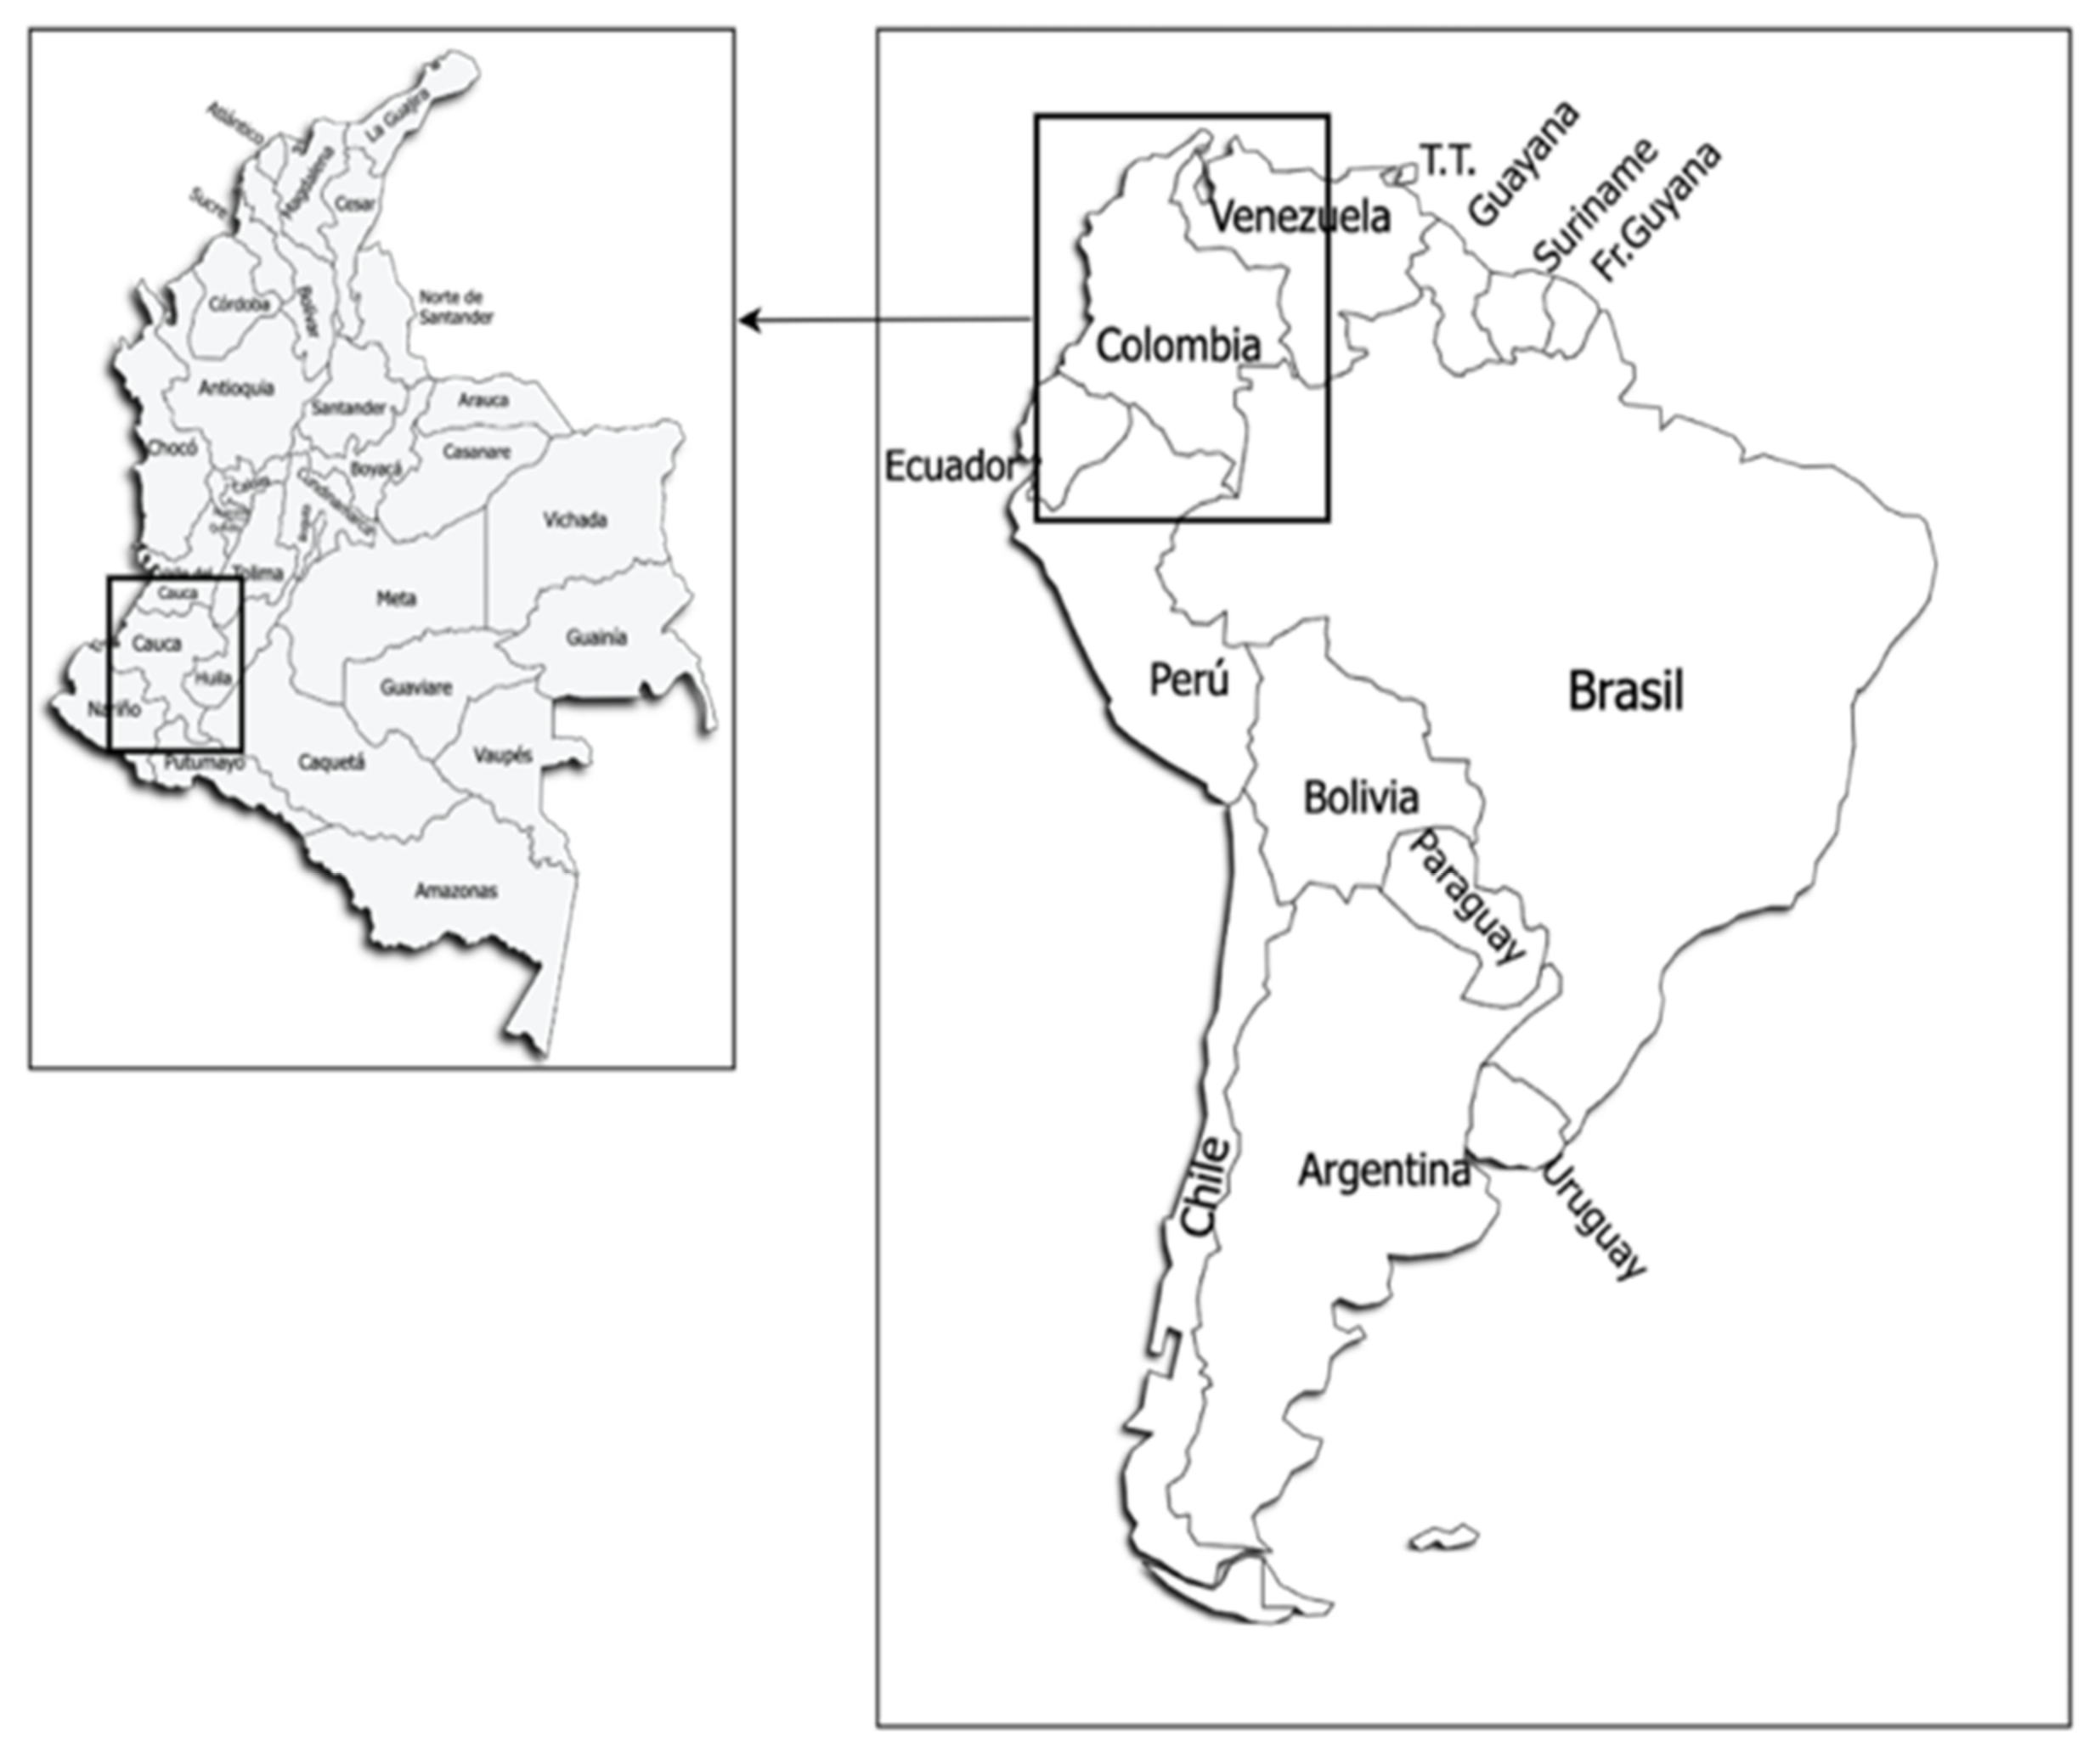
3.1. Study Area and Stakeholders
3.2. HMP-Coffee Model
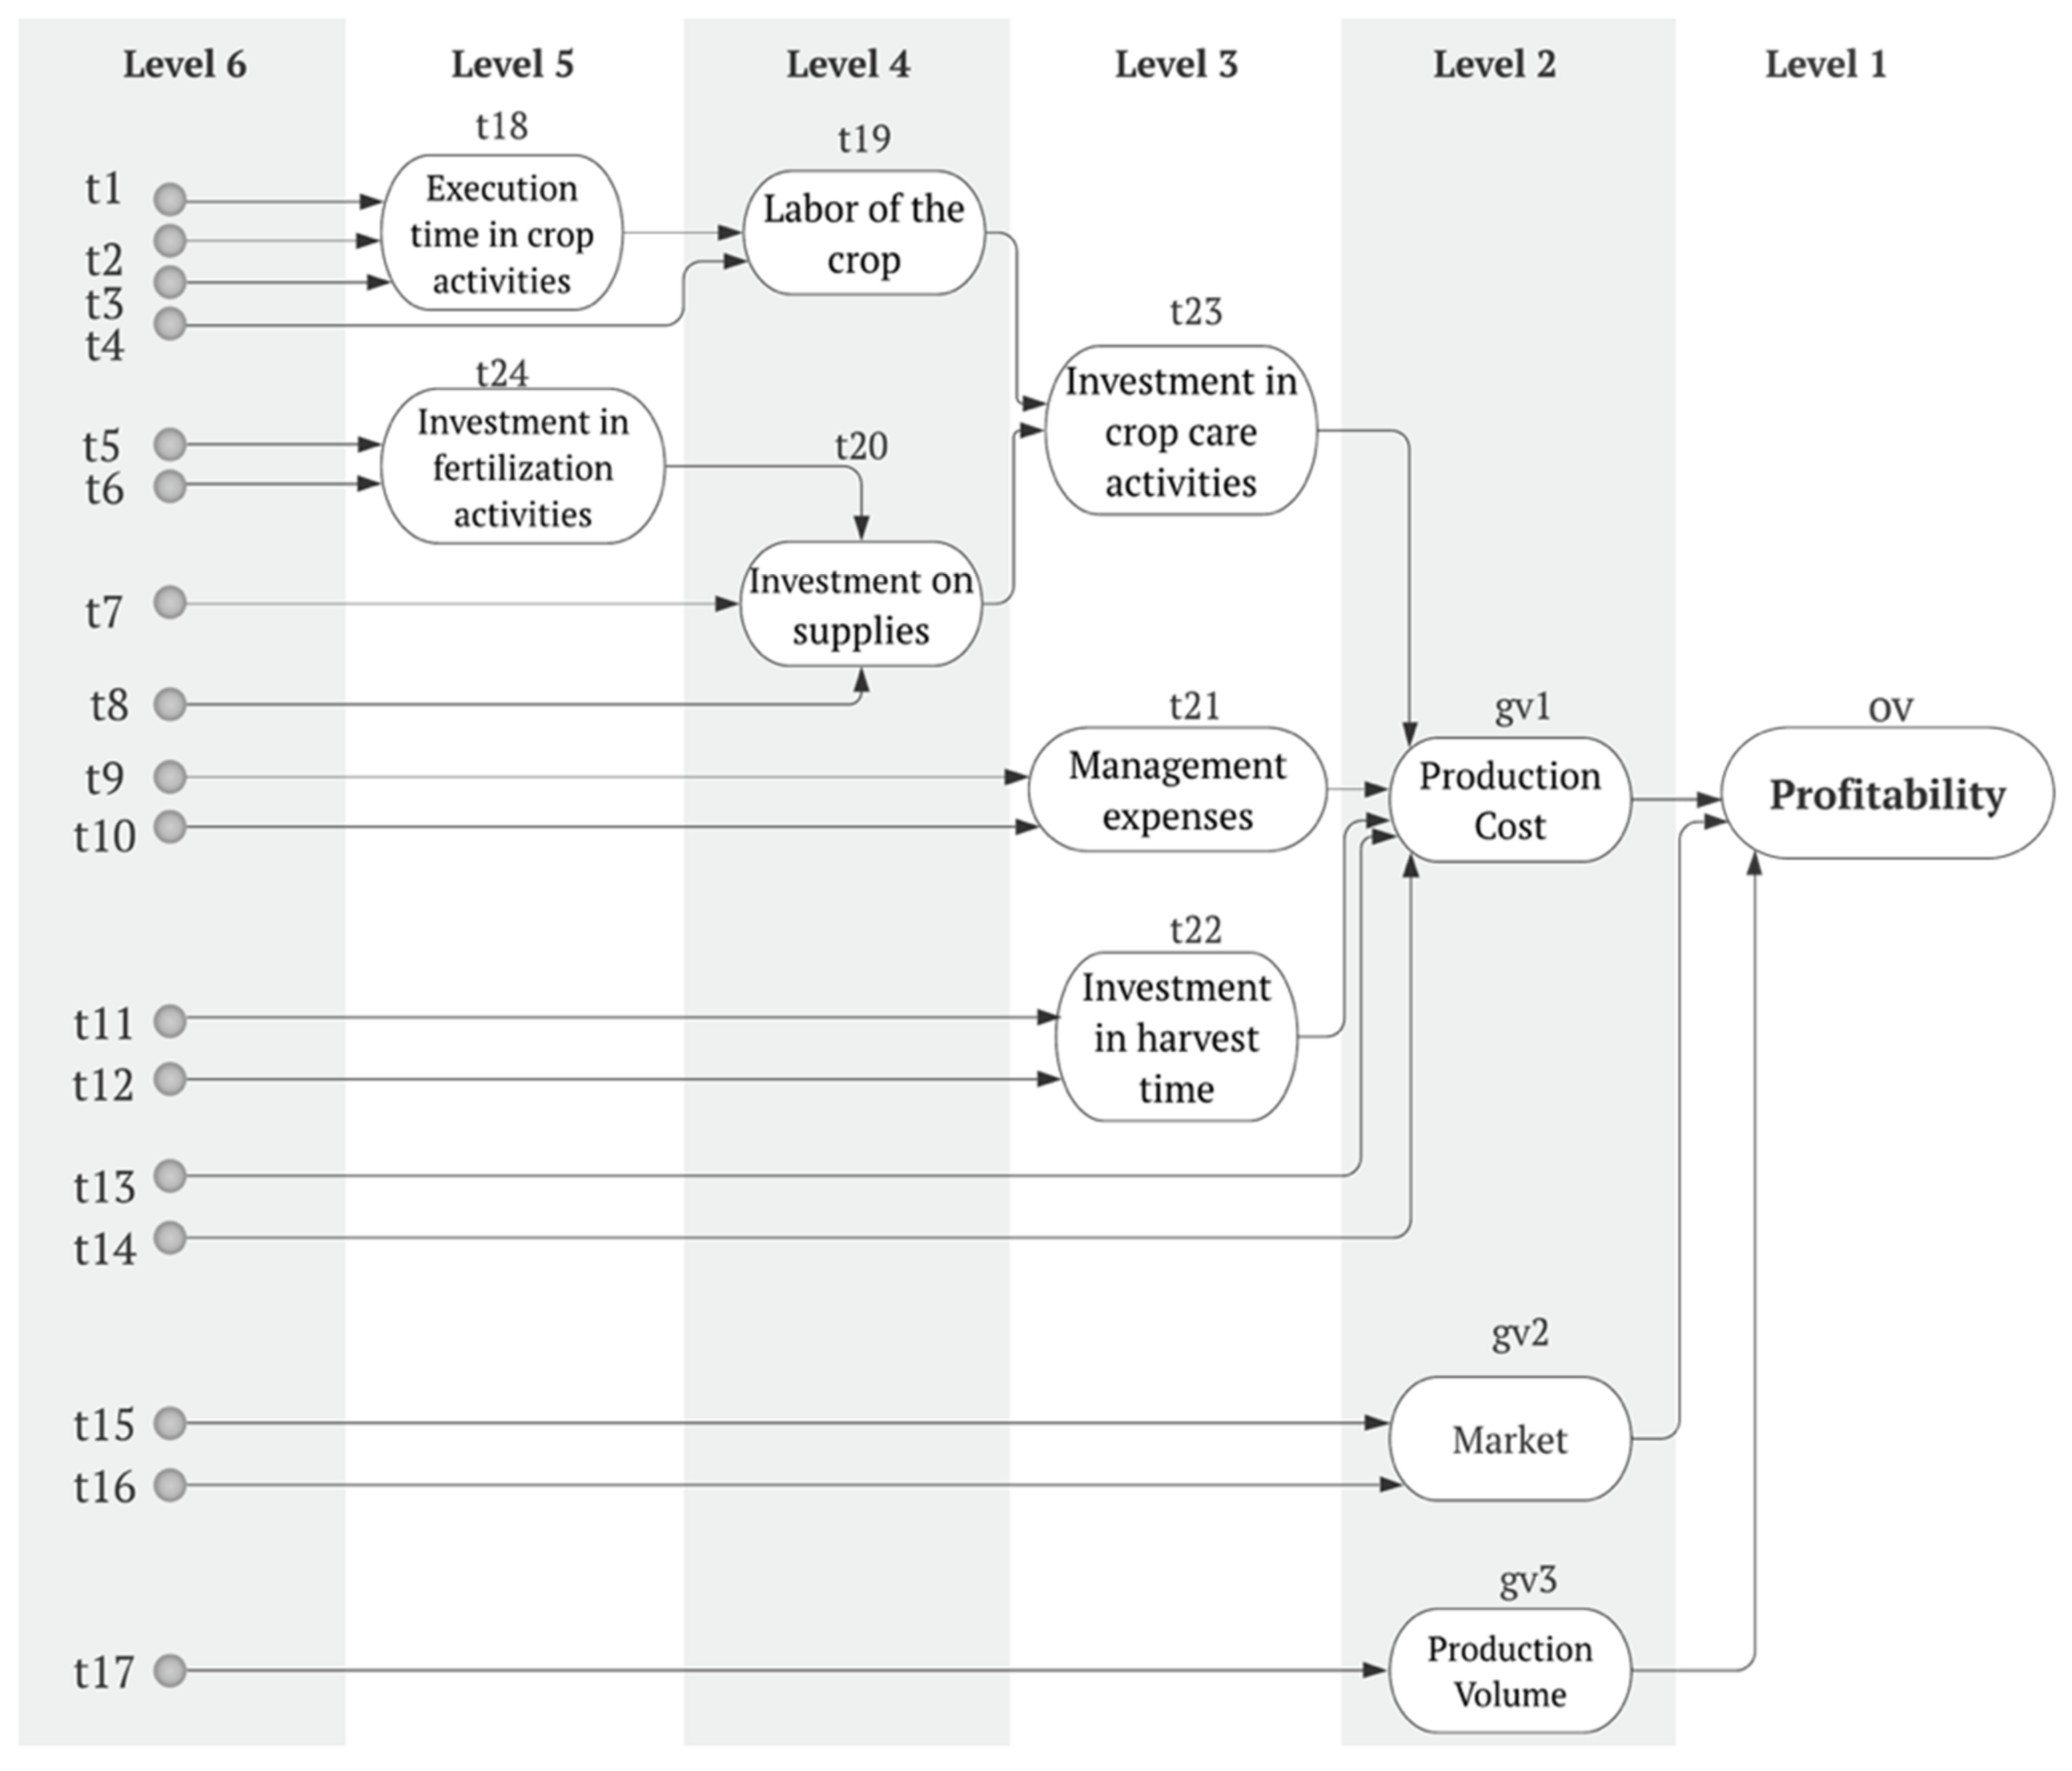
3.2.1. Contextual Knowledge Phase
- ▪
- Level 1 (Output variable) includes profitability (vo).
- ▪
- Level 2 (Global variables) contains production cost (gv1), production volume (gv2), and market (gv3).
- ▪
- Level 3 (Very High Generality) contains management expenses (t21), investment in harvest time (t22), and investment in crop care activities (t23)
- ▪
- Level 4 (High Generality) contains labor of the crop (t19), and investment on supplies (t20).
- ▪
- Level 5 (Medium Generality) contains execution time in crop activities (t18), investment in fertilization activities (24).
- ▪
- Level 6 (Specific) contains time spent on fertilization (t1), time spent on renovation (t2), time spent on Weed/Pest and diseases control (t3), price of the workforce (t4), investment in chemical fertilizers (t5), investment in organic fertilizers (t6), investment in weeds supplies(t7), investment in renovation supplies (t8), investment in maintenance (t9), transportation expenses (t10), payment for coffee harvesting(t11), implements for coffee pickers (12), investment in benefice coffee process (t13), investment in thresh coffee process (t14), variation in the USD price (t15) and the coffee price in the New York Stock Exchange (t16), and coffee production volume (t17).
- ▪
- Profitability is related to production cost (gv1), production volume (gv2), and market (gv3).
- ▪
- Production Cost has association with 20 concepts: time spent on fertilization (t1)/level 6, time spent on renovation (t2)/level 6, time spent on weed/pest and diseases control (t3)/level 6, price of workforce (t4)/level 6, investment in chemical fertilizers (t5)/level 6, investment in organic supplies (t6)/level 6, investment in weeding supplies(t7)/level 6, investment in renovation supplies (t8)/level 6, investment in maintenance (t9)/level 6, transportation expenses (t10)/level 6, payment for coffee harvesting(t11)/level 6, implements for coffee pickers (t12)/level 6, investment in postharvest processing (t13)/level 6, investment in thresh coffee process (t14)/level 6, execution time in crop activities (t18)/level 5, labor of the crop (t19)/level 4, investment on supplies (t20)/level 4, management expenses (t21)/level 3, investment in harvest time (t22)/level 3, investment in crop care activities (t23)/level 3, and investment in fertilization activities (t24)/level 5.
- ▪
- Production volume has a relationship with the concept coffee production volume (t17)/level 6.
- ▪
- Market has association with two concepts: variation in the USD price (t15)/level 6 and the coffee price in the New York Stock Exchange (t16)/level 6.
3.2.2. Hierarchical-Multicriteria Phase
4. Analysis and Results
4.1. The ICAFE Study Case
4.2. Discussion
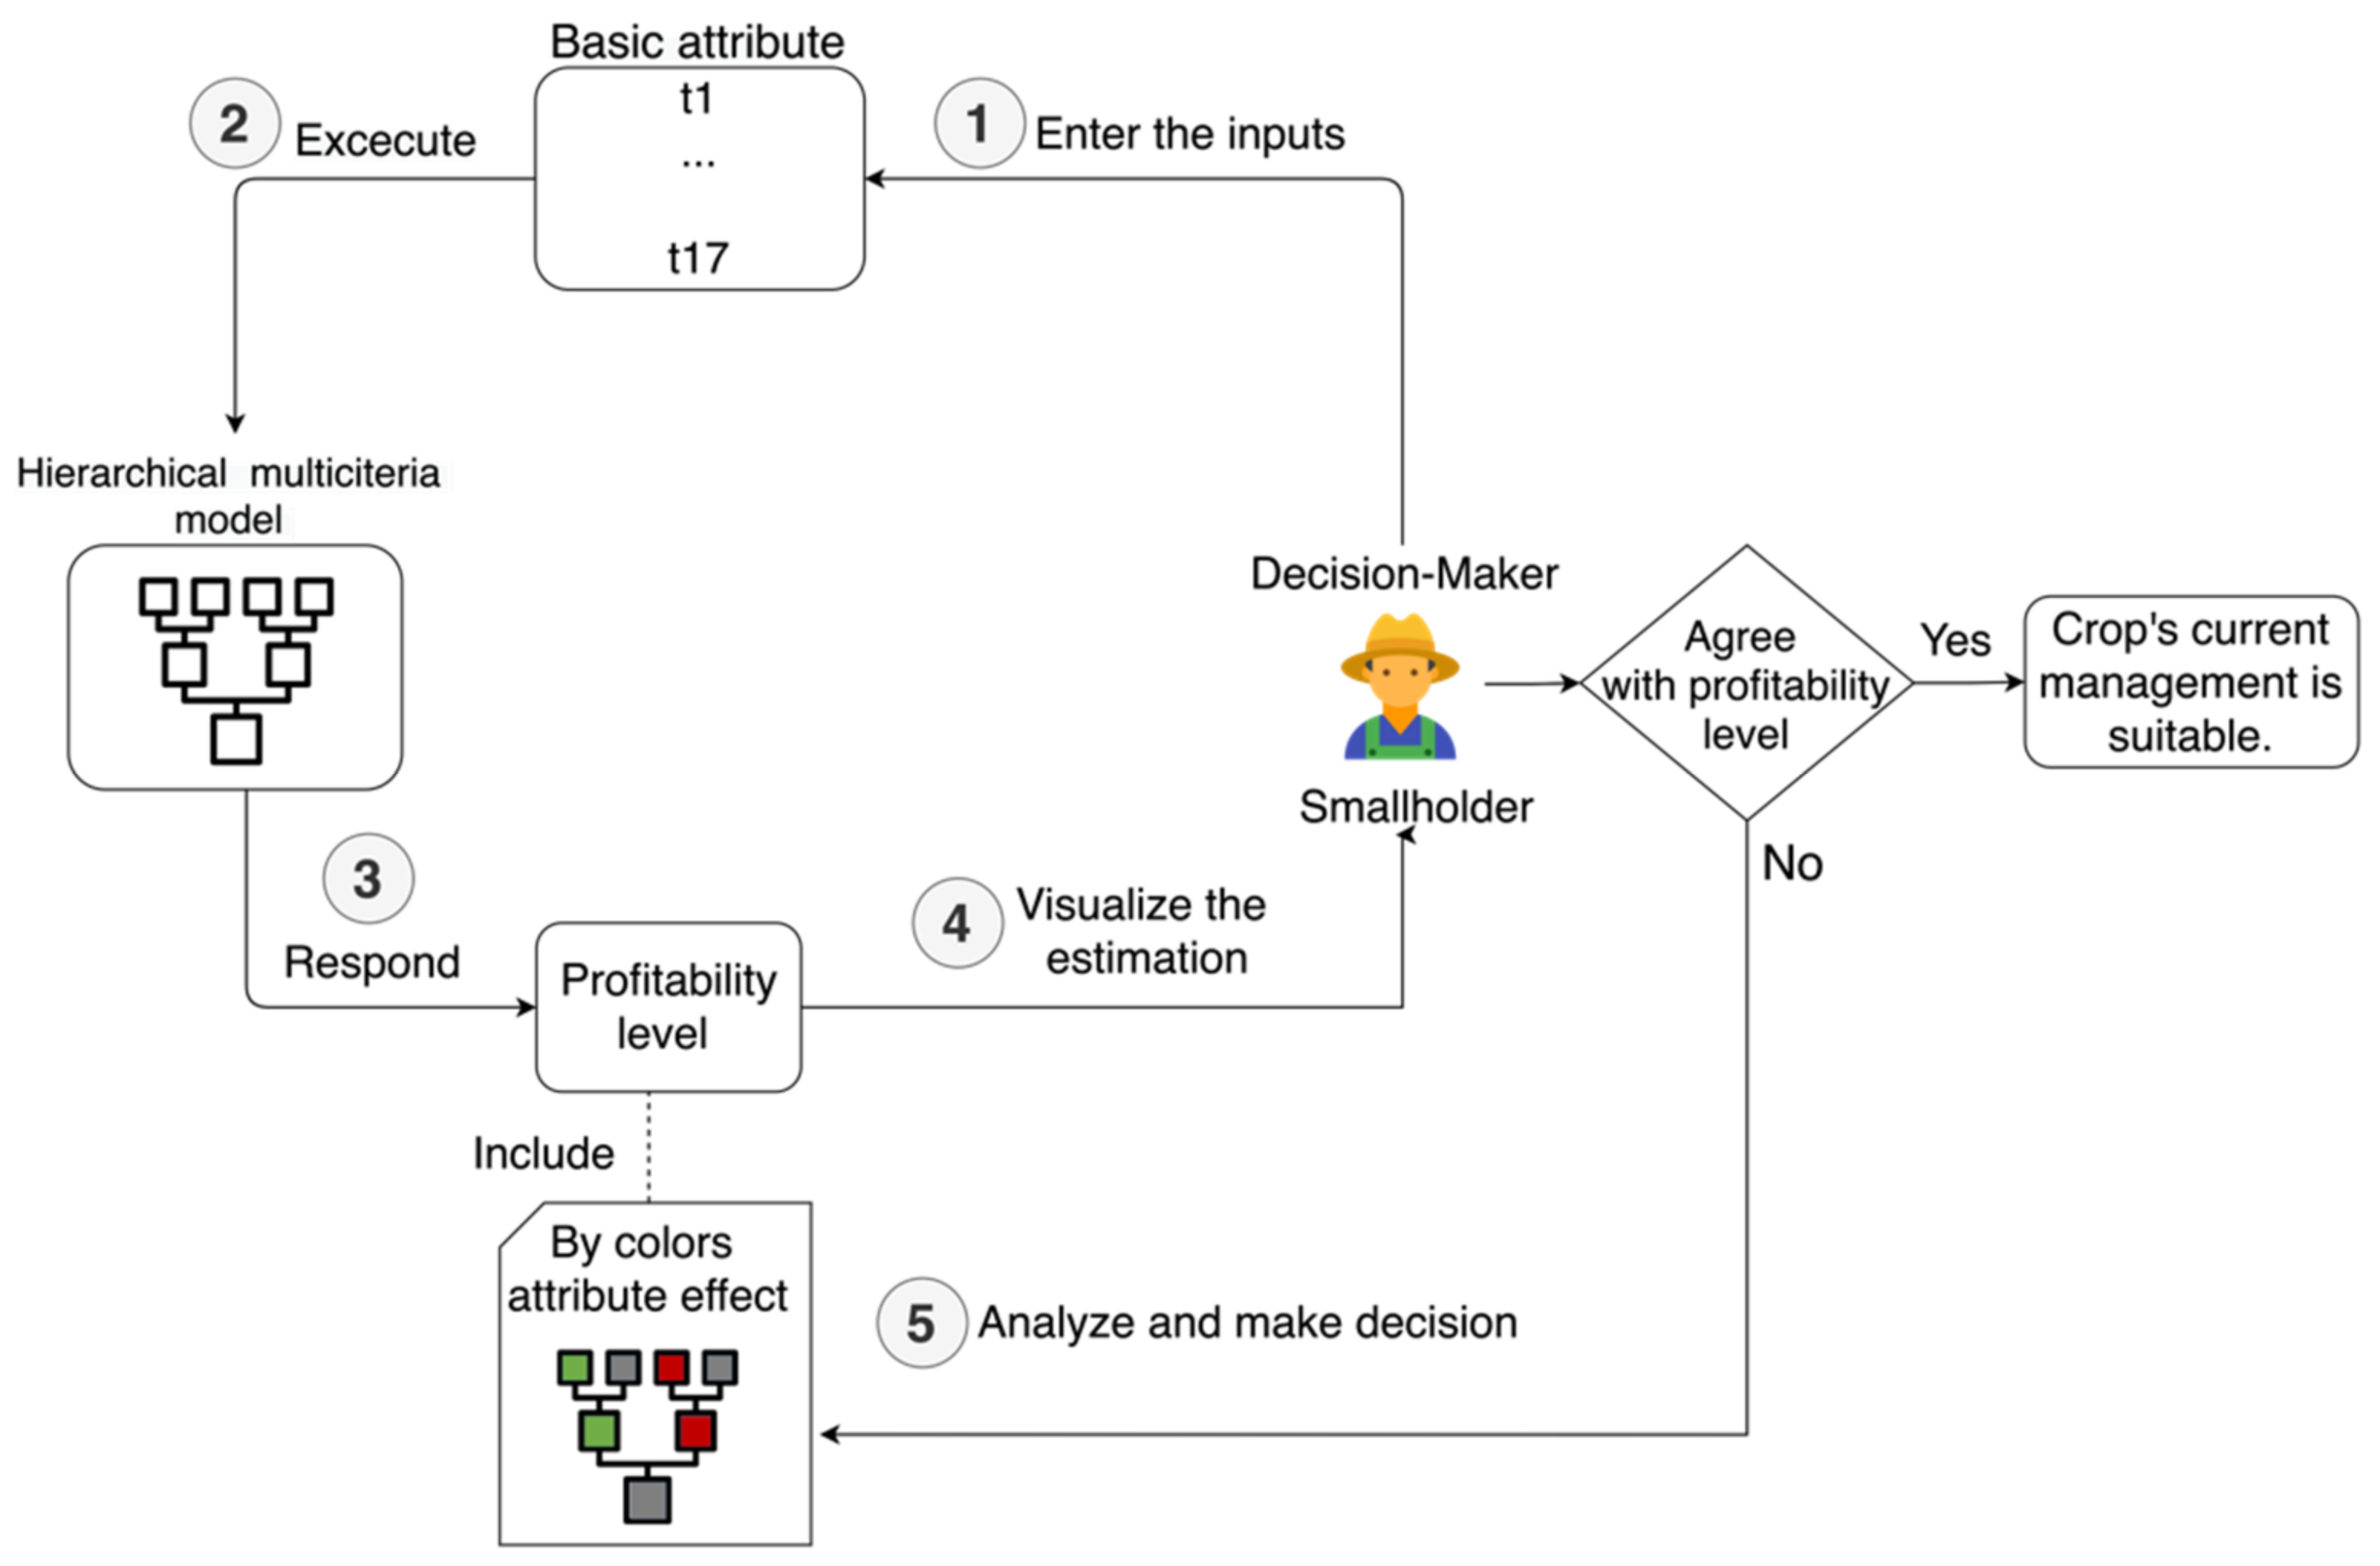
4.3. Practicability
- The smallholder sets up HMP-Coffee with the basic attributes.
- The smallholder executes HMP-Coffee to estimate the level of profitability of his/her small coffee production.
- The hierarchical multicriteria model responds with the estimation of profitability level “Favorable,” “Average,” and “Unfavorable”. The model shows the qualitative effect (represented by colors) of each attribute on the profitability level. The red color means a negative impact, the black one a neutral impact, and the green one a positive impact.
- The decision-maker visualizes the level of profitability of the crop.
- If the decision-maker agrees with the profitability level, it means that the crop’s current management is suitable. On the contrary, the smallholder could analyze the variables with a negative impact on the profitability level (i.e., the red color); apply one or more actions to improve the final result.
5. Conclusions and Future Work
Supplementary Materials
Author Contributions
Funding
Institutional Review Board Statement
Informed Consent Statement
Acknowledgments
Conflicts of Interest
References
- Daviron, B.; Ponte, S. The Coffee Paradox: Global Markets, Commodity Trade and the Elusive Promise of Development; Zed Books: Fort Collins, CO, USA, 2005; ISBN 978-1-84277-457-1. Available online: http://www.informationweek.com/news/201202317 (accessed on 2 April 2020).
- OEC—The Observatory of Economic Complexity. Available online: https://oec.world/ (accessed on 30 December 2020).
- Berdegué, J.A.; Fuentealba, R. The State of Smallholders in Agriculture in Latin America; Oxford University Press: Oxford, UK; ISBN 978-0-19-176824-8.
- Velez-Vallejo, R. Rentabilidad, Legitimidad y Resiliencia; Federacion Nacional de Cafeteros: Bogotá, Colombia, 2018; pp. 10–11. Available online: http://www.informationweek.com/news/201202317 (accessed on 2 April 2020).
- Poole, N. Smallholder Agriculture and Market Participation: Lessons from Africa, the Caribbean and the Pacific; FAO: Rome, Italy, 2017; ISBN 978-92-5-109939-1. [Google Scholar]
- Giovannucci, D.; Koekoek, F.J. The State of Sustainable Coffee: A Study of Twelve Major Markets; Social Science Research Network: Rochester, NY, USA, 2007. [Google Scholar]
- Kilian, B.; Jones, C.; Pratt, L.; Villalobos, A. Is Sustainable Agriculture a Viable Strategy to Improve Farm Income in Central America? A Case Study on Coffee. J. Bus. Res. 2006, 59, 322–330. [Google Scholar] [CrossRef]
- Dixon, J.; Gibbon, D.P.; Gulliver, A.; Hall, M. Farming Systems and Poverty: Improving Farmers’ Livelihoods in a Changing World; FAO: Rome, Italy; World Bank: Washington, DC, USA, 2001; ISBN 978-92-5-104627-2. [Google Scholar]
- De Salvo, M.; Begalli, D.; Capitello, R.; Agnoli, L.; Tabouratzi, E. Determinants of Winegrowers’ Profitability: Evidence from an Eastern Europe Wine Region. EuroMed J. Bus. 2017, 12, 300–315. [Google Scholar] [CrossRef]
- Hawes, C.; Young, M.W.; Banks, G.; Begg, G.S.; Christie, A.; Iannetta, P.P.M.; Karley, A.J.; Squire, G.R. Whole-Systems Analysis of Environmental and Economic Sustainability in Arable Cropping Systems: A Case Study. Agronomy 2019, 9, 438. [Google Scholar] [CrossRef]
- Rising, J.; Devineni, N. Crop Switching Reduces Agricultural Losses from Climate Change in the United States by Half. Nat. Commun. 2020, 11. [Google Scholar] [CrossRef]
- Shakoor, M.T.; Rahman, K.; Rayta, S.N.; Chakrabarty, A. Agricultural Production Output Prediction Using Supervised Machine Learning Techniques. In Proceedings of the 2017 1st International Conference on Next Generation Computing Applications (NextComp), Mauritius, 19–21 July 2017; pp. 182–187. [Google Scholar]
- Haaster, F.; Kleynhans, T. Decision Tree Modelling to Support Investment Decisions on Flower Production for the Northern Hemisphere. Agrekon 2002, 41, 75–96. [Google Scholar] [CrossRef]
- Milne, A.E.; Coleman, K.; Todman, L.C.; Whitmore, A.P. Model-Based Optimisation of Agricultural Profitability and Nutrient Management: A Practical Approach for Dealing with Issues of Scale. Environ. Monit. Assess. 2020, 192, 730. [Google Scholar] [CrossRef]
- Cardozo, N.P.; De Oliveira Bordonal, R.; Panosso, A.R.; Crusciol, C.A.C. A Multivariate Approach to Determine the Economic Profitability of Sugarcane Production under Diverse Climatic Conditions in Brazil. Sugar Tech 2020, 22, 954–966. [Google Scholar] [CrossRef]
- Stratigea, A. ICTs for Rural Development: Potential Applications and Barriers Involved. Netcom Réseaux Commun. Territ. 2011, 179–204. [Google Scholar] [CrossRef]
- International Coffee Organization. Available online: http://www.ico.org/ (accessed on 17 February 2021).
- Eje Económico FNC. Available online: https://federaciondecafeteros.org/wp/sostenibilidad/eje-economico/ (accessed on 16 December 2020).
- Bohanec, M. DEXi: A Program for Multi-Attribute Decision Making. Available online: http://kt.ijs.si/MarkoBohanec/dexi.html (accessed on 3 December 2020).
- Bockstaller, C.; Beauchet, S.; Manneville, V.; Amiaud, B.; Botreau, R. A Tool to Design Fuzzy Decision Trees for Sustainability Assessment. Environ. Model. Softw. 2017, 97, 130–144. [Google Scholar] [CrossRef]
- Andriantiatsaholiniaina, L.; Kouikoglou, V.; Phillis, Y. Evaluating Strategies for Sustainable Development: Fuzzy Logic Reasoning and Sensitivity Analysis. Ecol. Econ. 2004, 48, 149–172. [Google Scholar] [CrossRef]
- Wielinga, B.J.; Bredeweg, B. Knowledge and Expertise in Expert Systems. In Human-Computer Interaction; van der Veer, G.C., Mulder, G., Eds.; Springer: Berlin/Heidelberg, Germany, 1988; pp. 290–297. [Google Scholar]
- Morales-Velasco, S.; Vivas-Quila, N.J.; Gomez-Medina, V. Variable Biophysics of Twelve Systems Agrosilvopastoriles in the Plateau of Popayán—Cauca. Biotecnol. Sect. Agropecu. Agroind. 2015, 13, 11–21. [Google Scholar] [CrossRef]
- Muñoz, C.J.M.; Muñoz, P.J.A.; Montes, R.C. Evaluation of Organic Manures in Lettuce and Cabbage Plants at Popayán, Cauca. Biotecnol. Sect. Agropecu. Agroind. 2015, 13, 73–82. [Google Scholar]
- Campo-Martínez, A.D.P.; Acosta-Sanchez, R.L.; Morales-Velasco, S.; Prado, F.A. Evaluation of Microorganisms of Mountain (Mm) in the Production of Chard on the Plateau of Popayán. Biotecnol. Sect. Agropecu. Agroind. 2014, 12, 79–87. [Google Scholar]
- Ordonez, A. La Sultana Farm. Available online: https://faca.unicauca.edu.co/cienciasagrarias/infraestructura (accessed on 3 December 2020).
- Adeli, H. Expert Systems in Construction and Structural Engineering; CRC Press: Boca Raton, FL, USA, 2003; ISBN 978-0-203-40110-1. [Google Scholar]
- Qi, J.; Wei, L.; Wan, Q. Multi-Level Granularity in Formal Concept Analysis. Granul. Comput. 2019, 4, 351–362. [Google Scholar] [CrossRef]
- Ahonen-Myka, H. Discovery of Frequent Word Sequences in Text. Comput. Vis. 2002, 2447. [Google Scholar] [CrossRef]
- ICAFE Costo de la Actividad Cafetalera. Available online: http://www.icafe.cr/sector-cafetalero/informacion-de-mercado/costo-de-la-actividad-cafetalera/ (accessed on 15 December 2020).
- Caravela Coffee. Available online: https://caravela.coffee/ (accessed on 17 February 2021).
- Guo, L.; Shi, F.; Tu, J. Textual Analysis and Machine Leaning: Crack Unstructured Data in Finance and Accounting. J. Financ. Data Sci. 2016, 2, 153–170. [Google Scholar] [CrossRef]
- Grömping, U. Using R and RStudio for Data Management, Statistical Analysis and Graphics (2nd Edition). J. Stat. Softw. 2015, 68. [Google Scholar] [CrossRef]
- Shadbolt, N.; Smart, P.R. Knowledge Elicitation: Methods, Tools and Techniques. In Evaluation of Human Work; Wilson, J.R., Sharples, S., Eds.; CRC Press: Boca Raton, FL, USA, 2015; pp. 163–200. ISBN 978-0-415-26757-1. [Google Scholar]
- Gonzalez-Perez, M.; Gutierrez-Viana, S. Cooperation in Coffee Markets: The Case of Vietnam and Colombia. J. Agribus. Dev. Emerg. Econ. 2012, 2, 57–73. [Google Scholar] [CrossRef]
- Bohanec, M.; Žnidaršič, M.; Rajkovic, V.; Bratko, I.; Zupan, B. DEX Methodology: Three Decades of Qualitative Multi-Attribute Modeling. Informatica 2013, 37, 49–54. [Google Scholar]
- O’Donnell, C.J. Measuring and Decomposing Agricultural Productivity and Profitability Change. Aust. J. Agric. Resour. Econ. 2010, 54, 527–560. [Google Scholar] [CrossRef]
- Drakopoulos, S.A.; Grimani, K. Maslow’s Needs Hierarchy and the Effect of Income on Happiness Levels. Available online: https://mpra.ub.uni-muenchen.de/50987/ (accessed on 27 April 2021).
- Asociacion Cafiambiente del Cauca. Available online: http://colombiapymes.com/ficha/asociacion-cafiambiente-cauca-208962 (accessed on 17 February 2021).
- Pinto, L.F.G.; Gardner, T.; McDermott, C.L.; Ayub, K.O.L. Group Certification Supports an Increase in the Diversity of Sustainable Agriculture Network–Rainforest Alliance Certified Coffee Producers in Brazil. Ecol. Econ. 2014, 107, 59–64. [Google Scholar] [CrossRef]
- Casilimas, L.; Corrales, D.C. Table Rules of HMP-Coffee Using Dexi. Available online: https://github.com/Leidy9428/HMP-Coffee/tree/main/Supplementary%20data (accessed on 15 March 2021).
- Berdegué, J.; Fuentealba, R. Latin America: The State of Smallholders in Agriculture. In Proceedings of the IFAD Conference on New Directions for Smallholder Agriculture, Rome, Italy, 24–25 January 2011. [Google Scholar] [CrossRef]
- Casilimas, L.; Corrales, D.C. Profitability in Small Coffee Crops. Available online: https://github.com/Leidy9428/HMP-Coffee/tree/main/ICAFE%20dataset%20test (accessed on 15 March 2021).
- Ali, M.; Son, D.-H.; Kang, S.-H.; Nam, S.-R. An Accurate CT Saturation Classification Using a Deep Learning Approach Based on Unsupervised Feature Extraction and Supervised Fine-Tuning Strategy. Energies 2017, 10, 1830. [Google Scholar] [CrossRef]
- Goutte, C.; Gaussier, E. A Probabilistic Interpretation of Precision, Recall and F-Score, with Implication for Evaluation. In Advances in Information Retrieval; Losada, D.E., Fernández-Luna, J.M., Eds.; Springer: Berlin/Heidelberg, Germany, 2005; pp. 345–359. [Google Scholar]
- International Coffee Council. Profitability of Coffee Farming in Selected Latin American Countries; International Coffee Council: Nairobi, Kenya, 2019; p. 19. [Google Scholar]
- De Janvry, A.; Sadoulet, E. World Poverty and the Role of Agricultural Technology: Direct and Indirect Effects. J. Dev. Stud. 2002, 38, 1–26. [Google Scholar] [CrossRef]
- Džamonja, M. Set Theory and Its Place in the Foundations of Mathematics: A New Look at an Old Question. J. Indian Counc. Philos. Res. 2017, 34, 415–424. [Google Scholar] [CrossRef][Green Version]
- Zhang, Q.; Xie, Q.; Wang, G. A Survey on Rough Set Theory and Its Applications. CAAI Trans. Intell. Technol. 2016, 1, 323–333. [Google Scholar] [CrossRef]
- Heubo-Kwegna, O. Fuzzy Logic versus Classical Logic: An Example in Multiplicative Ideal Theory. Adv. Fuzzy Syst. 2016, 2016. [Google Scholar] [CrossRef]


| Stakeholder Id | Area of Expertise | Years’ Experience | Experience | Organization |
|---|---|---|---|---|
| 1 | Agro-industrial Economic Problems | 28 | The agro-industrial transformation and the economy coffee activity. | Public university |
| 2 | Agribusiness | 10 | Strategies for the production and commercialization of organic coffee in developing countries | Experimental coffee farm |
| 3 | Agricultural management | 20 | Implementation of sustainability strategies on the experimental farm “La Sultana” and sustainable coffee certifications (e.g., Rainforest Alliance) | Experimental coffee farm |
| 4 | Agronomy, soil and water | 30 | Estimating technical and economic indicators on the benefit of coffee, characterization of integral and productive farms, and organic coffee production. | Public university |
| 5 | Agronomy engineering | 15 | Optimization of coffee transformation processes, the harvest, and the post-harvest of quality coffee. | Private coffee entity |
| 6 | Farm management | 18 | Practices for the management and administration of coffee crops in small coffee crops. | Coffee regulatory entity |
| Id | Concept | Description | Frequency |
|---|---|---|---|
| t1 | Fertilization time | Time spent in fertilizing the crop. | 80 |
| t2 | Renovation time | Time invested in the renewal of the crop. | 70 |
| t3 | Control time (Weed/Pest and diseases) | Time spent controlling weeds/pests and diseases in the crop. | 34 |
| t4 | Workforce | Average cost of wage. | 190 |
| t5 | Chemical fertilizers | Inputs for chemical fertilization. | 220 |
| t6 | Organic fertilizers | Inputs for Organic fertilization. | 153 |
| t7 | Weeds supplies | Inputs for chemical control by patches with the weed selector, control with machete or scythe. | 40 |
| t8 | Renovation supplies | Inputs for renewal of the crop. | 32 |
| t9 | Maintenance | Facilities maintenance expenses. | 124 |
| t10 | Transportation | Transportation of supplies and coffee. | 27 |
| t11 | Picking | Payment for coffee harvesting by kilograms, bushel, among other measures. | 87 |
| t12 | Implements | Provision of coffee pickers (e.g., Basket, gloves, etc.) | 13 |
| t13 | Benefit | Coffee benefit process. | 34 |
| t14 | Threshing | Coffee Threshing process | 18 |
| t15 | Exchange rate | The ratio of one currency (e.g., COP, CRC) to another (e.g., USD). | 45 |
| t16 | NY stock | Coffee price in the New York stock. | 16 |
| t17 | Volume | The volume of the harvest in @/ha. | 72 |
| t18 | Time | The general term that refers to the investment of time in caring for the crop. | 28 |
| t19 | Labor | All aspects related to the work of the crop, including the time labor, the price by wage, etc. | 54 |
| t20 | Supply | All supplies used in crop care work. | 99 |
| t21 | Management | Farm management costs, including payments for services, maintenance, among others. | 42 |
| t22 | Harvest | All aspects related to harvest, including picking, provision of coffee pickers, among others. | 90 |
| t23 | Crop care | All aspects related to crop care, including inputs, payment of wages, pests, and disease control, among others. | 19 |
| t24 | Fertilization | Fertilization activity, including organic and chemical fertilization. | 99 |
| ID | Concept | Explainable Names | Grid 1 Relationship Level | Grid 2 Generality Level | |||||
|---|---|---|---|---|---|---|---|---|---|
| gv1 | gv2 | gv3 | vhg | hg | mg | s | |||
| t1 | Fertilization time | Time spent on fertilization | 3.4 | 2.8 | 1.6 | 3.4 | 2.8 | 2.8 | 3.8 |
| t2 | Renovation time | Time spent on renovation | 3.2 | 2.6 | 2 | 2.6 | 3.4 | 3.4 | 4 |
| t3 | Control time (Weed/Pest and diseases) | Time spent on Weed/Pest and diseases control | 3.2 | 2 | 2.4 | 2 | 2.6 | 2.6 | 4 |
| t4 | Workforce | Price of workforce | 3.8 | 1.6 | 2 | 1.6 | 3 | 3.2 | 3.4 |
| t5 | Chemical fertilizers | Investment in chemical fertilizers | 3.2 | 1.6 | 3 | 2 | 2.8 | 3 | 3.4 |
| t6 | Organic fertilizers | Investment in organic fertilizers | 3.4 | 2 | 1.6 | 1.6 | 2.6 | 2.8 | 3.2 |
| t7 | Weeds supplies | Investment in weeds supplies | 3.2 | 2.8 | 2 | 3.4 | 2 | 3.4 | 2.8 |
| t8 | Renovation supplies | Investment in renovation supplies | 3.4 | 3.4 | 2 | 2.6 | 2.8 | 2.6 | 3.4 |
| t9 | Maintenance | Investment in Maintenance | 3.2 | 2.6 | 2.8 | 2 | 3.4 | 3.6 | 3.8 |
| t10 | Transportation | Transportation expenses | 3.8 | 2 | 3.4 | 1.6 | 2.6 | 2.8 | 3.2 |
| t11 | Picking | Payment for coffee harvesting | 3.4 | 1.6 | 2.4 | 3 | 2 | 3.4 | 3 |
| t12 | Implements | Implements for coffee pickers | 2.6 | 2 | 2 | 2 | 3.4 | 2.6 | 2.8 |
| t13 | Benefit | Investment in benefice coffee process | 2.6 | 1.6 | 3 | 2 | 2.6 | 2 | 2.4 |
| t14 | Thresh | Investment in thresh coffee process | 3 | 2.6 | 1.2 | 1.6 | 2 | 1.6 | 2.6 |
| t15 | Exchange rate | Variation in the USD dollar price | 2 | 2.6 | 3.8 | 2 | 1.6 | 2 | 2.6 |
| t16 | NY stock exchange | The coffee price in the New York Stock Exchange | 3 | 2.6 | 3.4 | 3.2 | 2.6 | 2 | 3.4 |
| t17 | Volume | Coffee production volume | 1.6 | 4 | 2 | 2 | 1.6 | 2.6 | 2.8 |
| t18 | Time | Execution time in crop activities | 1.6 | 2 | 1.6 | 1.6 | 2.6 | 3.4 | 2 |
| t19 | Labor | Labor of the crop | 2 | 2 | 2 | 2 | 3,8 | 3 | 2.6 |
| t20 | Supply | Investment on supplies | 2.8 | 1.6 | 1.6 | 3 | 3.4 | 2.8 | 2 |
| t21 | Management | Management expenses | 3.4 | 2 | 2.6 | 3.4 | 2.8 | 3 | 2.6 |
| t22 | Harvest | Investment in harvest time | 2.6 | 2.8 | 2.6 | 3.8 | 3.4 | 2.6 | 2 |
| t23 | Care | Investment in crop care activities | 2 | 2.6 | 2 | 3.8 | 2.6 | 2 | 3.4 |
| t24 | Fertilization | Investment in fertilization activities | 3 | 2.8 | 1.6 | 2.8 | 3 | 3.4 | 2 |
| Id | Basic Attributes | Qualitative Scale | Unit | ||
|---|---|---|---|---|---|
| Low time | Average time | High time | |||
| t1 | Time spent on fertilization | <98.7 | 98.7–99.25 | 99.25–99.8 | Hours |
| t2 | Time spent on renovation | <6.8 | 6.8–8.6 | 8.6–10.4 | |
| t3 | Time spent on weed/pest and diseases control | <129.4 | 129.4–143.2 | 143.2–157 | |
| Cheap | Average | Expensive | |||
| t4 | Price of workforce | 680.24–895.93 | 895.93–1111.62 | 1111.62–1327.31 | CRC |
| Low cost | Moderate cost | High cost | |||
| t5 | Chemical fertilizers | 4597.43–6500 | 6500–9500 | 8817.09–11630.21 | CRC |
| t6 | Organic fertilizers | 1321.56–1793.25 | 1793.25–2736.63 | 2736.63–3308.32 | |
| t7 | Weeds supplies | 1089–1569.87 | 1569.87–2050.14 | 2050.14–2530.71 | |
| t8 | Renovation supplies | 377.917–844.197 | 844.197–1310.47 | 1310.47–1776.746 | |
| Low expenses | Moderate expenses | High expenses | |||
| t9 | Maintenance | 5060.26–6976.353 | 6976.353–8892.447 | 8892.447–10808.54 | CRC |
| t10 | Transportation expenses | 459.916–1063.037 | 1063.037–2269.279 | 2269.279–2872.4 | |
| Cheap | Average | Expensive | |||
| t11 | Payment for coffee harvesting | 13609.39–16802.9 | 16802.9–19996.41 | 19996.41–23189.92 | CRC |
| Low investment | Moderate investment | High investment | |||
| t12 | Implements for coffee pickers | 65.25–<86 | 86–87 | >87–107.049 | CRC |
| t13 | Benefice coffee process | 5512.327–6895.7711 | 6895.7711–8279.05 | 8279.05–9662.389 | |
| t14 | Thresh coffee process | 2000.828–2446.986 | 2446.986–2893.145 | 2893.145–3339.303 | |
| Favorable | Moderate | Unfavorable | |||
| t15 | USD price | 557.303–585.65 | 528.957–557.303 | 500.61–528.957 | USD |
| t16 | The coffee price in the New York Stock Exchange | 183.07–255.16 | 147.025–183.07 | 110.98–147.025 | |
| High production | Average production | Low production | |||
| t17 | Coffee production volume | ≤24.4 | >24.4–<37.4 | ≥37.4 | Bsh/ha |
| Favorable | Average | Unfavorable | |||
| vo | Level of profitability | ≥1.4 | 1 ≤ Pr < 1.4 | ≤1 | |
| Attribute | Weight-Based La Sultana Farm’s Operation | ||||
|---|---|---|---|---|---|
| Weight 1 | Weight 2 | Weight 3 | Weight 4 | Weight 5 | |
| vo: Crop’s final profitability level | =100% | ||||
| gv1: Production Costs | 40% | ||||
| t19: Labor of the crop | 42.60% | ||||
| t23: Investment in crop care activities | 56% | ||||
| t18: Execution time in crop activities | 70% | ||||
| t1: Time spent on fertilization | 25% | ||||
| t2: Time spent on renovation | 56% | ||||
| t3: Time spent on weed/pest and diseases control | 18% | ||||
| t4: Price of workforce | 30% | ||||
| t20: Investment on Supplies | 44% | ||||
| t24: Investment in fertilization activities | 79.83% | ||||
| t5: Chemical fertilizers | 21% | ||||
| t6: Organic fertilizers | 79% | ||||
| t7: Weeds supplies | 13% | ||||
| t8: Renovation supplies | 7.13% | ||||
| t22: Management expenses | 15.80% | ||||
| t9: Maintenance | 71% | ||||
| t10: Transportation expenses | 29% | ||||
| t22: Investment in harvest time | 32.84% | ||||
| t11: Payment for coffee harvesting | 99% | ||||
| t12: Implements for coffee pickers | 1% | ||||
| t13: Benefice coffee process | 5.03% | ||||
| t14: Thresh coffee process | 3.05% | ||||
| gv2: Production Volume | 40% | ||||
| t17: Coffee volume production | |||||
| gv3: International Market | 20% | ||||
| t15: USD price | 50% | ||||
| t16: The coffee price in the New York Stock Exchange | 50% | ||||
| Predicted | Class 1: Favorable | Class 2: Average | Class 3: Unfavorable | |
|---|---|---|---|---|
| Real | ||||
| Class 1: Favorable | 331 | 31 | 0 | |
| Class 2: Average | 0 | 27 | 0 | |
| Class 3: Unfavorable | 0 | 2 | 13 | |
| Class | 1: Favorable | 2: Average | 3: Unfavorable | Overall |
|---|---|---|---|---|
| Precision | 0.990 | 0.460 | 0.990 | 0.813 |
| Recall | 0.914 | 0.989 | 0.866 | 0.923 |
| F1-score | 0.955 | 0.621 | 0.928 | 0.834 |
Publisher’s Note: MDPI stays neutral with regard to jurisdictional claims in published maps and institutional affiliations. |
© 2021 by the authors. Licensee MDPI, Basel, Switzerland. This article is an open access article distributed under the terms and conditions of the Creative Commons Attribution (CC BY) license (https://creativecommons.org/licenses/by/4.0/).
Share and Cite
Casilimas, L.; Corrales, D.C.; Solarte Montoya, M.; Rahn, E.; Robin, M.-H.; Aubertot, J.-N.; Corrales, J.C. HMP-Coffee: A Hierarchical Multicriteria Model to Estimate the Profitability for Small Coffee Farming in Colombia. Appl. Sci. 2021, 11, 6880. https://doi.org/10.3390/app11156880
Casilimas L, Corrales DC, Solarte Montoya M, Rahn E, Robin M-H, Aubertot J-N, Corrales JC. HMP-Coffee: A Hierarchical Multicriteria Model to Estimate the Profitability for Small Coffee Farming in Colombia. Applied Sciences. 2021; 11(15):6880. https://doi.org/10.3390/app11156880
Chicago/Turabian StyleCasilimas, Leidy, David Camilo Corrales, Mayra Solarte Montoya, Eric Rahn, Marie-Hélène Robin, Jean-Noël Aubertot, and Juan Carlos Corrales. 2021. "HMP-Coffee: A Hierarchical Multicriteria Model to Estimate the Profitability for Small Coffee Farming in Colombia" Applied Sciences 11, no. 15: 6880. https://doi.org/10.3390/app11156880
APA StyleCasilimas, L., Corrales, D. C., Solarte Montoya, M., Rahn, E., Robin, M.-H., Aubertot, J.-N., & Corrales, J. C. (2021). HMP-Coffee: A Hierarchical Multicriteria Model to Estimate the Profitability for Small Coffee Farming in Colombia. Applied Sciences, 11(15), 6880. https://doi.org/10.3390/app11156880