1. Introduction
Stroke is considered to be one of the leading causes of death [
1,
2], and almost 85% of patients with stroke have functional disability of upper limbs during daily life [
3]. The traditional treatment method requires one-on-one interactions between the therapist and the patient in which the professional therapist guides the patient to perform repetitive movements of the impaired limb. Furthermore, interactive rehabilitation training is labor-intensive and time-consuming for both the therapist and the stroke patient [
4]. Rehabilitation robots provide repetitive movement and intensive accurate training, and they have the potential to be widely used in the recovery of motor function for stroke patients [
5,
6] based on the theory of motor learning [
7]. To customize a personalized rehabilitation training schedule for stroke patients, therapists should make motor function assessments to understand the motor function state of patients. Traditional clinical assessment scales depending on the therapists, such as the Fugl-Meyer Assessment and the Motor Status Score, have been widely validated, accepted and standardized, but they are subjective and time-consuming [
8,
9], and cannot reflect the rehabilitation state of patients in the process of rehabilitation training in real time. With the development of rehabilitation robot technology and the diversity of rehabilitation training mode, it is necessary to develop quantitative assessment methods based on robotic training to reflect the state of motor recovery of patients.
So far, many researchers have tried to find some indicators of quantitative assessment based on physiological biomarkers including electroencephalography (EEG), functional magnetic resonance imaging (fMRI), and transcranial magnetic stimulation (TMS). For instance, Pan et al. [
10] calculated muscle synergy similarity extracted from upper limb surface electromyography (sEMG) signals during voluntary upward reaching, and found that muscle synergy similarity was correlated significantly with the Fugl-Meyer assessment scale. Zhang et al. [
11] proposed a convolutional neural network model in which patients’ motor function could be predicted from EEG signals. However, the nonstationarity of physiological signal for EEG, EMG, and TMS, as well as the inconvenience of the assessment method for fMRI, limits their clinical application.
Additionally, some researchers have used three-dimensional motion capture systems to evaluate the motor function of stroke patients. For example, Murphy et al. [
12] analyzed movement time, velocity and smoothness in drinking from a glass by an optoelectronic three-dimensional motion capture system and found significant differences between stroke and healthy groups. Other researchers have also evaluated the motor function of stroke patients using robot-derived movement measures of the upper limb such as movement planning, range of movement, movement accuracy and movement smoothness in active training. In practice, active training requires active participation in training, which could enhance the immersion and efficiency during recovery [
13]. Chang et al. [
14] suggested that using the peak velocity and the percentage time of the peak velocity can reflect the movement planning with bimanual rehabilitation robot, and reported the significant effects of these two parameters in the subject. Zollo et al. [
15] showed that the reduction of the aiming angle, which was calculated by the angular difference between the target direction and the moving direction from the starting point to the peak velocity point [
16], represented movement planning. Hu et al. [
17] used the root mean square error between the actual wrist angle and the target in the cursor tracking activity to reflect movement accuracy during robot-assisted wrist training. Bosecker et al. [
18] illustrated that movement accuracy was significantly correlated with FMU by employing the axis ratio of the best fitting ellipse in unconstrained circle drawing. Mazzoleni et al. [
19] also stated that the higher the ratio of average acceleration to peak acceleration is and the better the smoothness of movement gets with the InMotion 2.0 robot. Sanguineti et al. [
20] reported that the number of sub-movements that represent movement smoothness improved significantly when patients perform external point-to-point achieving tasks, while the larger number of sub-movements improved significantly for subjects with greater impairment. However, there exist differences in the assessment of movements, while there is also a lack of consistency in the variation between assessment parameters and the improvement of patients’ motor function. Additionally, the expensive assessment equipments and complex operation of assessment equipments also limit clinical application of those methods.
The objective of this study is to propose an assessment method of motor function aimed at building the relationship between characteristic information, including force and movement trajectory, and functional scores during robot-assisted rehabilitation training based on admittance control. After developing the rehabilitation robot, an appropriate admittance parameter from a clinical experiment was chosen to preliminarily validate the proposed assessment method.
4. Clinical Experimental and Validation
4.1. Subjects
Nine stroke patients with hemiplegia and nine healthy subjects (years: 24 ± 5) were recruited for the experiment. The nine healthy subjects included three females and six males. All the patients were evaluated by the Fugl-Meyer Assessment of Upper extremity (FMU) before experiment. The clinical characteristics of the patients are shown in
Table 1.
The criteria for recruitment in this experiment were: (1) the first onset of stroke, diagnosed with definite lesions on hemisphere by CT or MRI; (2) the ability to move his/her shoulder and elbow actively; (3) Modified Ashworth Scores ≤2 and Brunnstrom Scale ≥ IV; (4) no cognitive impairment and possessing the ability to understand training instructions.
All subjects signed the informed consent before the experiment, and this study was approved by the Ethics Committee of Beijing Rehabilitation Hospital Affiliated to Capital Medical University.
4.2. Experiment Setup
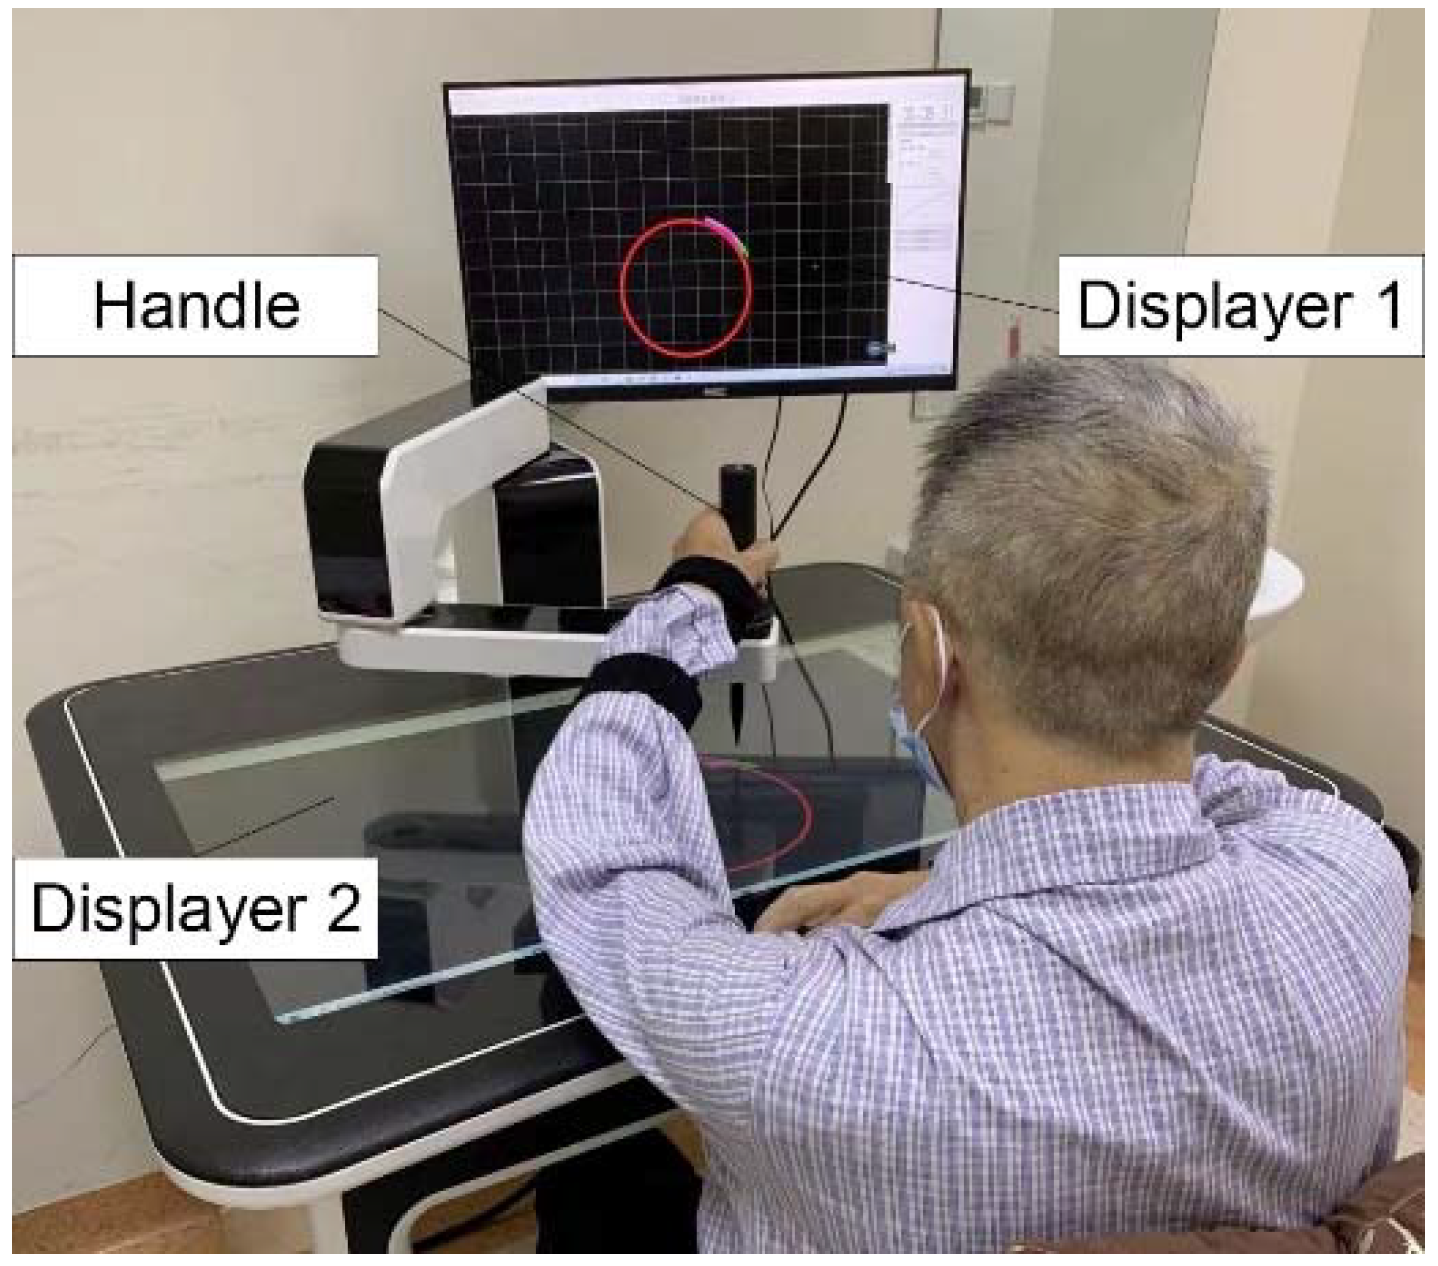
As shown in
Figure 5, circular trajectory tracking, which can reflect the coordination of multiple muscles in the shoulder and elbow joints, was selected as a training task. To reduce the discomfort of the subject’s joint movement, the two points of a circle diameter were determined by the patient’s therapist according to the patient’s passive maximum freedom of shoulders and elbows. The nearest point was determined when the patient sat in front of the robot with his/her shoulder abduction 75° and shoulder flexion 40°, and elbow flexion 90°. The farthest point was determined when the patient’s upper limb was fully extended following the original posture. The circular trajectory tracking training has two directions, including clockwise and counterclockwise. The direction of the circular track is mainly determined according to the lesion sides of the subjects. The clockwise circular trajectory training is mainly suitable for patients with an injury to the left hemisphere, while the counterclockwise circular trajectory training is mainly suitable for the patients with injury to the right hemisphere.
Before the experiment, the appropriate circular trajectory was selected according to the height of the subjects. As shown in
Figure 6, the height of the seat for each subject was adjusted in order to keep the subjects’ upper limbs with a shoulder abduction of 75° and a shoulder flexion of 40°, and an elbow flexion of 90°, with the robot end handle being held in front of the body. Each subject was required to carry out eight rounds of circular trajectory training, from the near end point to the far end point and then to the near end point for a trial. All the subjects were requested to perform circular trajectory tracking training with five different admittance parameters. Their values of K1, K2, K3, K4, and K5 were set at 0 N/m, 10 N/m, 30 N/m, 60 N/m, 90 N/m, respectively. The values of stiffness parameters were chosen in active training to explore the effects of different K values on the training performance of patients.
During the training, the movement trajectory and interactive force of the handle were recorded by the sensor to calculate the characteristic parameters.
4.3. Data Processing
The active range of movement, movement deviation and movement smoothness of the subject were calculated by the real trajectory, which was mainly calculated by the forward kinematics formula of the robot. The data of each training period were normalized to 100 data points by the interpolation method to analyze the changes in each period.
- (1)
The active range of movement
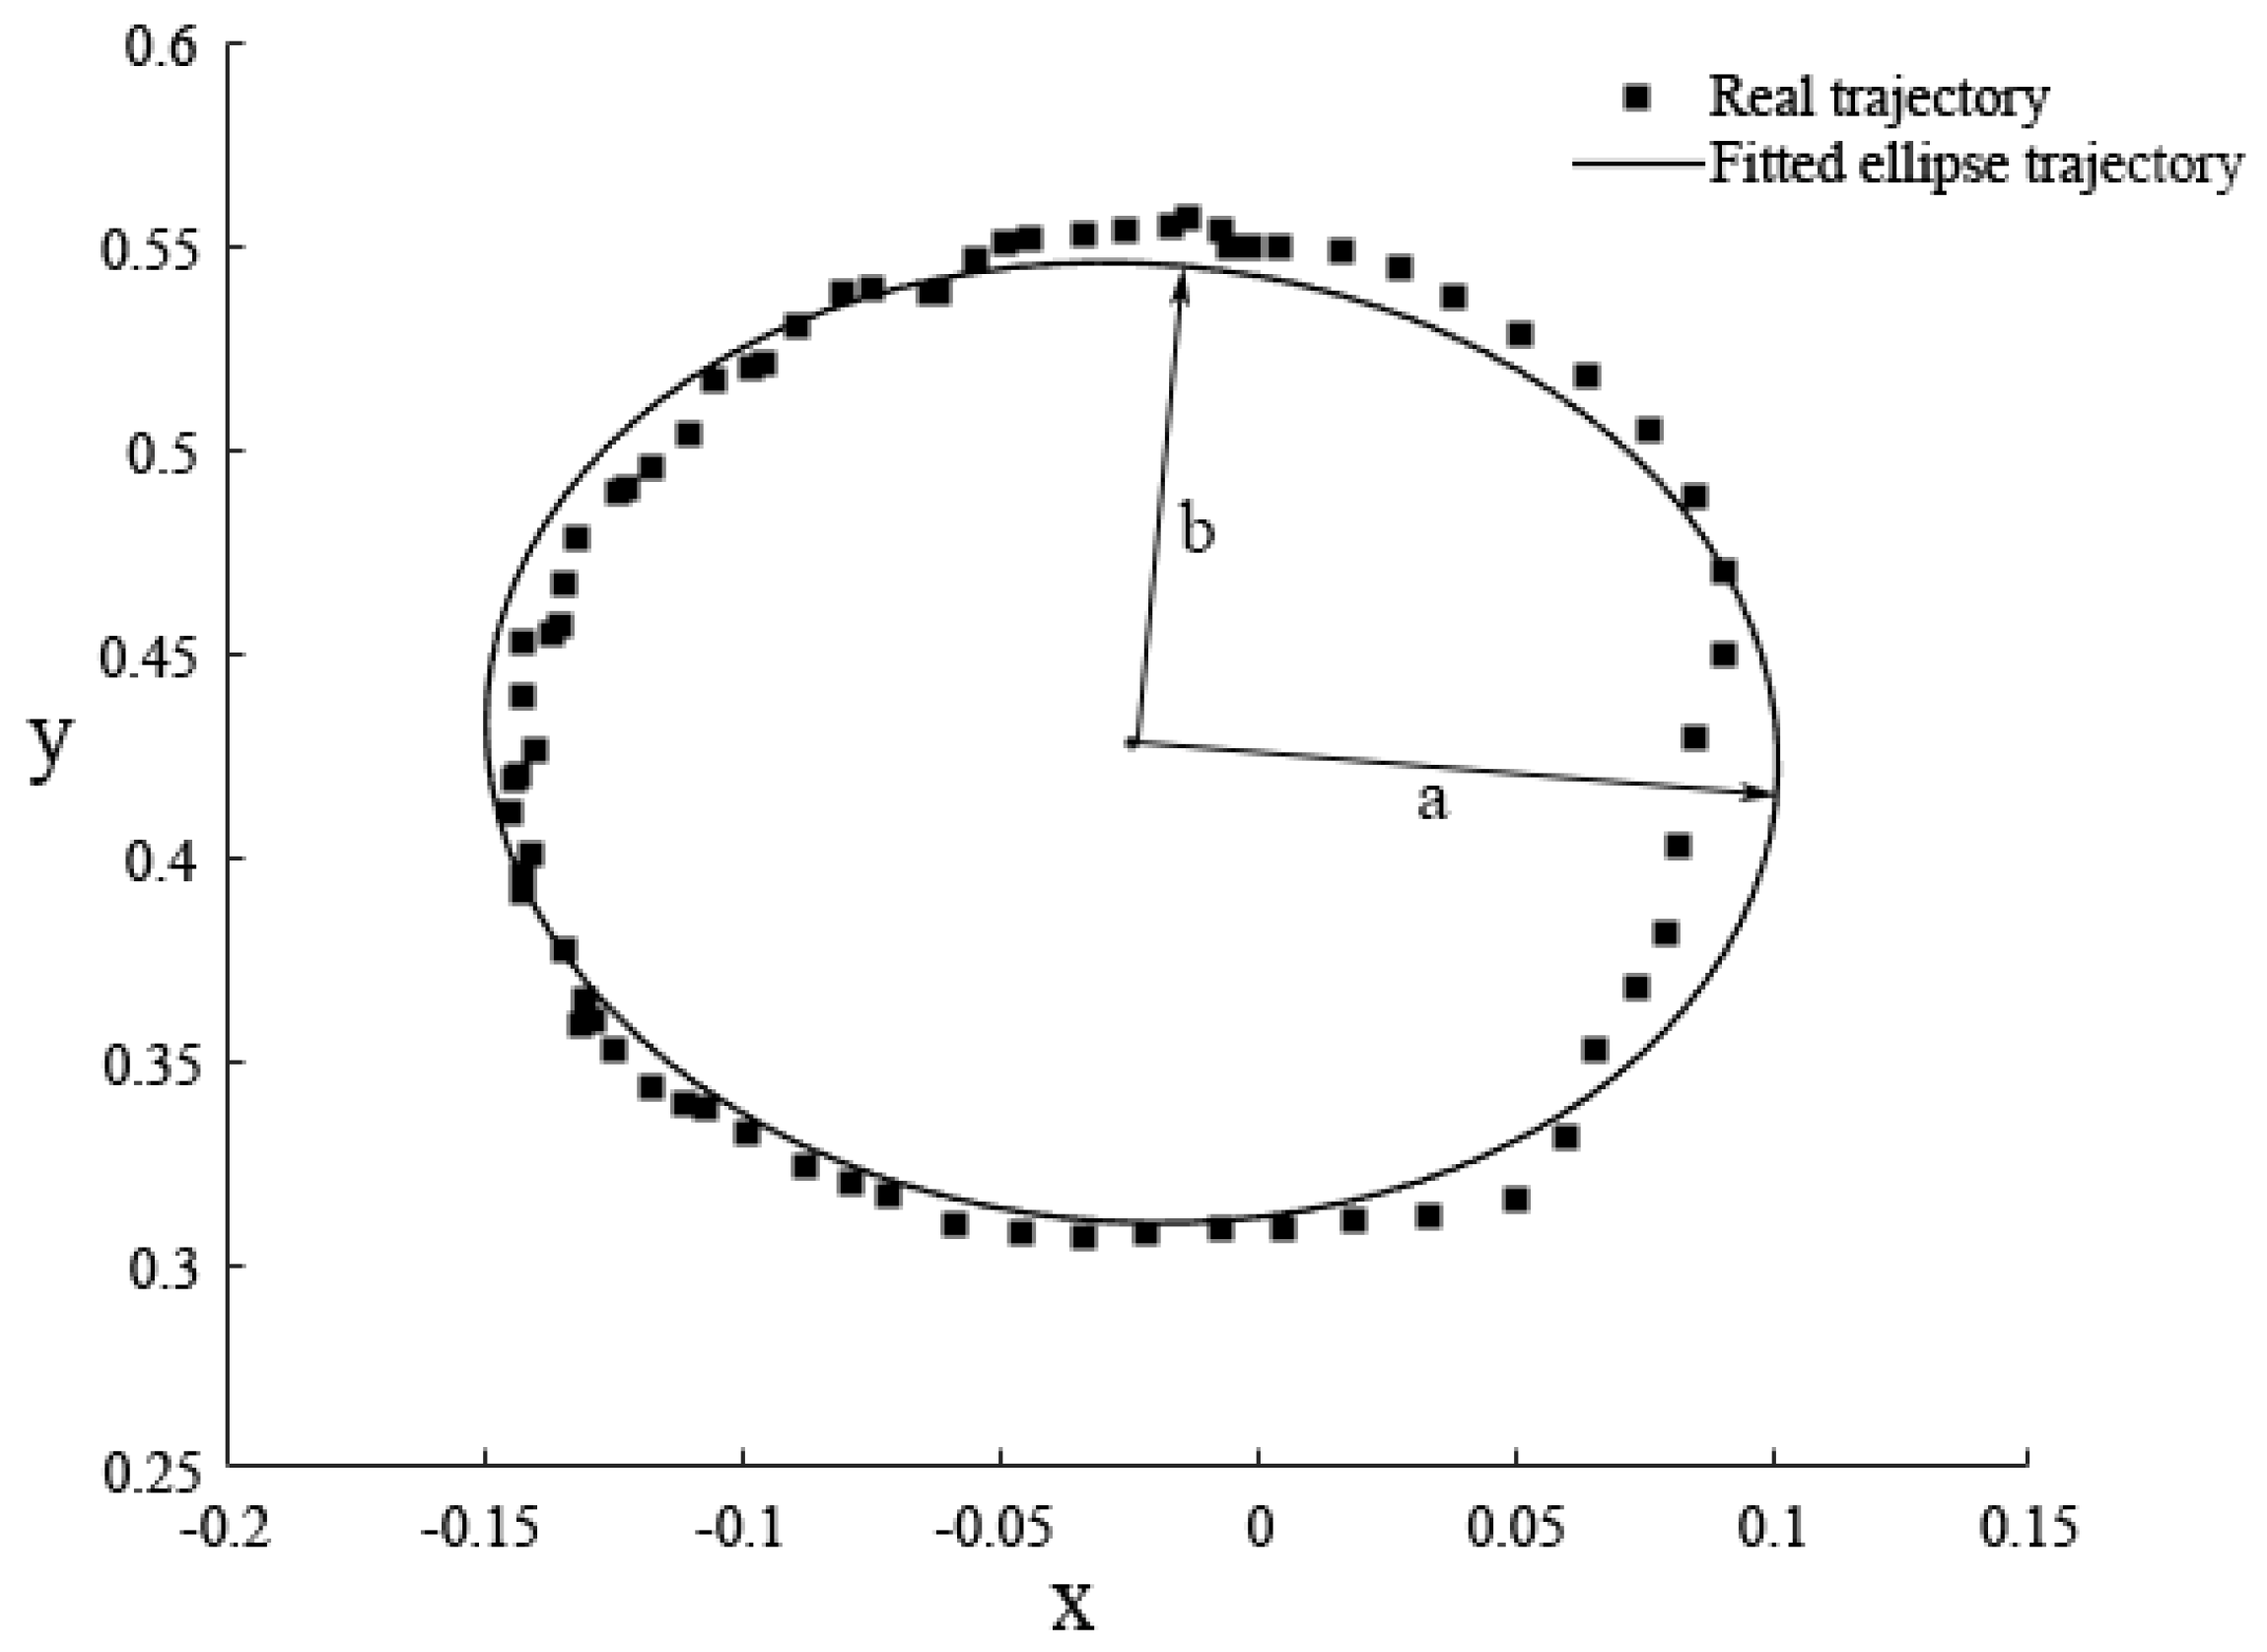
The active range of movement mainly reflected the range of motion of the subject’s shoulder and elbow joints. In the movement of circular trajectory, the general equation of elliptic curve was obtained by fitting the actual trajectory, shown in
Figure 7. The ratio of the short semi-axis to the long semi-axis was calculated as the characteristic parameter of the active range of movement. The general equation of the ellipse was obtained by the following formula.
The central coordinates
of the ellipse geometry were described as follows:
The length of long semi-axis a, the length of short semi-axis
b, and the ratio of two semi-axis were respectively described as follows:
- (2)
The accuracy of movement
The movement deviation between the actual trajectory and the expected trajectory can reflect the accuracy of the subject’s movement. In circular trajectory tracking training, trajectory deviation was defined as the distance between the actual point and the nearest point on the target circle trajectory along the diameter direction.
The average trajectory deviation in a movement period was calculated as follows:
where
n represents the number of data points recorded within a period, Deviation represents the deviation of any point in actual movement.
where
represents the coordinates of the center of the target circular track,
represents the coordinates of the actual movement track,
represents the radius of the target circular track.
- (3)
The smoothness of movement
The smoothness of movement was mainly used to describe the coordination of movement of stroke patients. The change of movement velocity and movement acceleration can describe the smoothness of movement. The mean value of the speed divided by the peak speed in a movement period can also be calculated using the parameter of movement smoothness. These parameters are calculated as follows:
where
represents the coordinates of the end-point position at time
,
represents the end-point position at time
.
where
represents the movement velocity at time
and
represents the movement velocity at time
,
represents the movement acceleration at time
.
where the average velocity during the movement was calculated as follows:
- (4)
The interactive force.
Interactive force is mainly used to describe the subjects’ abilities to exert force. In the circular tracking training, the average force was calculated as a characteristic parameter during a period [
26]. As required by the circular trajectory tracking task, the patient needs to move the handle along the tangent of the circle. In fact, the interactive force, collected by the force sensor, is the resultant force between the patient and the robot. Therefore, it is tricky to distinguish whether the force that the patients exert on the handle meets the direction required by circular trajectory tracking training. So only the magnitude of the active force was selected to analyze the patient’s motor function.
4.4. Statistical Analysis
All the statistical analysis was performed in IBM SPSS STATISTICS 22. The paired-sample Wilcoxon signed-rank test was used to measure the statistical significance of the quantitative parameters of stroke patients among five different admittance parameters when these parameters were not normally distributed. To reduce the occurrence of Type I error induced by multiple t-tests, a false discovery rate (FDR) correction test was performed in the post hoc testing. The difference level of parameters between stroke patients and healthy subjects were analyzed by independent-samples t test. A Pearson correlation analysis was carried out to determine whether the correlation between the quantitative parameters and FMU existed. A linear regression analysis was performed to determine the relationship between the quantitative parameters and FMU.
4.5. Results
4.5.1. Selection of Admittance Parameters
The influence of different admittance parameters on training performance is shown in
Figure 8. It can be found that, with the increase of the stiffness parameter of admittance control, the training performance of the subjects gradually gets better. It can also be found that with the decrease of movement deviation of subjects, the interactive force, movement velocity and movement smoothness increase. The paired-sample Wilcoxon signed-rank test showed that there were significant differences in interactive force, movement smoothness and movement velocity between K2 and K1 (movement smoothness,
p = 0.042; movement velocity,
p = 0.035), between K2 and K4 (interactive force,
p = 0.02; movement smoothness,
p = 0.042; movement velocity,
p = 0.0275), as well as between K2 and K5 (interactive force,
p = 0.02; movement velocity,
p = 0.027). None of the assessment parameters between K2 and K3 showed significant difference. The training mode under K2 was selected as the final evaluation mode in our study.
4.5.2. Characteristics of Patients’ Movement
As shown in
Table 2, the independent-samples
t test showed that there were significant differences of interactive force, movement deviation, movement range and movement smoothness between stroke patients and healthy subjects.
- (1)
Movement velocity and acceleration
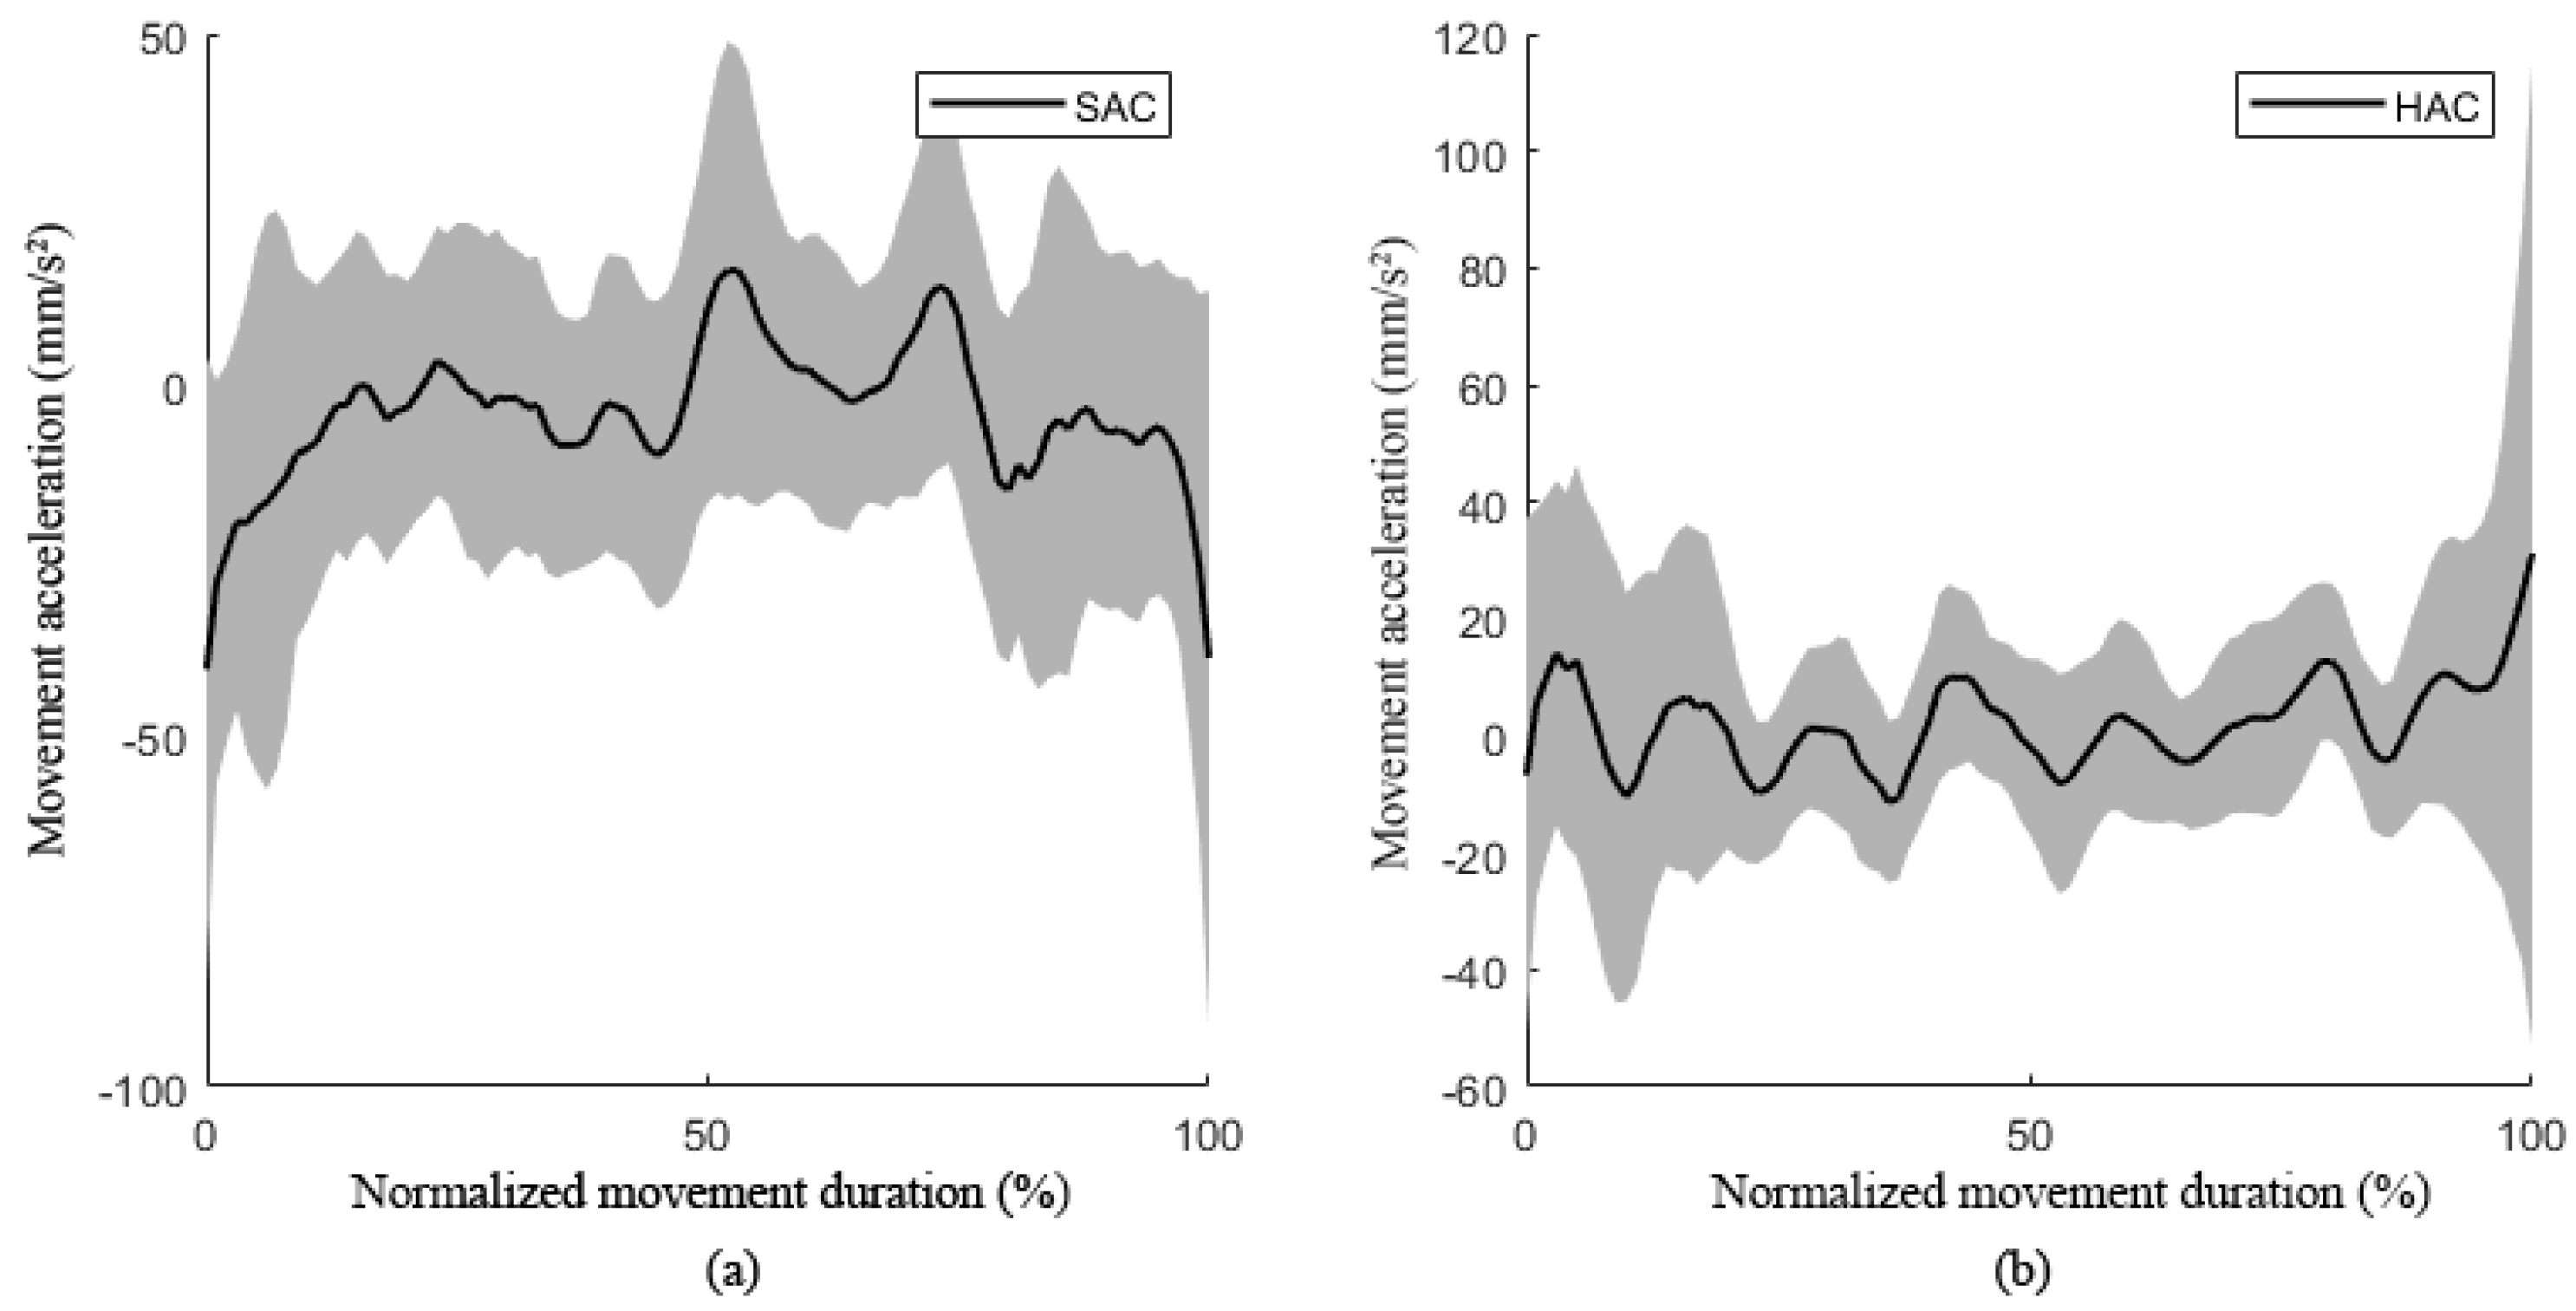
The changes in the movement velocity and acceleration curves represent the participant’s ability to control movement stability. The movement velocity fluctuation curves and acceleration curves of patients and healthy subjects are shown in
Figure 9 and
Figure 10.
Figure 9 shows the velocity fluctuation of subjects in the process of circular trajectory tracking training, in which the solid black line represents the average velocity of multiple subjects and the gray shaded area represents the standard deviation. The fluctuation range of movement speed of patients was much larger than that of healthy subjects, which reflects the weakness of the movement control ability of the patients.
Figure 10 shows the acceleration fluctuation of hemiplegic patients in the process of trajectory tracking. The average acceleration of healthy people was near zero, while the acceleration of patients was negative, and the curve fluctuation range was large, indicating that patients had weak ability to control their movement speed during active rehabilitation training.
- (2)
Movement accuracy
In the process of movement, two different colors were used to display the target movement track and the actual movement track respectively so as to give visual feedback to the subjects. The subjects could adjust the actual movement in real time according to the deviation of the movement track. The deviation between the actual trajectory and the target trajectory reflected the subjects’ ability to control the accuracy of movement and the ability to adjust the movement.
Figure 11 shows the movement deviation curve during the circular trajectory tracking experiments of the subject. In the circular trajectory, the movement deviation of the stroke patients was greater than that of the healthy subjects: the mean trajectory deviation of the hemiplegia patients was 5.48 mm and the standard deviation was 2.26 mm during the circular trajectory. The mean deviation and standard deviation of healthy subjects were 2.19 mm and 0.44 mm. Most of the deviations and variances of the patients’ movement trajectory reflect the weak ability to control the accuracy of movement.
4.5.3. Correlation Analysis
Table 3 reports the results of the Pearson correlation analysis between clinical FMU and characteristic parameters. In the case of circular trajectory tracking experiments, movement range have a strong significant correlation between FMU and movement smoothness index. Neither the interactive force nor movement deviation indices showed a significant correlation with the clinical scores. Therefore, we chose the movement range and movement smoothness to be the linear regression parameters of the model. The fitting function can be described as follows (
,
). The FMU predicted on the basis of this model and the actual FMU are shown in
Figure 12.
5. Discussion
5.1. Selection of Admittance Parameters
For the active training mode, the size of the admittance parameter affects the interaction compliance between the patients and the rehabilitation robot [
27]. The interaction compliance can be adjusted by changing the size of the admittance parameter. The actual movement trajectory was the result of the interaction between the patient and the robot. As the admittance parameter increased, it could be found that the training performance of the subject gradually got better and better. There was no statistically significant difference of the four quantitative parameters between K4 and K5, indicating that degrees of assistance of the robot below K4 and K5 are too high, and would lead to the subject’s slacking during rehabilitation training [
28]. For some patients with poor motor function, they may not be able to complete the circular trajectory rehabilitation training independently [
29] under smaller admittance parameters such as K1. The stiffness parameter of K3 was higher than that of K2, with K3 providing more assistance that the robot provided, meaning that patients’ active participation decreased. Therefore, in our study, K2 was chosen as an appropriate admittance parameter in the evaluation training mode.
5.2. Characteristics of Patients’ Movement
Because the stroke patients’ motor function was impaired, they had limited control ability during the circular trajectory tracking training, which required patients to change the direction all the time [
26].
Movement range, which was calculated as the ratio of the best fitting ellipse, could characterize the goodness of a circle [
30] in a range between 0 and 1. Compared with healthy subjects, a movement range for stroke patients very distant from 1, meaning that the actual trajectory of movement deviation was greater than normal, was detected in this study. This difference can be caused by the fact that patients with the characteristics of abnormal synergies between shoulder and elbow [
31] and poor strength control could not accurately control their circular trajectory movement. In this study, it was also found that the patient’s trajectory deviation at the distal point of the circular trajectory was significantly greater than that of other positions. This result could be due to the fact that patients’ biceps with high muscle tension made it difficult to extend their elbow joints, leading to the recovery of a patient’s control ability of the elbow being more difficult than that of the shoulder joint [
32,
33].
The accuracy of a movement can represent the quality of a movement, and is usually calculated using the deviation of the actual trajectory from desired trajectory [
34]. Due to the patients having poor ability to control the coordination movement of multiple joints, they showed lower movement accuracy based on characteristic parameters during circular trajectory training compared with healthy subjects. Specifically, the movement deviation of patients was greater than that of healthy subjects, and the movement velocity of patients fluctuated more jerkily than that of the healthy subjects. In addition, the abnormal movement patterns of the shoulder joints and the elbow joints of stroke patients, including shoulder abduction with elbow flexion, shoulder adduction with elbow extension [
35], can also increase the deviation during circular trajectory movement.
Movement smoothness can be used to describe how gradually a movement is changing. In our study, the movement smoothness of stroke patients during circular trajectory tracking was significantly lower than that of healthy subjects. The cause of the occurrence of this phenomenon in movement smoothness is the same as that for accuracy of movement. By analyzing the relationship between movement smoothness and FMU, the result showed that the movement smoothness index was moderately correlated with FMU, which was consistent with Bosecker et al. [
18]. This result may be explained by the fact that stroke patients possess some sub-movement patterns during continuous arm movements, caused by residual function following damage to the cortex or subcortex regions [
36]. The sub-movement patterns of stroke patients appeared to be composed of a series of short, episodic sub-movements [
37], which could result in the mean speed being much lower than its peak. In this case, the movement smoothness of stroke patients was relatively low, particularly when the interval between sub-movements was significant [
38].
5.3. Quantitative Relationship between Parameters and FMU
In the assessment of motor function in clinical settings, including the adduction of the shoulder joint and the extension of the elbow joint, etc., the quantitative parameters should also be taken into consideration in the robotic assessment. By performing multivariable linear regression between the quantitative parameters, including the movement range and the movement smoothness in the circular trajectory training, and FMU, we obtained the fitting function of the quantitative assessment method. The fitting function exhibited a good fit with , showing that FMU were positively correlated with movement range and movement smoothness. It was proven that the fitting function could be used as a quantitative assessment for upper limb motor function in clinical rehabilitation training.
Due to differences in brain lesion profiles, patients show different defects in movement behavior. For example, high muscle tension will lead to abnormal contracture of biceps and affect the active range of movement. Muscle atrophy caused by impaired motor function will result in a decrease in muscle strength and the ability to control movement. Patients with varied weak movement items should be assigned to the corresponding strengthened training items. Large joint training should be emphasized for patients with limited active range of movement. Patients with large trajectory deviation should strengthen fine movement training, while patients with bad movement smoothness should strengthen muscle coordination training. In clinical application, through establishing the correlation between the characteristic parameters calculated in the robot-assisted training and the clinical FMU, the corresponding individualized rehabilitation training strategy can be developed so as to improve the patients’ motor function to the greatest extent. In addition, for patients who undergo short hospitalization, it is difficult to detect the minor changes of motor function using clinical scales such as FMA. Therefore, it is necessary to further explore the quantitative assessment method, which can be used to reflect subtle changes of motor function.
One of the limitations of this research was that the sample size was rather small. Although the specific statistical analysis method was used to test whether the statistical significance of the quantitative parameters in the clinical experiment have existed, more patients will be recruited to verify the validation of the quantitative assessment method in the future.
6. Conclusions
In this study, a proposed planar upper limb rehabilitation robot system based on the admittance control strategy was used to realize active training mode. By recruiting nine patients and nine healthy subjects to perform circular trajectory training under five different stiffness parameters, the rehabilitation evaluation mode based on active training was determined. The results showed that there were significant differences in interactive force, movement deviation, movement range and movement smoothness between patients and healthy subjects, and the movement range and movement smoothness in the circular trajectory tracking were positively correlated with the clinical FMU. Therefore, a quantitative assessment method for the linear fitting function was validated, in which FMU were associated with movement range and movement smoothness during robot-assisted rehabilitation training. Future study will be devoted to recruiting more stroke patients of various types, from acute to chronic phase, to further verify the assessment method.


 ,
, 


