
Comprehensive Flood Risk Assessment for Wastewater Treatment Plants under Extreme Storm Events: A Case Study for New York City, United States

 ,
, 
 ,
,  and
and 
Abstract
:Featured Application
Abstract
1. Introduction
2. Literature Review
3. Data and Methodology
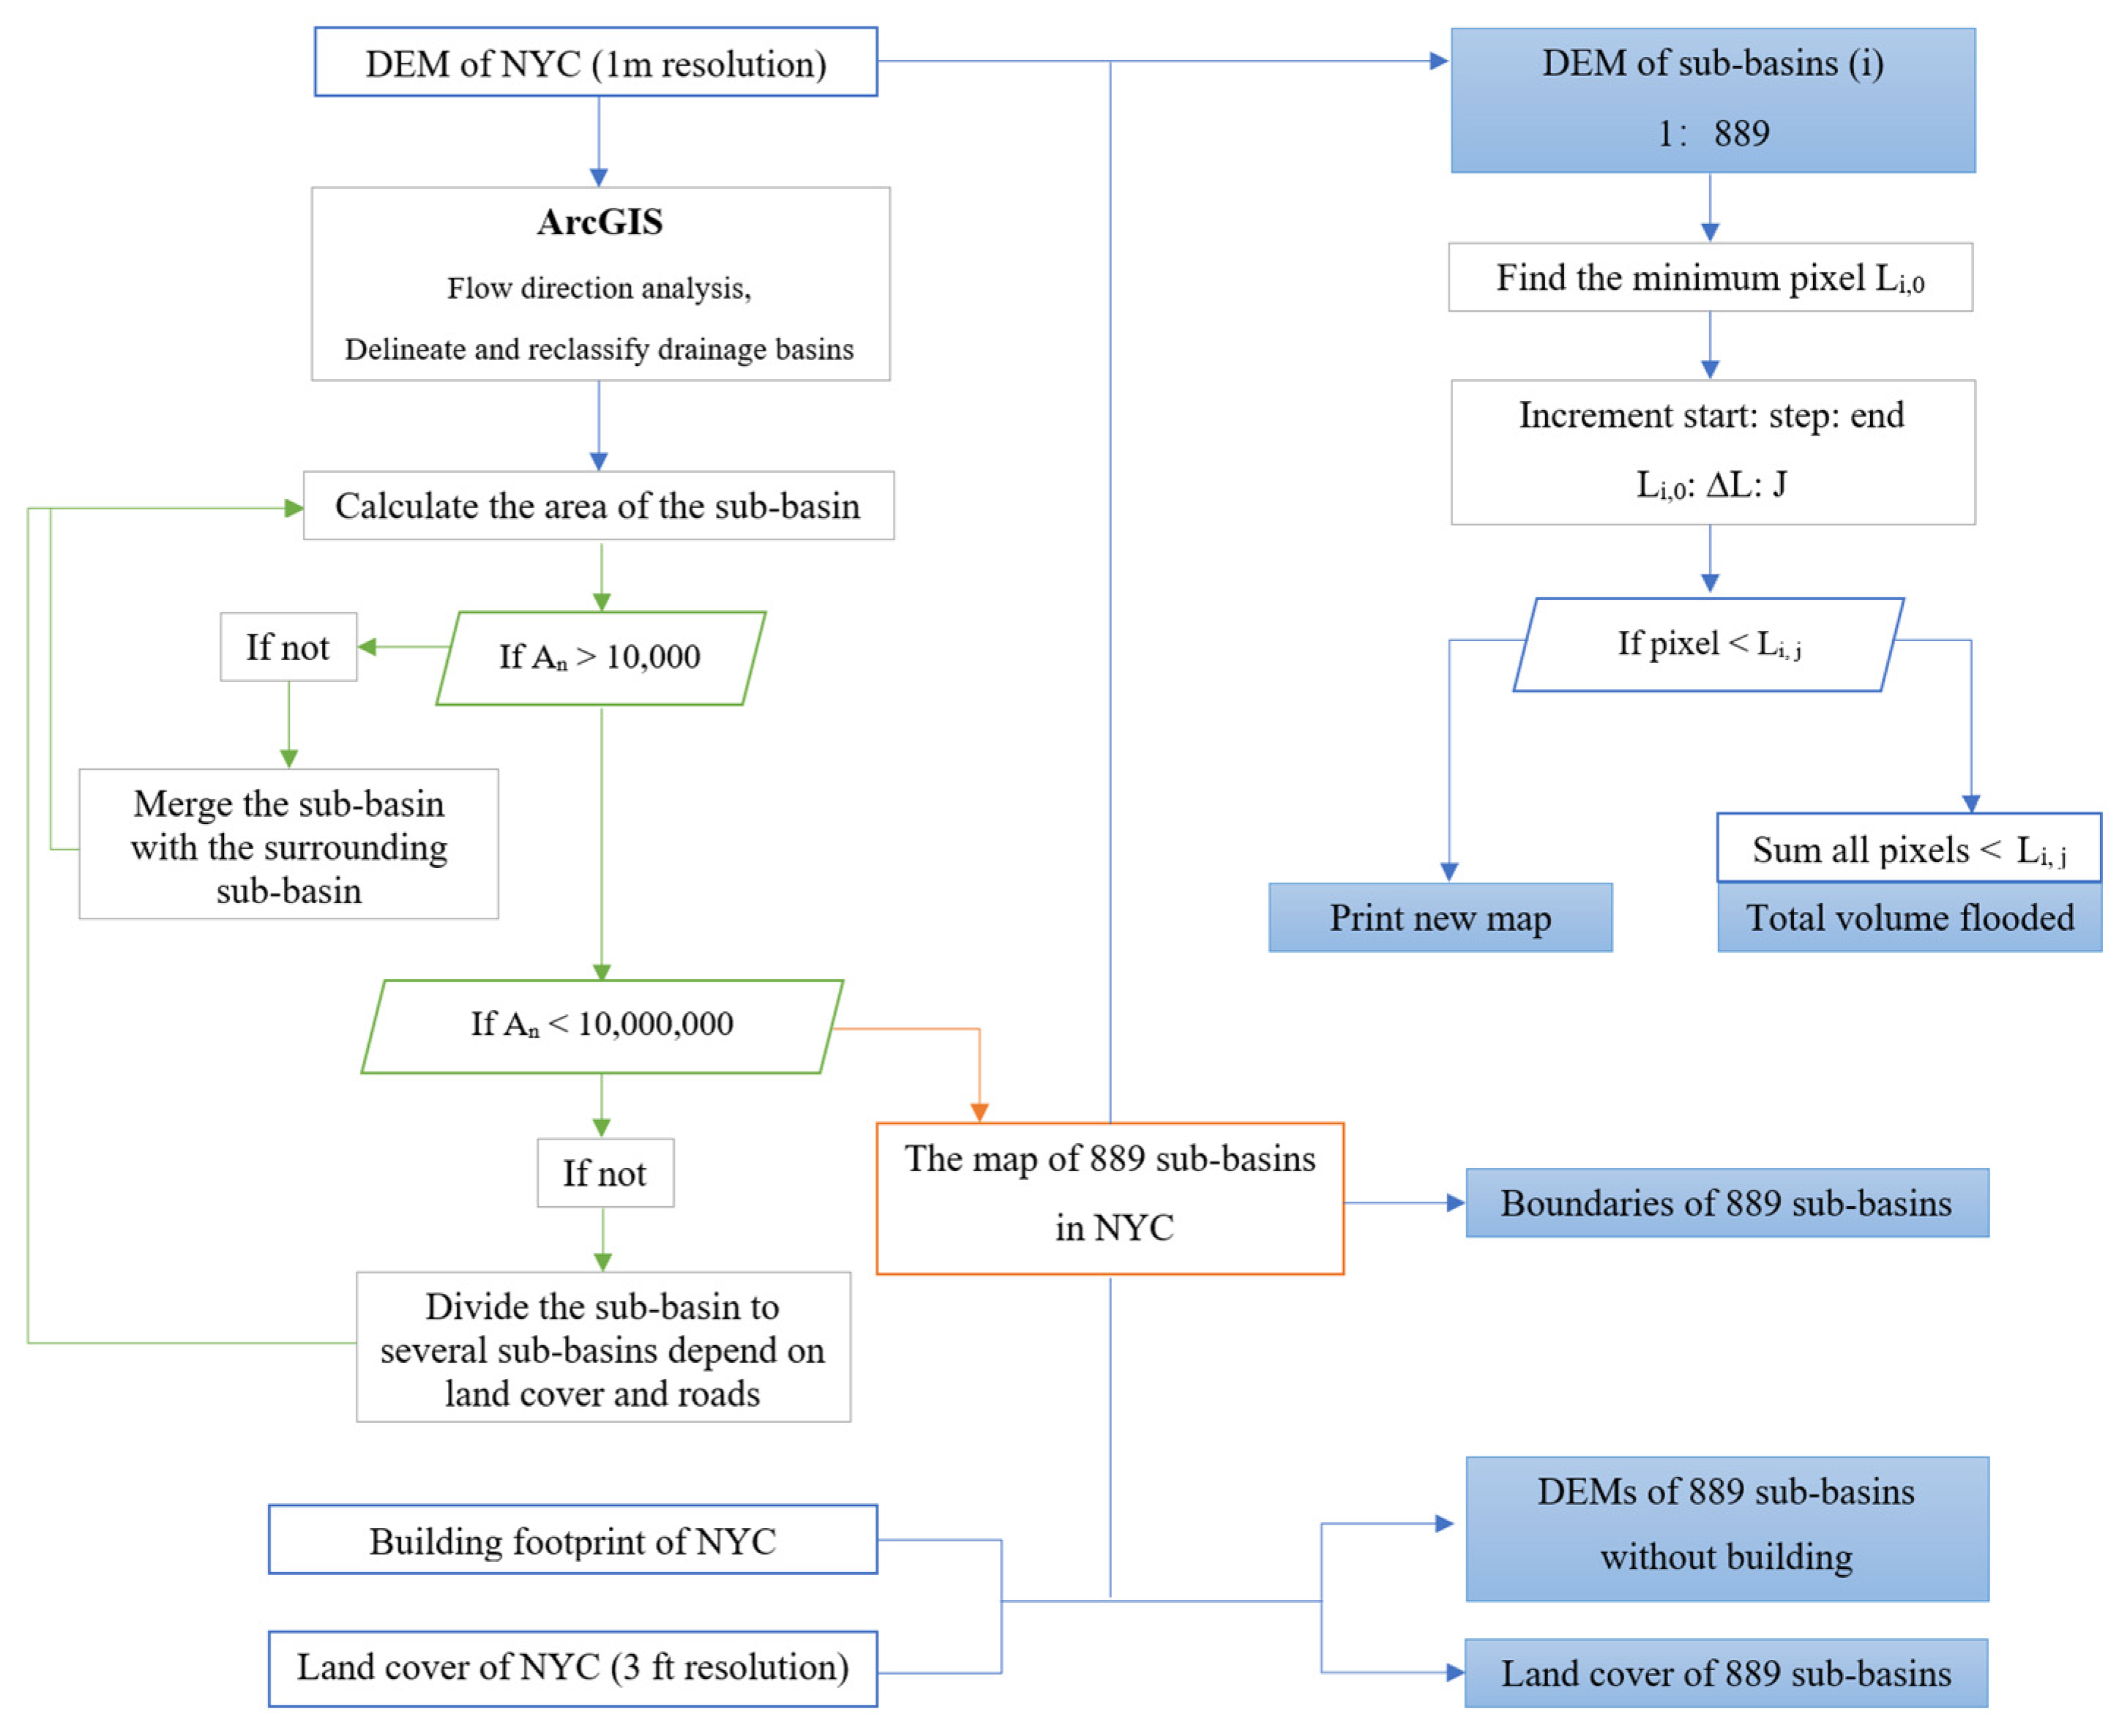
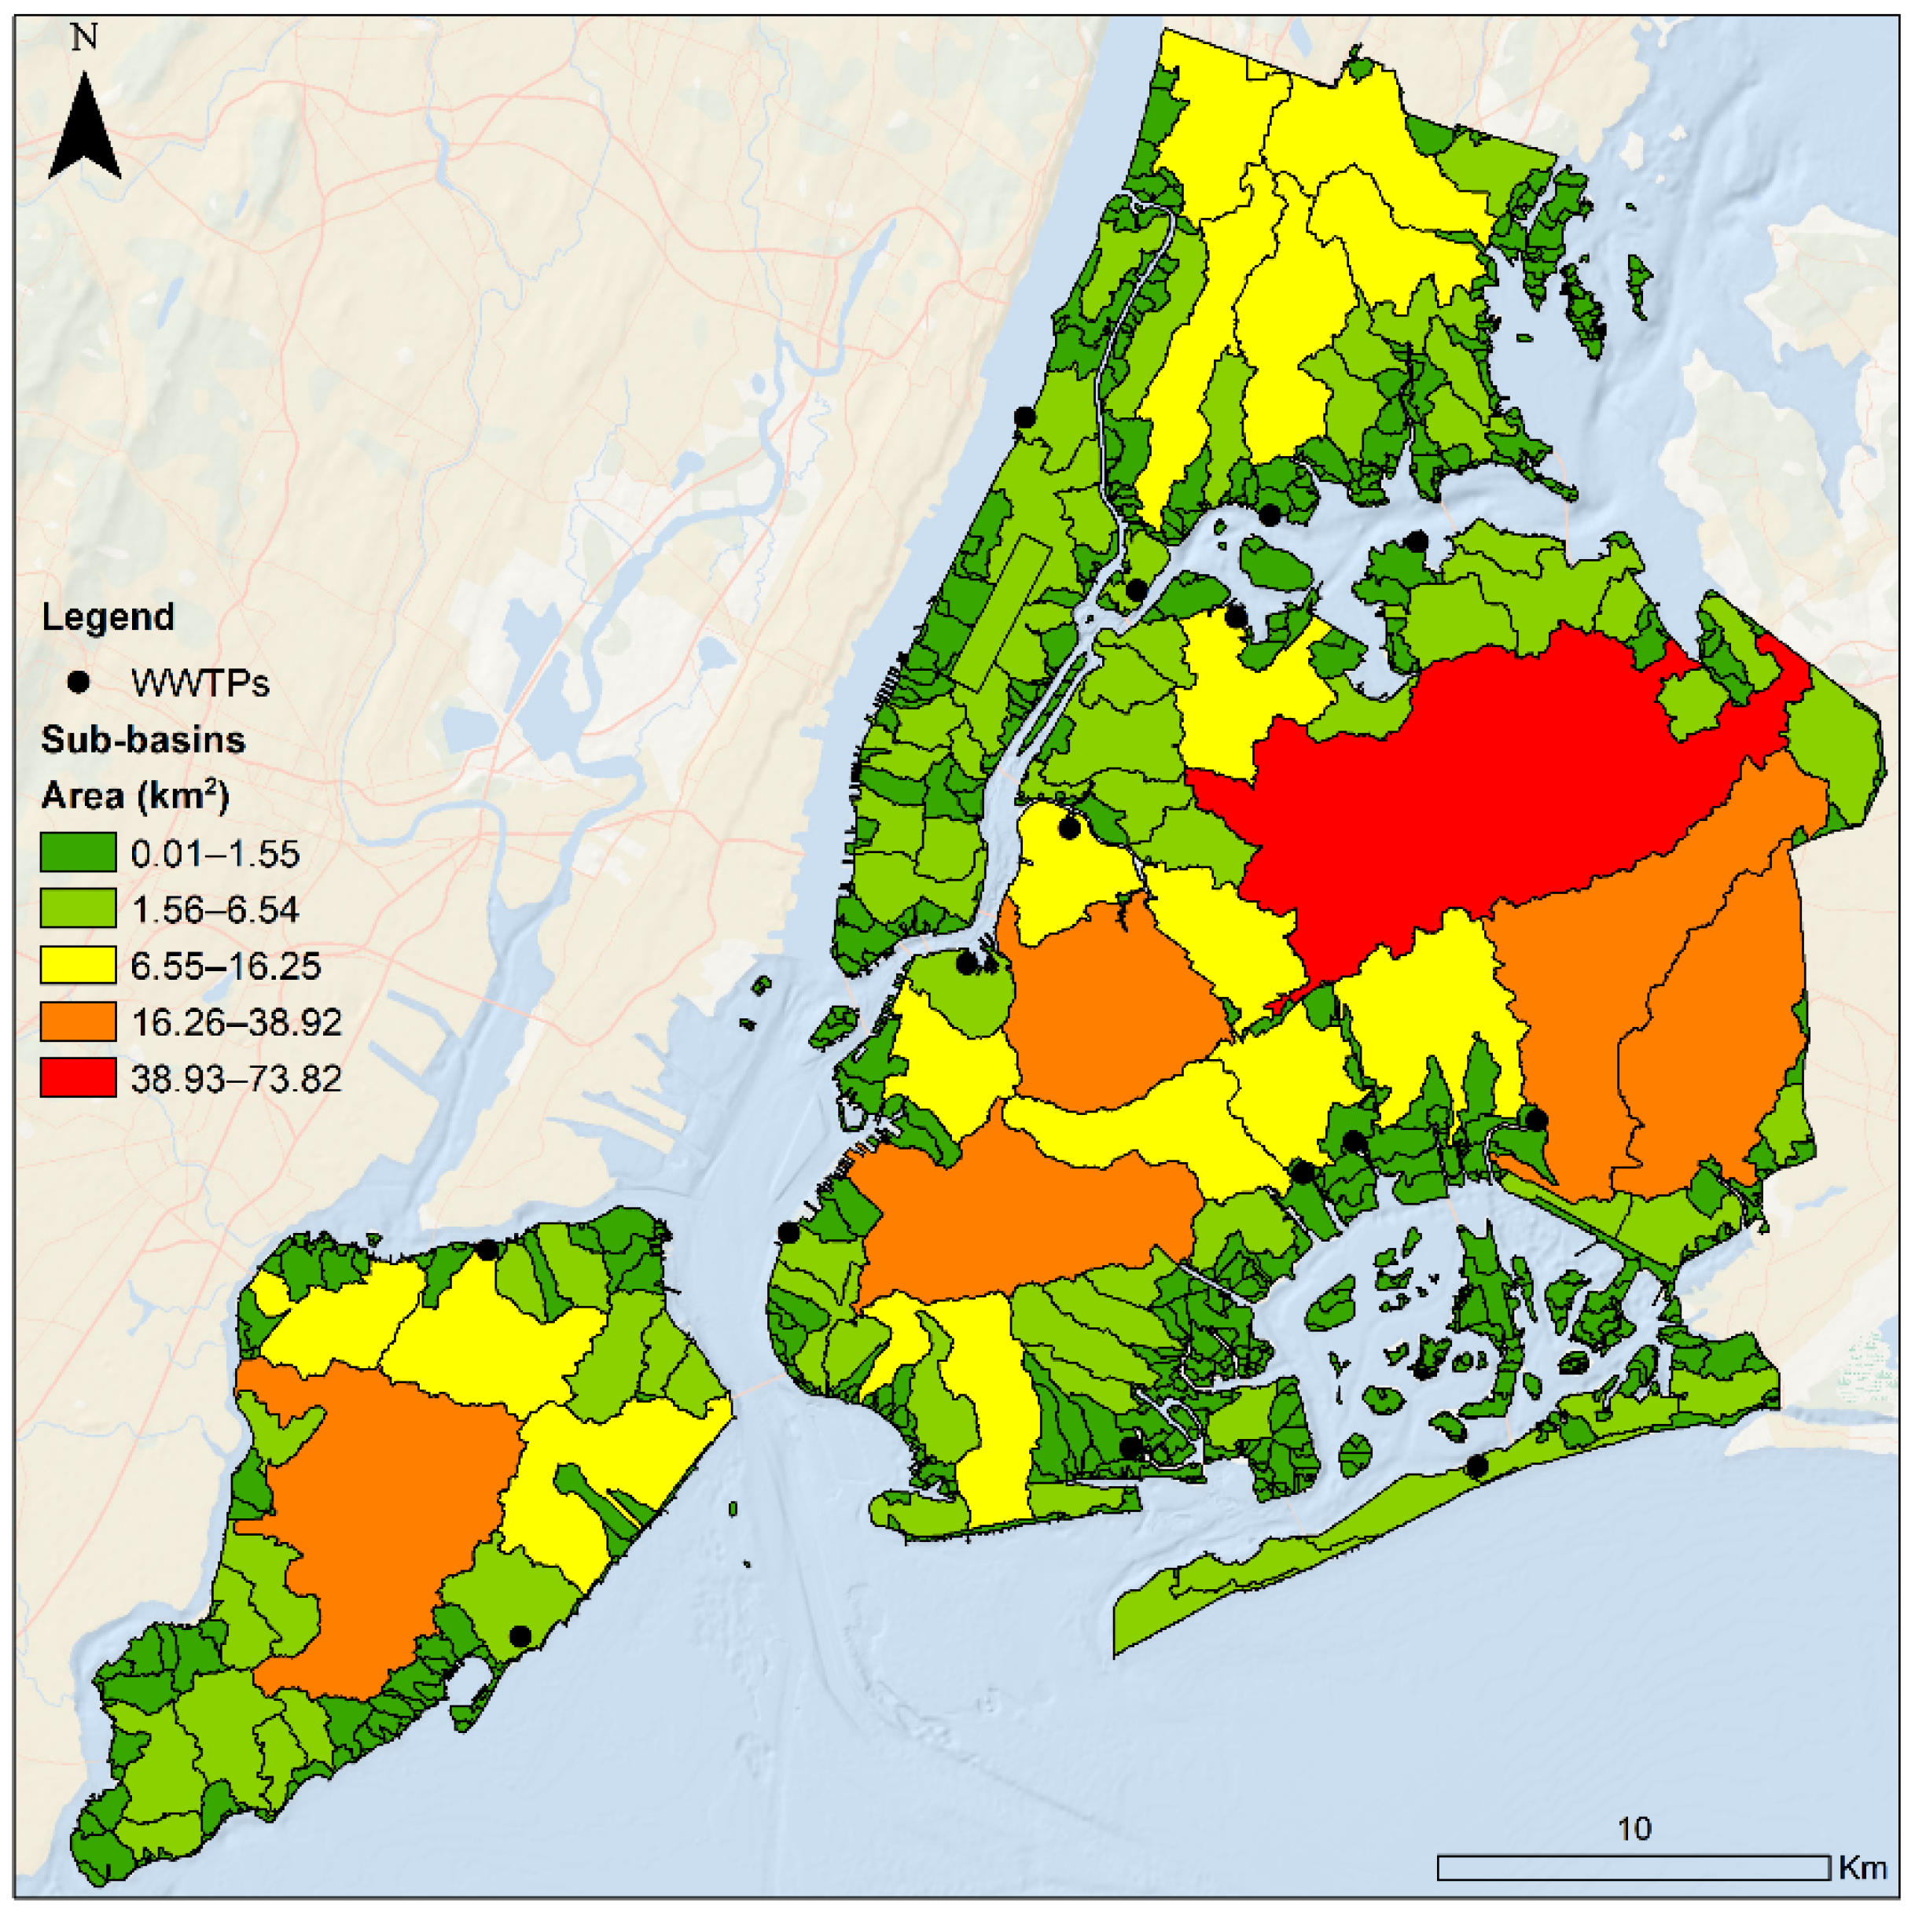
3.1. Creating a Sub-Basin Database
3.2. Storm Surge Analysis
3.3. High-Intensity Rainfall–Runoff Model
3.4. Modeling the Effect of Sea Level Rise
3.5. Economic Damage Estimation Model
4. Results
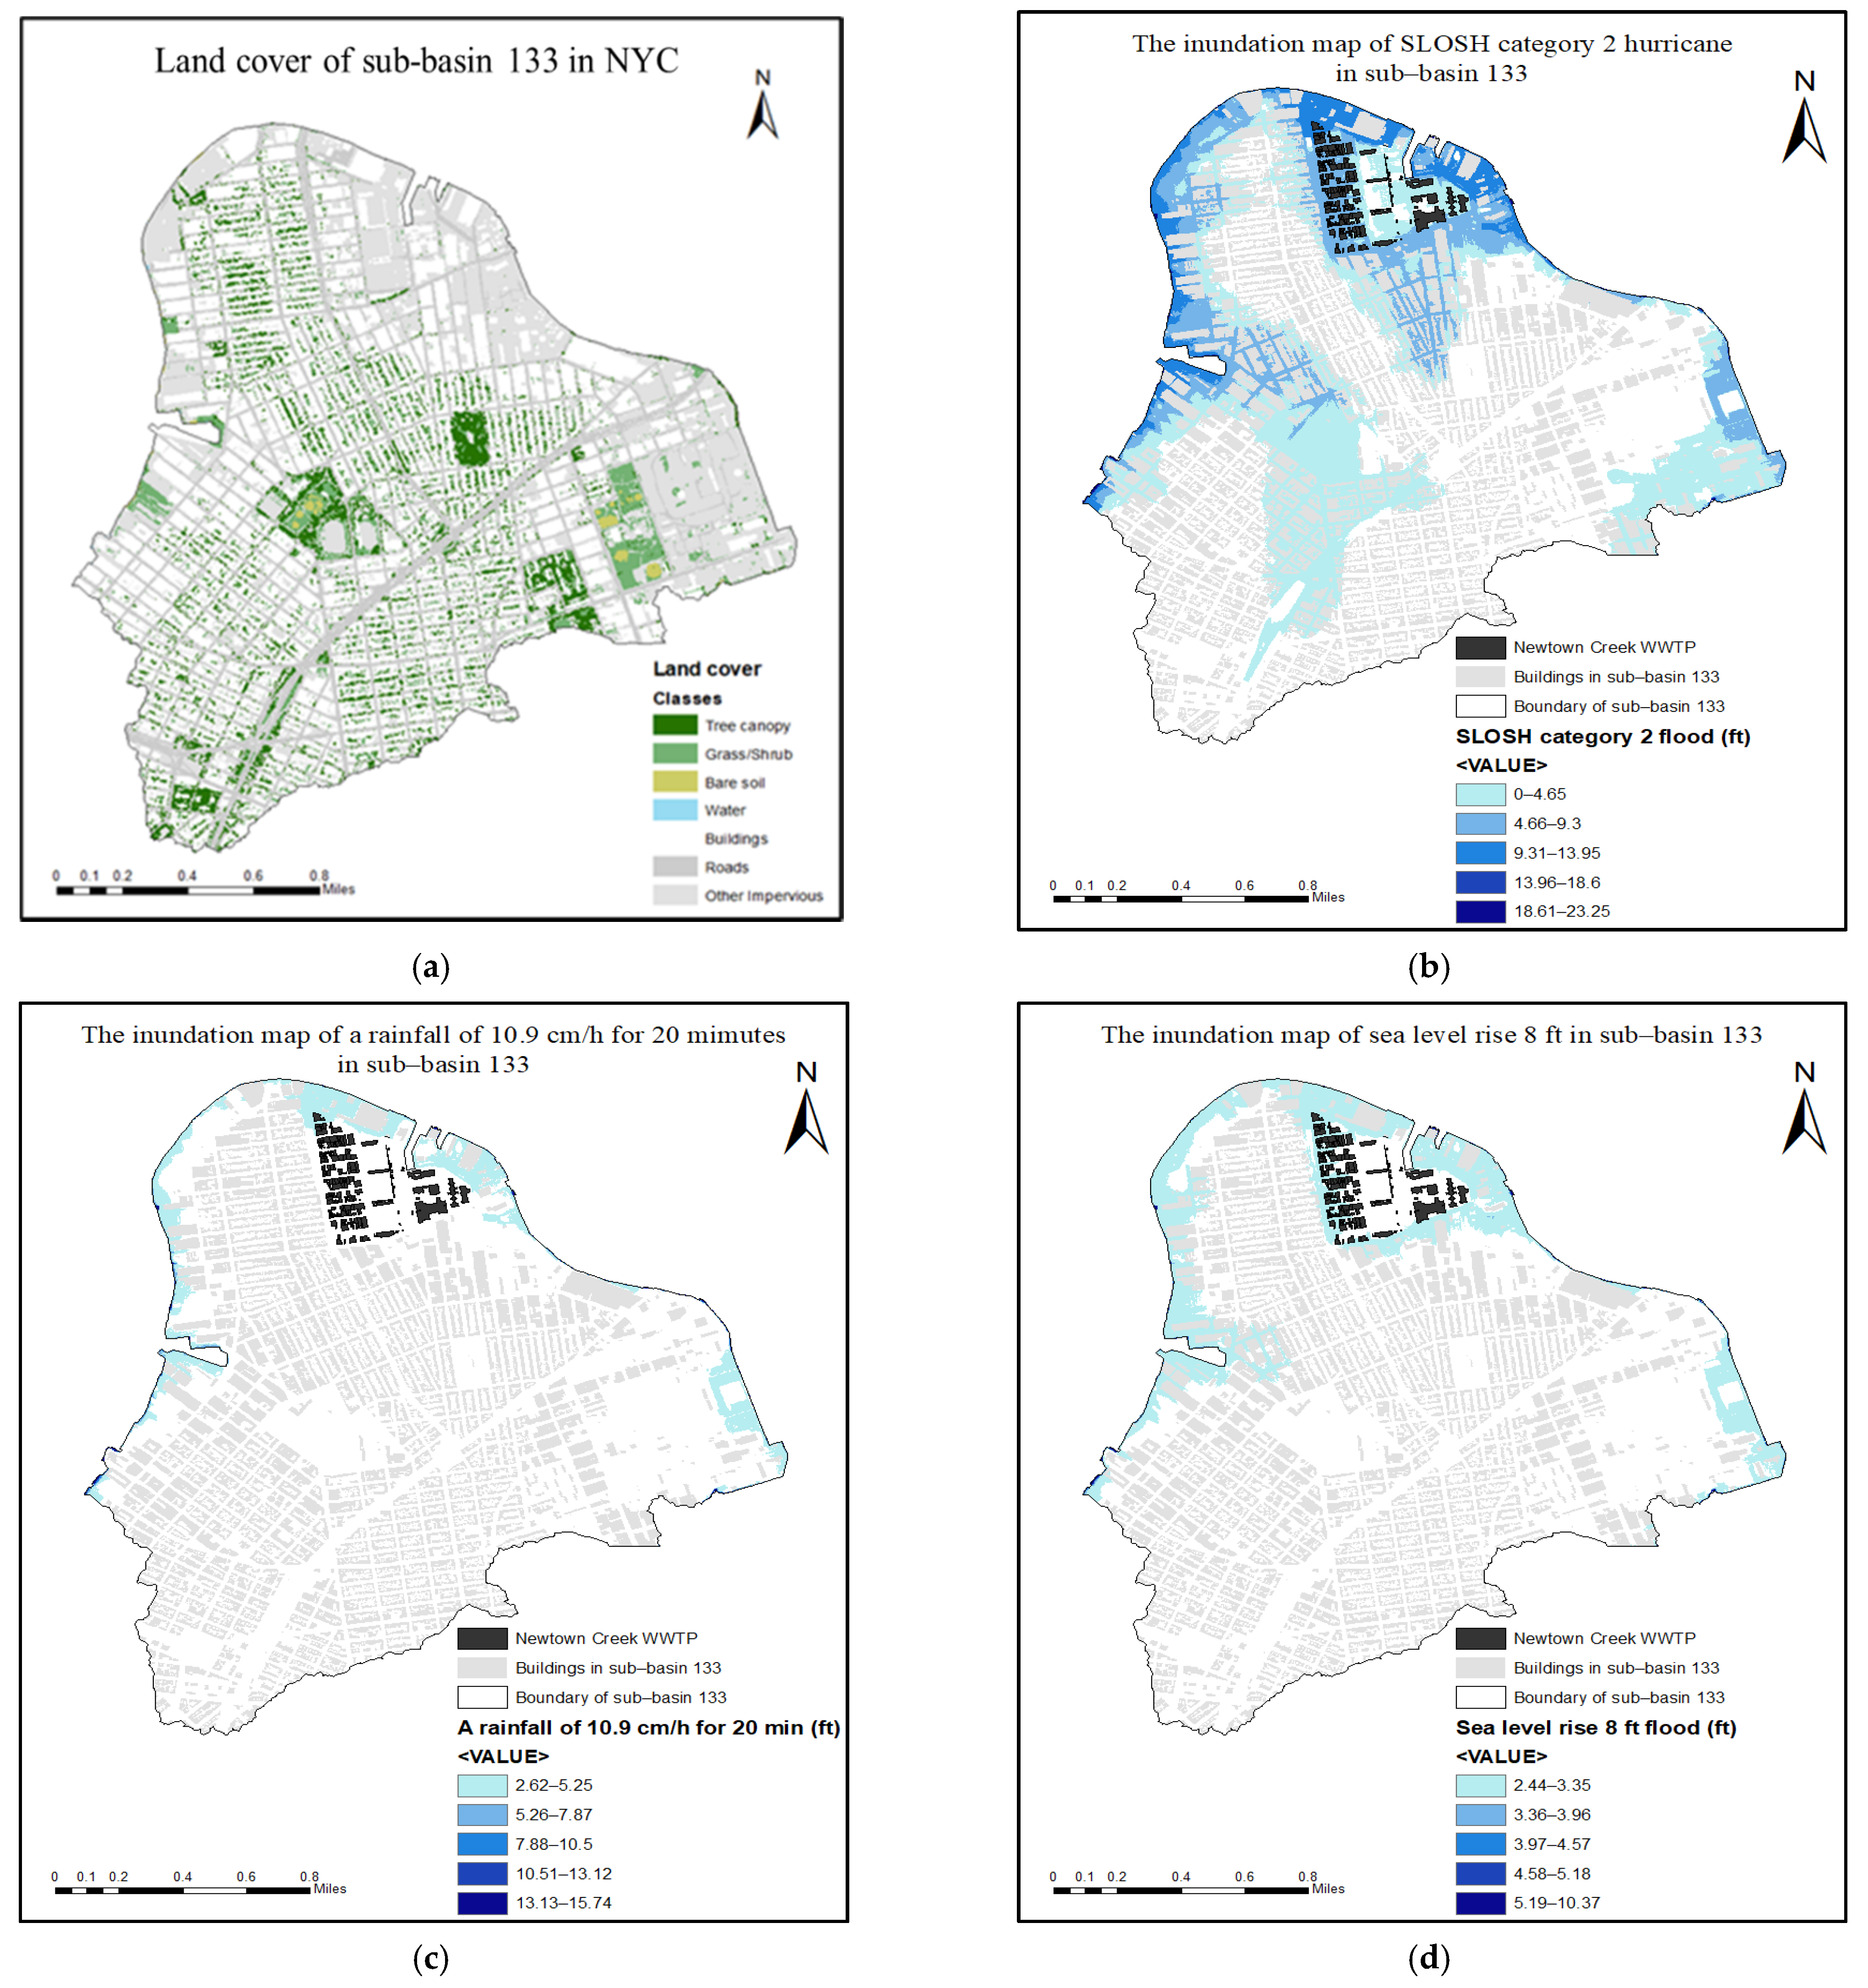
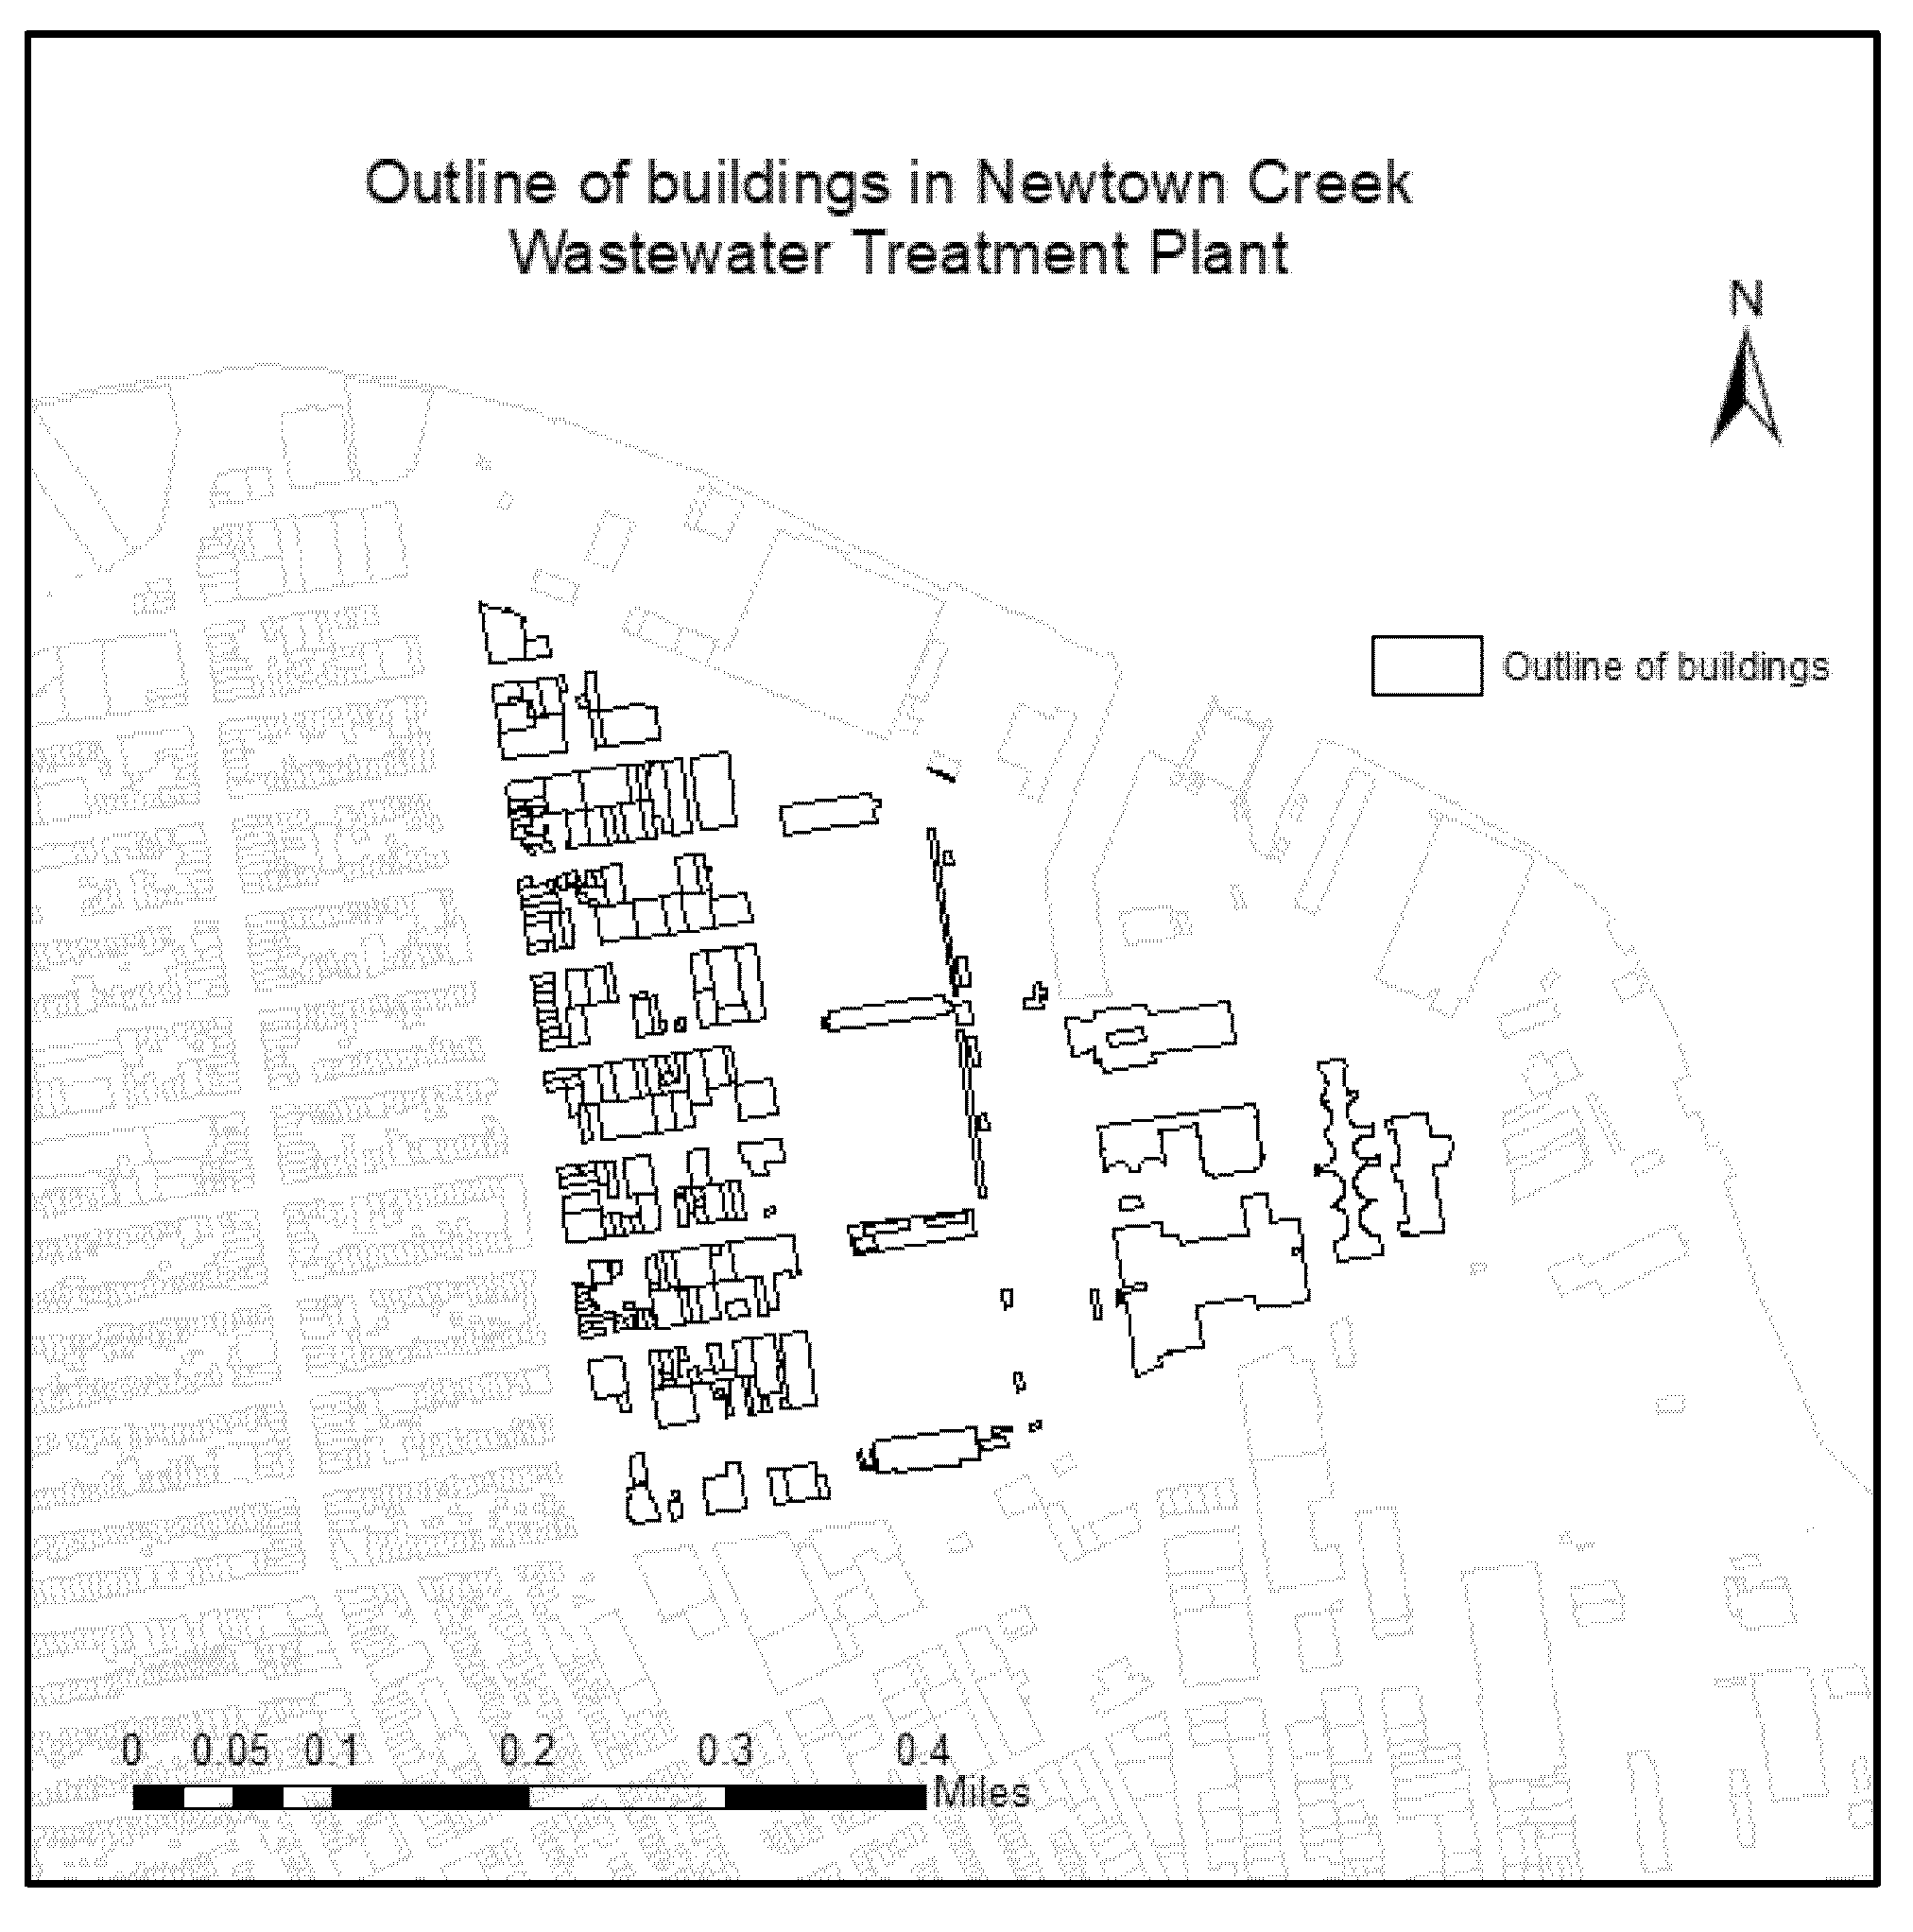
4.1. Case Study
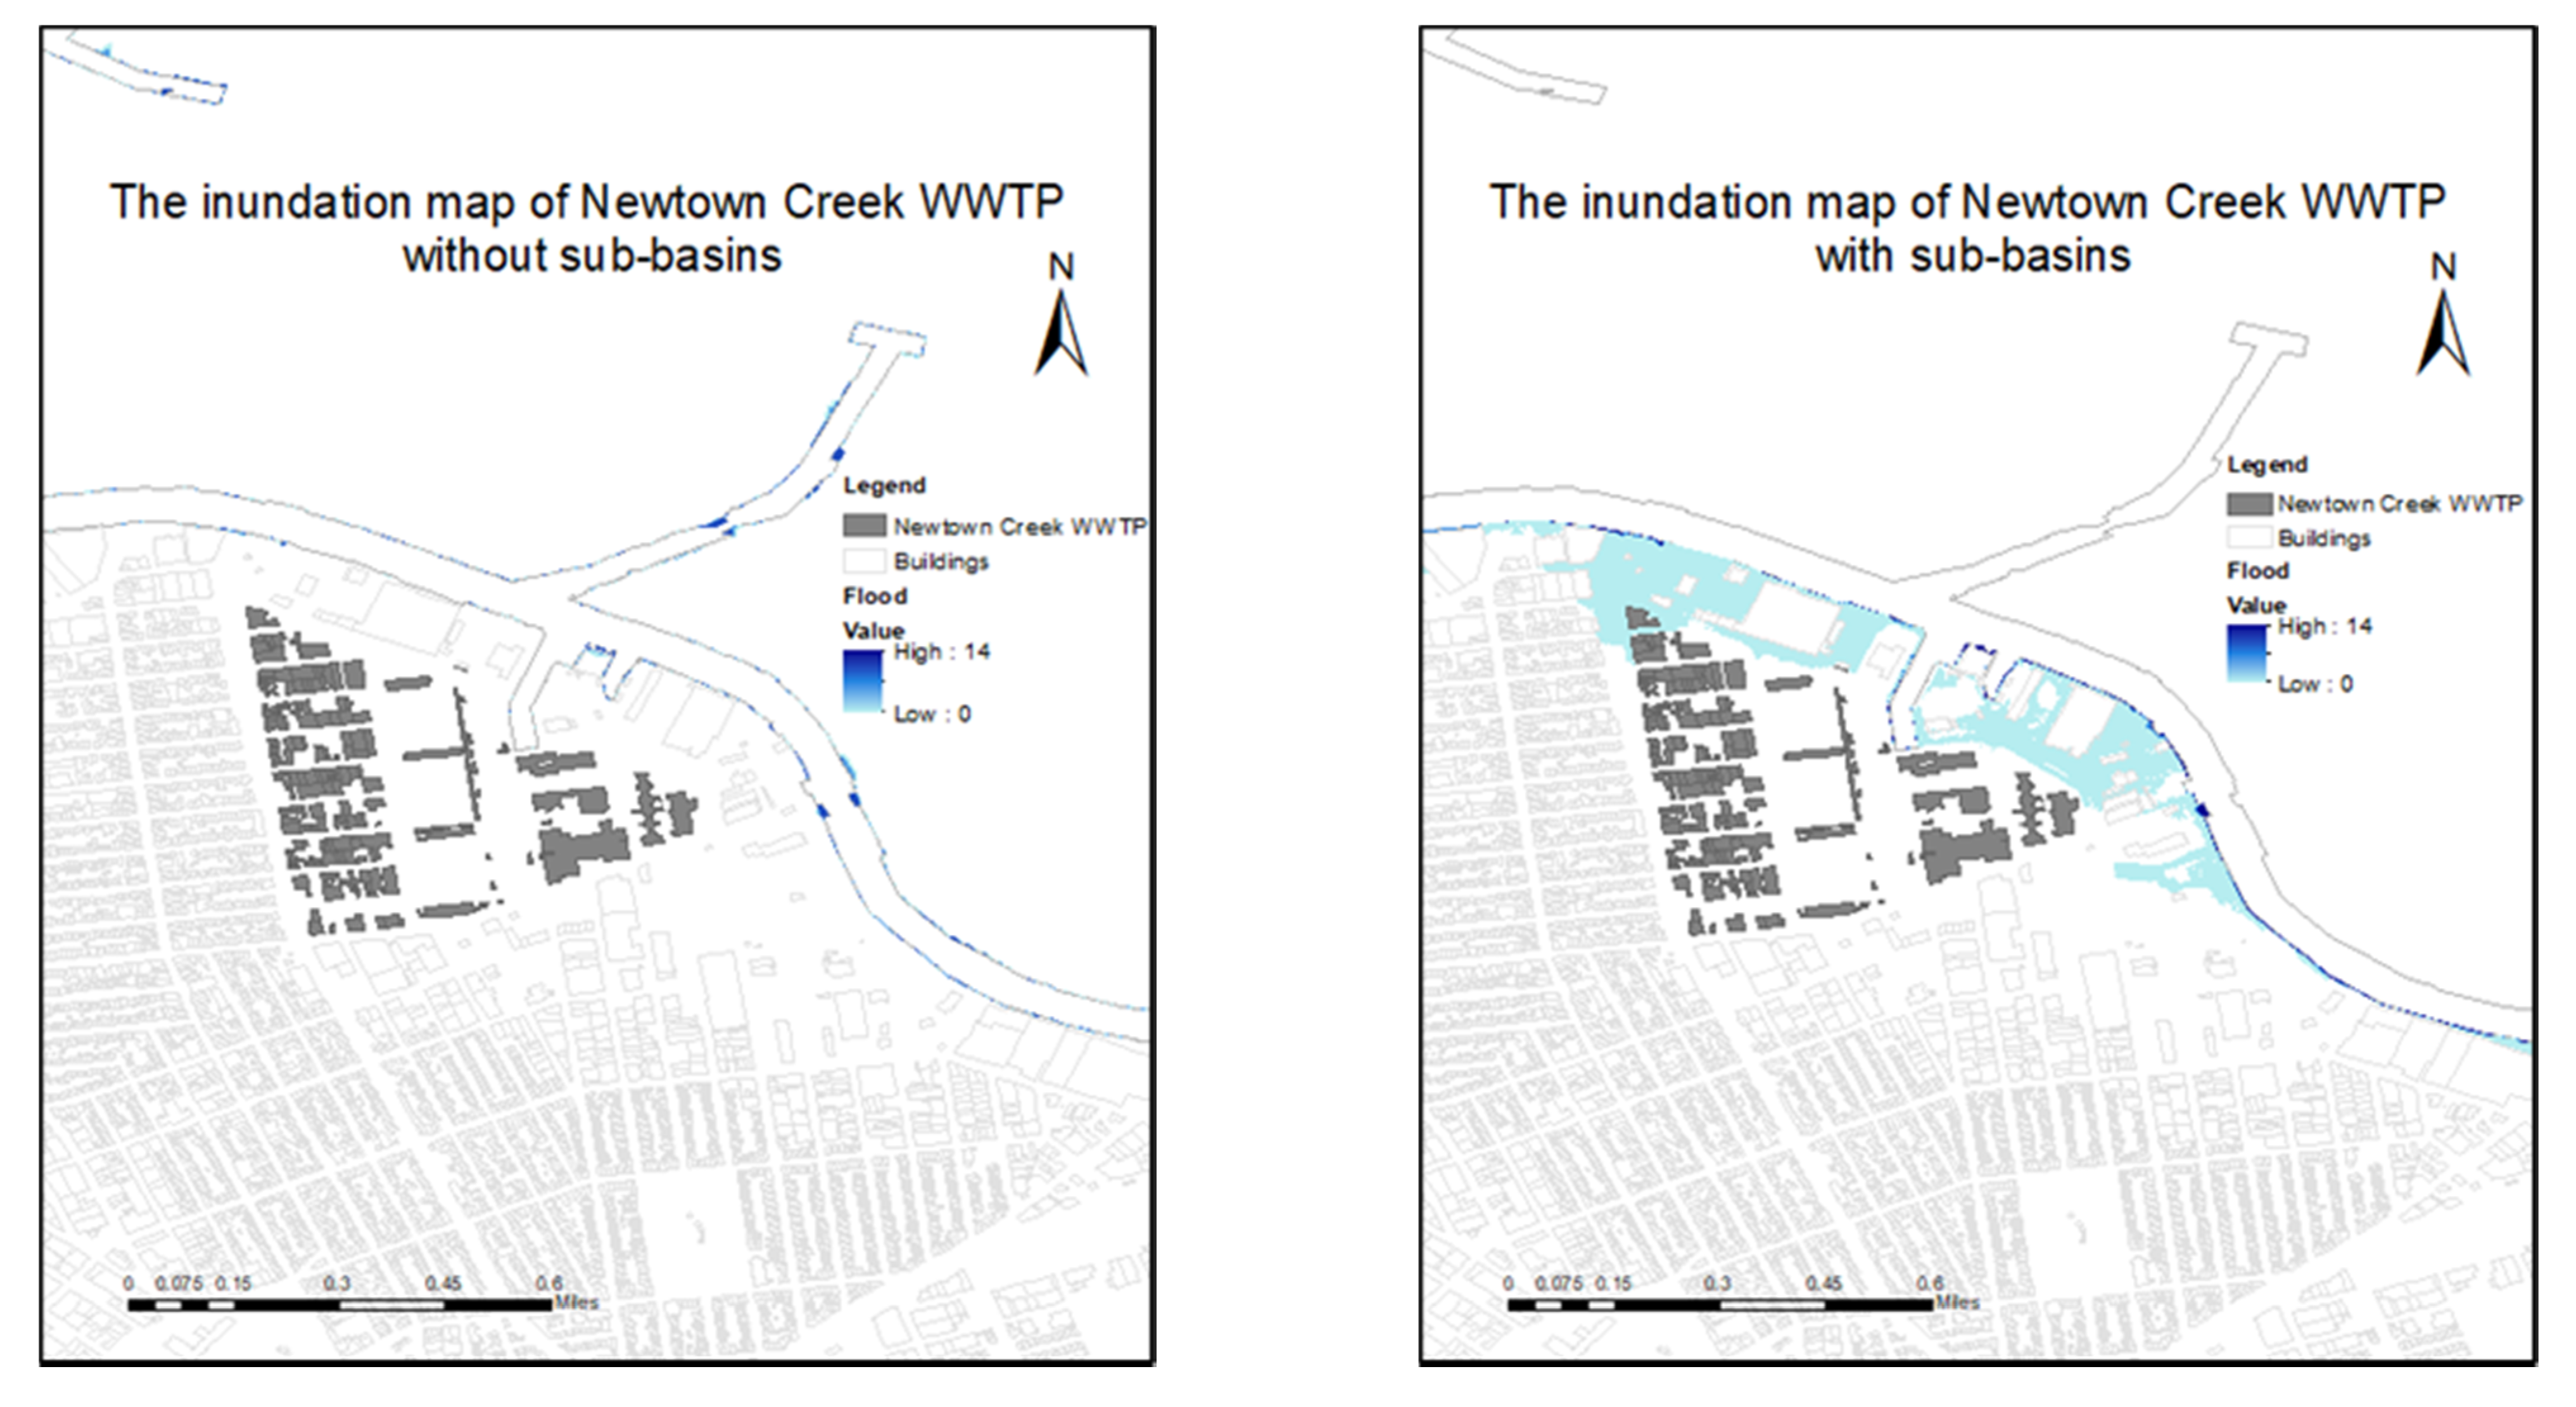
4.2. Comprehensive Study
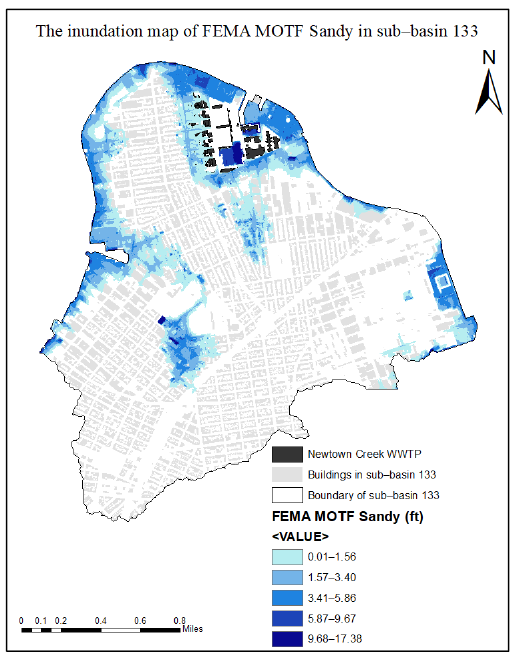
4.3. Comparison between SLOSH and MOTF Study
4.4. Cascading Events
5. Discussion
6. Conclusions
Author Contributions
Funding
Institutional Review Board Statement
Informed Consent Statement
Data Availability Statement
Conflicts of Interest
References
- Hossain, M.K.; Meng, Q. A fine-scale spatial analytics of the assessment and mapping of buildings and population at different risk levels of urban flood. Land Use Policy 2020. [Google Scholar] [CrossRef]
- Sabrin, S.; Karimi, M.; Fahad, M.G.R.; Nazari, R. Quantifying environmental and social vulnerability: Role of urban Heat Island and air quality, a case study of Camden, NJ. Urban Clim. 2020. [CrossRef]
- Fahad, M.G.R.; Saiful Islam, A.K.M.; Nazari, R.; Alfi Hasan, M.; Tarekul Islam, G.M.; Bala, S.K. Regional changes of precipitation and temperature over Bangladesh using bias-corrected multi-model ensemble projections considering high-emission pathways. Int. J. Climatol. 2018, 38, 1634–1648. [Google Scholar] [CrossRef]
- Fahad, M.G.R.; Nazari, R.; Daraio, J.; Lundberg, D.J. Regional study of future temperature and precipitation changes using Bias corrected multi-model ensemble projections considering high Emission pathways. J. Earth Sci. Clim. Chang. 2017. [Google Scholar] [CrossRef] [Green Version]
- Uddin, M.N.; Saiful Islam, A.K.M.; Bala, S.K.; Tarekul Islam, G.M.; Adhikary, S.; Saha, D.; Haque, S.; Fahad, M.G.R.; Akter, R. Mapping of climate vulnerability of the coastal region of Bangladesh using principal component analysis. Appl. Geogr. 2019, 102. [Google Scholar] [CrossRef]
- Fahad, M.G.R.; Nazari, R.; Motamedi, M.H.; Karimi, M.E. Coupled hydrodynamic and geospatial model for assessing resiliency of coastal structures under extreme storm scenarios. Water Resour. Manag. 2020, 34. [Google Scholar] [CrossRef]
- Saiful Islam, A.K.M.; Paul, S.; Mohammed, K.; Billah, M.; Fahad, M.G.R.; Hasan, M.A.; Tarekul Islam, G.M.; Bala, S.K. Hydrological response to climate change of the Brahmaputra basin using CMIP5 general circulation model ensemble. J. Water Clim. Chang. 2018, 9. [Google Scholar] [CrossRef]
- Fahad, M.G.R.; Nazari, R.; Bhasvar, P.; Jalayer, M.; Karimi, M. A decision-support framework for emergency evacuation planning during extreme storm events. Transp. Res. Part D Transp. Environ. 2019. [Google Scholar] [CrossRef]
- Sabrin, S.; Karimi, M.; Nazari, R.; Pratt, J.; Bryk, J. Effects of different urban-vegetation morphology on the canopy-level thermal comfort and the cooling benefits of shade trees: Case-study in Philadelphia. Sustain. Cities Soc. 2021. [Google Scholar] [CrossRef]
- Marshall, A. New York City Underwater: Climate Change Mitigation and Adaptation. Student’s Thesis, Fordham University, New York, NY, USA, 2016. [Google Scholar]
- NYC DEP. Wastewater Treatment System. 2020. Available online: https://www1.nyc.gov/site/dep/water/wastewater-treatment-system.page (accessed on 24 May 2021).
- Los Angeles Sanitation. Sewers and Pumping Plants. 2020. Available online: https://www.lacitysan.org/san/faces/home/portal/s-lsh-wwd/s-lsh-wwd-cw/s-lsh-wwd-cw-s;jsessionid=PlKgE34yeAriNfiOADVlUX_T8iGof92MKQnW3VfL08kSV-U3QsHv!-1769083674!-253863697?_adf.ctrl-state=4n3w8gtee_1&_afrLoop=10579647981988962&_afrWindowMode=0&_afrWindow (accessed on 24 May 2021).
- Scawthorn, C.; Flores, P.; Blais, N.; Seligson, H. HAZUS-MH flood loss estimation methodology. II. Damage and loss assessment. Nat. Hazards Rev. 2006, 7. [Google Scholar] [CrossRef]
- Federal Reserve Bank of New York. New York City. 2019. Available online: https://www.newyorkfed.org/regional-economy/profiles/newyorkcity (accessed on 24 May 2021).
- US Census Bureau. US Census Bureau QuickFacts: United States; US Census Bureau: Suitland, MR, USA, 2020.
- Allen, T.R.; Crawford, T.; Montz, B.; Whitehead, J.; Lovelace, S.; Hanks, A.D.; Christensen, R.; Kearney, G.D. Linking water infrastructure, public Health and sea level rise: Integrated assessment of flood resilience in coastal cities. Public Work Manag. Policy 2019. [Google Scholar] [CrossRef]
- Marsooli, R.; Lin, N. Impacts of climate change on hurricane flood hazards in Jamaica Bay, New York. Clim. Chang. 2020. [Google Scholar] [CrossRef]
- Rosenzweig, C.; Major, D.C.; Demong, K.; Stanton, C.; Horton, R.; Stults, M. Managing climate change risks in New York City’s water system: Assessment and adaptation planning. Mitig. Adapt. Strateg. Glob. Chang. 2007. [Google Scholar] [CrossRef]
- Gornitz, V.; Oppenheimer, M.; Kopp, R.; Horton, R.; Orton, P.; Rosenzweig, C.; Solecki, W.; Patrick, L. Enhancing New York City’s resilience to sea level rise and increased coastal flooding. Urban Clim. 2020. [Google Scholar] [CrossRef]
- Karamouz, M.; Rasoulnia, E.; Zahmatkesh, Z.; Olyaei, M.A.; Baghvand, A. Uncertainty-based flood resiliency evaluation of wastewater treatment plants. J. Hydroinformatics 2016, 18, 990–1006. [Google Scholar] [CrossRef]
- Sajjad, M.; Lin, N.; Chan, J.C.L. Spatial heterogeneities of current and future hurricane flood risk along the US Atlantic and Gulf coasts. Sci. Total Environ. 2020. [Google Scholar] [CrossRef]
- Di Nardo, M.; Madonna, M.; Murino, T.; Castagna, F. Modelling a safety management system using system dynamics at the Bhopal incident. Appl. Sci. 2020, 10, 903. [Google Scholar] [CrossRef] [Green Version]
- Blake, E.S.; Rappaport, E.N.; Landsea, C.W. The Deadliest, Costliest and Most Intense United States Tropical Cyclones from 1851 to 2006 (and Other Frequently Requested Hurricane Facts); NOAA Technical Report NWS TPC-5; National Weather Service, National Hurricane Center: Miami, FL, USA, 2007. [Google Scholar]
- Hatzikyriakou, A.; Lin, N. Simulating storm surge waves for structural vulnerability estimation and flood hazard mapping. Nat. Hazards 2017. [Google Scholar] [CrossRef] [Green Version]
- Miccio, A. Impervious Surfaces. Water Watch NYC. 2020. Available online: https://waterwatchnyc.com/tag/impervious-surfaces/ (accessed on 24 May 2021).
- Hamidi, A.; Farnham, D.J.; Khanbilvardi, R.A. Uncertainty analysis of urban sewer system using spatial simulation of radar rainfall fields: New York City case study. Stoch. Environ. Res. Risk Assess. 2018. [Google Scholar] [CrossRef] [Green Version]
- Wahl, T.; Jain, S.; Bender, J.; Meyers, S.D.; Luther, M.E. Increasing risk of compound flooding from storm surge and rainfall for major US cities. Nat. Clim. Chang. 2015. [Google Scholar] [CrossRef]
- Karamouz, M.; Olyaei, M.; Zarei, L. A Framework for Analyzing Water Quality Reliability of WWTP. In Proceedings of the World Environmental and Water Resources Congress 2017: International Perspectives, History and Heritage, Emerging Technologies and Student Papers, Sacramento, CA, USA, 21–25 May 2017. [Google Scholar] [CrossRef]
- De Sousa, M.R.C.; Montalto, F.A.; Spatari, S.M. Using life cycle assessment to evaluate green and grey combined sewer overflow control strategies. J. Ind. Ecol. 2012. [Google Scholar] [CrossRef]
- Balci, P.; Cohn, A. NYC Wastewater Resiliency Plan: Climate Risk Assessment and Adaptation. In Proceedings of the International Conference on Sustainable Infrastructure, Long Beach, CA, USA, 6–8 November 2014. [Google Scholar] [CrossRef]
- Karamouz, M.; Rasoulnia, E.; Olyai, A.M.; Zahmatkesh, Z. Prioritizing Investments in Improving flood resilience and reliability of wastewater treatment infrastructure. J. Infrastruct. Syst. 2018. [Google Scholar] [CrossRef]
- Al-Suhili, R.; Cullen, C.; Khanbilvardi, R. An urban flash flood alert tool for megacities-Application for Manhattan, New York City, USA. Hydrology 2019, 6, 56. [Google Scholar] [CrossRef] [Green Version]
- Kovanen, J.; Oksanen, J.; Sarjakoski, T. Near real-time coastal flood inundation simulation with uncertainty analysis and GPU acceleration in a web environment. Comput. Geosci. 2018. [Google Scholar] [CrossRef]
- Jelesnianski, C.P.C.; Chen, J.; Shaffer, J.A. SLOSH: Sea, Lake and Overland Surges from Hurricanes; NOAA Technical Report NWS 48; US Department of Commerce, National Oceanic and Atmospheric Administration, National Weather Service: Silver Spring, MD, USA, 1992. [Google Scholar]
- Mayo, T.; Lin, N. The effect of the surface wind field representation in the operational storm surge model of the National Hurricane Center. Atmosphere 2019, 10, 193. [Google Scholar] [CrossRef] [Green Version]
- Decker, E.; Dotson-Westphalen, P. Green Space Categorization as a Function of Run off and Infiltration Rates. 2015. Available online: http://www.uvm.edu/~pbierman/classes/morph/morph2003/documents_dnldorview/projects/finalprojects_withedits/decker_dotson_final.pdf (accessed on 13 July 2021).
- NYS Department of Environmental Conservation. New York State Stormwater Management Design Manual. January 2015. Available online: https://www.dec.ny.gov/chemical/29072.html (accessed on 24 May 2021).
- Perica, S.; Martin, D.; Pavlovic, S.; Roy, I.; Laurent, M.S.; Trypaluk, C.; Unruh, D.; Yekta, M.; Bonin, G. Precipitation-Frequency Atlas of the United States; NOAA Atlas 14; US Department of Commerce, National Oceanic and Atmospheric Administration, National Weather Service: Silver Spring, MD, USA, 2013; Volume 9. [Google Scholar]
- NOAA. Sea Level Rise Viewer. 2020. Available online: https://coast.noaa.gov/digitalcoast/tools/slr.html (accessed on 24 May 2021).
- Tokgoz, B.E.; Gheorghe, A.V. Resilience quantification and its application to a residential building subject to hurricane winds. Int. J. Disaster Risk Sci. 2013, 4, 105–114. [Google Scholar] [CrossRef] [Green Version]
- Friedland, C.J.; Levitan, M.L. Loss-Consistent Categorization of Hurricane Wind and Storm Surge Damage for Residential Structures. 2009. Available online: https://www.researchgate.net/publication/228513546_Loss-consistent_categorization_of_hurricane_wind_and_storm_surge_damage_for_residential_structures (accessed on 13 July 2021).
- FEMA. HAZUS-MH Flood Model; Technical Manual; FEMA: Washington, DC, USA, 2009. [Google Scholar]
- Olyaei, M.A.; Karamouz, M.; Farmani, R. Framework for assessing flood reliability and resilience of wastewater treatment plants. J. Environ. Eng. 2018. [Google Scholar] [CrossRef]
- Karamouz, M.; Taheri, M.; Khalili, P.; Chen, X. Building infrastructure resilience in coastal flood risk management. J. Water Resour. Plan. Manag. 2019. [Google Scholar] [CrossRef]
- Rosenzweig, C.; Solecki, W.D.; Blake, R.; Bowman, M.; Faris, C.; Gornitz, V.; Horton, R.; Jacob, K.; Le Blanc, A.; Leichenko, R.; et al. Developing coastal adaptation to climate change in the New York City infrastructure-shed: Process, approach, tools and strategies. Clim. Chang. 2011. [Google Scholar] [CrossRef] [Green Version]
- Serafin, K.A.; Ruggiero, P. Simulating extreme total water levels using a time-dependent, extreme value approach. J. Geophys. Res. Ocean. 2014. [Google Scholar] [CrossRef] [Green Version]
- McAllister, T.T. The Performance of Essential Facilities in Superstorm Sandy. In Proceedings of the Structures Congress 2014, Boston, MA, USA, 3–5 April 2014. [Google Scholar] [CrossRef]


| Green Space Condition | Average Infiltration Rate (cm/h) |
|---|---|
| Good | 5.24 |
| Moderate | 0.63 |
| Poor | 0.035 |
| Impervious | 0 |
| WWTPs | Capacity | Damage (%) by Depth of Flooding (in Feet) | HAZUS Valuation (in Thousands of USD) | ||||||||||
|---|---|---|---|---|---|---|---|---|---|---|---|---|---|
| 0 | 1 | 2 | 3 | 4 | 5 | 6 | 7 | 8 | 9 | 10 | |||
| Small WWTP | <50 | 0 | 5 | 8 | 10 | 17 | 24 | 30 | 30 | 30 | 30 | 40 | 60,000 |
| Medium WWTP | 20–200 | 0 | 5 | 8 | 10 | 17 | 24 | 30 | 30 | 30 | 30 | 40 | 200,000 |
| Large WWTP | >200 | 0 | 5 | 8 | 10 | 17 | 24 | 30 | 30 | 30 | 30 | 40 | 720,000 |
| WWTPs | Design Capacity (MGD) | HAZUS Valuation (Thousands of USD) |
|---|---|---|
| Port Richmond | 60.0 | 200,000 |
| Oakwood Beach | 39.9 | 60,000 |
| Tallman Island | 80.0 | 200,000 |
| Rockaway | 45.0 | 60,000 |
| Jamaica | 100.0 | 200,000 |
| Bowery Bay | 150.0 | 200,000 |
| Hunts Point | 200.0 | 200,000 |
| Red Hook | 60.0 | 200,000 |
| Owls Head | 120.0 | 200,000 |
| Newtown Creek | 310.0 | 720,000 |
| Coney Island | 110.0 | 200,000 |
| 26th Ward | 85.0 | 200,000 |
| North River | 170.0 | 200,000 |
| Wards Island | 275.0 | 720,000 |
| Newtown Creek WWTP | Building Perimeter (m) | Submerged Length (m) | Submerged Length | Submerged Depth (ft) | Damage (Thousands of USD) |
|---|---|---|---|---|---|
| Storm Surge (C2) | 18,381.72 | 16,934.28 | 92.13% | 9.65 | 288,000 |
| Rainfall (10.9 cm/h for 20 min) | 18,381.72 | 624.46 | 3.40% | 1.31 | 36,000 |
| Sea Level Rise (8ft) | 18,381.72 | 7014.86 | 38.16% | 3.81 | 122,400 |
| WWTPs in NYC | SLOSH C1 | SLOSH C2 | FEMA Sandy | |||
|---|---|---|---|---|---|---|
| Percentage of the Submerged Length | Flood Depth (m) | Percentage of the Submerged Length | Flood Depth (m) | Percentage of the Submerged Length | Flood Depth (m) | |
| Port Richmond | 50.23% | 3.83 | 96.66% | 9.54 | 34.92% | 5.91 |
| Oakwood Beach | 13.55% | 1.54 | 52.75% | 7.78 | 38.60% | 15.54 |
| Tallman Island | 7.94% | 0.46 | 94.25% | 6.66 | 16.35% | 13.08 |
| Rockaway | 68.28% | 2.33 | 100% | 9.42 | 100% | 13.9 |
| Jamaica | 0.00% | 0 | 98.09% | 4.67 | 0.00% | 0 |
| Bowery Bay | 3.37% | 0.24 | 63.19% | 6.46 | 5.70% | 9.07 |
| Hunts Point | 2.74% | 0.35 | 42.20% | 6.55 | 2.29% | 13.17 |
| Red Hook | 20.53% | 4.58 | 100% | 10.62 | 21.75% | 3.46 |
| Owls Head | 24.57% | 1.42 | 100% | 7.89 | 31.59% | 11.47 |
| Newtown Creek | 59.47% | 3.73 | 92.13% | 9.65 | 46.35% | 17.38 |
| Coney Island | 0.00% | 0 | 100% | 7.22 | 50.38% | 13.04 |
| 26th Ward | 1.21% | 1.83 | 91.36% | 12.48 | 28.01% | 13.15 |
| North River | 7.66% | 12.84 | 55.71% | 19 | 50.52% | 11.11 |
| Wards Island | 0.00% | 0 | 6.94% | 5.1 | 5.25% | 7.03 |
| WWTPs in NYC | Amount of Damage (Thousands of USD) | ||
|---|---|---|---|
| SLOSH C1 | SLOSH C2 | FEMA Sandy | |
| Port Richmond | 34,000 | 80,000 | 60,000 |
| Oakwood Beach | 4800 | 18,000 | 24,000 |
| Tallman Island | 0 | 60,000 | 80,000 |
| Rockaway | 4800 | 18,000 | 24,000 |
| Jamaica | 0 | 48,000 | 0 |
| Bowery Bay | 0 | 60,000 | 60,000 |
| Hunts Point | 0 | 80,000 | 80,000 |
| Red Hook | 34,000 | 80,000 | 20,000 |
| Owls Head | 10,000 | 60,000 | 80,000 |
| Newtown Creek | 122,400 | 288,000 | 288,000 |
| Coney Island | 0 | 60,000 | 80,000 |
| 26th Ward | 16,000 | 80,000 | 80,000 |
| North River | 80,000 | 80,000 | 80,000 |
| Wards Island | 0 | 172,800 | 216,000 |
| SUM | 306,000 | 1,184,800 | 1,172,000 |
| WWTP | Total Flood Depth/ft | Rainfall 100 yr/ft | Sea Level Rise 1 ft/ft | Strom Surge C1/ft |
|---|---|---|---|---|
| Port Richmond | 13.96 | 6.89 | 0 | 7.07 |
| Oakwood Beach | 1.54 | 0 | 0 | 1.54 |
| Tallman Island | 0.46 | 0 | 0 | 0.46 |
| Rockaway | 2.33 | 0 | 0 | 2.33 |
| Jamaica | 0 | 0 | 0 | 0 |
| Bowery Bay | 0.24 | 0 | 0 | 0.24 |
| Hunts Point | 0.35 | 0 | 0 | 0.35 |
| Red Hook | 4.62 | 0 | 0 | 4.62 |
| Owls Head | 1.42 | 0 | 0 | 1.42 |
| Newtown Creek | 4.06 | 0.33 | 0 | 3.73 |
| Coney Island | 0 | 0 | 0 | 0 |
| 26th Ward | 1.83 | 0 | 0 | 1.83 |
| North River | 2.92 | 0 | 0 | 2.92 |
| Wards Island | 0 | 0 | 0 | 0 |
| WWTPs | Points | Buildings | |
|---|---|---|---|
| Flood Depth (ft) | Minimum Flood Depth (ft) | Maximum Flood Depth (ft) | |
| Port Richmond | 6.27 | 2.95 | 9.54 |
| Oakwood Beach | 7.65 | 1.19 | 7.78 |
| Tallman Island | 0.10 | 0.09 | 6.66 |
| Rockaway | 6.13 | 2.79 | 9.42 |
| Jamaica | 4.63 | 1.32 | 4.67 |
| Bowery Bay | \ | 3.11 | 6.46 |
| Hunts Point | 6.53 | 3.23 | 6.55 |
| Red Hook | 0.96 | 0.79 | 10.62 |
| Owls Head | 4.58 | 1.31 | 7.89 |
| Newtown Creek | \ | 2.90 | 9.65 |
| Coney Island | 7.12 | 3.78 | 7.22 |
| 26th Ward | 5.9 | 2.33 | 12.48 |
| North River | \ | 2.35 | 19.00 |
| Wards Island | \ | 1.71 | 5.10 |
| Newtown Creek WWTP | Without Sub-Basin (NYC) | With Sub-Basin (Sub-Basin 133) |
|---|---|---|
| Area of Bare Soils/m2 | 10,262,756.5 | 29,164.3 |
| Area of Tree Canopy/m2 | 158,648,274.6 | 582,010.2 |
| Area of Grass or Shrubs/m2 | 141,279,429.4 | 375,189.3 |
| Total Area/m2 | 782,750,587.5 | 5,067,975.8 |
| Runoff Volume/m3 | 16,160,876.3 | 114,997.8 |
| Flood Elevation/m | 0.6 | 2.4 |
| Flood Depth/ft | 0.0 | 1.31 |
Publisher’s Note: MDPI stays neutral with regard to jurisdictional claims in published maps and institutional affiliations. |
© 2021 by the authors. Licensee MDPI, Basel, Switzerland. This article is an open access article distributed under the terms and conditions of the Creative Commons Attribution (CC BY) license (https://creativecommons.org/licenses/by/4.0/).
Share and Cite
Sun, Q.; Nazari, R.; Karimi, M.; Rabbani Fahad, M.G.; Peters, R.W. Comprehensive Flood Risk Assessment for Wastewater Treatment Plants under Extreme Storm Events: A Case Study for New York City, United States. Appl. Sci. 2021, 11, 6694. https://doi.org/10.3390/app11156694
Sun Q, Nazari R, Karimi M, Rabbani Fahad MG, Peters RW. Comprehensive Flood Risk Assessment for Wastewater Treatment Plants under Extreme Storm Events: A Case Study for New York City, United States. Applied Sciences. 2021; 11(15):6694. https://doi.org/10.3390/app11156694
Chicago/Turabian StyleSun, Qing, Rouzbeh Nazari, Maryam Karimi, MD Golam Rabbani Fahad, and Robert W. Peters. 2021. "Comprehensive Flood Risk Assessment for Wastewater Treatment Plants under Extreme Storm Events: A Case Study for New York City, United States" Applied Sciences 11, no. 15: 6694. https://doi.org/10.3390/app11156694
APA StyleSun, Q., Nazari, R., Karimi, M., Rabbani Fahad, M. G., & Peters, R. W. (2021). Comprehensive Flood Risk Assessment for Wastewater Treatment Plants under Extreme Storm Events: A Case Study for New York City, United States. Applied Sciences, 11(15), 6694. https://doi.org/10.3390/app11156694