1. Introduction
Low energy buildings, and above all modern Nearly Zero Energy Buildings (NZEB), are based on the minimization of non-renewable primary energy consumption. The wide use of high efficiency heating/cooling systems, the integration of renewable energy sources, and a high level of thermal insulation of the building are the most suitable strategies to reach this goal. The heat pump is one of the most efficient systems to be considered. Particular care is advisable with regard to the selection of both the heating system (to lower the heat supply temperature) and the heat source. This second aspect should be carefully evaluated as the potential advantages of alternative heat sources could be significant. The most common heat source of a heat pump is the outside air: it is (at first sight) free and easily available. Nevertheless, the energy cost of air movement and its decreasing temperature when the building thermal load is increasing determine the decreasing of the coefficient of performance (COP) and thermal capacity [
1]. That is why there is an increasing interest in dual source systems during the last decades, both from the experimental and the theoretical points of view.
The main idea in dual source systems is that the heat pump absorbs heat from two heat sources. Two arrangements are widely studied: air source heat pump/solar collectors and ground source heat pump/solar collectors [
2]. Two configurations are typical: “in series” (the two sources are aligned in series so that the former raises the temperature before that heat is taken from the latter) or “dual source” (the heat pump takes heat choosing time by time the most favorable source from the thermodynamic point of view) [
3,
4].
In the past, the authors studied by dynamic simulation several scenarios to define, given an additional budget for the heat pump system, whether it is a good option, from the primary energy consumption point of view, to invest in ground source or in solar source for the heating system [
5]. The results highlighted that, both for absorption and compression heat pump systems, the dual source configuration is the most energy efficient solution, sizing the ground exchangers to allow a minimum ground inlet temperature of −2 °C, and spending the rest of the budget to buy solar collectors.
Cai et al., developed a dynamic model to simulate the behavior of a photovoltaic/thermal (PVT)-air dual source heat pump water heater system [
6]. In this system, a PVT evaporator and an air source evaporator were connected in parallel to recover energy from both solar and environmental sources. The authors concluded that the dual source heat pump system employing the PVT collector is more efficient than that utilizing a normal solar thermal collector.
The operation characteristics of a dual source multifunctional heat pump system were investigated in [
7]. A theoretical and experimental analysis of an air source and solar energy heat pump was carried out under various working modes to provide air conditioning and domestic water all year round. Chargui et al. [
8] studied a dual source heat pump system with a ground heat exchanger and a flat plate collector integrated in the building roof. By means of experimental data and Trnsys
® dynamic simulation, they demonstrated that the COP of the dual source heat pump was enhanced with the increase of the solar radiation during the typical sunny day in the heating season and with the solar collector area. In [
9], three different systems were investigated for a single family house through one year simulation by Trnsys
® software: a dual source (air and PVT) heat pump integrated with two storage tanks to directly store the hot water for domestic hot water (DHW) if the water temperature reached the set point or to send it to the cold storage to act as heat source; an air–water heat pump integrated with standard photovoltaic panels; and an air–water heat pump integrated with hybrid PVT panels for DHW production only.
Multisource is an extension of dual source, when more than two heat sources are used by the heat pump. In [
10], an integrated heat pump system utilizing a geothermal field, solar energy, and drain water heat recovery was empirically studied. The continuous monitoring of the real COP of the space heating plant allowed useful adjustments of the control system to enhance the efficiency to be proposed. Barbieri et al. [
11] developed a model of a multisource and multi-energy plant in the Matlab
® environment. The goal of their study was the optimization of the size of the different technologies by using a genetic algorithm, with the goal of minimizing the primary energy consumption in different climatic zones.
Different combinations of a PVT collector and a multisource (air, solar, and ground) heat pump for space heating and DHW production of a single-family house located north-east of Italy were investigated by Trnsys
® in [
12]. A dedicated mathematical model based on the equivalent electrical circuit was developed by the authors for the estimation of the electrical and thermal performances of PVT. An appreciable increase of energy efficiency between 14% and 26% compared to a standard air-to-water heat pump system was reported. Han et al. [
13] studied a multisource hybrid heat pump system with seasonal thermal storage utilizing solar, geothermal, and air energy. By optimizing the transition conditions of the different operating modes, the average COP of the system with seasonal thermal storage was 3.06, which allows a simple payback period of the multisource heat pump of 4 years.
In contrast to the previous studies, recently the authors studied a configuration with the coupling of evacuated tube collectors and PVT modules to drive an absorption heat pump-based plant [
14]. By means of dynamic simulations, the optimal sizing of the storage tanks, of the ground heat exchanger, and of the two solar fields in two different climates was developed.
As a matter of fact, there is a complexity both in the design phase and in the controlling because such systems include many different appliances. To the authors’ best knowledge, very few works have focused on the optimization of the control strategy. For example, Miao et al. [
15] identified more than 10% difference of heating energy usage of a water-to-water heat pump system integrated with solar thermal collectors, vertical boreholes, and horizontal underground loop by comparing two different control strategies. More recently, Emmi et al. [
16] studied the thermal and electrical behavior of a water-to-water heat pump system facing heating, cooling, and DHW loads, supplied by two thermal reservoirs connected to a solar loop (composed either of solar thermal collectors or PVT collectors) and to a ground loop. The authors described the control strategy to vary the set-point temperatures to simulate different management choices and operating conditions.
Recently, a review of the solar-assisted heat pump technology identified the multisource heat pump and its control logic as one of the key technological challenges for the present and the future of this technology [
17].
In this paper, the authors reported on two case studies in which they were involved in the recent past, where the dynamic simulation was a useful tool to design the multisource heat pump system and its control logic with the aim of the best energy performance in terms of minimization of the non-renewable primary energy consumption. A high grade of independency from the electric grid was a second goal obtained for one of the two cases. For both the cases presented, the main ideas driving the design phase of the plants were introduced first, and the outstanding elements of the control logic were described successively.
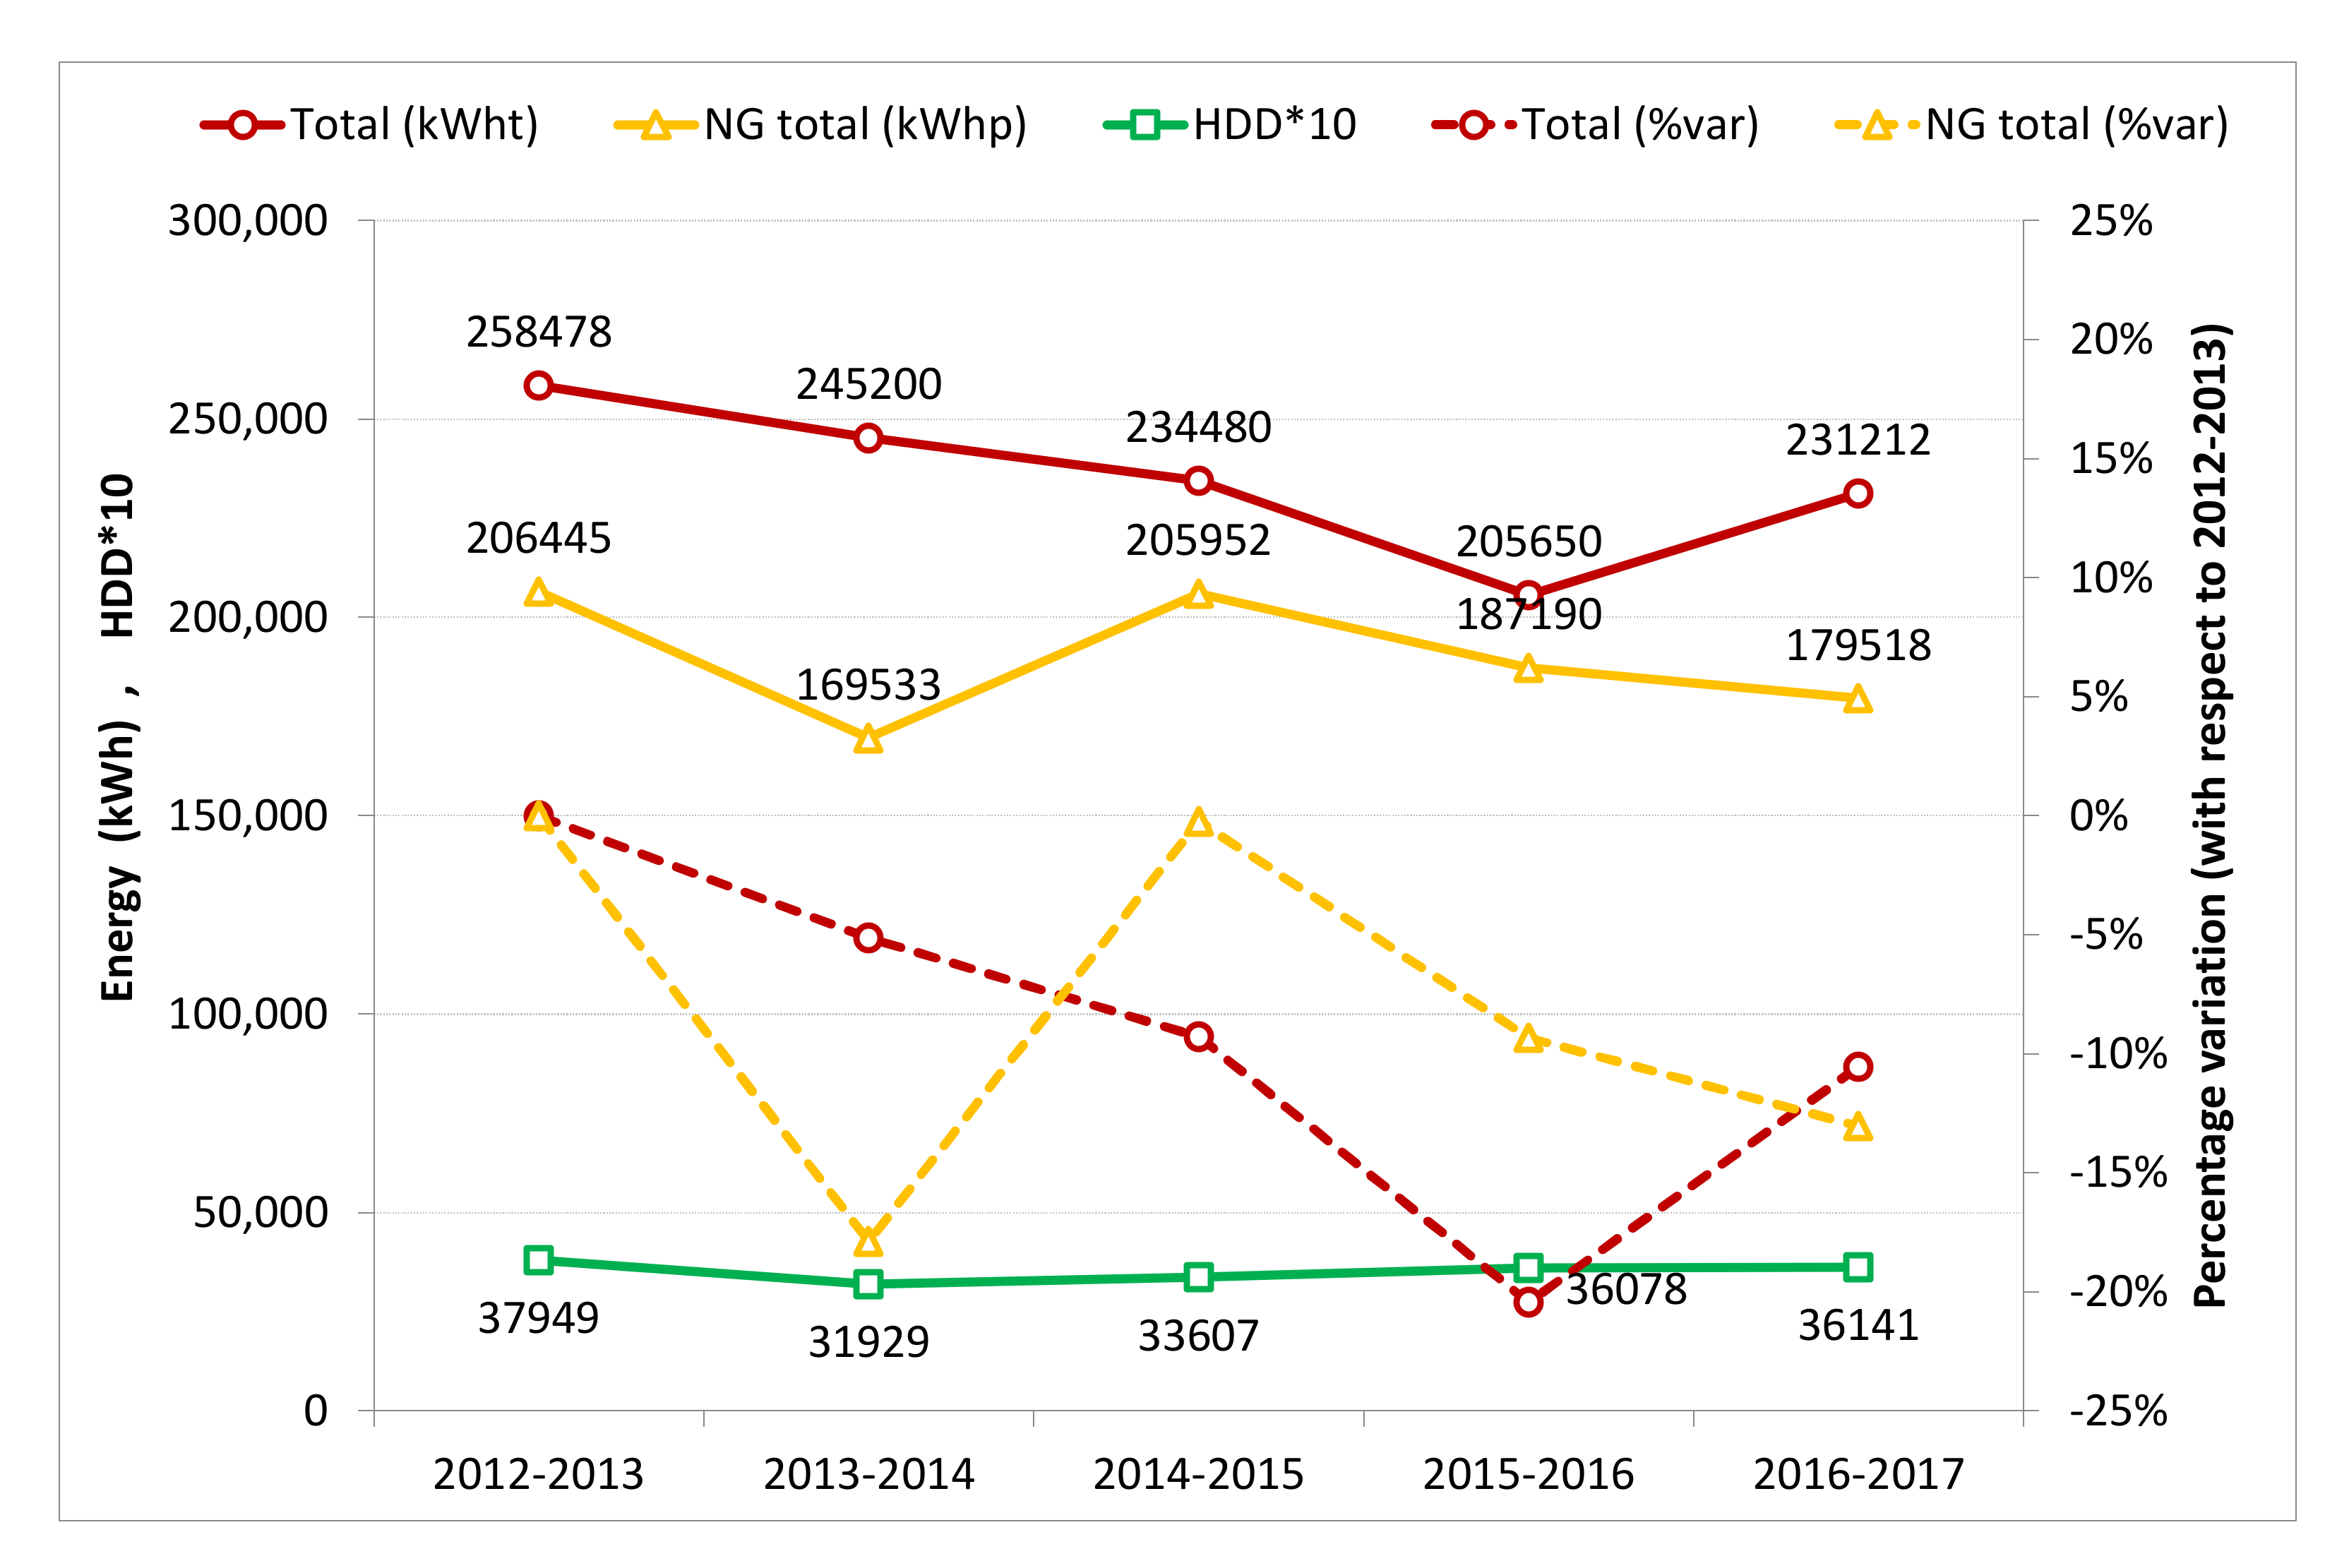
The first case study refers to a school building (built and operative since 2009) in Agordo, a mountain resort in Belluno province, North Italy [
18,
19]. Different solutions were evaluated with respect to the heating and ventilation systems through dynamic simulation. An integrated source absorption heat pump system was designed to fulfil the needs of the building: the sources were ground, sun, and recovery on ventilation. The control logic conceived by the authors provided that the system works at two different temperature levels: a higher one for the ventilation system and a lower one for the radiant floor space heating system. The two different systems work independently and with different time schedules. For this case study, an analysis of the energy performance was carried out based on the evaluation of data obtained through real-time monitoring of the HVAC system in operation for many heating seasons.
For the second case study, a dual source glazed PVT/ground heat pump system coupled to a retrofitted part of an old school building in the north of Italy was presented [
20]. Such a configuration allowed the thermal efficiency of the plant and the electric efficiency of the PVT to increase, preventing the risk of cell damage due to overheating. The contemporaneity of different thermal loads during the year (DHW, heating, and cooling) made it necessary to set up a suitable scheme of the HVAC plant and its control logic by dynamic simulation. After describing the modeling hypotheses of the HVAC plant, and the operation control logic of the dual source heat pump system, different solutions were compared to evaluate the energy performance.
As the originality of this study, the conceptualization of innovative control logics and their dynamic simulation by means of Trnsys® are presented for two real HVAC plants, in order to attain very high efficiency and low non-renewable primary energy consumption, and the best configuration in terms of integration and management of renewable energy and multisource heat pump systems.
2. Methods
The two case studies are here described, focusing on the control logic of the multisource heat pump system that allowed us to attain very interesting energy performance.
2.1. A Multisource Heat Pump System for a New School Building: Design Phase
The authors contributed to the design, monitoring, and data analysis of the multisource absorption heat pump plant of a new school building in the town of Agordo (North Italy). In this site, the climate is a temperate one (Köppen climate classification, Cfb-Cfc) with cold winters (3376 heating degree days—HDD) and mild or cool summers. The main building features are: 5680 m
2 of heated area and 19,640 m
3 of enclosed gross heated volume (
Figure 1).
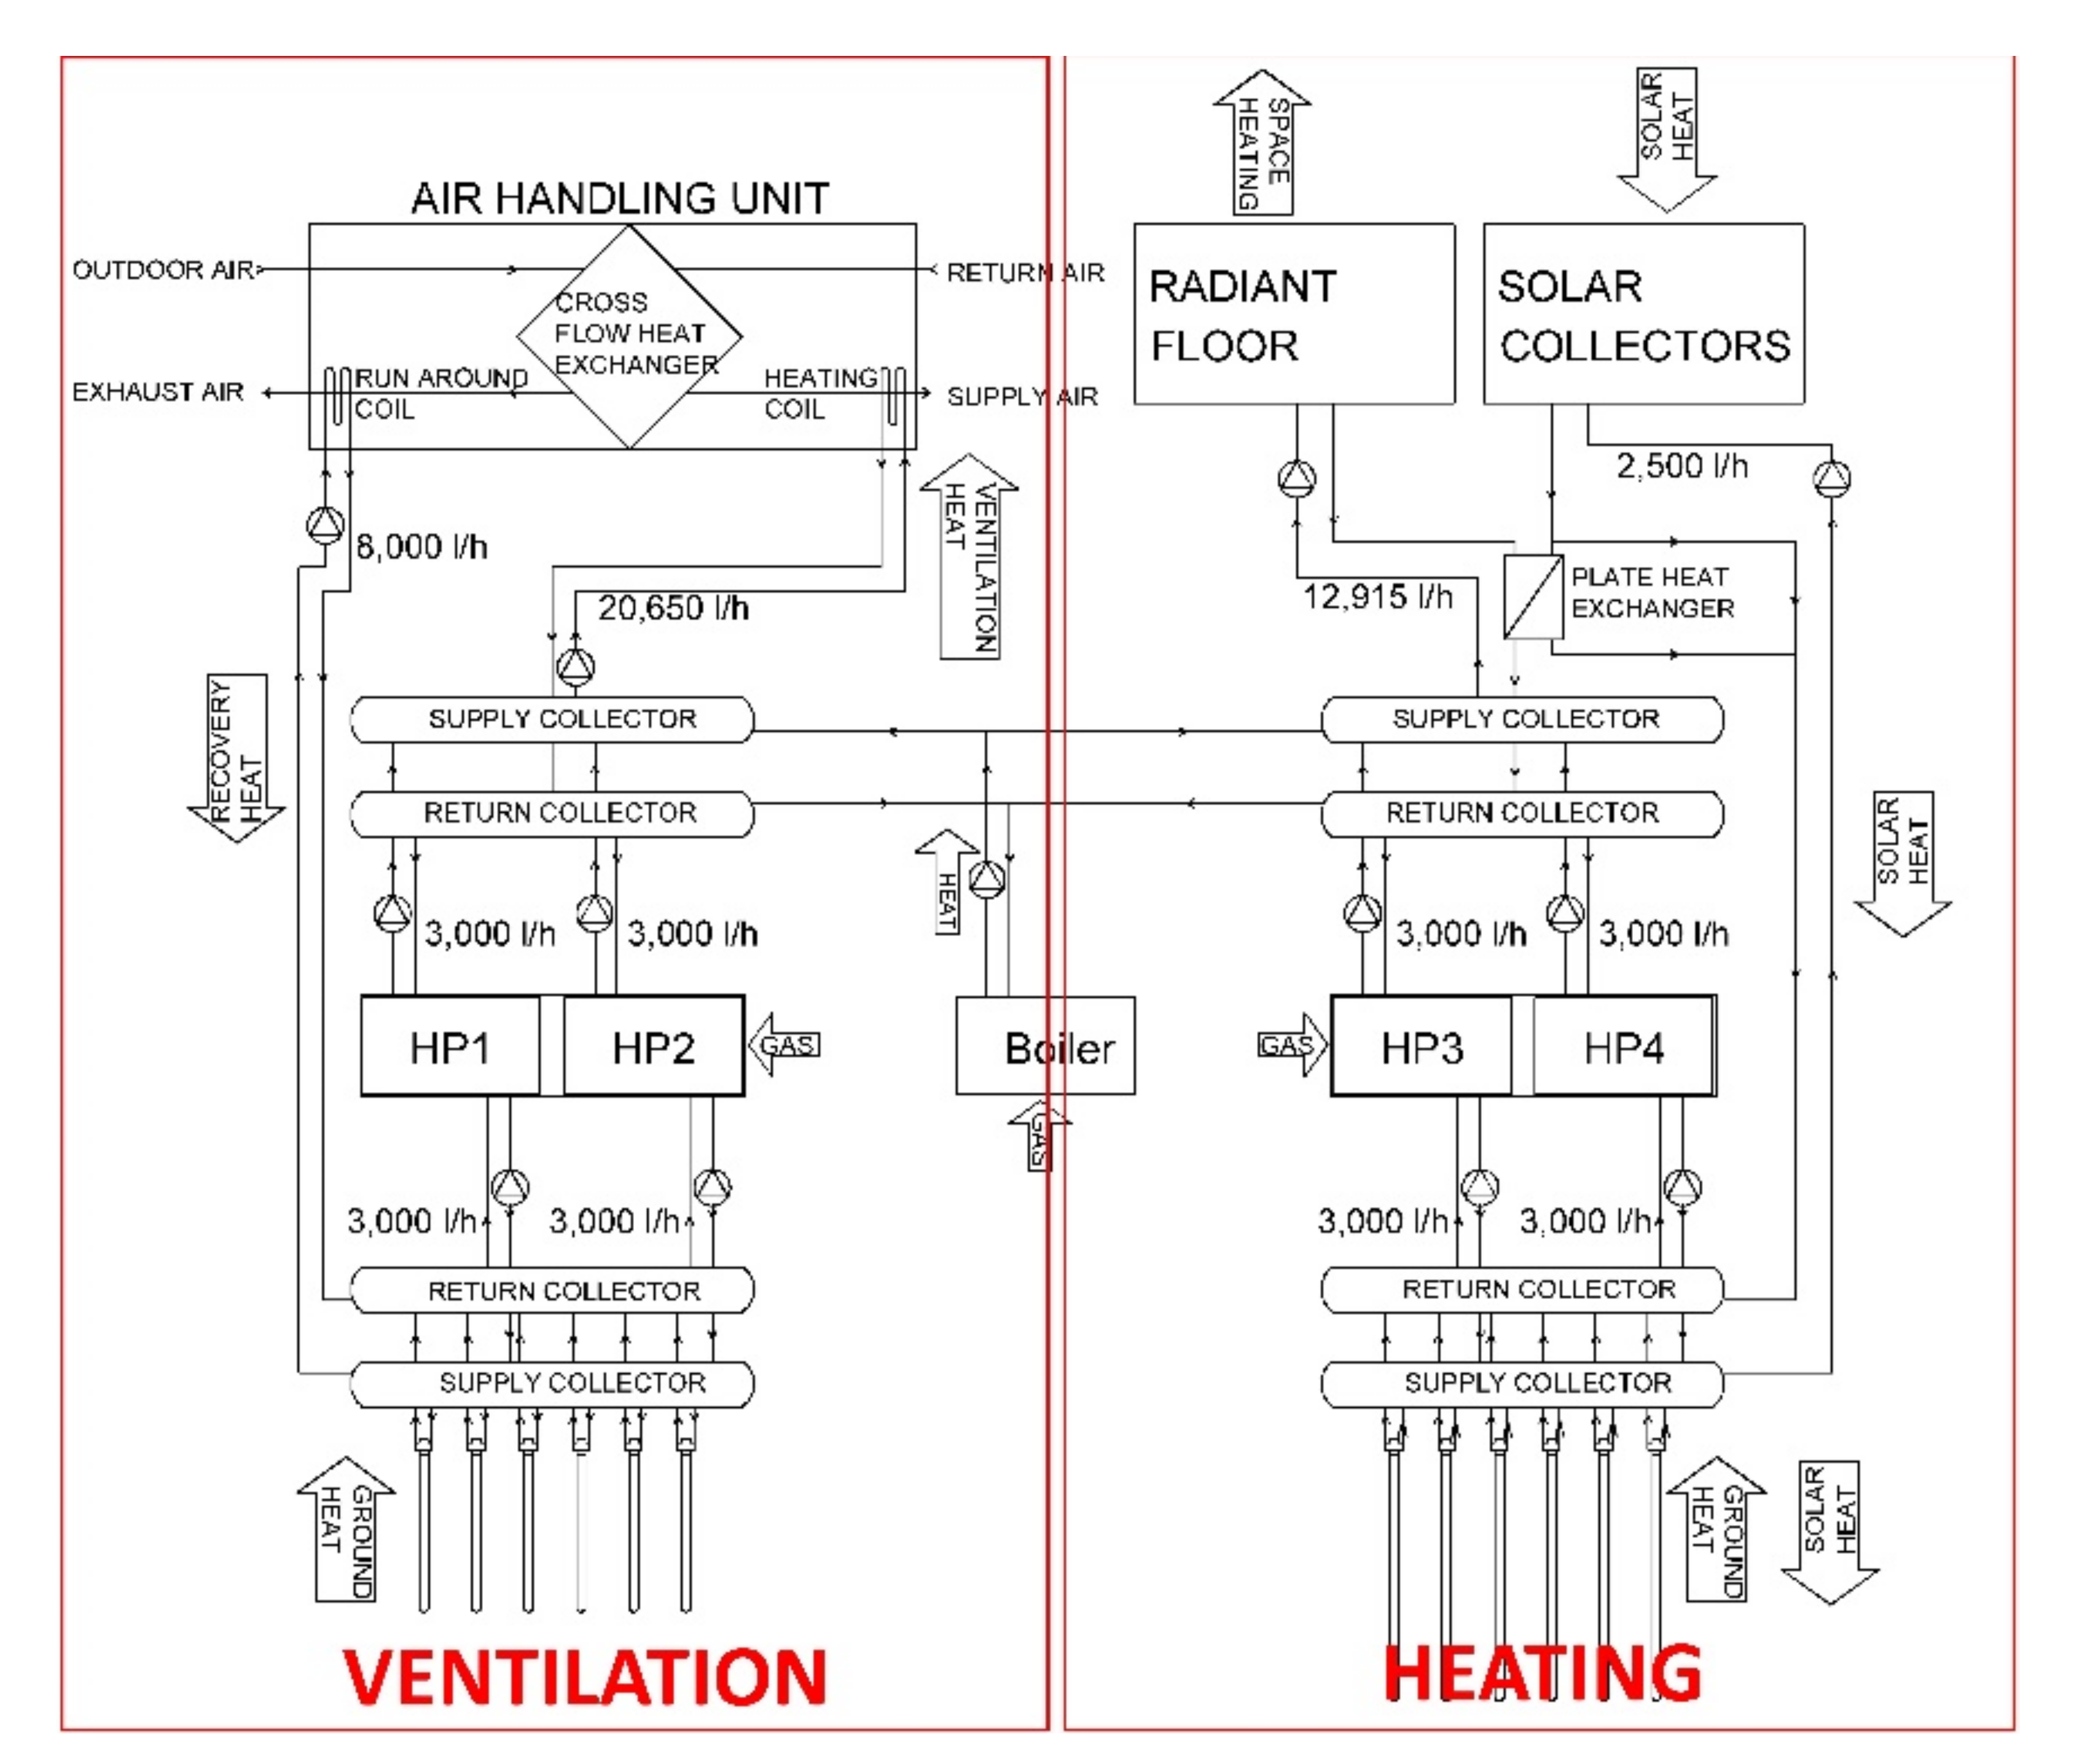
A simplified functional scheme of the plant reports the main hydraulic streams and energy flows (
Figure 2). As the building is mainly closed or unattended in summertime, no cooling loads are present, and the plant was designed to serve for the sole purpose of heating and ventilation. The very reduced demand for hot tap water is fulfilled by means of electric water heaters.
The HVAC plant is set up by two main sections, space heating (the left part of
Figure 2) and ventilation (the right part). Both sections feature two ammonia–water absorption heat pumps (model Robur GAHP-W-LB, HP1-HP4 in), producing thermal energy at 45 and 55 °C, respectively. The geothermal heat pumps are modeled in Trnsys
® by a self-developed type (type 701), based on Robur’s operation data. The type allows different cold sources (ground, solar, heat recovery) and the daily alternative operation of the two heat pumps for each section to be managed. The geothermal exchanger (total length 960 m, 6 probes × 160 m each in a parallel row for the heating section; total length 750 m, 6 probes × 125 m each in a row for the ventilation section) is constituted by vertical double-U pipes, with an outer diameter of 32 mm and a thickness of 2.9 mm. It is simulated by type 131, a Trnsys
® type developed during 1990s on the base of the Hellstrom and Eskilson model on vertical geothermal heat exchangers [
21]. Moreover, the plant includes 50 m
2 of flat type solar thermal collectors (4 arrays in parallel, each of those made of 5 modules in series), simulated by Trnsys
® type 73.
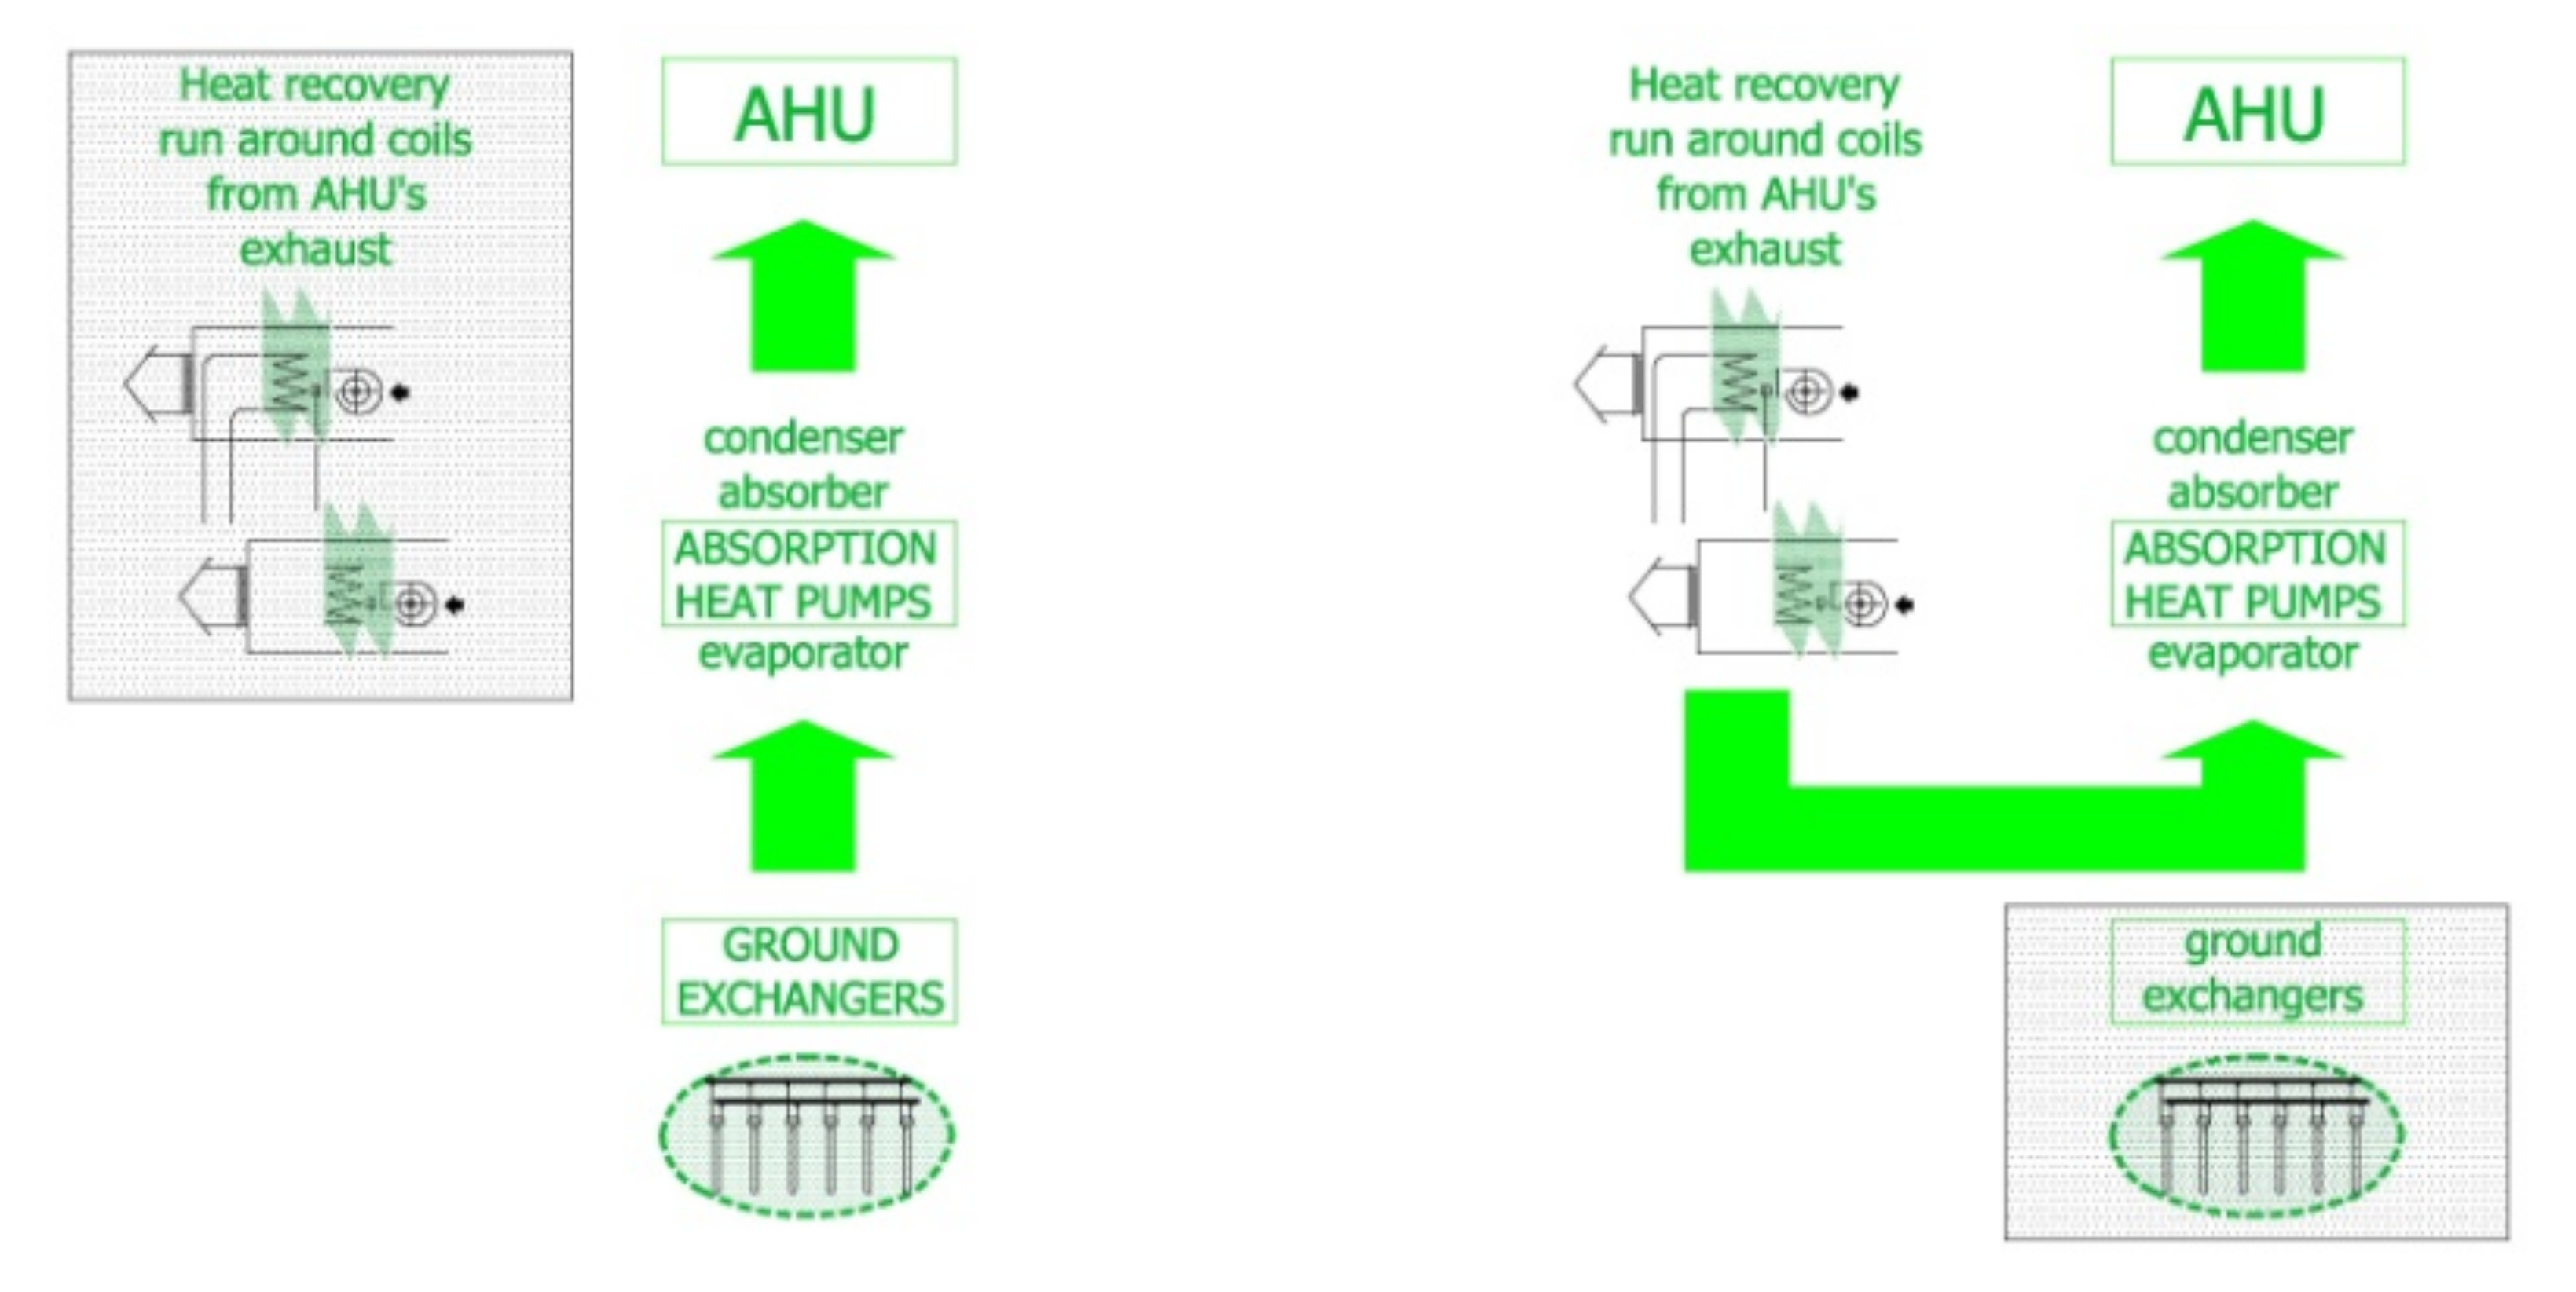
The heat recuperators downstream of the AHU are a static cross flow type, with an efficiency of 50%. Run-around coils are installed at the outlet of two out of four of AHUs (the one of the laboratories and the one of the teaching rooms, for a global volume flow of 20,600 out of 25,000 m3/h) to further increase thermal recovery when the external temperature exceeded 0 °C. The run-around coils can operate on the exhaust flow of a heat exchanger; the heat recovered can be sent to the evaporator of the absorption equipment (see next section for the control logic). Both the heat recuperator and the run-around coil are modeled by self-made types (types 712 and 713, respectively): The former has the efficiency and the inlet air temperature and humidity as known inputs to calculate outlet air conditions; the latter allows to calculate the water outlet temperature by means of the heat exchange with air.
The HVAC system in teaching rooms, laboratories, and offices provides space heating by means of a radiant floor and ventilation by means of three independent AHUs, each of those serving a single duct system. The auditorium is served by an all-air system. According to the UNI EN 12831:2006 standard, the maximum thermal load is 146 kW for space heating and 122 kW for ventilation, with the design indoor conditions set to 20 °C of air temperature and the ventilation being neutral (air supplied at 20 °C).
Heat pumps are designed to cover the base load, whereas a condensing boiler supplements the peak load as well as it is a backup for an eventual fault of the heat pumps (
Table 1).
2.2. A Multisource Heat Pump System for a New School Building: Control Logic
2.2.1. The Space Heating System
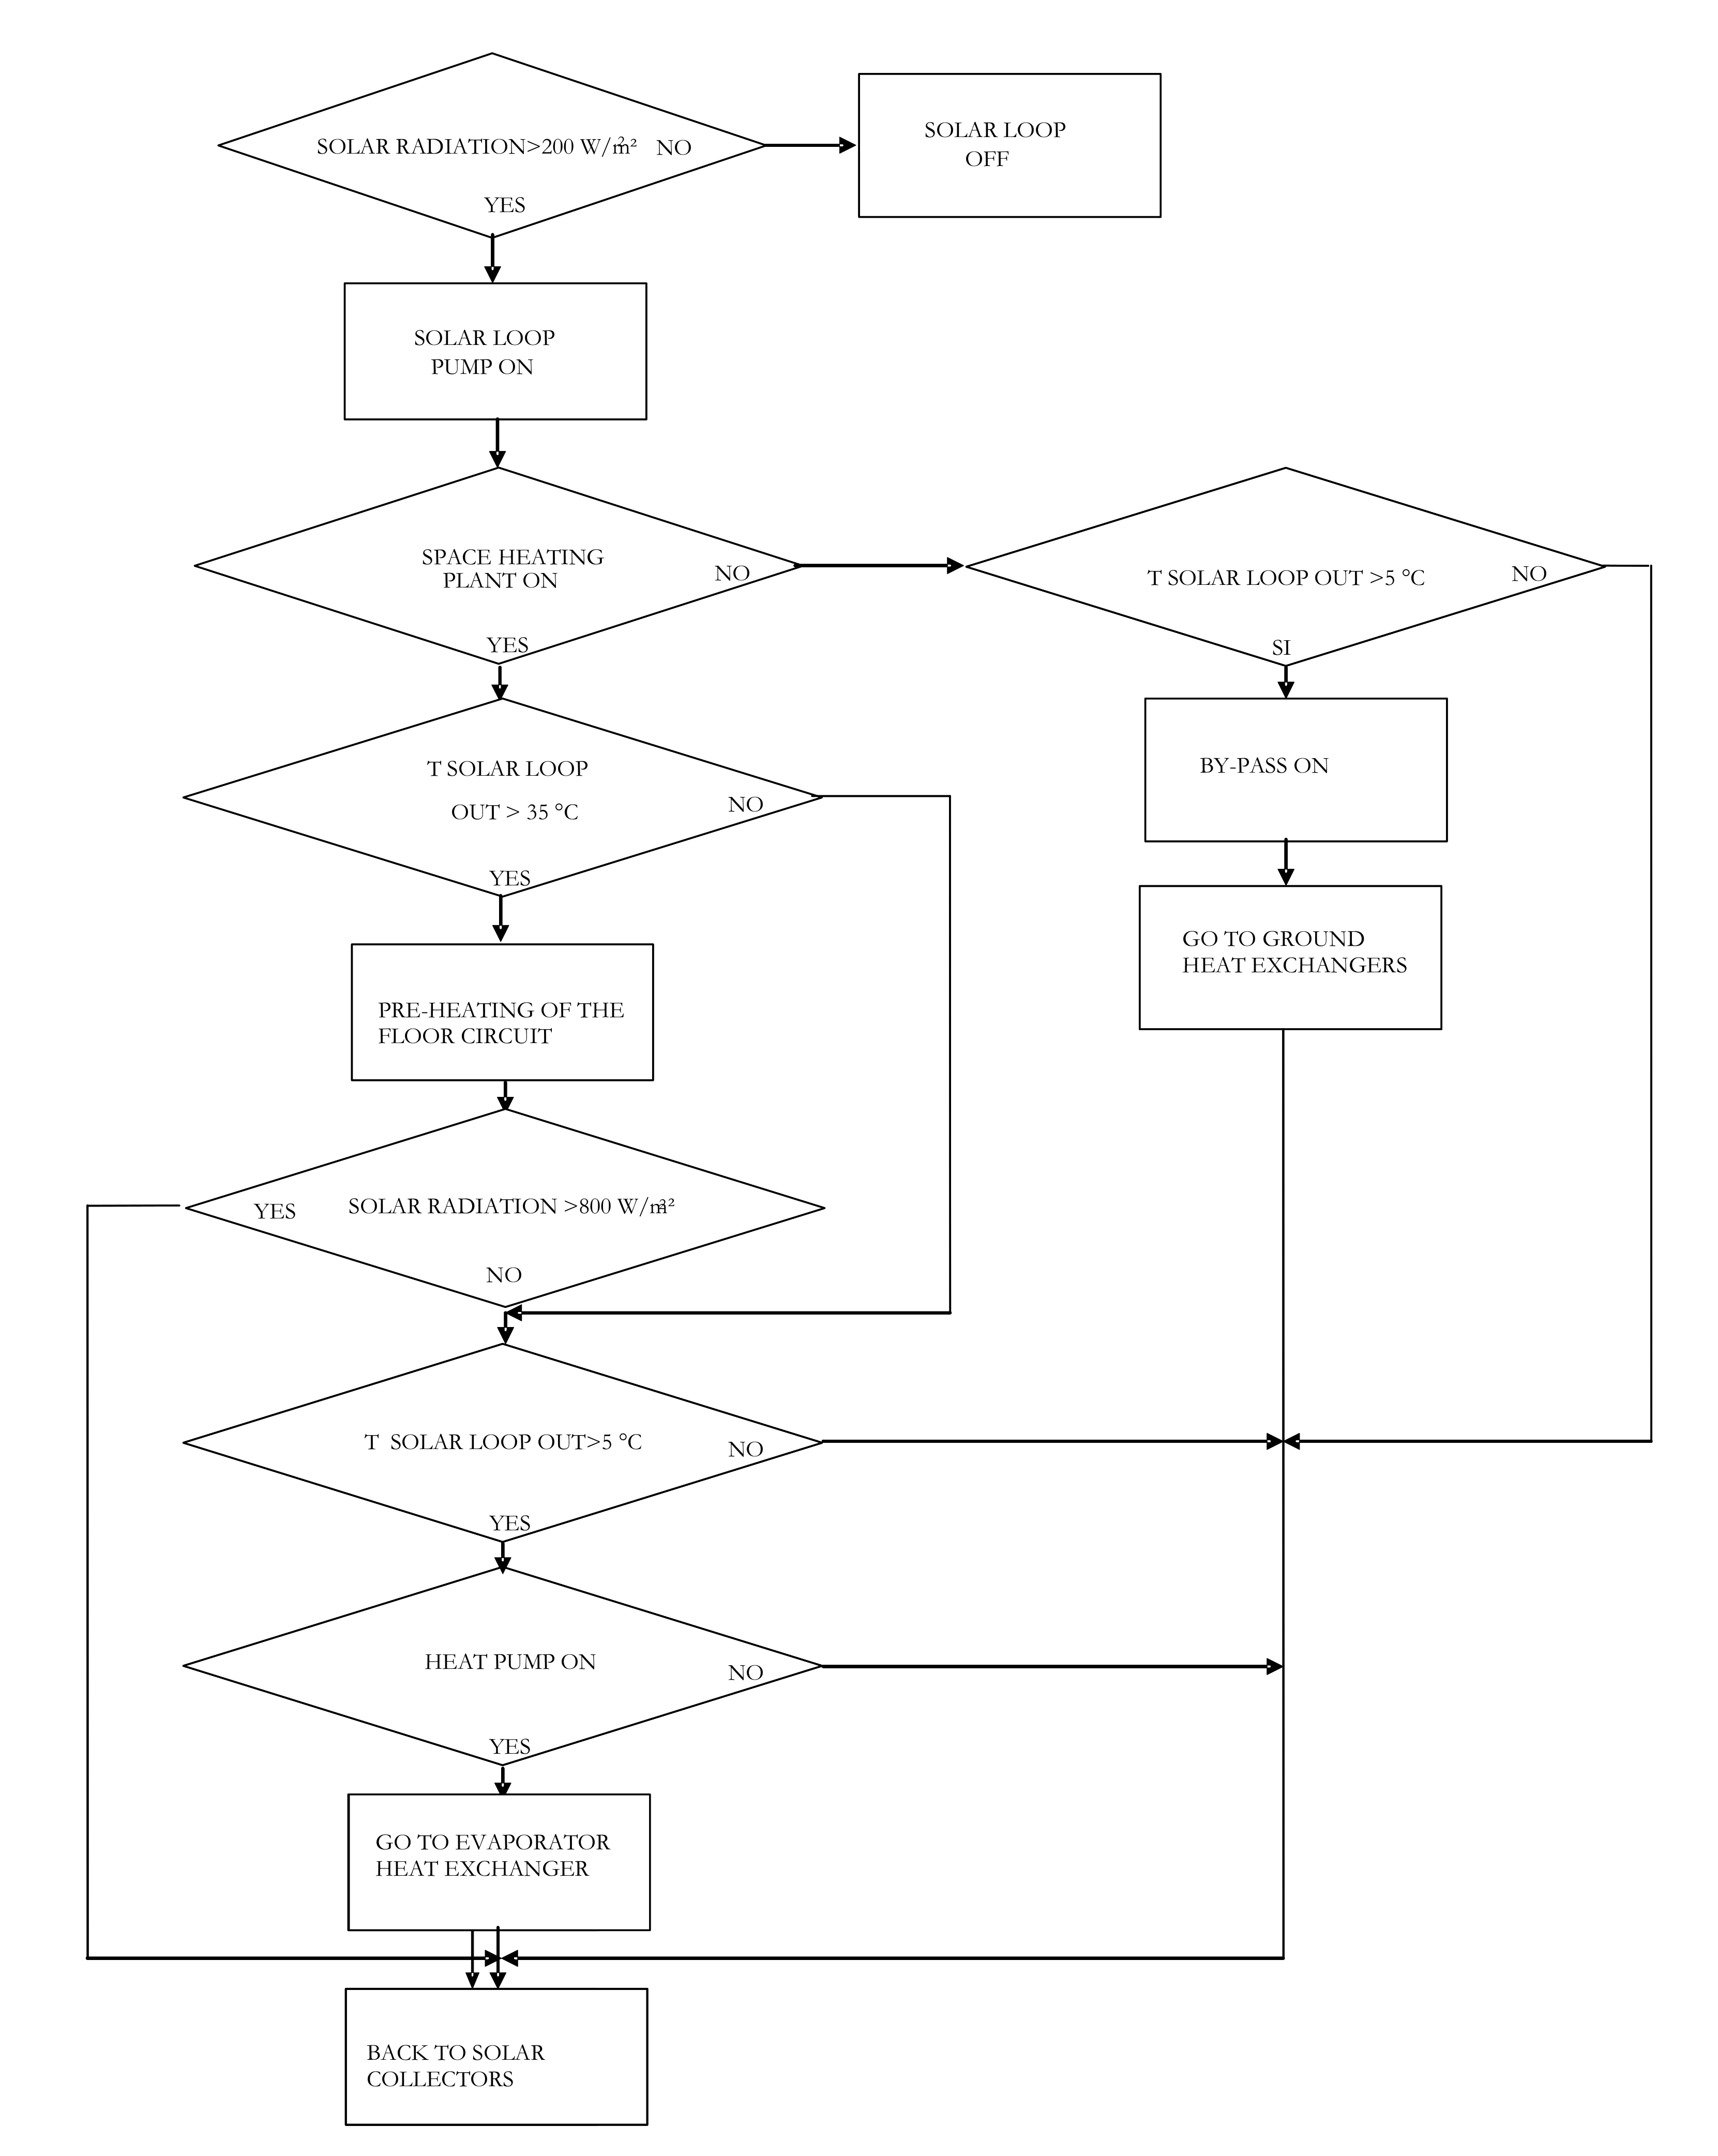
The most important element in the control system is the algorithm to determine the most suitable heat source at every time. The two absorption heat pumps of the heating section can use both the solar circuit and the ground circuit. For the best exploitation of the energy sources (i.e., from the exergetic point of view), the best choice is to use the solar collectors’ loop to heat (or, at least, to preheat) the radiant floor circuit, if the temperature is high enough. As a matter of fact, if the energy collected by the solar panel is sufficient, the space heating can be obtained for free (except for the pumping energy).
Downstream, if the solar loop temperature after the preheating of the floor circuit is higher than the ground temperature, the water from the solar system can be used on the secondary fluid side of the heat pump evaporator. Should the solar system be off, or the temperature of the solar loop be not high enough, the heat pumps use ground heat.
Following these considerations, the evaporation temperature is always kept at the highest possible level, thus leading to the highest average COP.
The control of the solar system follows the strategy shown in
Figure 3 and
Figure 4 explained as follows:
2.2.2. Ventilation System
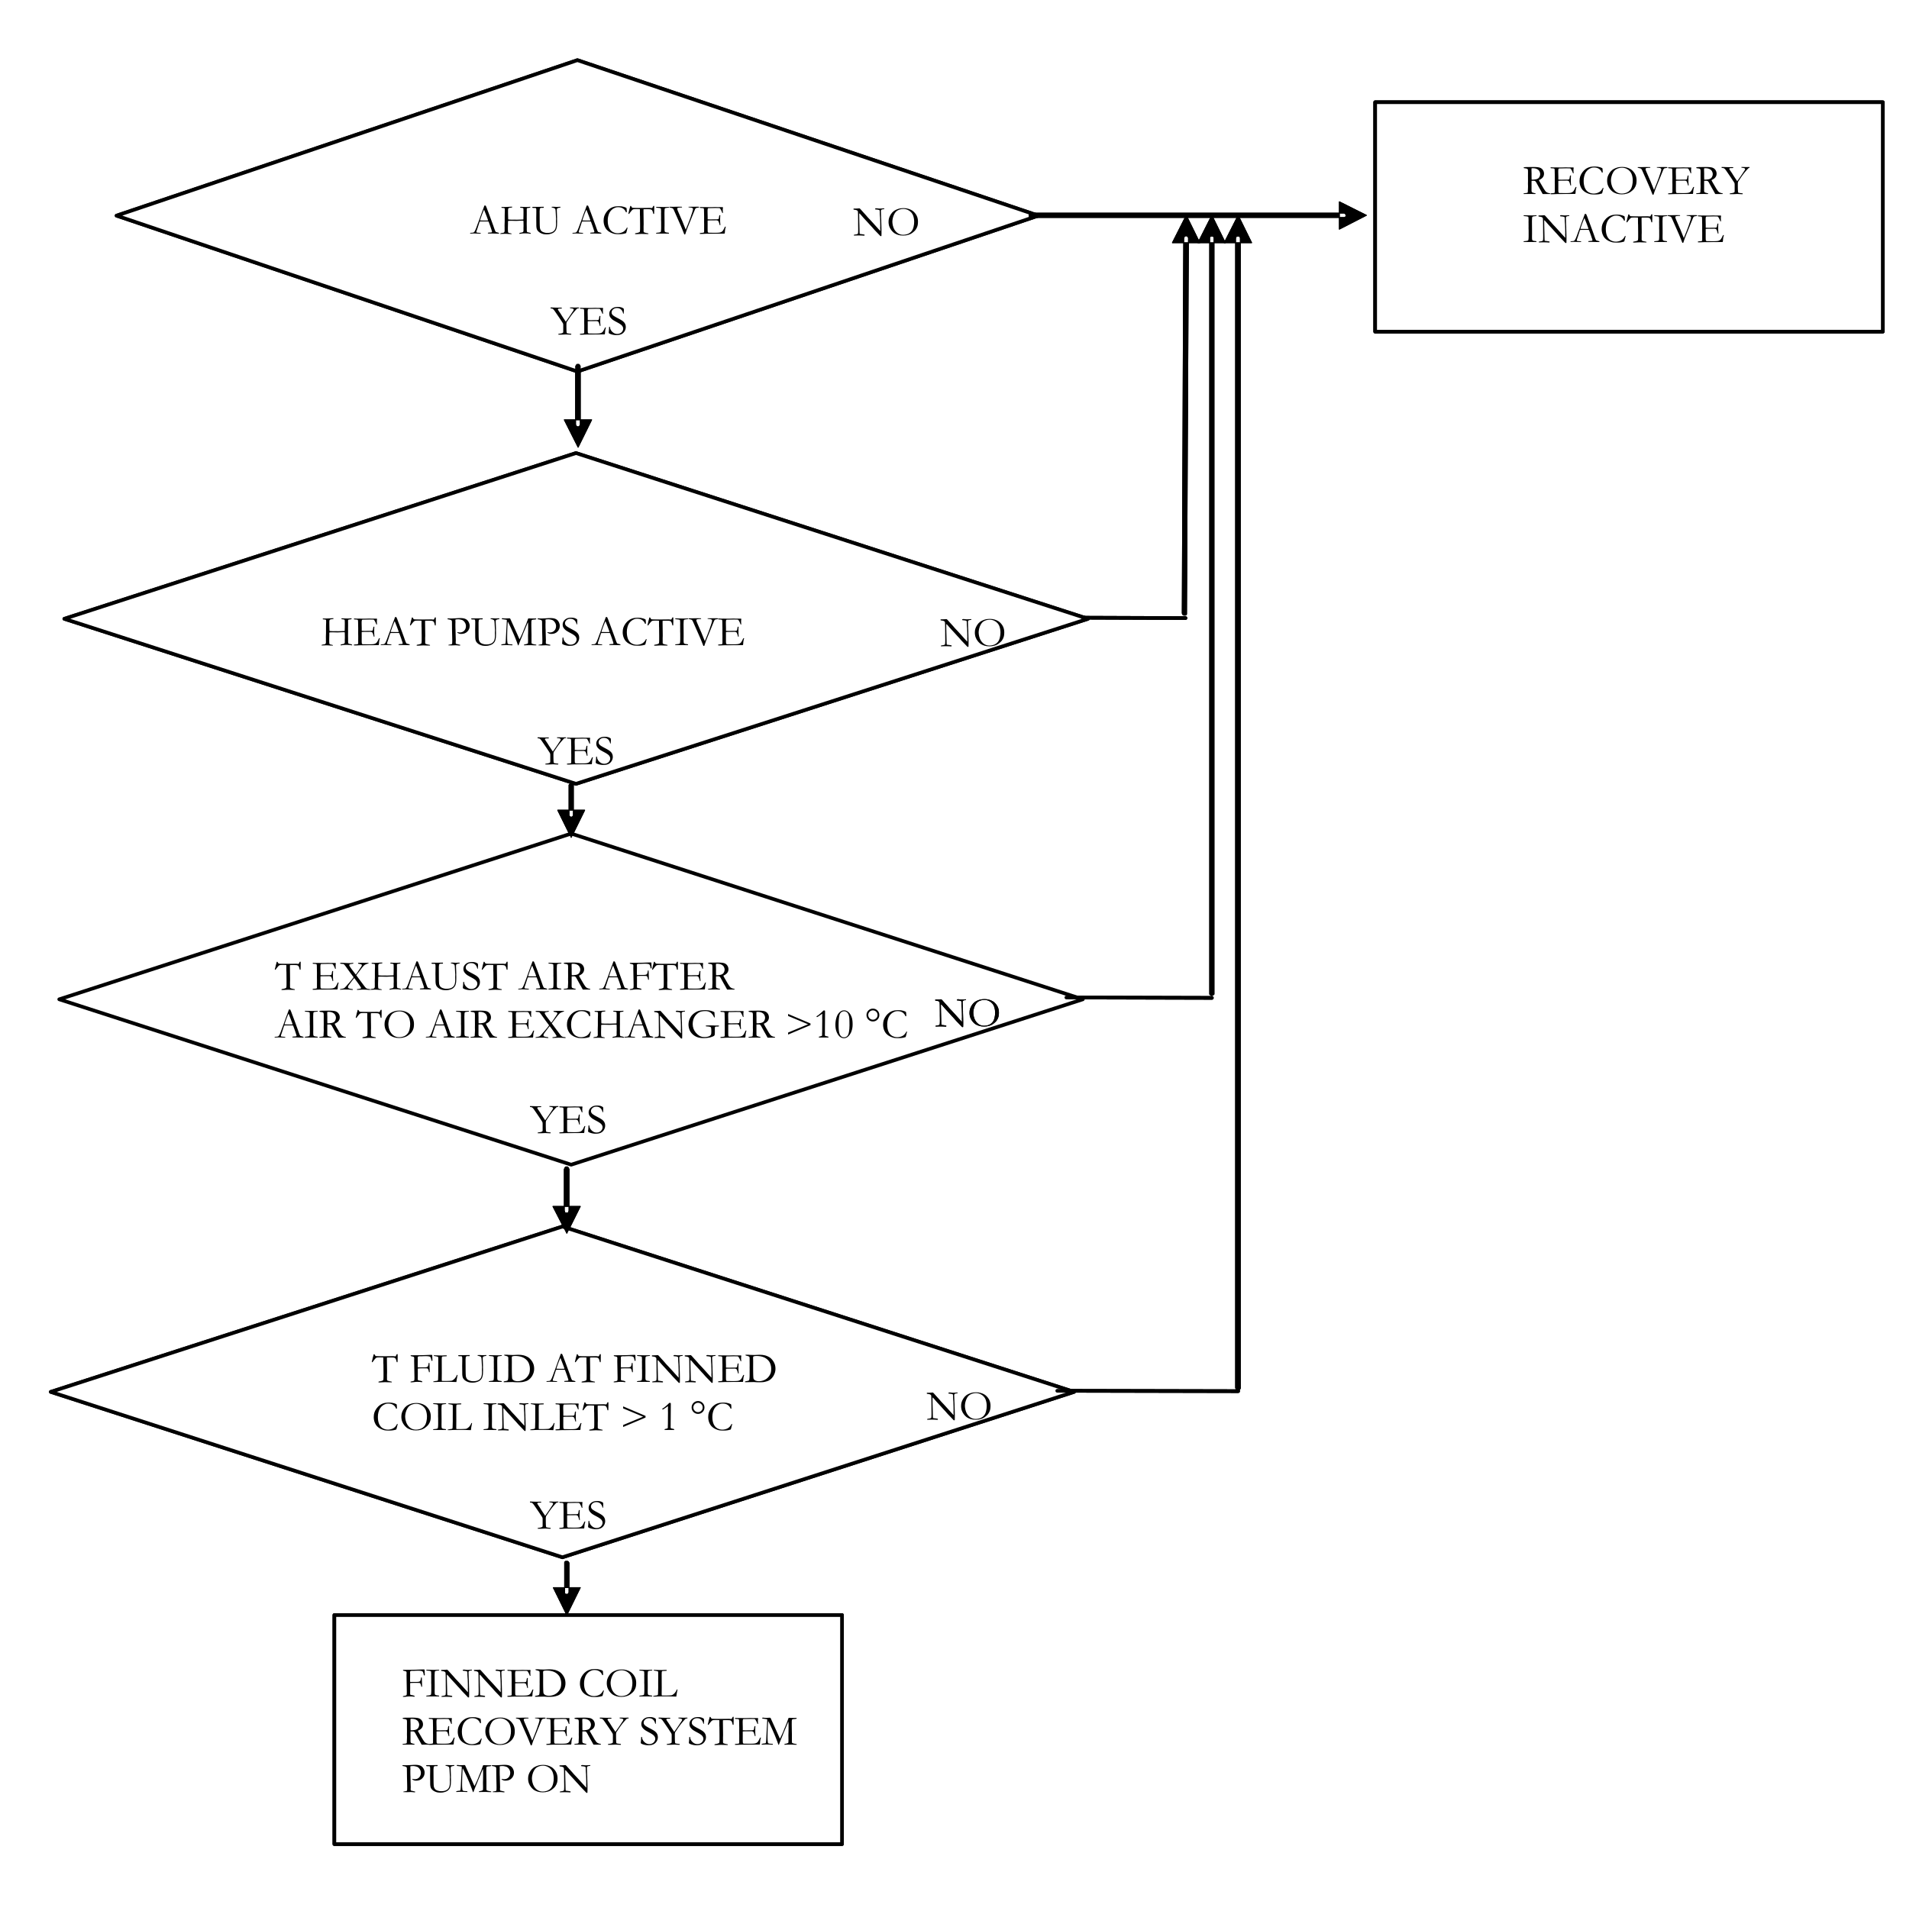
When at least one AHU is on and one of the two heat pumps is running, the required conditions to activate the heat recovery circuit are (
Figure 5 and
Figure 6):
Exhaust air outlet temperature from the cross-flow exchanger is higher than 10 °C, which means an outdoor air temperature of 0 °C. This returns a water temperature on the recovery finned coil which is mostly higher than that returned from the ground. A different heat source than the ground leads to a reduction in pumping cost (the coil loop has a lower pressure drop than the ground loop);
Evaporator outlet fluid temperature above 1 °C, to avoid frosting problems on the recovery finned coil.
If all these conditions are verified, the heat recovery circulation pump is switched on, as well as the three-way valve of the evaporator circuit.
2.3. A PVT Multisource Heat Pump System for a Retrofitted Gym: Design Phase
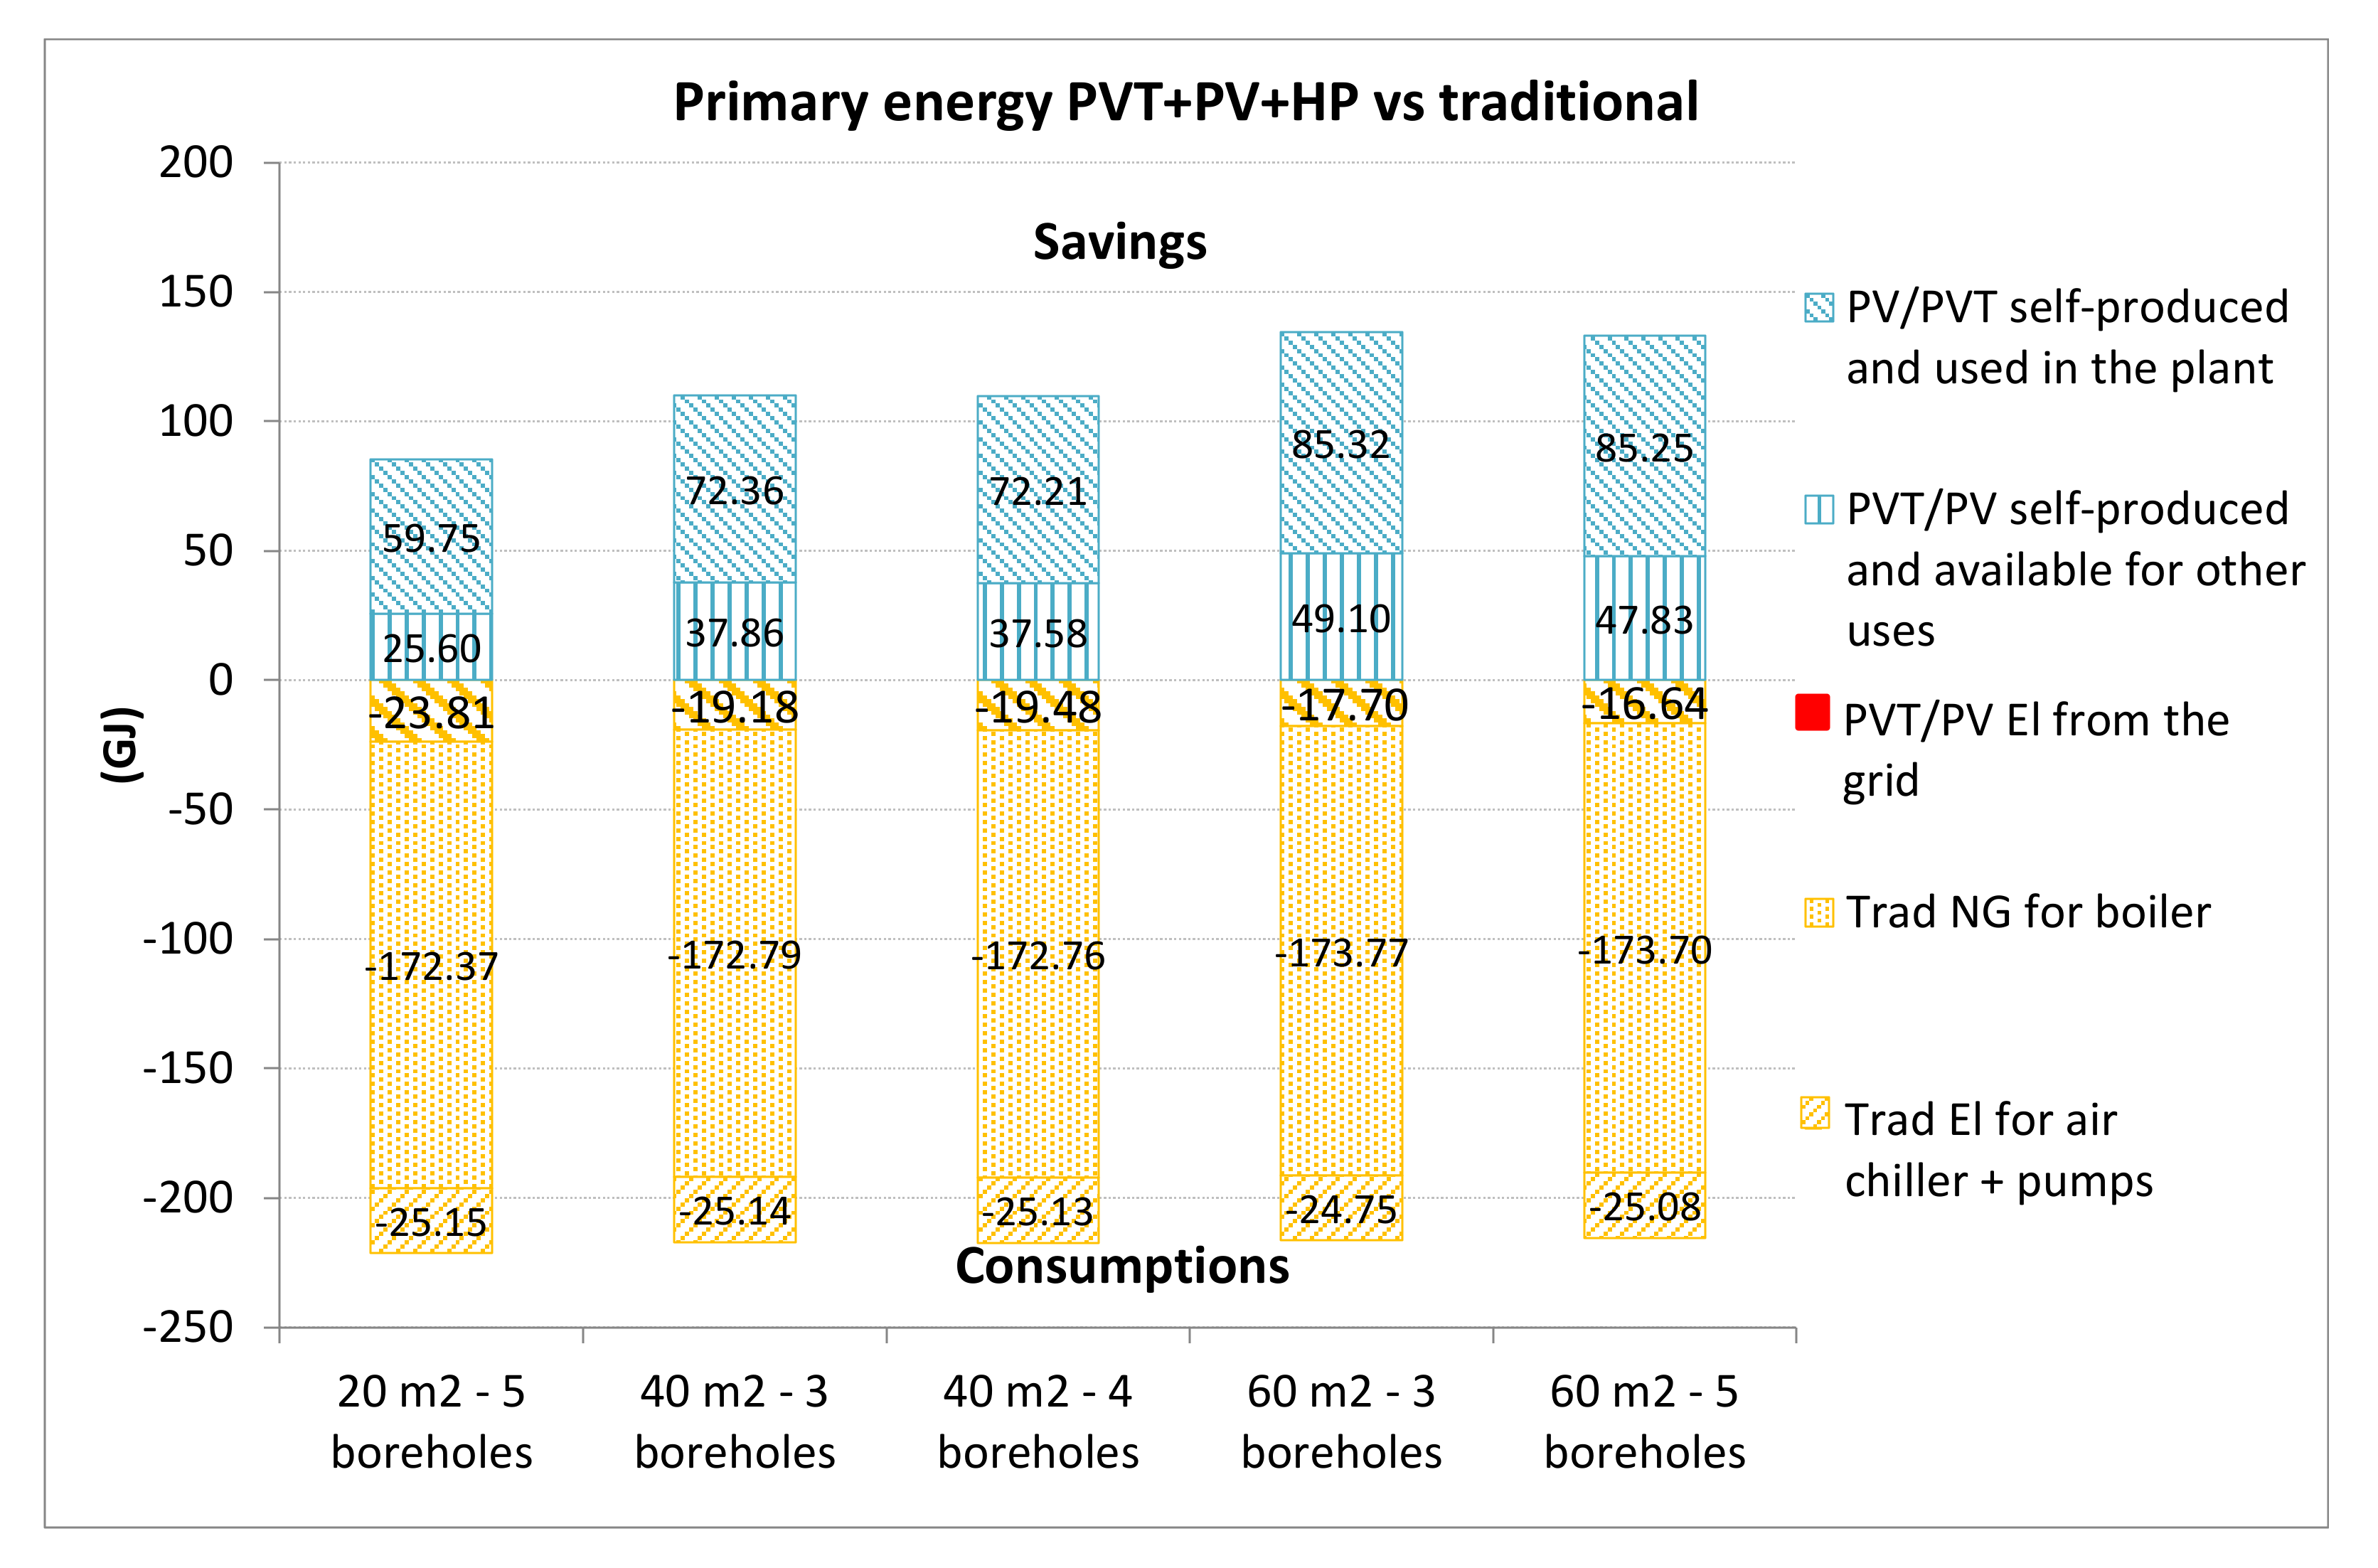
The second case study concerns the retrofitting of a part of an old (completed in 1960) high school building of Feltre (Northern Italy) that will be started in 2021. The climate is rather severe in wintertime (3100 degree days). A large gym (33 × 25 × 8.40 m) expanding on two levels and other rooms (changing rooms, bathrooms with toilet and showers, and technical rooms on the ground floor; an office, a small gym and a bar on the first floor; six laboratories on the second floor) will be refurbished with the aim of realizing a NZEB, with a total floor area of 2435 m2, and an enclosed gross heated volume of 11,060 m3.
The design phase was based on Trnsys® dynamic simulation, defining 20 thermal zones, each with a suitable scheduling of the presence of people, lighting, and other internal gains, humidity, and air temperature set points.
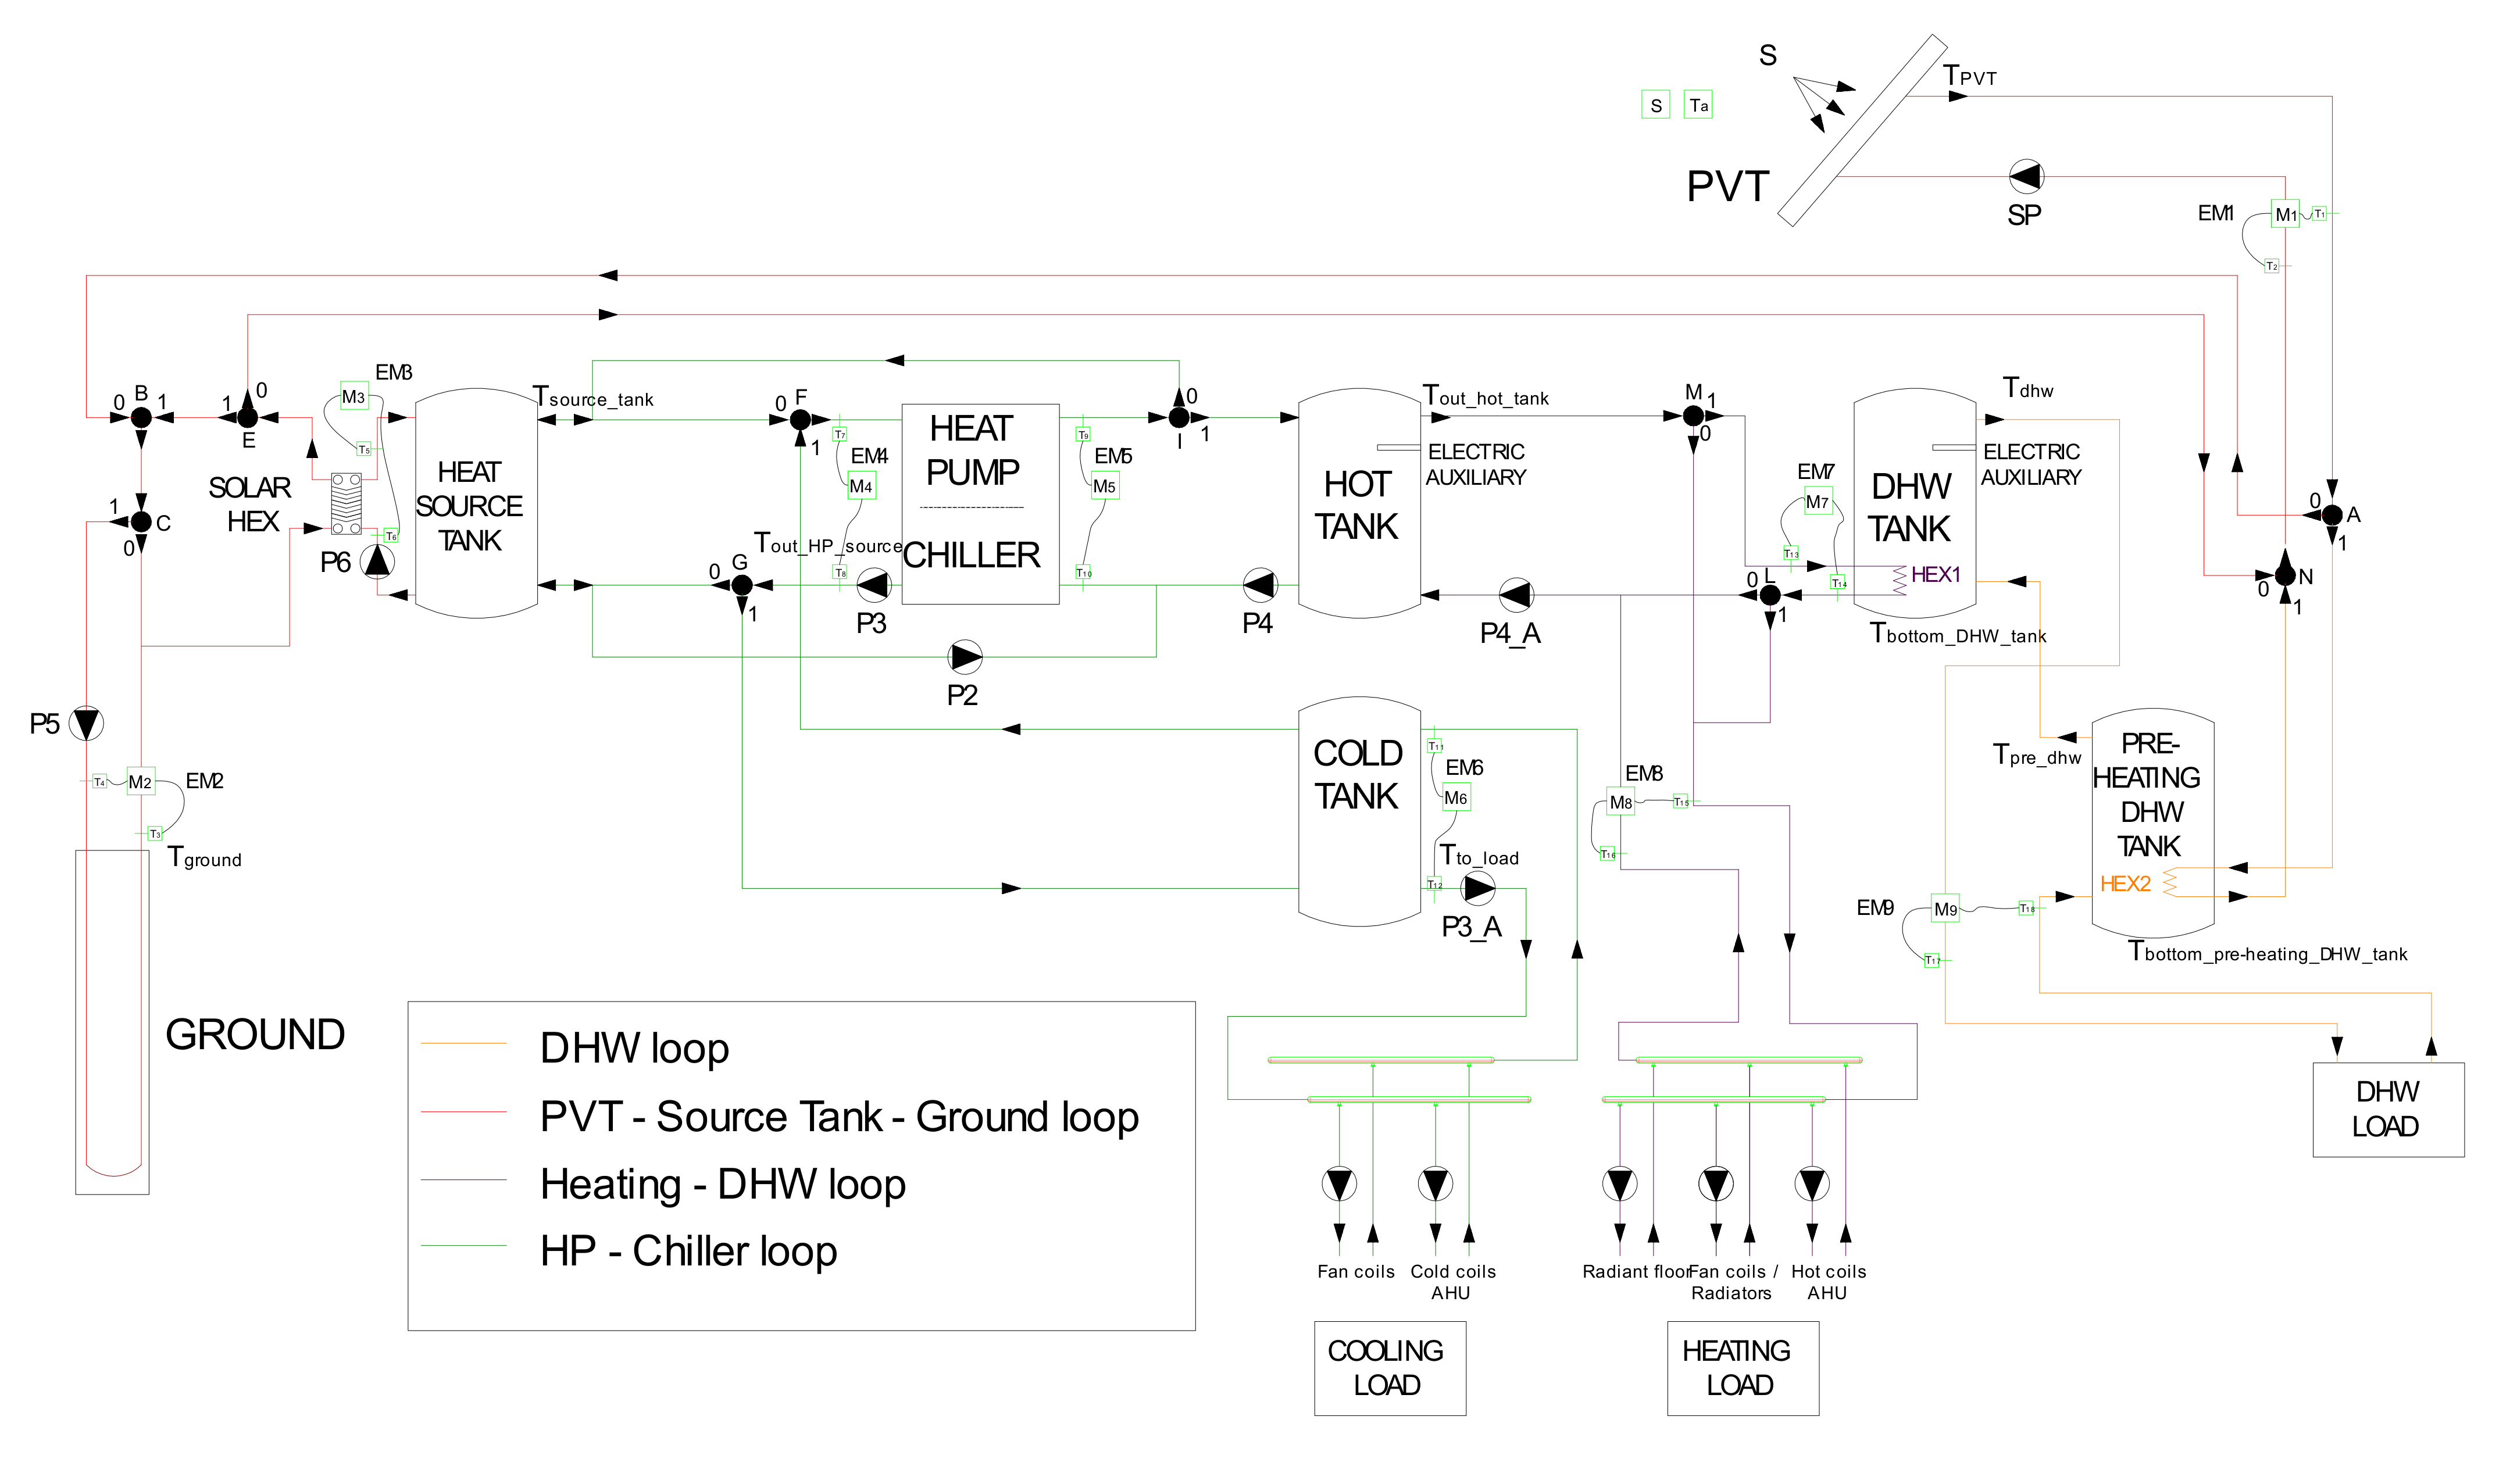
The HVAC system provides ventilation by two AHU, space heating and cooling, and DHW production. It is set up by a solar section composed of glazed PVT and plain PV that drive a heat pump which satisfies all the loads. The thermal energy produced by the PVT provides DHW heating or at least preheating; moreover, it can act as a cold source of the heat pump. The various components are connected via suitable storage tanks as depicted in
Figure 7.
The large gym is heated by a radiant floor system, and it is cooled by an all-air system providing the ventilation service (6600 m3 h−1). Another AHU (7000 m3 h−1) provides ventilation for the laboratories that are heated and cooled by fan coils. The other rooms (small gym, bar, and offices) are equipped with fan coils as well, whereas toilets are heated only (by radiators).
The glazed PVT collector was modeled by the type 50c (based on the type 1 modeling the solar thermal collector based on Hottel–Whillier equation). The main features refer to a real glazed PVT module available on the market [
20]. The mass flow rate entering the PVT field depends on the series/parallel configuration. In this case, this is set up in two equal groups where the collectors are in parallel with a group in series with the other, as in the parametric study the solar field varies between 20 and 60 m
2 (
Table 2). Such a configuration allows one single value for the mass flow rate; that is, a single circuit connecting the solar section with the ground.
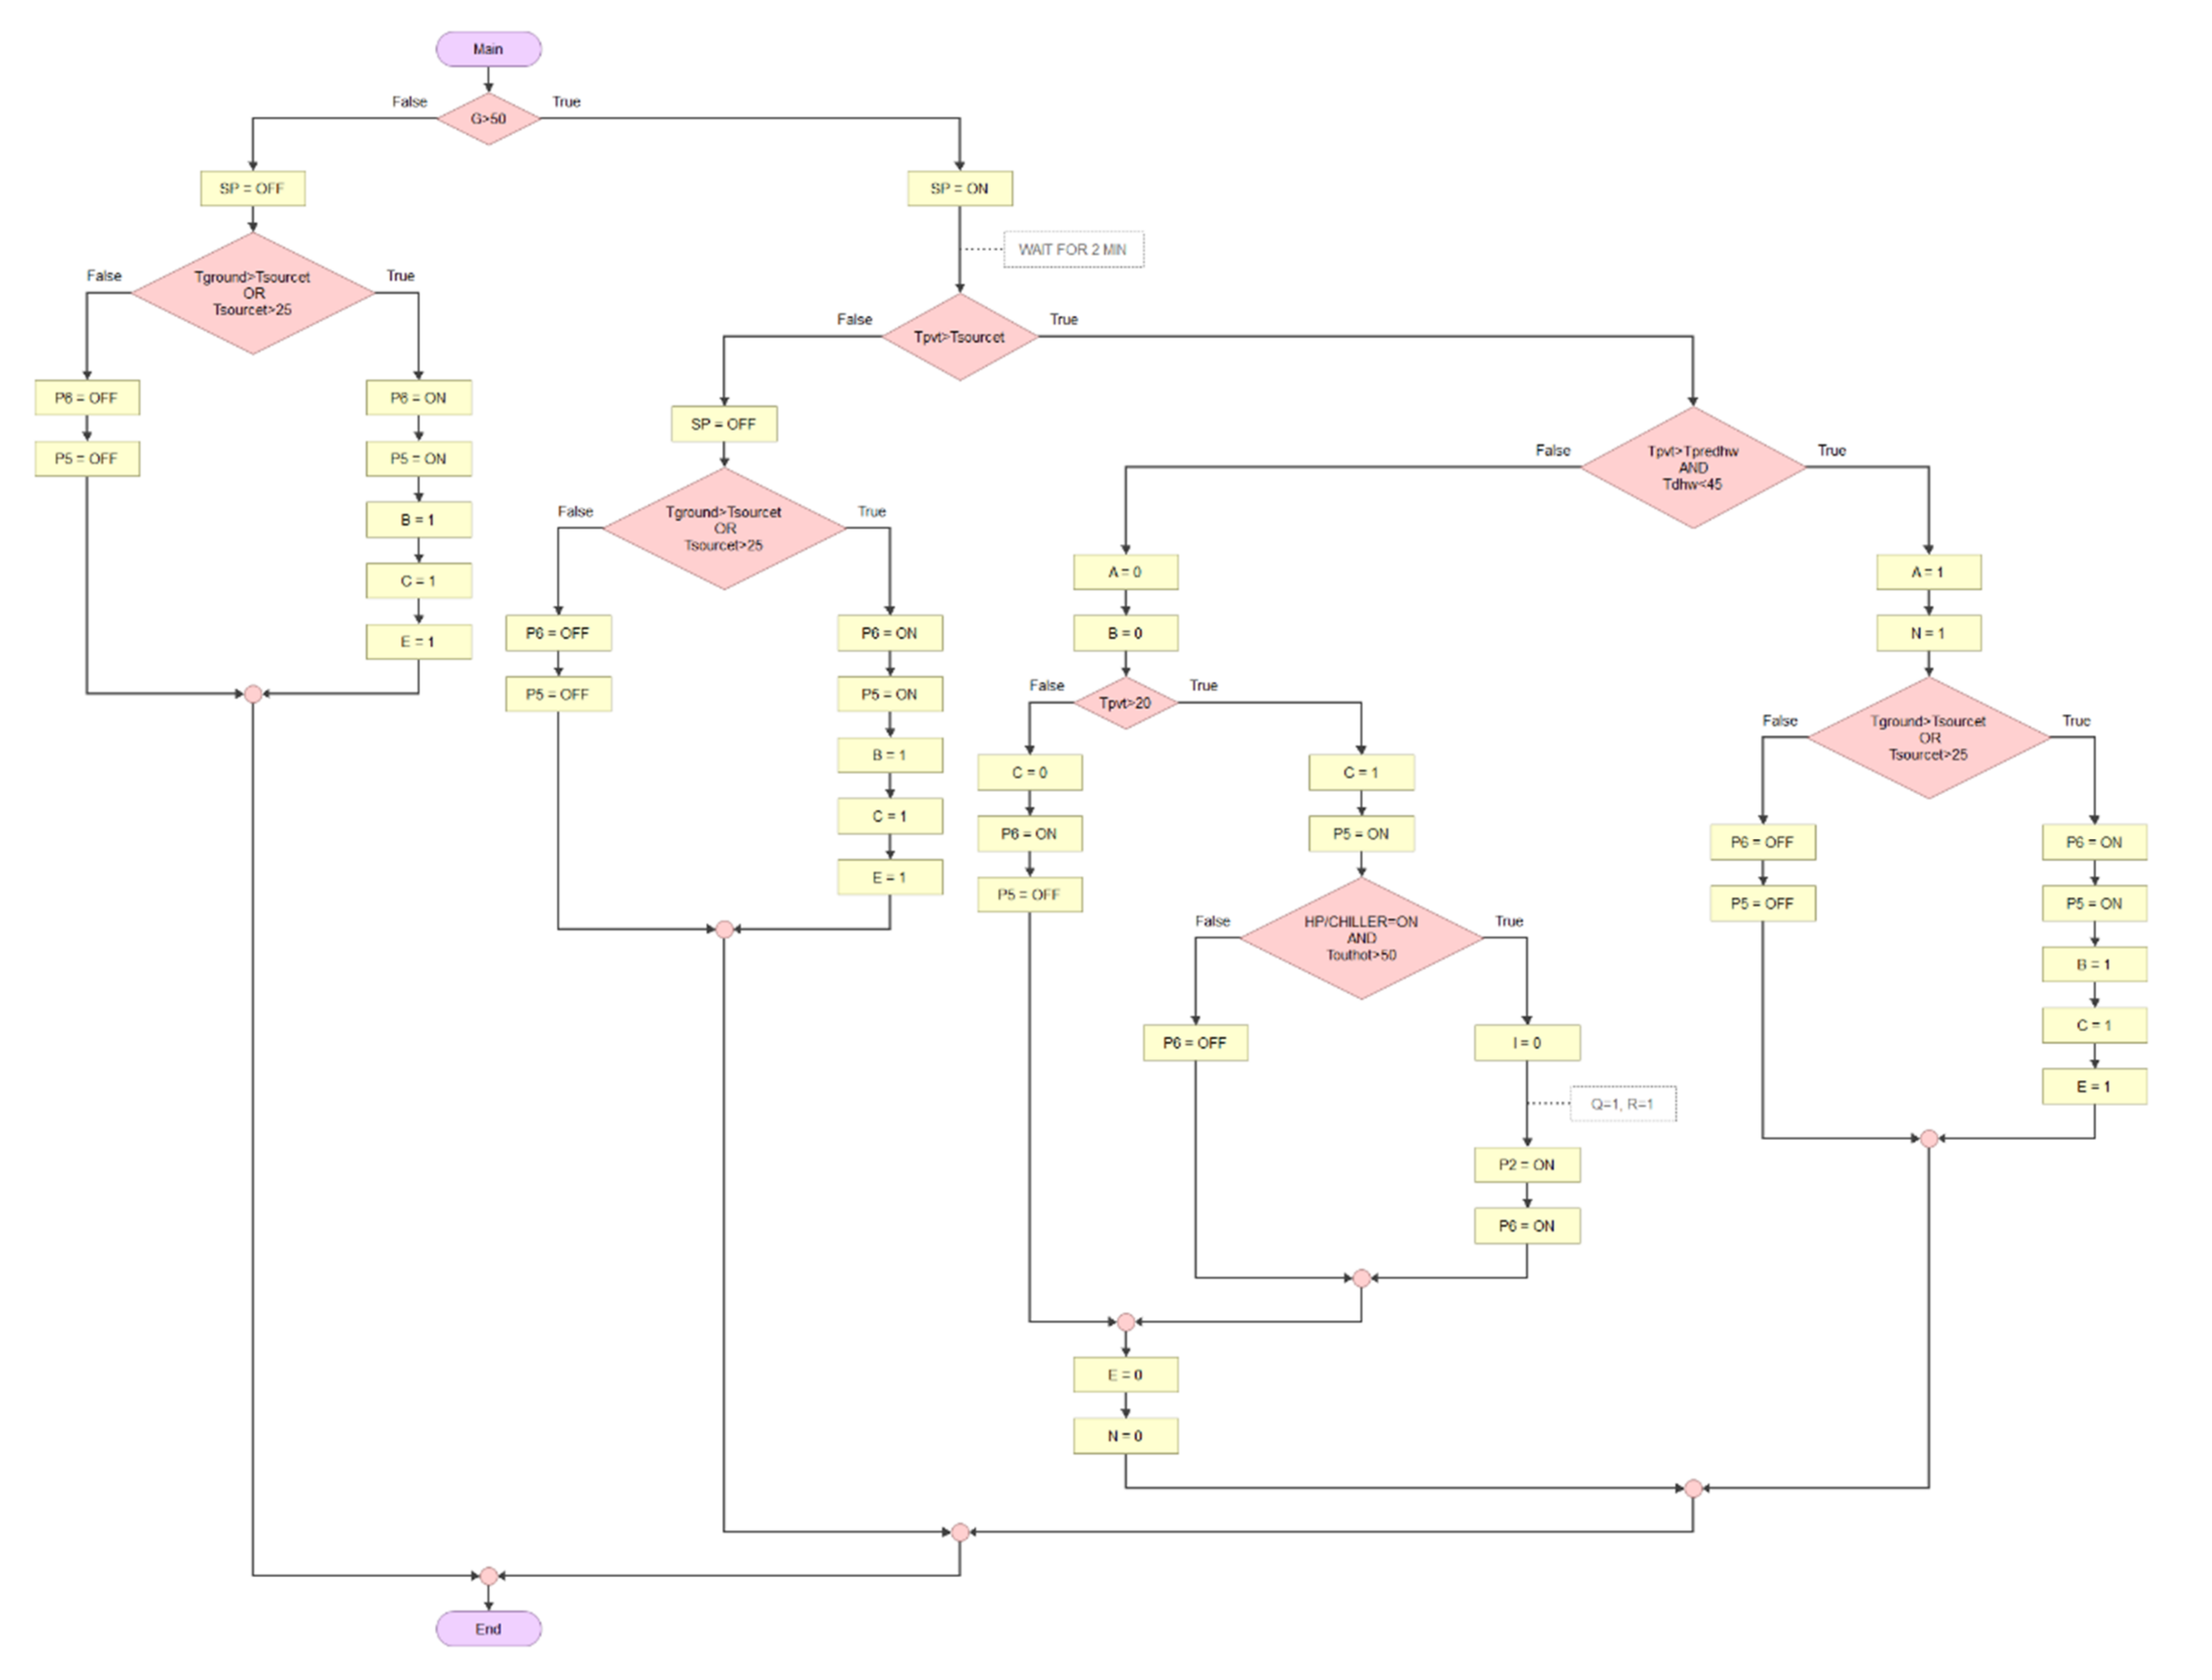
An operation threshold of the solar radiation intensity (
S) between 50 and 100 W m
−2 and a comparison between the tanks set points and the temperatures in the different circuits (
Figure 7) is the base of the control logic of the plant.
The ground field is composed by
n × 100 m in a row of vertical tube U heat exchangers, distance 6 m,
n = 3–4–5 as a function of the solar field area as described in
Table 2. It is modeled by type 557a. The tanks, whose sizes for each alternative considered in this study are reported in
Table 2, are modeled by type 60d (pre-DHW tank, DHW tank) and type 4a (hot tank, cold tank, heat source tank). In case the temperature in the upper part of the hot tank and the DHW tank is below the set point (50 and 45 °C, respectively, with a dead band of 3 °C) and the main generators (PVT and heat pump) are not available, a 3-kW auxiliary electric resistance supplies the heating and DHW load, respectively.
Type 927 models the water–water heat pump. The performance is simulated on the basis of nominal data from a manufacturer at the operating temperatures of the heat source and sink varying in useful ranges (respectively, T source tank ≤ 25 °C and hot tank or heat source tank max 52 °C).
Table 3 reports the outlet of the valves and the status of the pumps for the three main operation modes of the heat pump.
2.4. A PVT Multisource Heat Pump System for a Retrofitted Gym: Control Logic
The plant is conceived by four main loops (
Figure 7). The PVT—source tank—ground loop (
Figure 8) includes the dual source (PVT and ground by vertical tube boreholes) heat pump; the excess heat produced by the PVT field is directed to the ground, mainly in summer. The DHW load (2000 L per day) is satisfied by two storage tanks. In the pre-heating DHW tank, water from the mains is heated by the PV cooling water when this is not directed to the heat source tank or to the ground. The DHW tank completes the heating to the set point temperature. The presence of the pre-heating DHW tank is essential as it allows to usefully cool down the PVT by the fresh water from the mains.
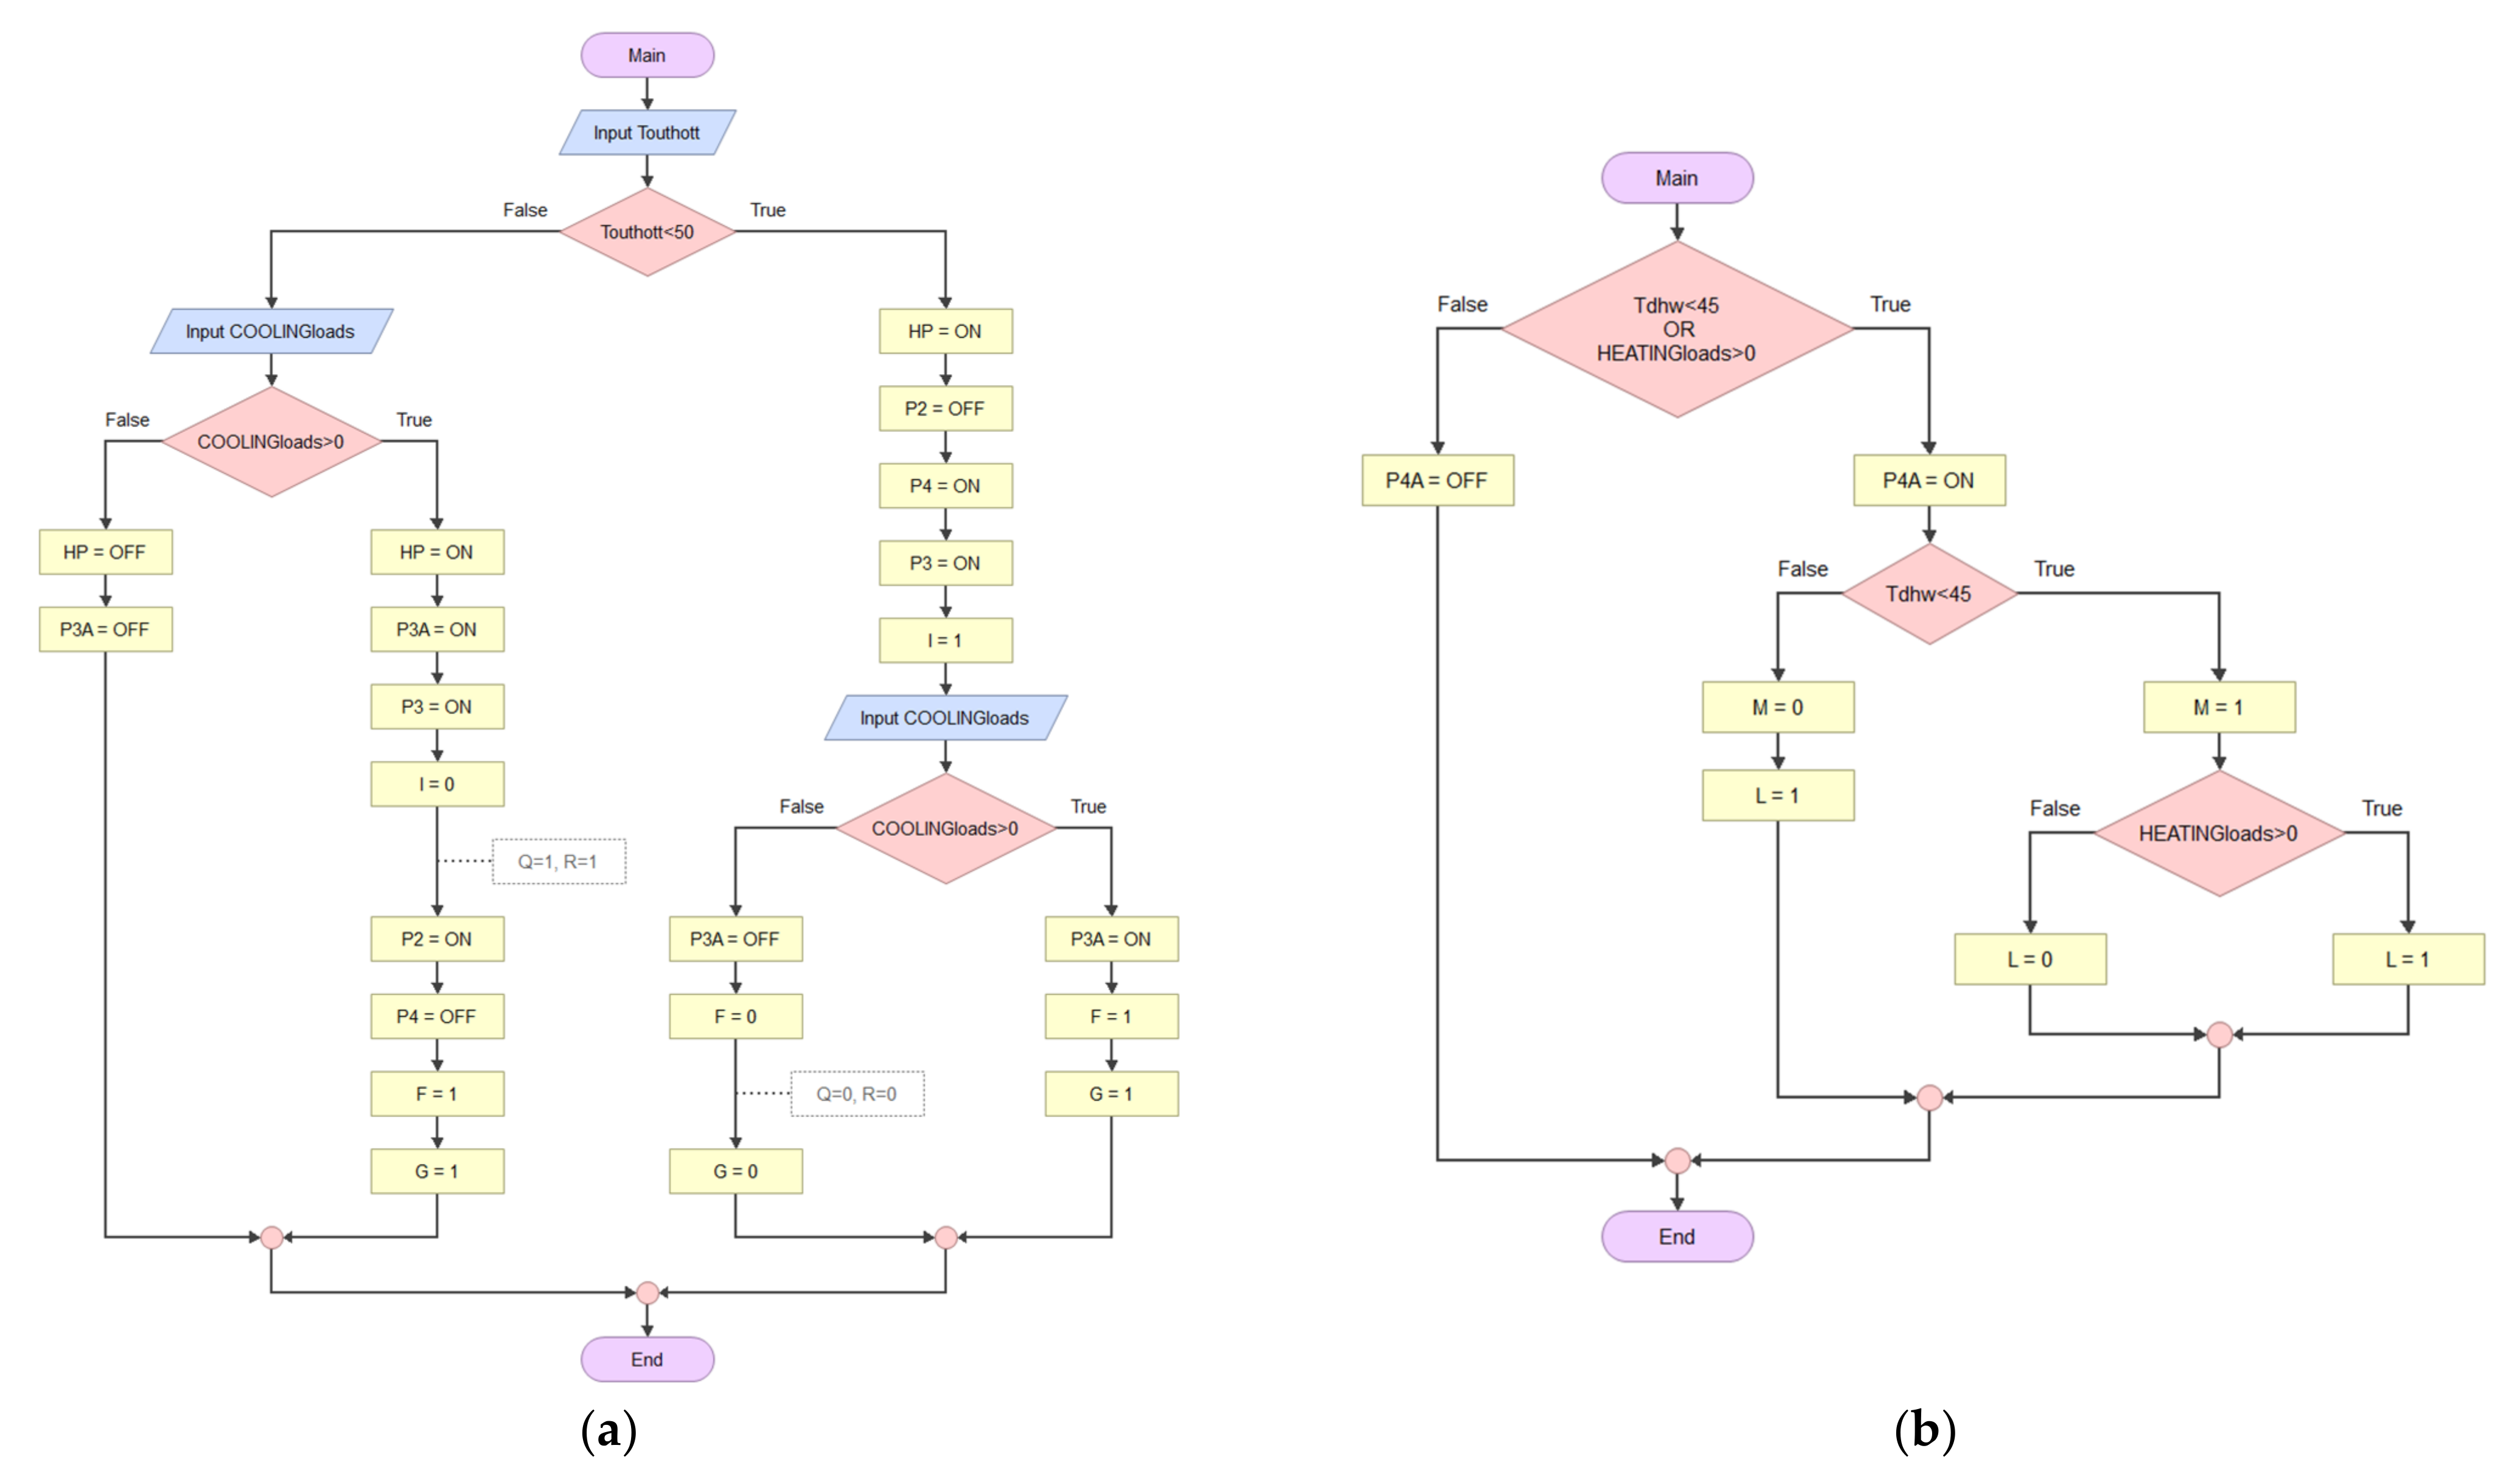
In the heat pump–chiller loop (
Figure 9a), the heat source tank is supplied either by the ground or by the PVT, whereas the hot tank satisfies the heating load (it is alimented by the heat pump condenser). The cold tank faces the cooling load, and it is connected to the heat pump evaporator. During the operation as a chiller, the condensation heat can be usefully exploited for post-heating or DHW heating. The ground can be usefully recharged during summer by the heat pump condenser or the eventual excess heat from the glazed PVT, so the latter can be maintained at an acceptable temperature. Finally, the heating–DHW loop allows the hot tank to contribute to the DHW and heating loads (
Figure 9b).
4. Conclusions
As a conclusion from the first case-study, the authors’ analysis revealed that not only a suitable design of the plant and its control logic is necessary, but an in-depth energy analysis based on data monitoring during the operation is a key factor to keep the energy efficiency at or even above the designed value. This is especially true in a multisource heat pump plant that often appears redundant to the service: if some components fail, they will not be soon replaced when this failure does not produce a plant stop. The integration of different heat sources remarkably increases the efficiency of the system in terms of primary energy consumption. This happens because the control logic allows a high exploitation of the solar heat as of a meaningful fraction to the space heating need and as heat source to the evaporator of the heat pumps. Moreover, it allows a large share of the evaporators’ energy need for the heat pumps to be supplied by the ventilation recovery.
In the second case study, a suitable control logic developed by the authors for a dual source (ground + glazed PVT) heat pump system allows the ground regeneration by cooling the PVT, thus keeping the electric efficiency of the cells close to the peak value. Furthermore, it allows the heat sources to decouple from the heat pump by a suitable disposition of storage tanks. This permits the efficient use of the heat pump as a chiller with useful heat recovery to face the contemporaneous heating and cooling building loads. The design of the plant by means of dynamic simulation revealed the best alternative and the advantage of increasing the solar field to a certain extent to reduce the ground field extension with better performance and lower costs. As a further result, the plant is more than self-sufficient for electricity on a yearly basis.
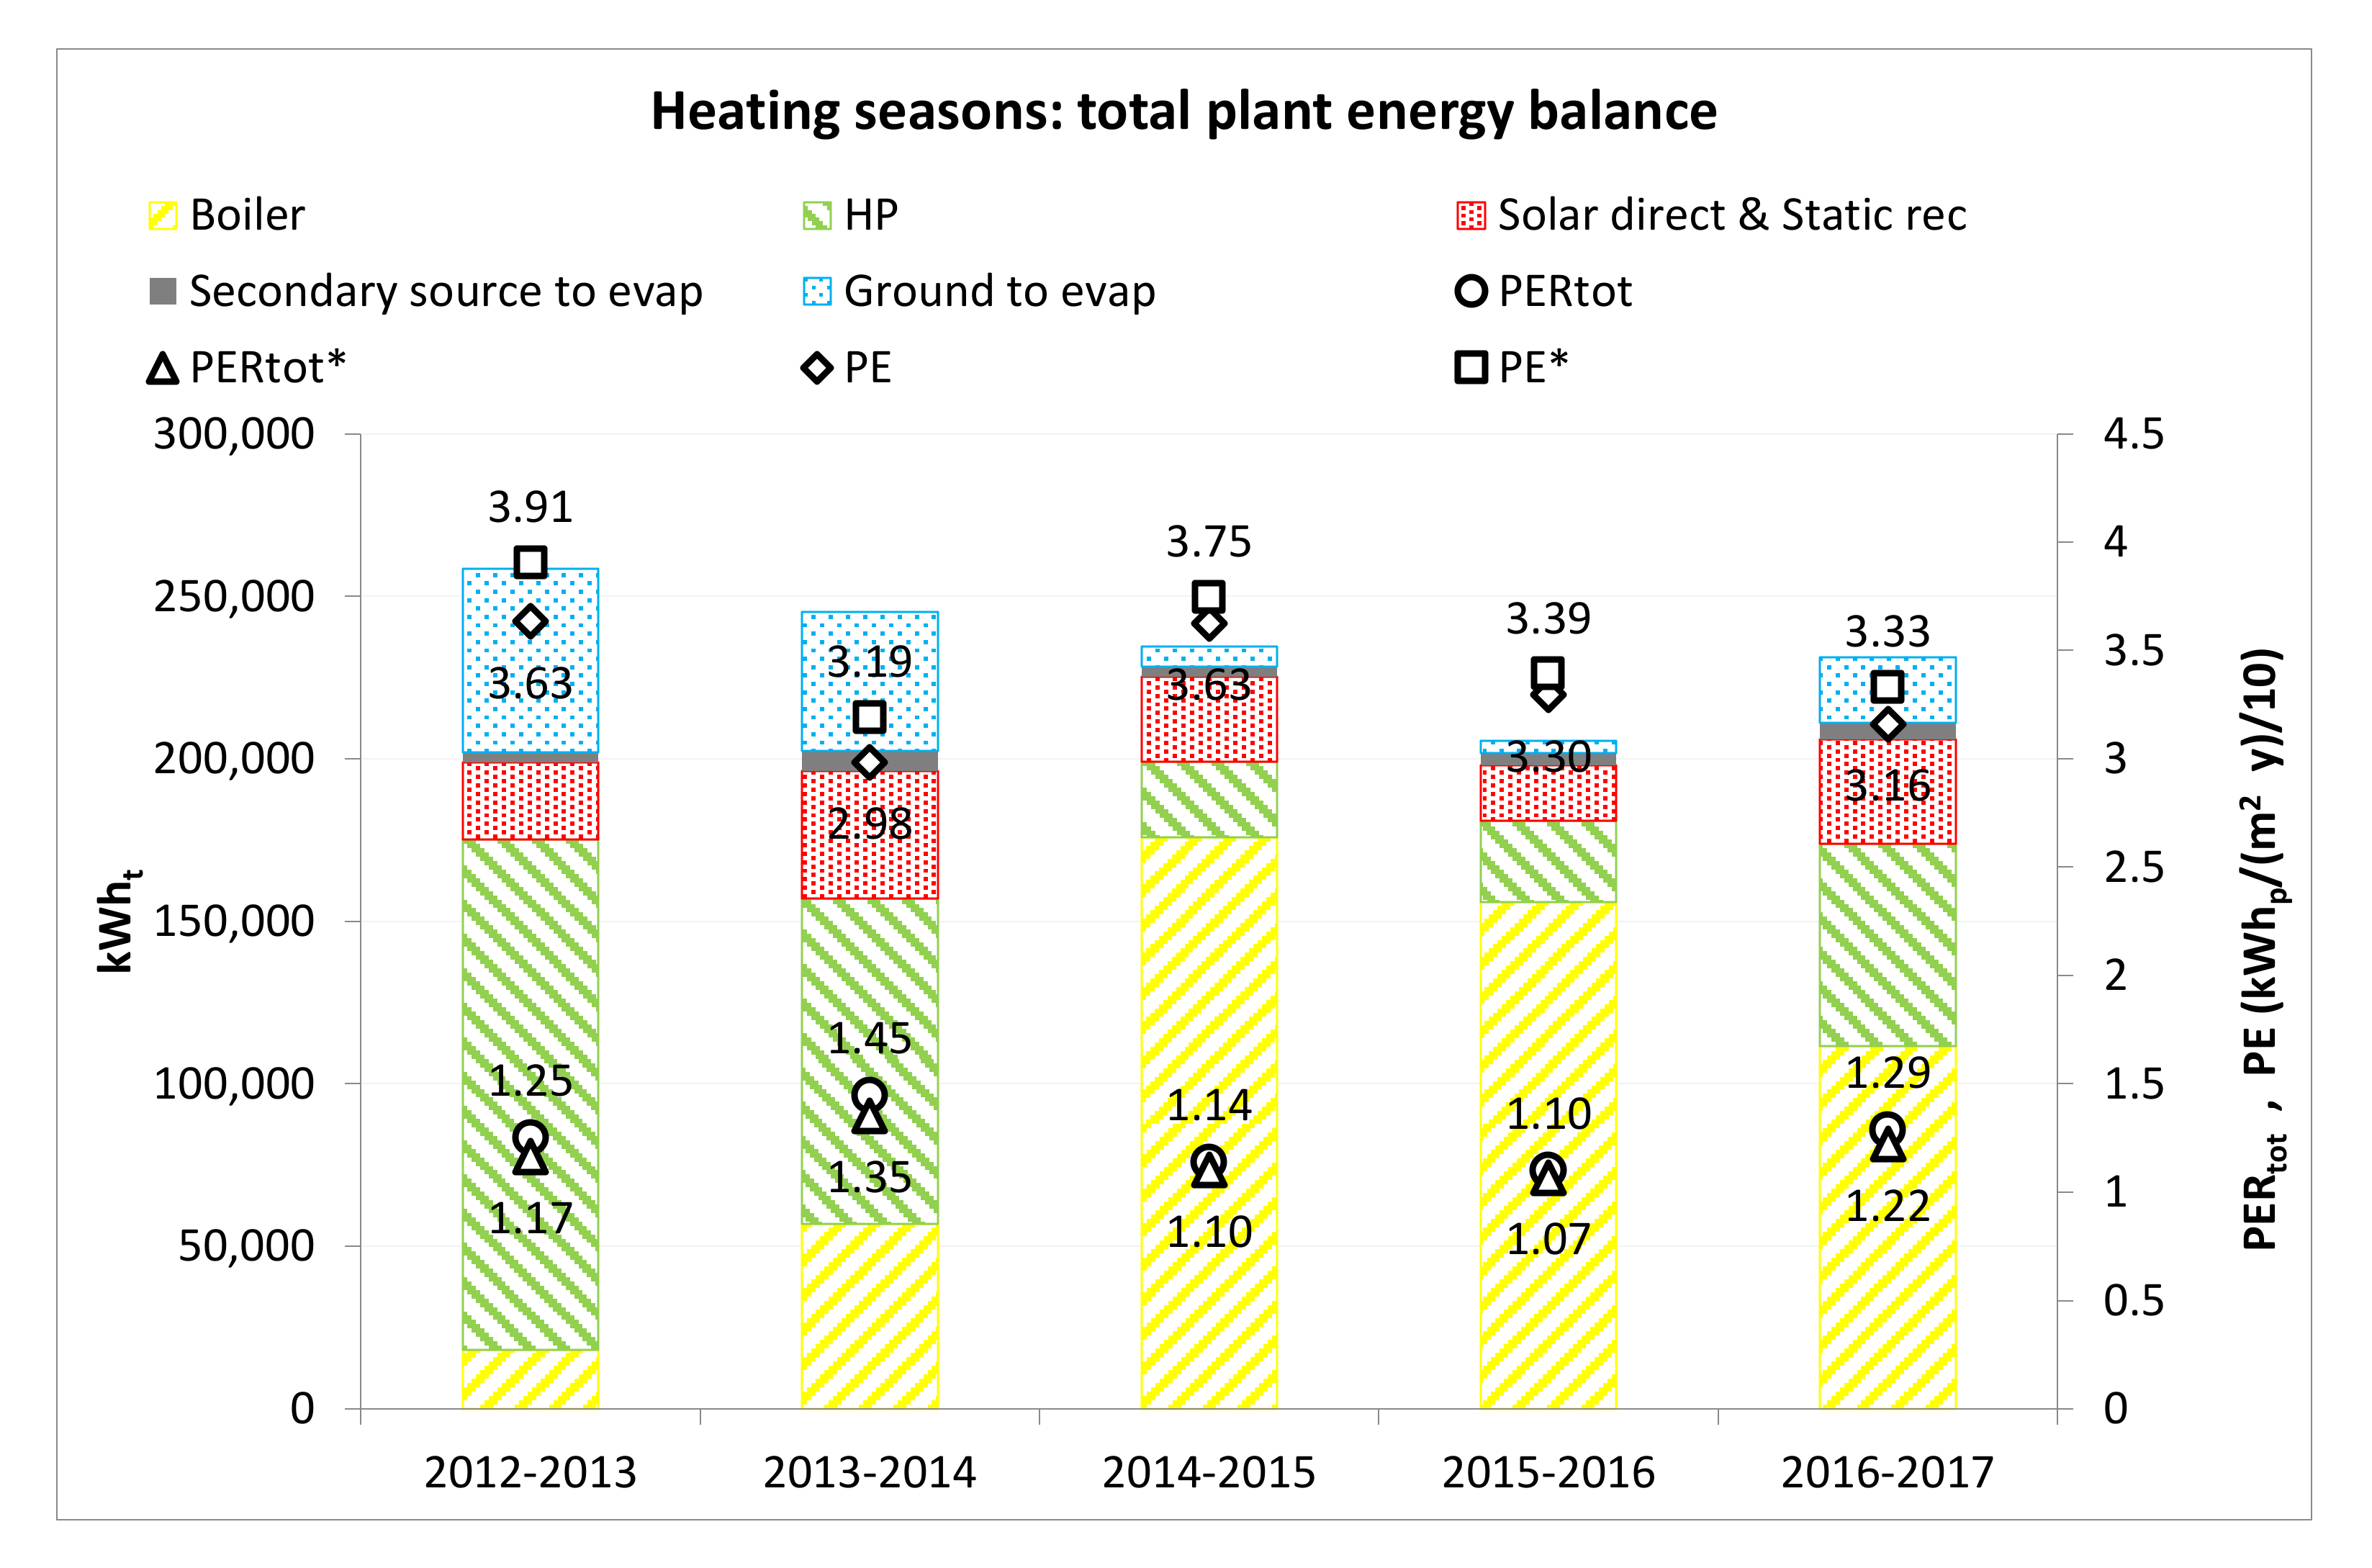
Comparing the two case studies, very high primary energy ratios (around 1.4 based on measured data, and 4.7 based on simulated data) were determined for the first and the second case, respectively. As a consequence, a primary energy consumption of 37 and 3.9 kWh m−2 y−1 was deduced respectively. In terms of CO2 emission, 7.4 and 1.2 kgCO2 m−2 y−1 can be calculated by considering a specific emission factor of 0.201 and 0.308 kgCO2 kWh−1 for the natural gas combustion and the Italian electricity mix from the grid respectively.


