Article

Effects of Connective Tissue Growth Factor on the Cell Viability, Proliferation, Osteogenic Capacity and mRNA Expression of Stem Cell Spheroids

1
Department of Oral and Maxillofacial Surgery, College of Medicine, The Catholic University of Korea, Seoul 06591, Korea
2
First Health Cluster, Dammam 31311, Eastern Province, Saudi Arabia
3
Department of Periodontics, College of Medicine, The Catholic University of Korea, Seoul 06591, Korea
4
College of Dentistry, Chosun University, Gwangju 61452, Korea
5
Ebiogen, #405, Sungsu A1 Center 48 Ttukseom-ro 17-ga-gil, Seoul 04785, Korea
*
Authors to whom correspondence should be addressed.
These authors contributed equally.
Appl. Sci. 2021, 11(14), 6572; https://doi.org/10.3390/app11146572
Submission received: 27 May 2021 / Revised: 10 July 2021 / Accepted: 12 July 2021 / Published: 16 July 2021

Abstract

:
Background: Connective tissue growth factor (CTGF) is a cellular communication network factor family protein involved in many cellular functions. The purpose of this study was to determine the effects of CTGF on the proliferation, osteogenic capacity, and mRNA expression of spheroids composed of gingiva-derived mesenchymal stem cells (GMSCs). Methods: CTGF was applied at final concentrations of 0, 25, 50, 100, and 200 ng/mL. Qualitative cell viability was determined using Live/Dead kit assay. Metabolic viability was determined with a colorimetric assay kit. Osteogenic activity was analyzed with alkaline phosphatase activity and Alizarin Red S staining. Quantitative polymerase chain reaction (qPCR) was used to assess the expression levels of RUNX2, BSP, OCN, and COL1A1. Results: In general, there was no significant difference in cell viability between the groups on Days 1, 4, and 7. Addition of CTGF produced an increase in Alizarin Red S staining. qPCR results demonstrated that the mRNA expression levels of RUNX2, BSP, OCN, and COL1A1 were significantly increased with the addition of CTGF. Conclusions: Based on these findings, we conclude that CTGF can be applied for increased osteogenic differentiation of stem cell spheroids.

1. Introduction

Many studies have tested the effects and ability of growth factors to induce osteogenic capacity of gingiva-derived mesenchymal stem cells (GMSCs) [1,2,3]. A previous report showed that bone morphogenetic protein-4 promoted osteogenic differentiation through upregulation of collagen I and Sp7 expression [1]. Fibroblast growth factors were shown to be involved in osteogenic differentiation of stem cell spheroids while maintaining cell viability [4]. Optimal concentrations of growth factors for proliferation or differentiation activity have been studied previously [1,4,5]. Increases in osteogenic differentiation were achieved in a dose-dependent manner at up to 200 ng/mL of fibroblast growth factor-4 [4]. In another study, 10% concentrated growth factor significantly promoted proliferation of GMSCs, but higher concentrations produced gradual decrease in cellular proliferation [5].
Connective tissue growth factor (CTGF), which is a member of the cysteine-rich 61 family, is synthesized by osteoblasts [6]. CTGF is involved in diverse biological and pathological processes as well as many cellular functions, including cell proliferation, cell migration, cell adhesion, and extracellular matrix production [7]. CTGF is reported to be involved in the proliferation and differentiation of osteoblasts [8]. In one study, CTGF gene expression was upregulated in human periodontitis tissues, where it enhanced osteoclast formation and suppressed anti-osteoclastogenic factor expression throughout the experimental period, inducing indirect osteoclastogenesis [9]. Moreover, application of CTGF led to inhibition of BCL6 mRNA expression, and its protein expression was clearly downregulated in bone marrow-derived macrophages treated with CTGF compared to those in the control group [9]. Overexpression of CTGF in vivo resulted in osteopenia, a secondary cause of decreased bone formation, possibly by antagonizing the signaling and activity of bone morphogenetic protein and Wnt [10]. Application of CTGF to GMSCs has not been performed. More recently, stem cell spheroids have been of great interest in stem cell therapy [11,12]. Stem cell spheroids have the potential to be applied for various applications including cell therapy [13].To the authors’ knowledge, there is no previous microwell study reporting the effects of CTGF on cell spheroids composed of GMSCs. Therefore, we hypothesized that addition of CTGF will have specific effects on the cell viability and osteogenic capacity cell spheroids. In light of promising findings on CTGF, the purpose of this present study was to investigate the effects of CTGF on cell viability, osteogenic capacity, and mRNA expression of three-dimensional culture.

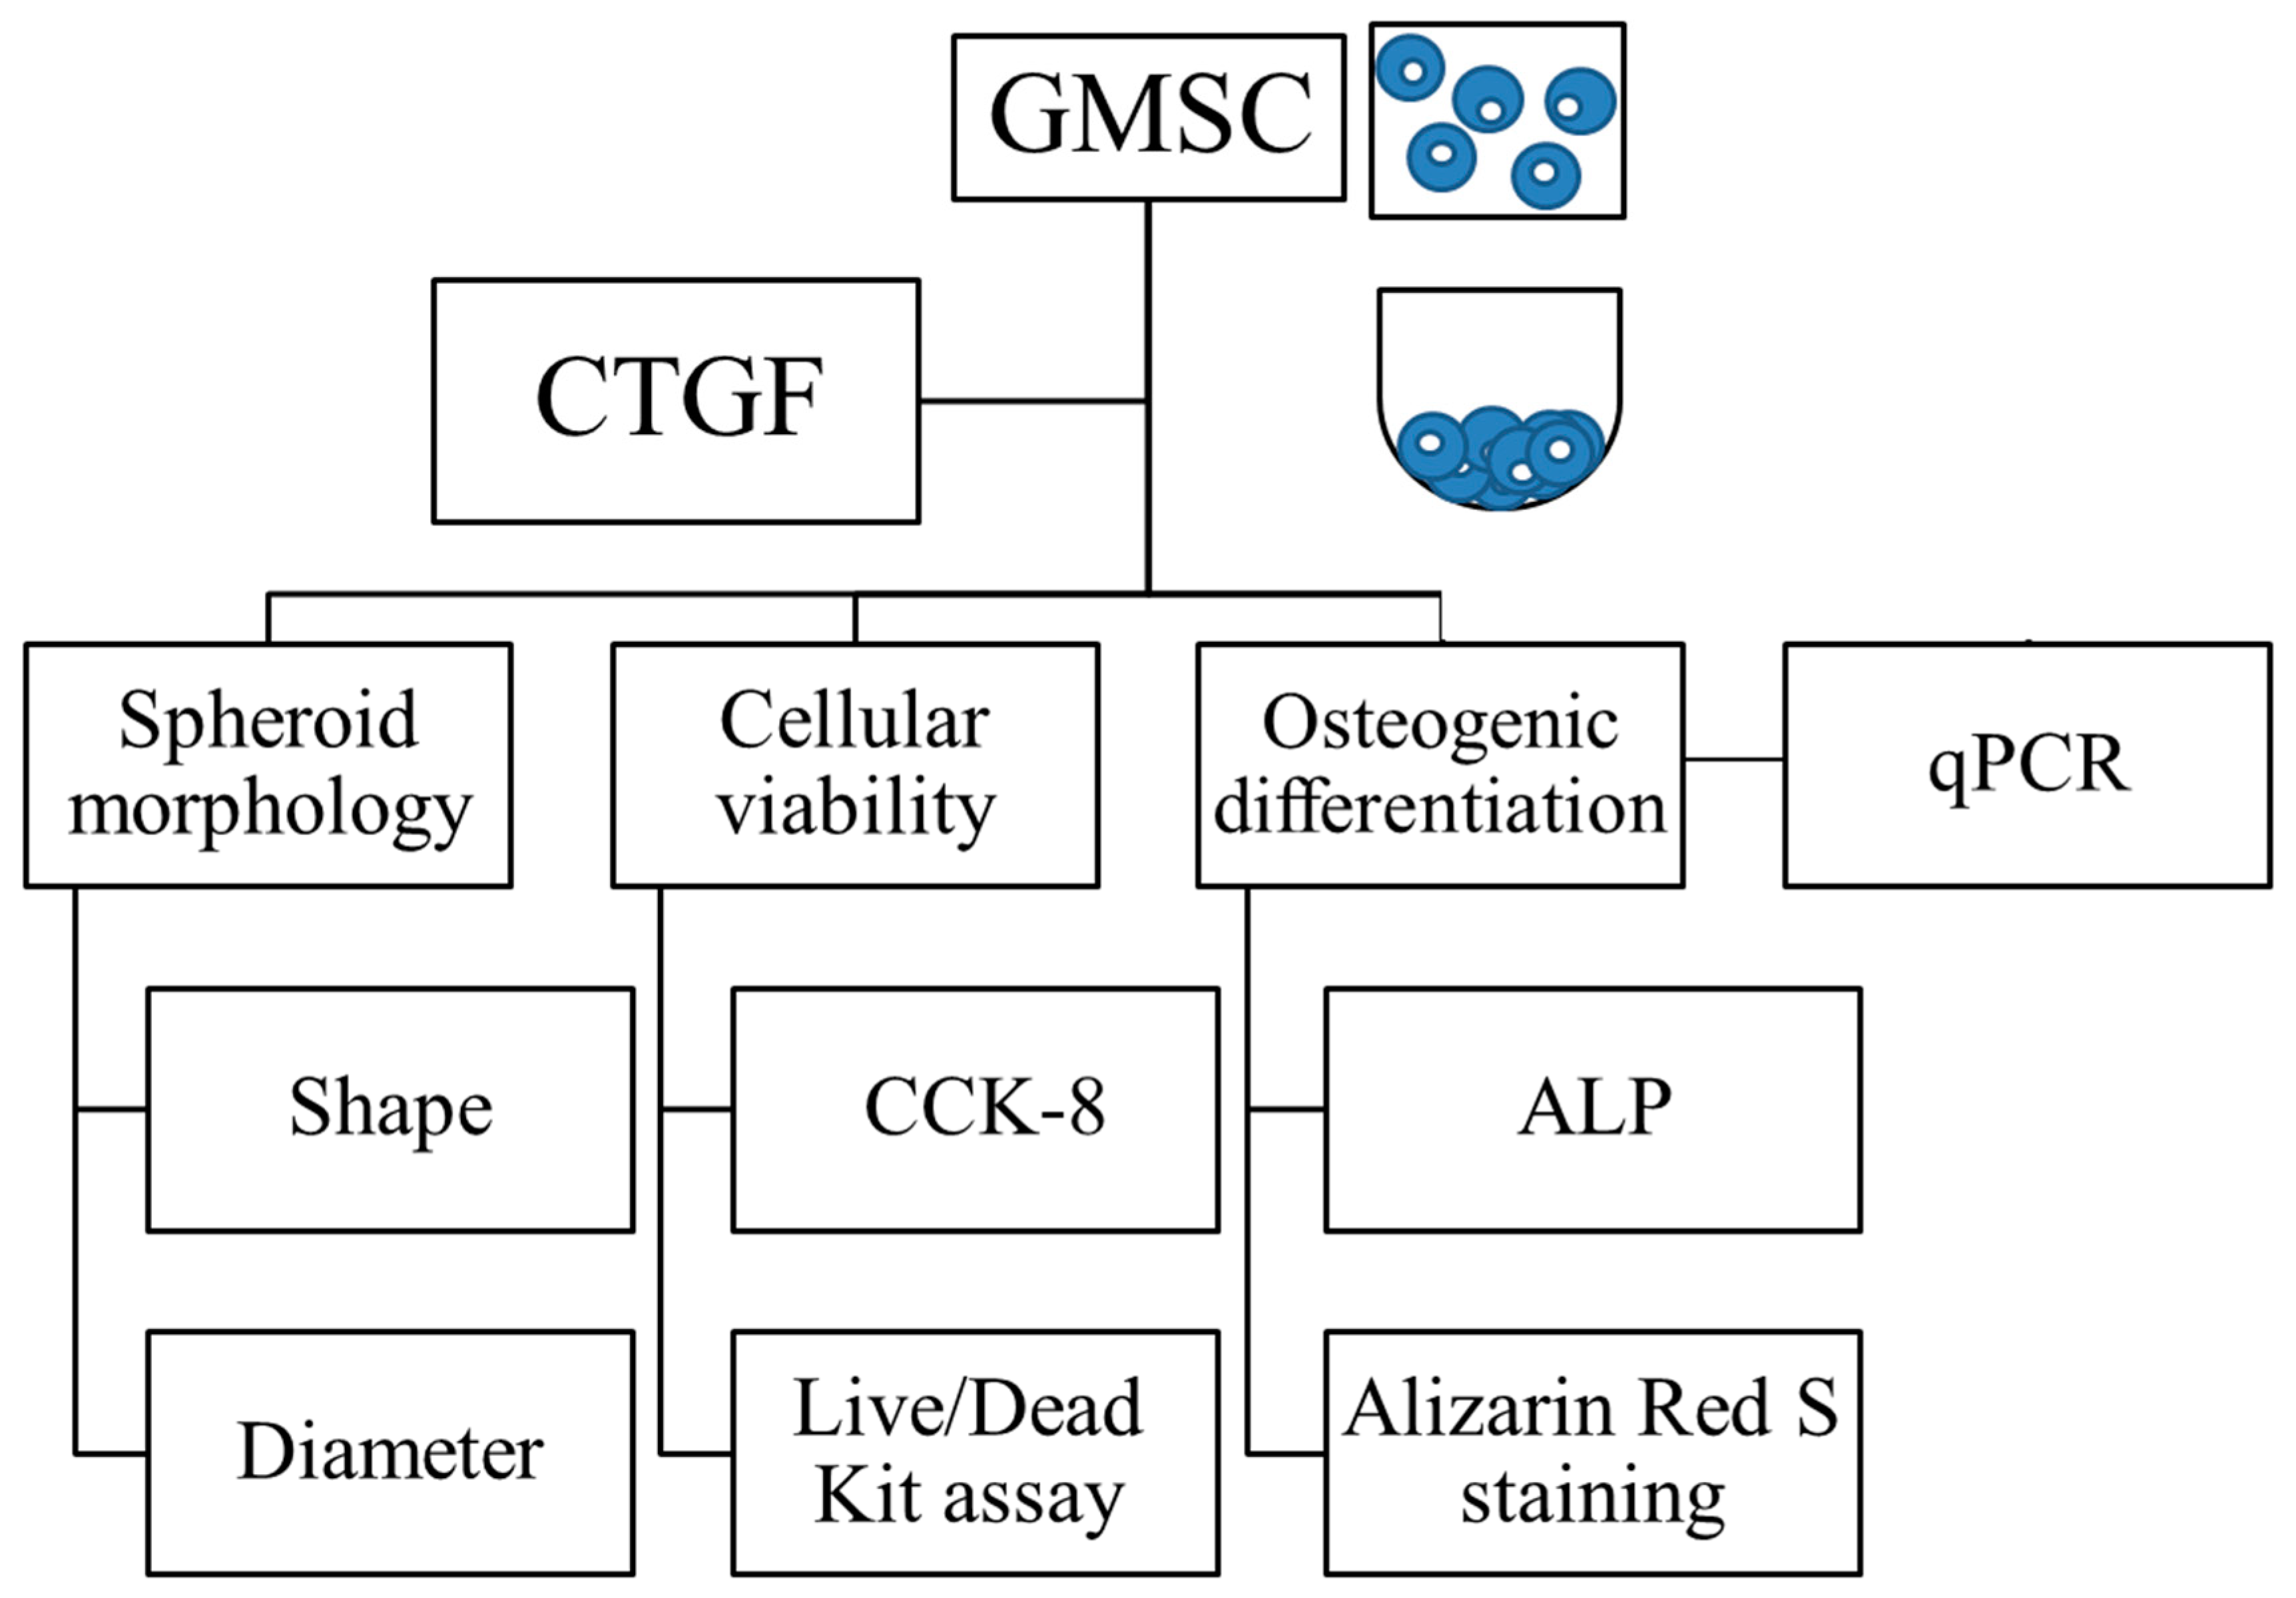
2. Materials and Methods

2.1. Cell Spheroids Composed of Human Gingiva-Derived Mesenchymal Stem Cells

This study and all the experimental schemes were reviewed and approved (KC19SESI0228; approved date: 17 April 2019) to be performed according to the relevant guidelines. GMSCs were obtained following previously reported methods [14]. Written informed consent has been obtained from the participant. Gingival tissues were obtained under local anesthesia from a 64-year-old female participant. In short, the gingival tissue samples collected were de-epithelialized and were digested using enzymes. In a culture dish, GMSCs were plated and the unattached cells were eliminated from dish. The culture media were changed with new media every two to three days.
Figure 1 shows study flow diagram illustrating the overview. Concave microwells (Cat. No. H389600L; StemFIT 3D; MicroFIT, Seongnam-si, Gyeonggi-do, Korea) were used to make stem cell spheroids. The number of wells for each concave microwell was 389. We added a total of 1.1 × 10⁶ GMSCs (Cat. No. DHC-No 1; Neubauer Improved C-Chip, NanoEnTek, Seoul, Korea) having passage 6 in each microwell and evaluated the cellular response. The stem cell spheroids were cultured in media that contained 82% of minimal essential medium alpha modification, with L-glutamine, ribo- and deoxyribonucleosides (Cat. No. SH30265.01; HyClone®, GE Healthcare Life Sciences, Thermo Fisher Scientific, Inc., Logan, UT, USA), 15% of fetal bovine serum (Cat. No. SH30084.03; HyClone®), 1% of L-glutamine (Cat. No. G7513; Sigma-Aldrich, St. Louis, MO, USA), 1% of penicillin-streptomycin solution (Cat. No. SV30010; HyClone®) and 1% of Dulbecco’s phosphate buffered saline modified without calcium, magnesium (Cat. No. SH30028.02; HyClone®) with 0.0144 g of ascorbic acid (Cat. No. A4544; Sigma-Aldrich, St Louis, MO, USA). The stem cell spheroids were treated with CTGF (Catalogue No. CYT-541, PROSPEC Protein Specialists, Rehovot, Israel) at predetermined concentrations of 0, 25, 50, 100, and 200 ng/mL. The media containing CTGF was replenished every day. We evaluated the morphological characteristics using a microscope (Leica DM IRM, Leica Microsystems, Wetzlar, Germany) on Days 1, 3, 5, and 7. Morphological evaluation of the spheroids was conducted and the diameter of the spheroids was calculated by comparing the reference on Days 1, 4, and 7, following the previous method [15]. Three spheroids were used for the measurements in each group at each time point.

2.2. Determination of Cellular Viability

A Live/Dead kit assay was used to determine the viability of the stem cell spheroids after incubating the samples for 50 min upon addition of 0.049% of component A (calcein AM), 0.199% of component B (ethidium homodimer-1), and 99.75% of Dulbecco’s phosphate-buffered saline on Days 1, 4, and 7. Qualitative cellular viability results were obtained using a fluorescence microscope (Axiovert 200, Zeiss, Germany) [16]. Three spheroids were analyzed for each group at each time point.
The metabolic viability was determined using a colorimetric assay, producing soluble formazan dye (Cell Counting Kit-8 [CCK-8], Cat. No. CK04; Dojindo, Tokyo, Japan) was performed by incubating the samples for one hour at 37 °C on Days 1, 4, and 7. This assay is based on water-soluble tetrazolium salt and evaluation of absorbance was performed at 450 nm. Five spheroids were used for analyzing the CCK-8 proliferation in each group at each time point.

2.3. Evaluation of Alkaline Phosphatase Activity and Alizarin Red S Staining in Osteogenic Media

These spheroids were grown in osteogenic media contained 82% of minimal essential medium alpha modification, with L-glutamine, ribo- and deoxyribonucleosides (Cat. No. SH30265.01; HyClone®, GE Healthcare Life Sciences, Thermo Fisher Scientific, Inc., Logan, UT, USA), 15% of fetal bovine serum (Cat. No. SH30084.03; HyClone®), 1% of L-glutamine (Cat. No. G7513; Sigma-Aldrich), 1% of penicillin-streptomycin solution (Cat. No. SV30010; HyClone®) and 1% of Dulbecco’s phosphate buffered saline modified without calcium, magnesium (Cat. No. SH30028.02; HyClone®) with 0.019 g of dexamethasone (Cat. No. D4902; Sigma-Aldrich, St Louis), 1 g of β-glycerophosphate disodium salt hydrate (Cat. No. G9422) and 0.0144 g of ascorbic acid (Cat. No. A4544; Sigma-Aldrich). An alkaline phosphatase (ALP) activity assay (Cat. No. AS-72146; SensoLyte® p-nitrophenyl palmitate [pNPP] colorimetric alkaline phosphatase assay kit, AnaSpec, EGT Group, Fremont, CA, USA) and Alizarin Red S staining (Cat. No. 0223; ScienCell Research Laboratories, Carlsbad, CA, USA) were used for osteogenic differentiation.
The ALP assay kit was used to detect ALP in biological samples by providing a convenient colorimetric assay. A mixture of 50% component A (pNPP, a colorimetric alkaline phosphatase substrate), 5% component B (10× assay buffer), and 45% distilled water was added to the sample. The sample was incubated at room temperature for one hour, and the spectrophotometric absorbance was evaluated at 405 nm on Days 1, 7, and 14.
An anthraquinone dye was used to stain calcium deposits on Days 2, 8, 14, and 22. The stem cell spheroids were washed with phosphate buffered saline (pH 7.4 ± 0.1; Cat. No. LB204-02, fresh media, Welgene, Gyeongsan-si, Gyeongsangbuk-do, Korea) and fixed with 4% paraformaldehyde (Cat. No.P2031, Biosesang, Seongnam-si, Gyeonggi-do, Korea) for 30 min at RT. The spheroids were washed with dH2O. Ten percent cetylpyridinium chloride (Cat. No. C0732; Sigma-Aldrich, St. Louis, MO, USA) was applied for 15 min at RT to solubilize the bound dye on Days 2, 8, 15, and 22. The spectrophotometric absorbance at 560 nm was measured to quantify the bound dyes.

2.4. Total RNA Extraction and Quantification of Runt-Related Transcription Factor 2 (RUNX2), Bone Sialoprotein (BSP), Osteocalcin (OCN) and COL1A1 mRNA by Real-Time Quantitative Polymerase Chain Reaction (qPCR)

Total RNA extraction was performed using a commercially available kit (Thermo Fisher Scientific, Inc., Waltham, MA, USA), according to the manufacturer’s instructions [17]. The quantity of RNA was evaluated with a bioanalyzer (Agilent 2100) using a kit (RNA 6000 Nano Chip; Agilent Technologies), and RNA quality was evaluated with the ratio of absorbance at 260 nm and 280 nm using a spectrophotometer (ND-2000, Thermo Fisher Scientific, Inc.). RNA was used as reverse transcription template applying reverse transcriptase (SuperScript II; Invitrogen, Carlsbad, CA, USA).
mRNA expression was detected by qPCR on Days 1, 7, and 14. We used GenBank to design the sense and antisense primers for PCR. The primer sequences were as follows: RUNX2 (accession No.: NM_001015051.3; forward: 5′-CAGTTCCCAAGCATTTCATCC-3′, reverse: 5′-AGGTGGCTGGATAGTGCATT-3′); BSP (accession No.: NM_004967.4; forward: 5′-CCTCTCCAAATGGTGGGTTT-3′, reverse: 5′-ATTCAACGGTGGTGGTTTTC-3′); OCN (accession No.: NM_199173.6; forward 5′-GGTGCAGAGTCCAGCAAAGG-3′, reverse: 5′-GCGCCTGGGTCTCTTCACTA-3′); COL1A1 (accession No.: NM_000088.4; forward: 5′-TACCCCACTCAGCCCAGTGT-3′, reverse: 5′-CCGAACCAGACATGCCTCTT-3′); and β-actin (accession. No.: NM 001101: forward: 5′-AATGCTTCTAGGCGGACTATGA-3′, reverse: 5′-TTTCTGCGCAAGTTAGGTTTT-3′). Normalization was performed using the β-actin housekeeping gene. Real-time PCR was performed using the SYBR Green PCR Kit (Applied Biosystems, Waltham, MA, USA) on the PCR System (StepOnePlusTM; Applied Biosystems), following the manufacturer’s recommendations [4,18].

2.5. Statistical Analysis

All values are presented as mean ± standard deviation. Tests of normality and equality of variances were conducted [19,20]. Comparisons between the groups were performed by one-way analysis of variance with Tukey’s post-hoc test. Three experimental replicates were evaluated for each analysis.

3. Results

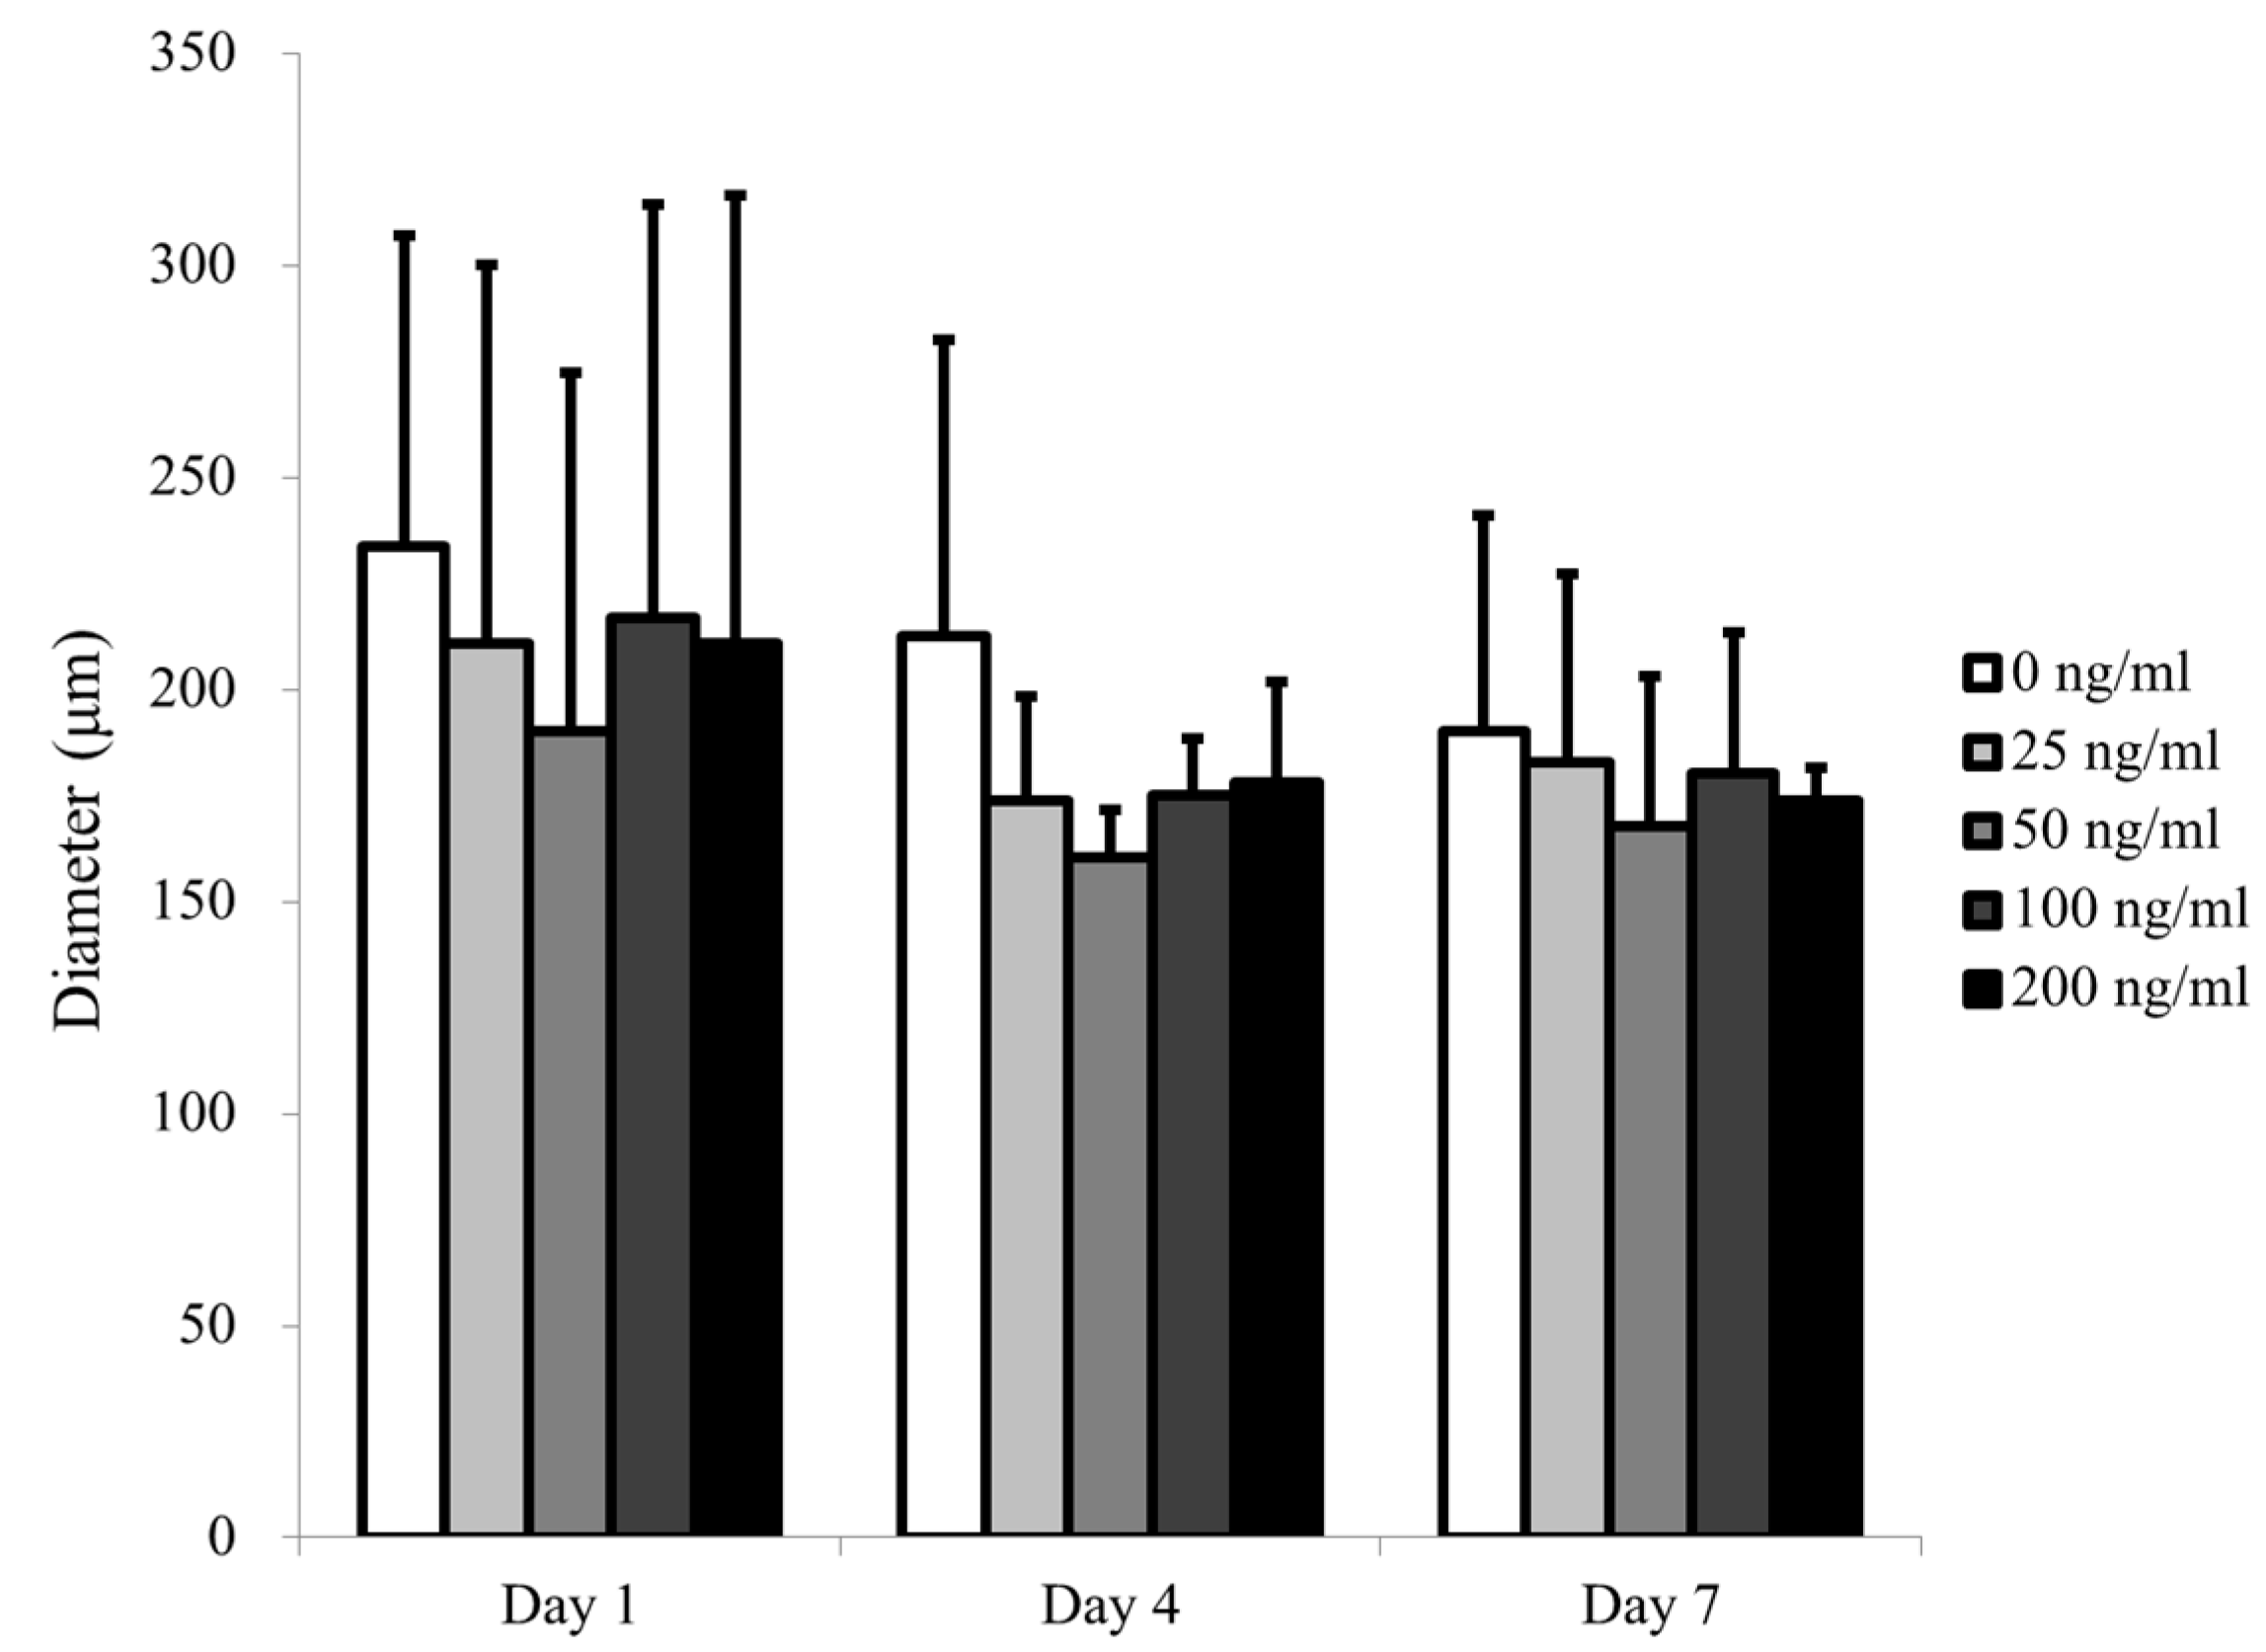
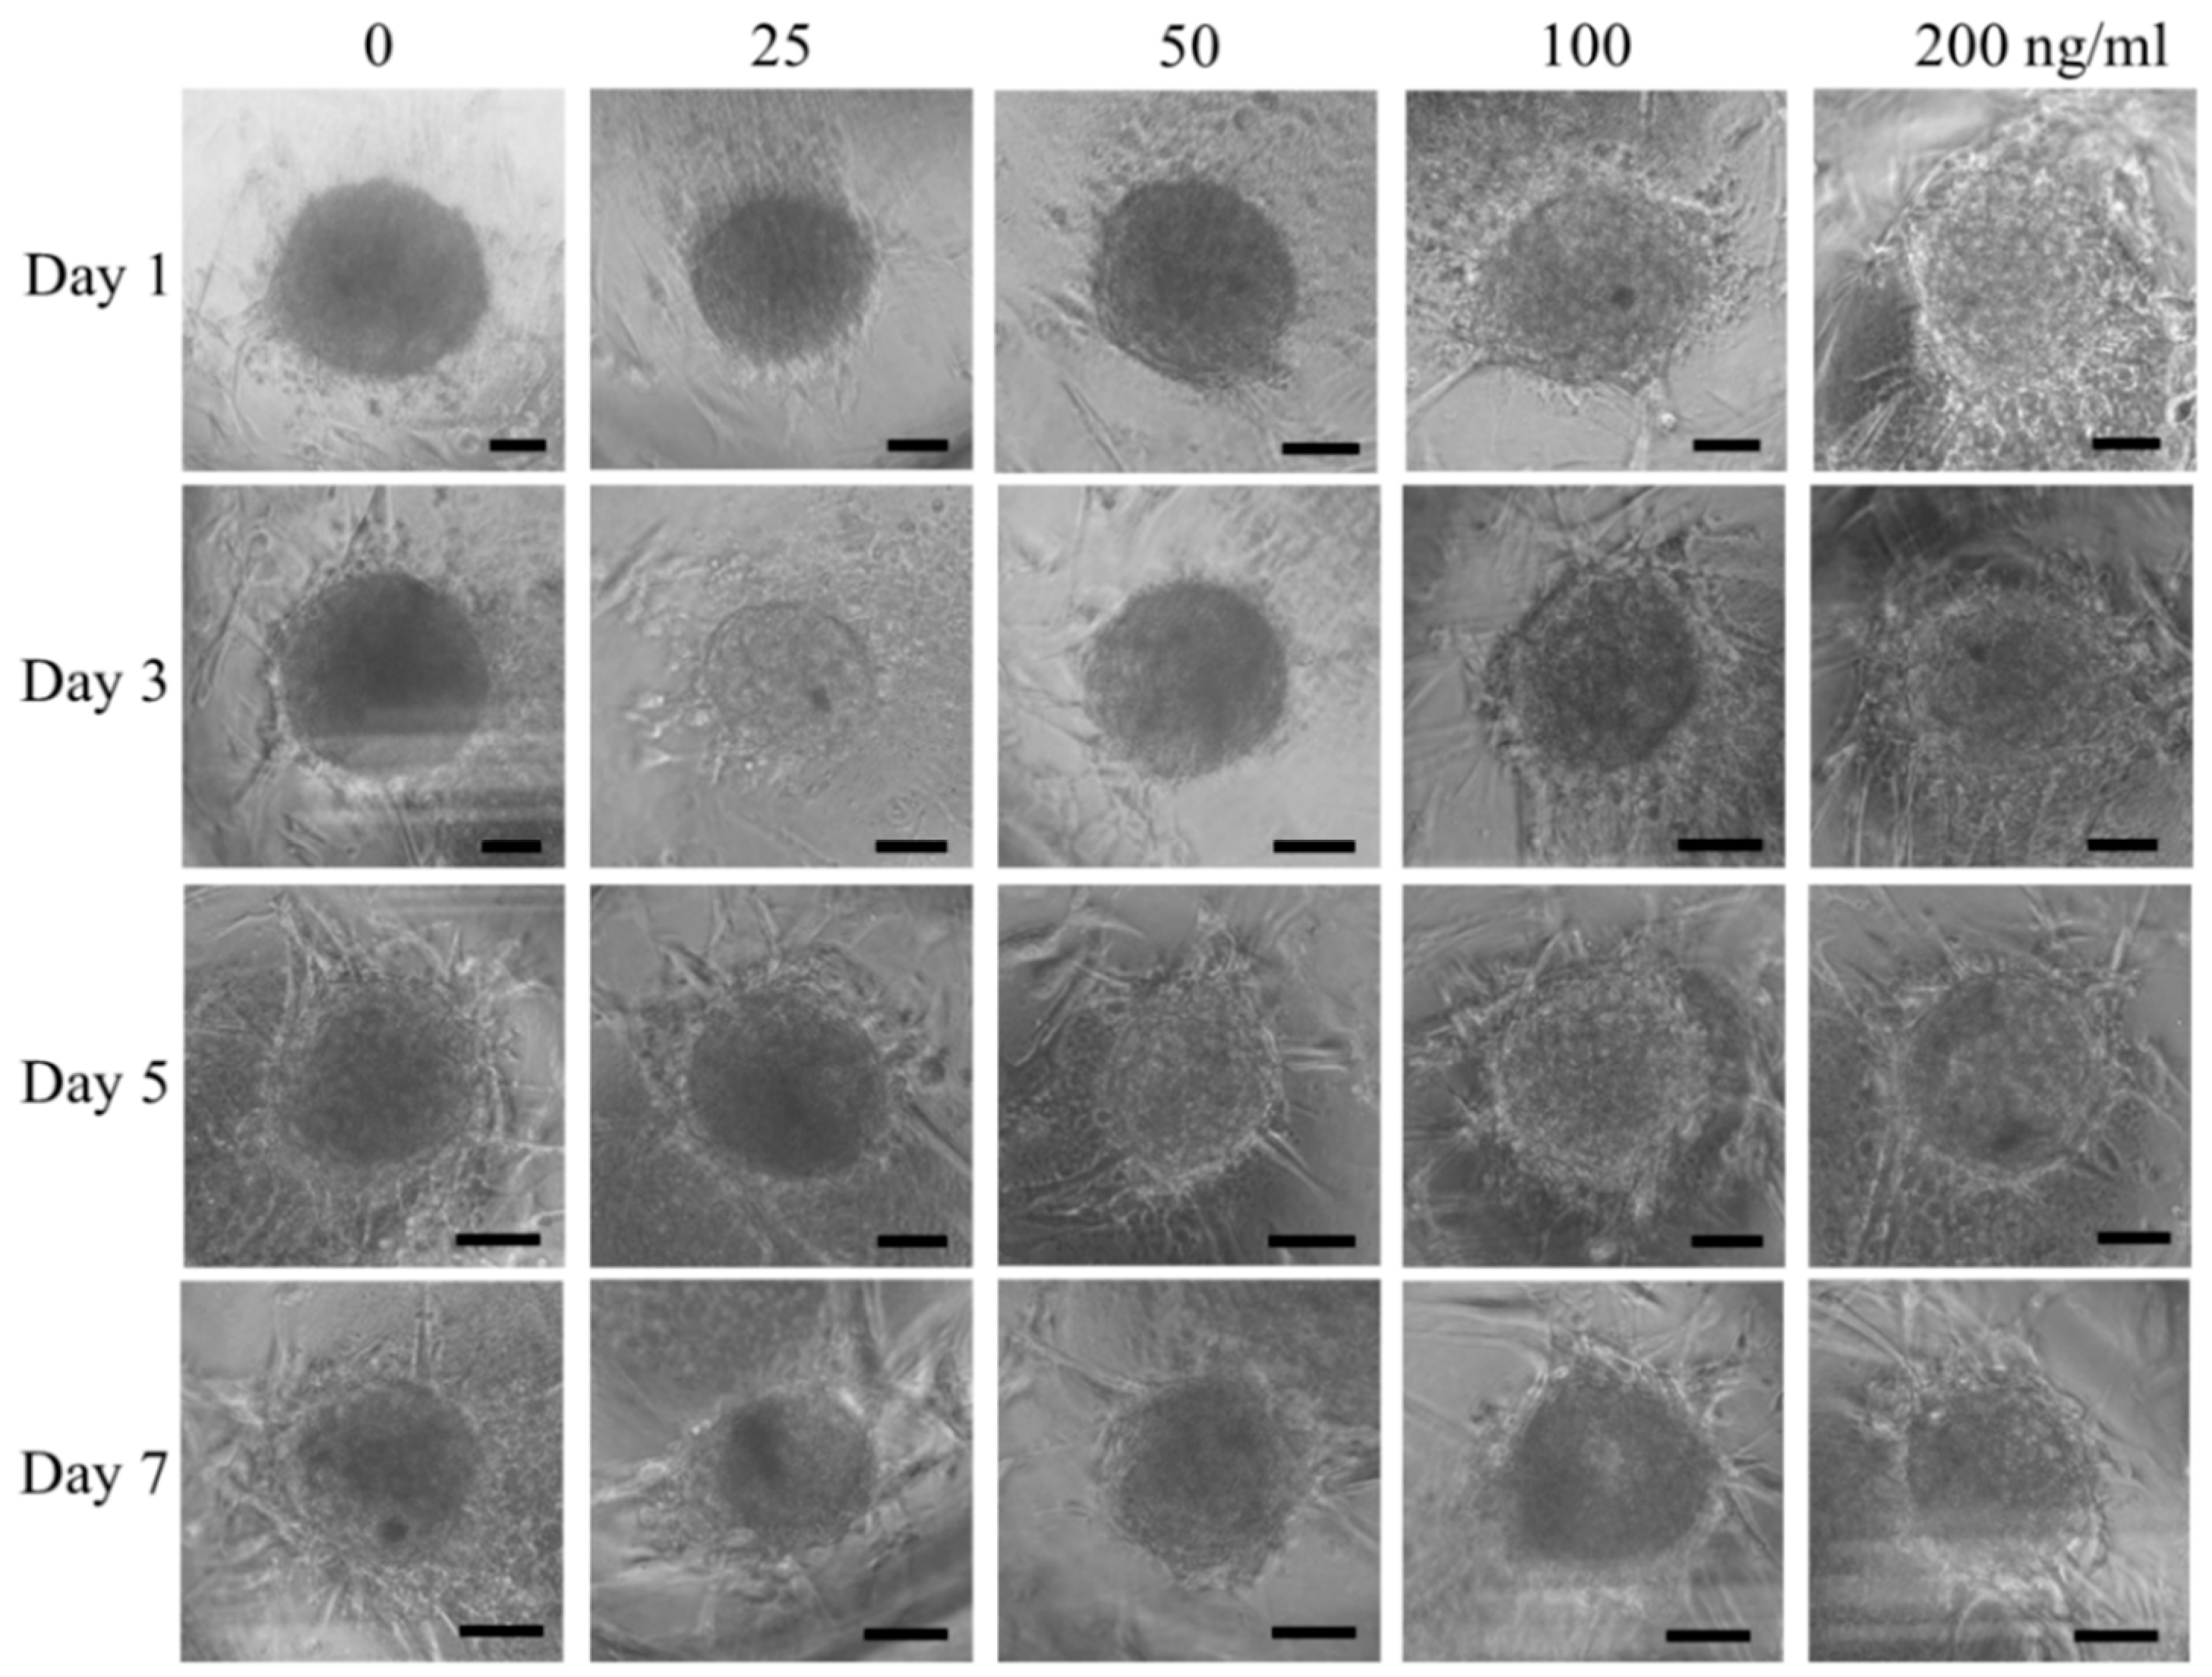
3.1. Cell Spheroids of Human Gingiva-Derived Mesenchymal Stem Cells

The addition of CTGF to cell spheroids at 25, 50, 100, and 200 ng/mL concentrations did not produce significant changes in morphology on Day 1 (Figure 2). No significant changes in morphology were seen with the longer incubation of 7 days. There were no significant differences in the average spheroid diameters between the groups on Day 1 (Figure 3) (p > 0.05). The average spheroid diameters for the 0, 25, 50, 100, and 200 ng/mL groups on Day 4 and 7 are shown in Figure 3. No significant changes in diameter were noted in any group throughout the duration of the experiment.

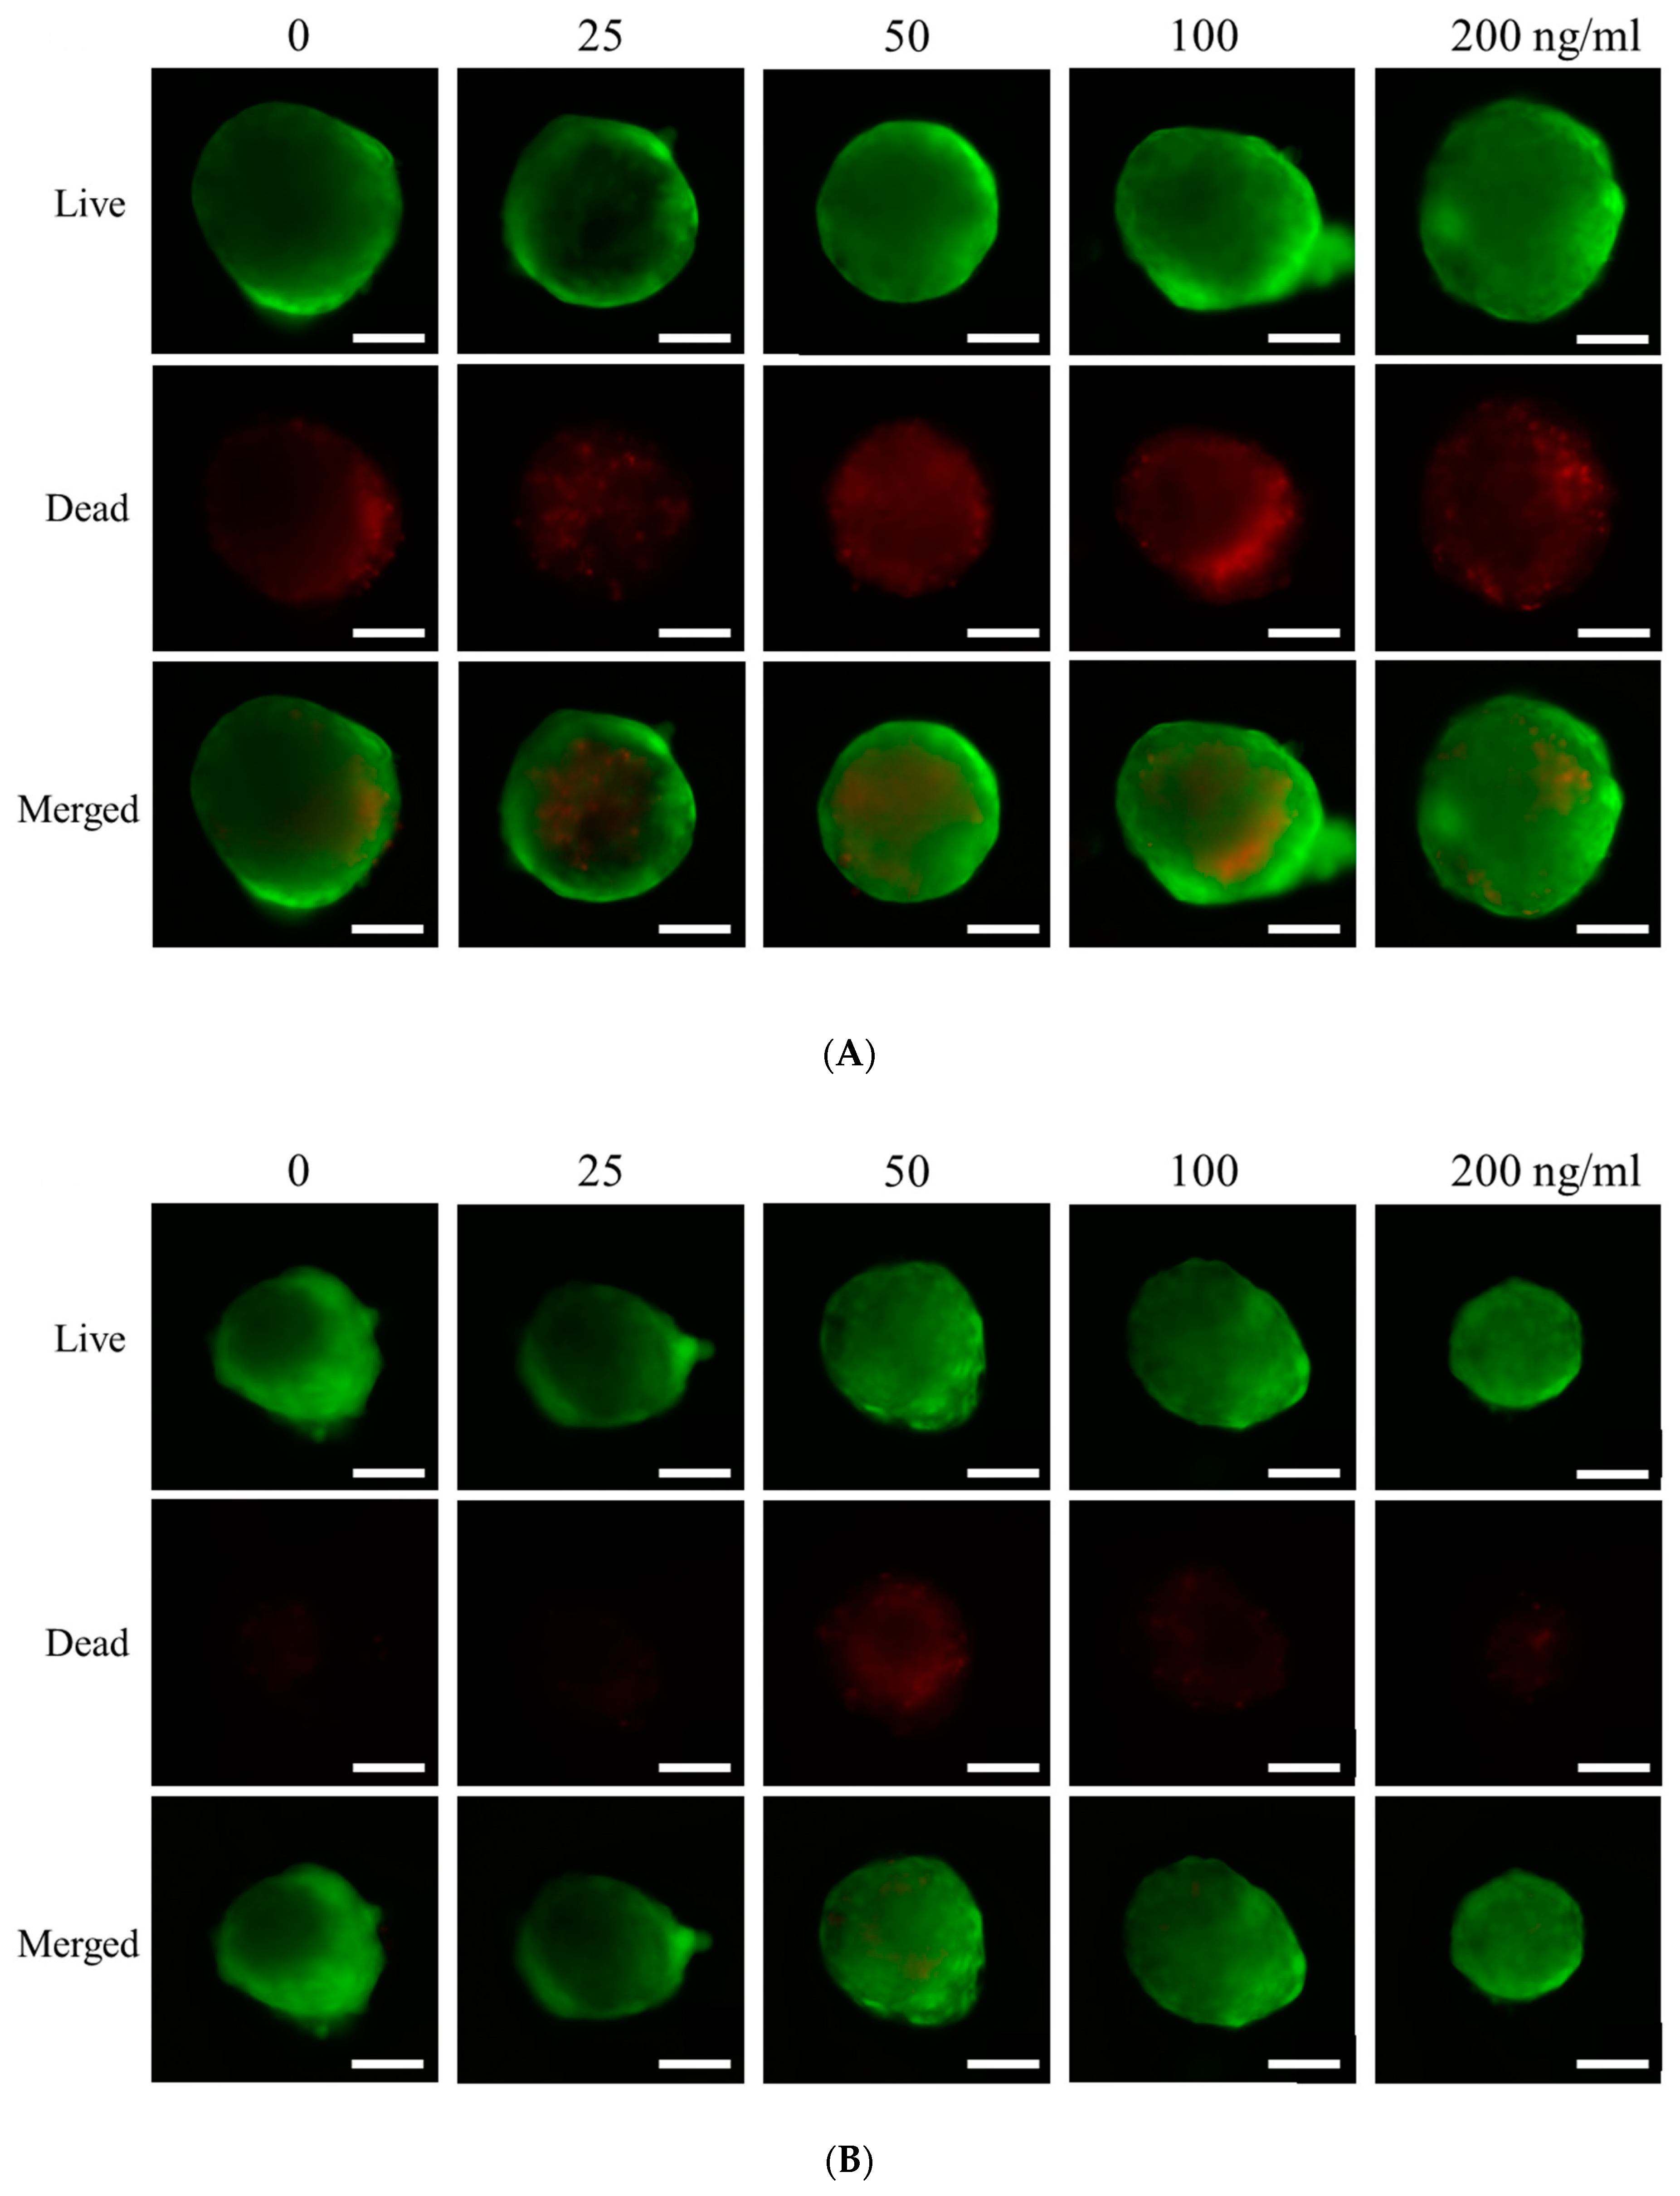
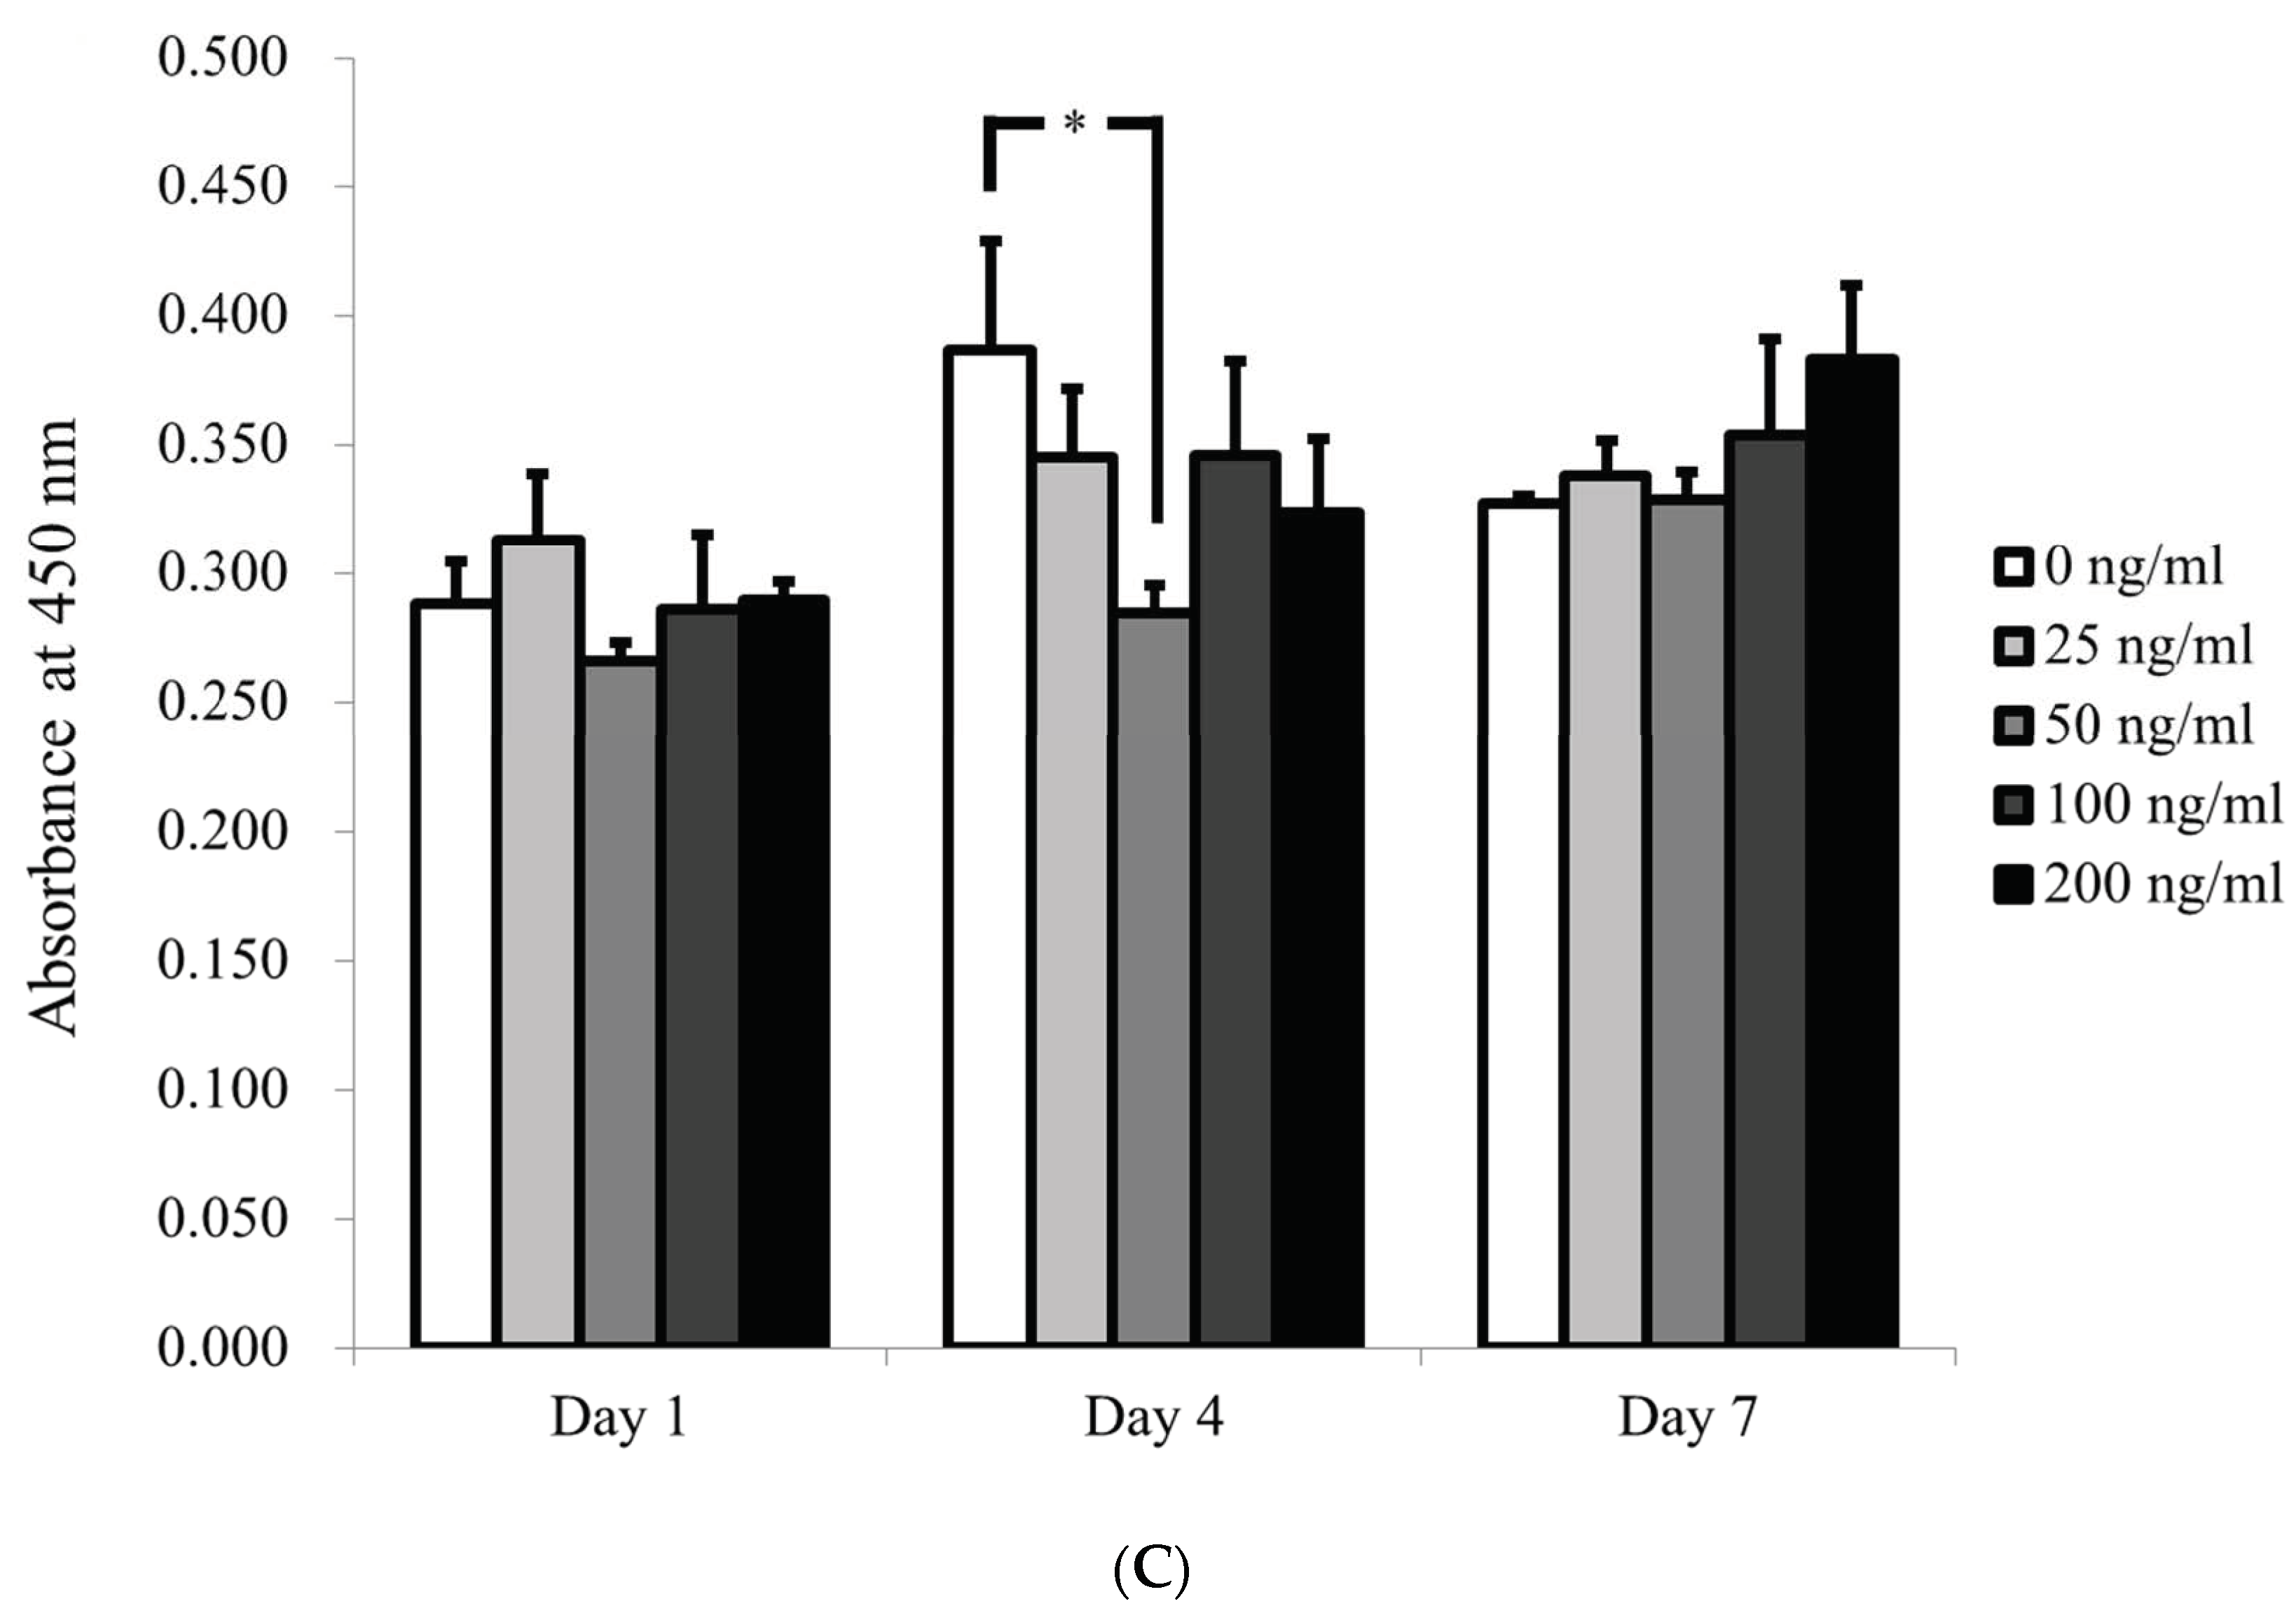
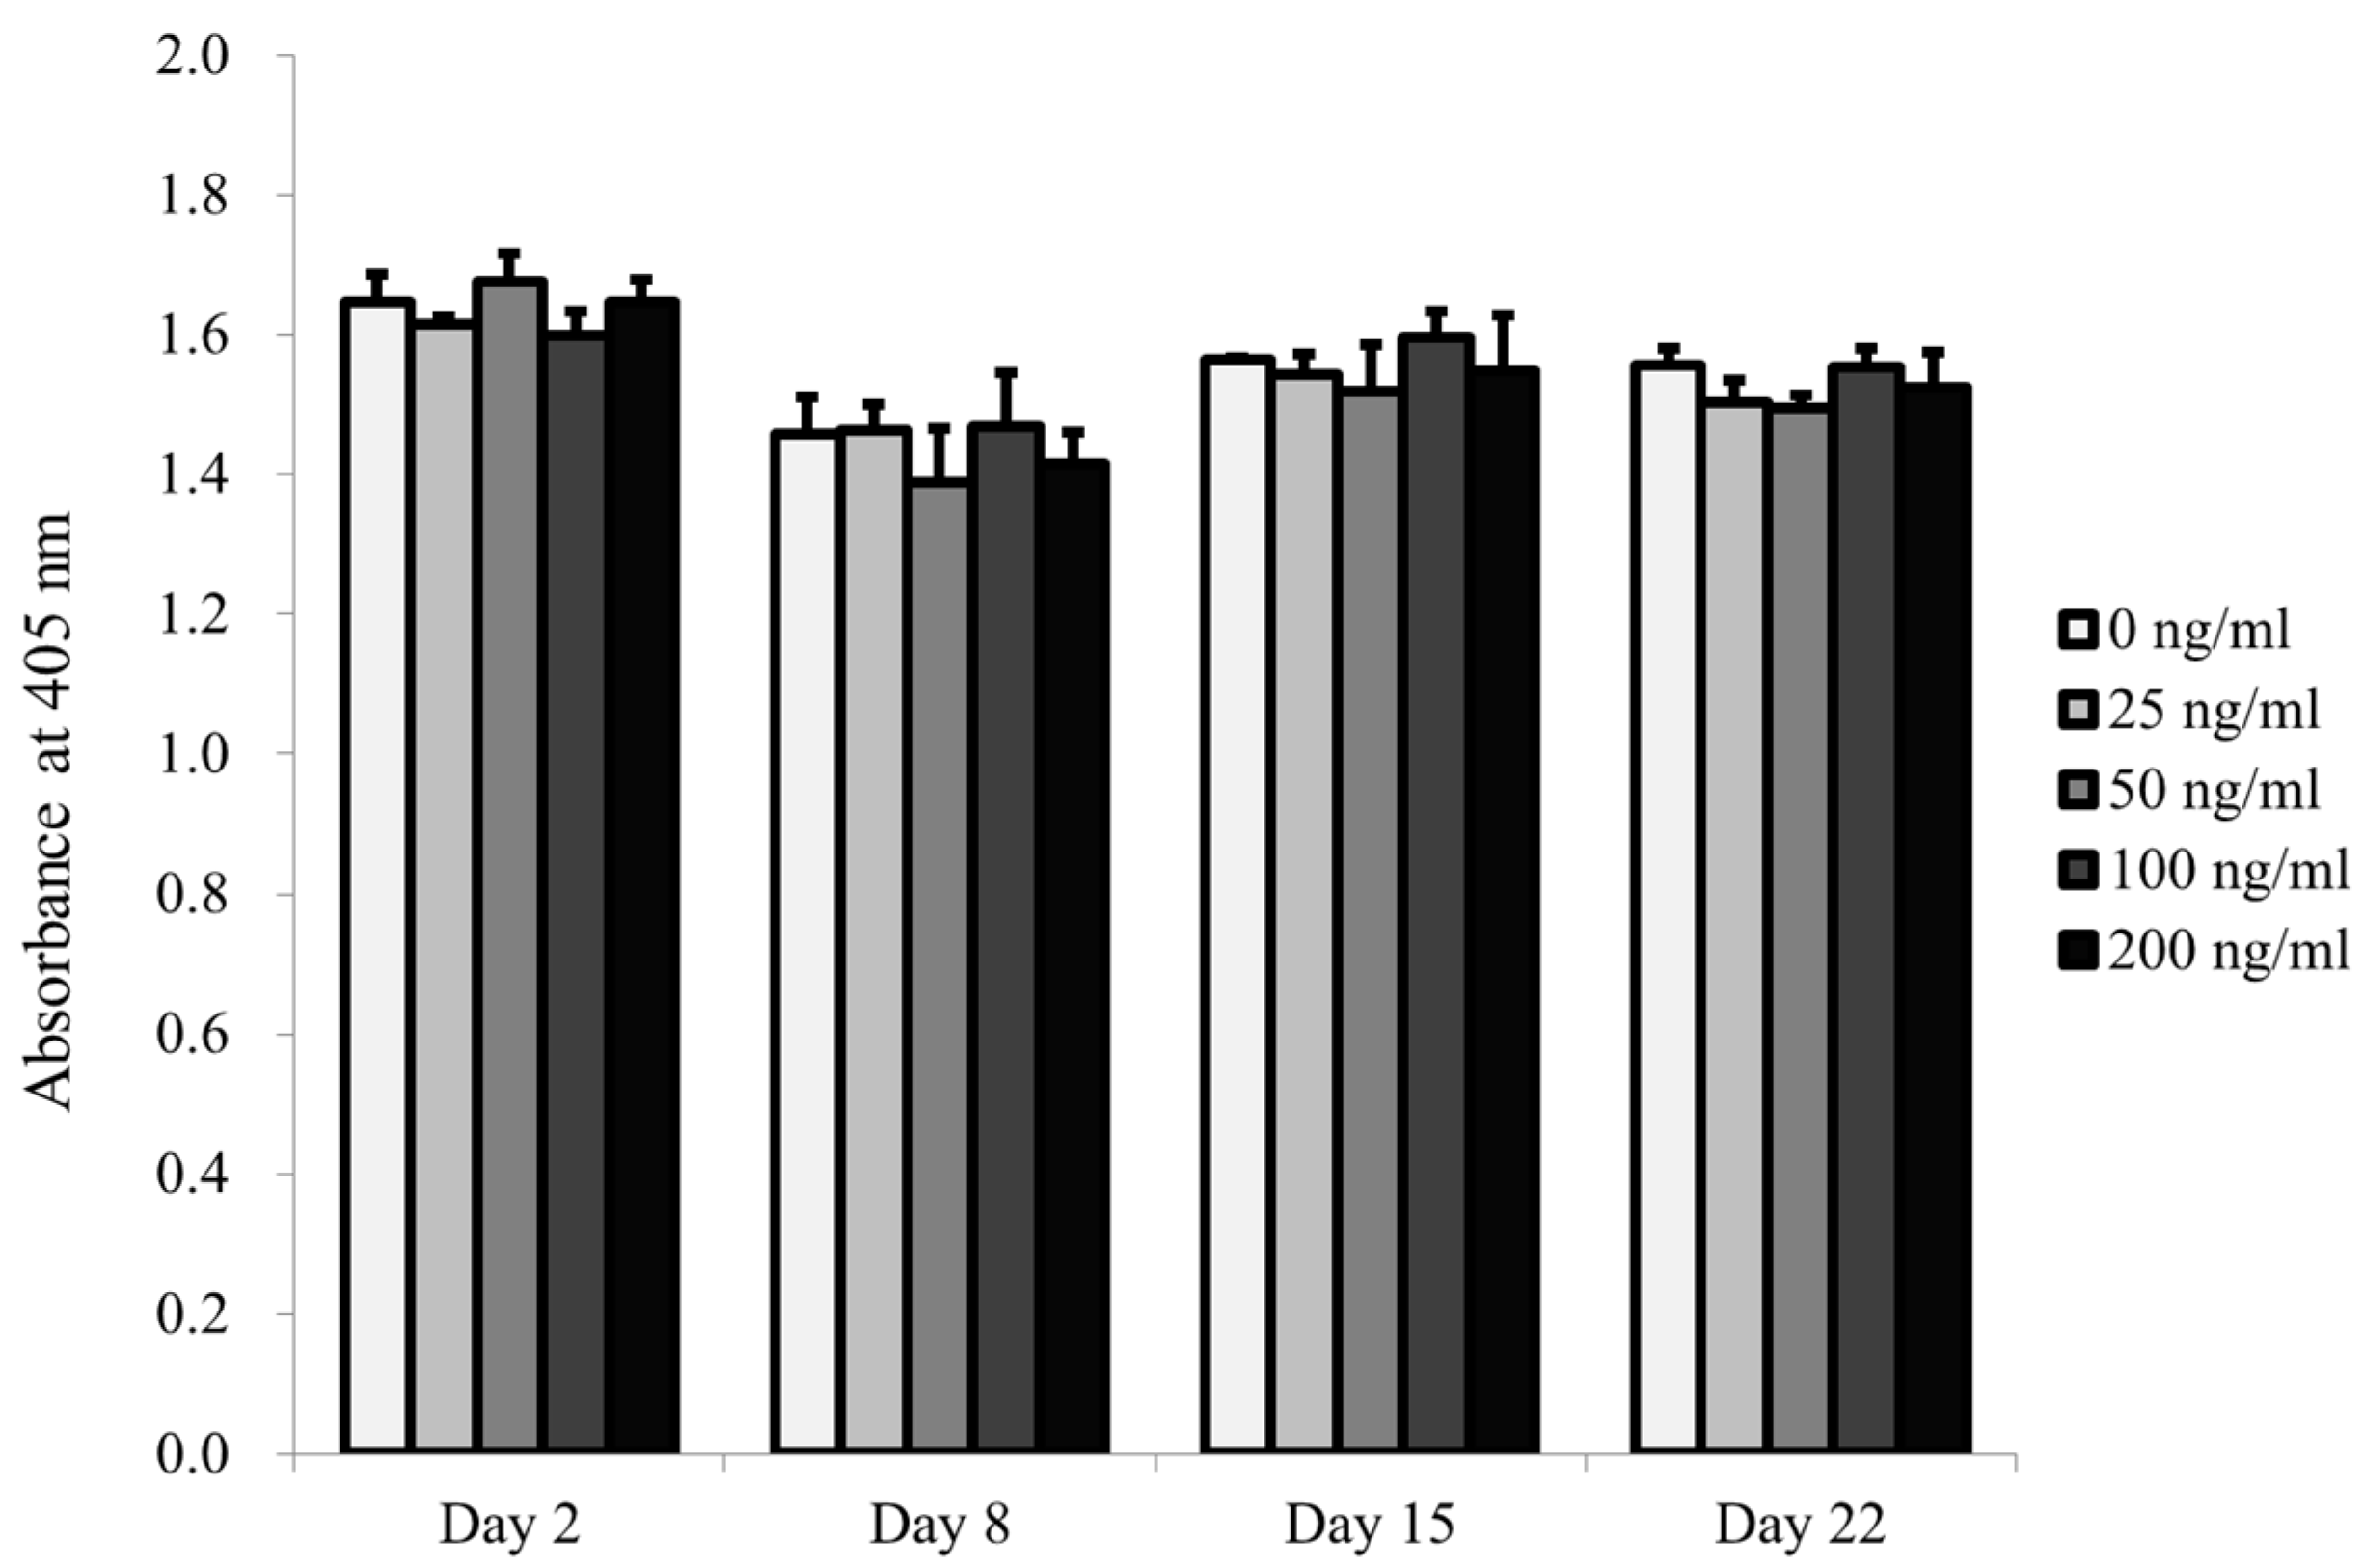
3.2. Qualitative Determination of Cell Viability

Qualitative viability results obtained using a Live/Dead Kit assay are shown in Figure 4. Most cells from the spheroids showed green fluorescence, indicating live cells, on Day 1, with low red fluorescence (Figure 4A). There was no observable change regardless of seven-day incubation period (Figure 4B). The quantitative cellular viability measured with the CCK-8 assay kit showed no significant difference between the groups on Day 1 (Figure 4C). Similar trends were seen between the groups up to Day 7.

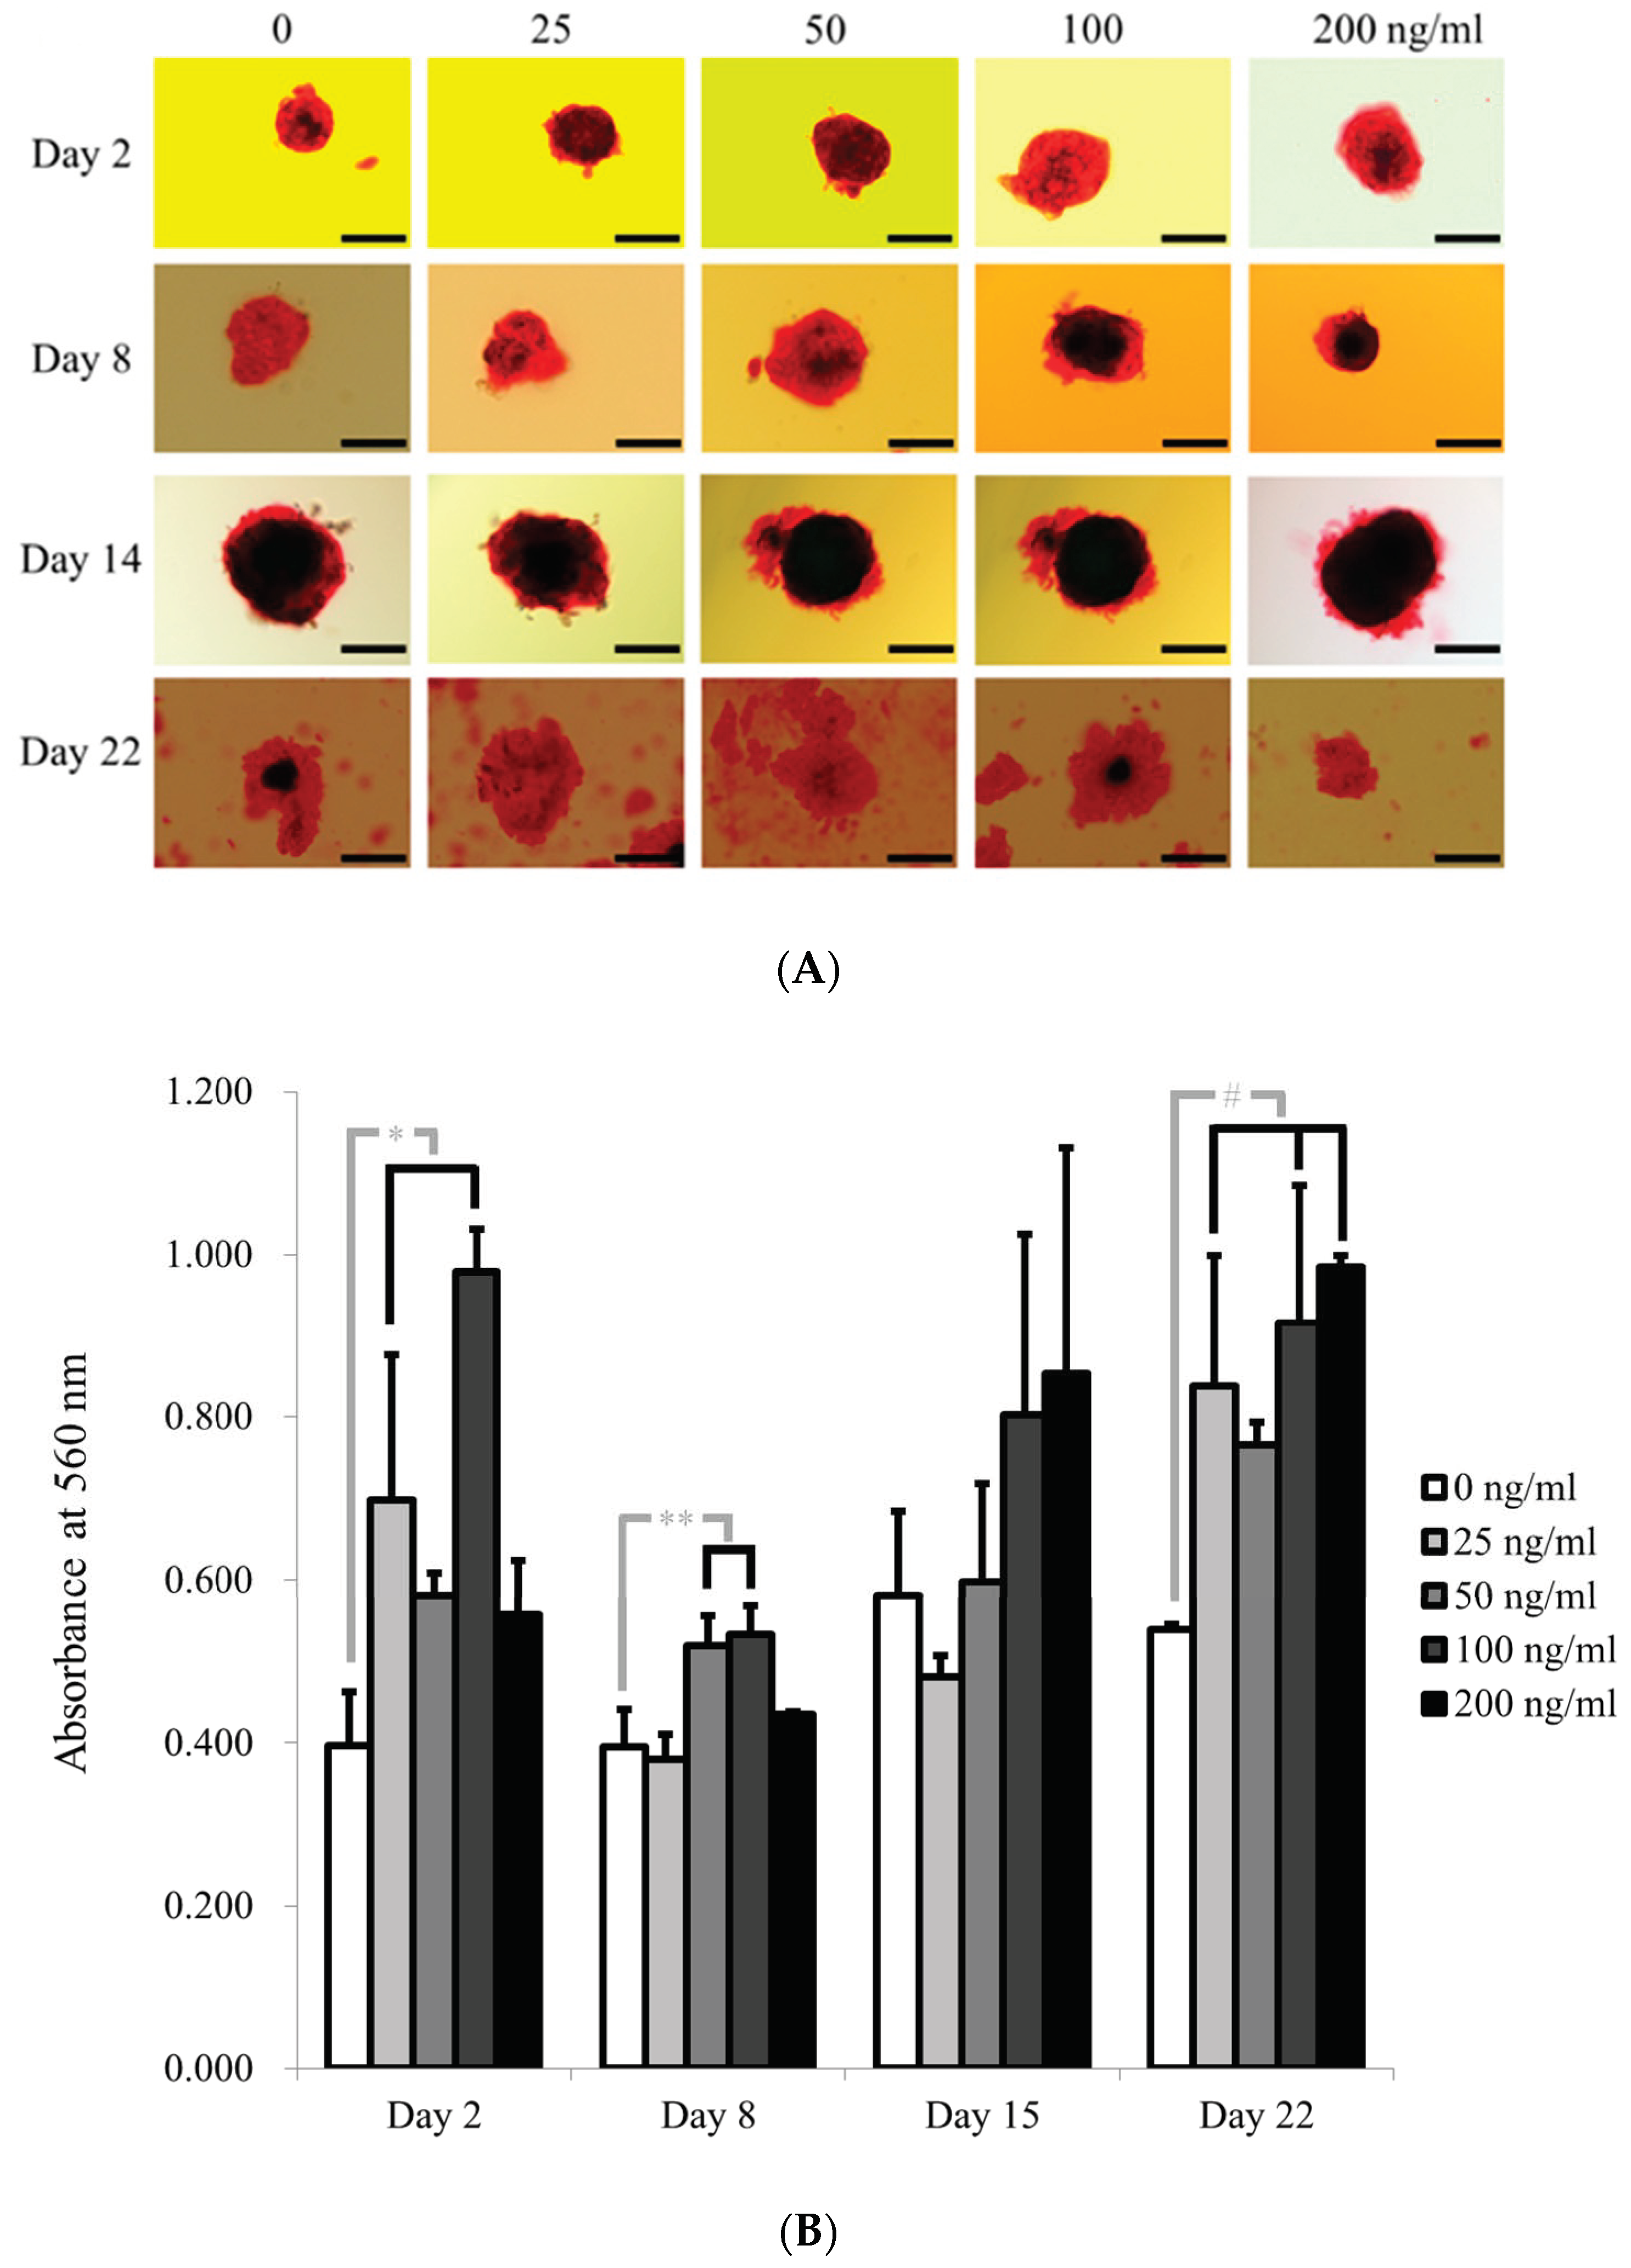
3.3. Evaluation of Alkaline Phosphatase Activity and Alizarin Red S Staining

In general, the application of CTGF did not produce the significant changes of ALP activity between the groups (Figure 5). The results of the mineralization assays on Days 2, 8, 14, and 22 are shown in Figure 6A. The spheroids were well stained with Alizarin Red S. The absorbance values at 560 nm on Days 2, 8, 15, and 22 are shown in Figure 6B. There were significantly higher values for CTGF regarding Alizarin Red S staining at 50 and 100 ng/mL on Day 8, with the highest value at 100 ng/mL compared with the control group (p < 0.05). The highest value of Alizarin Red S staining was seen at 200 ng/mL group compared with the control group on Day 22 (p < 0.05).

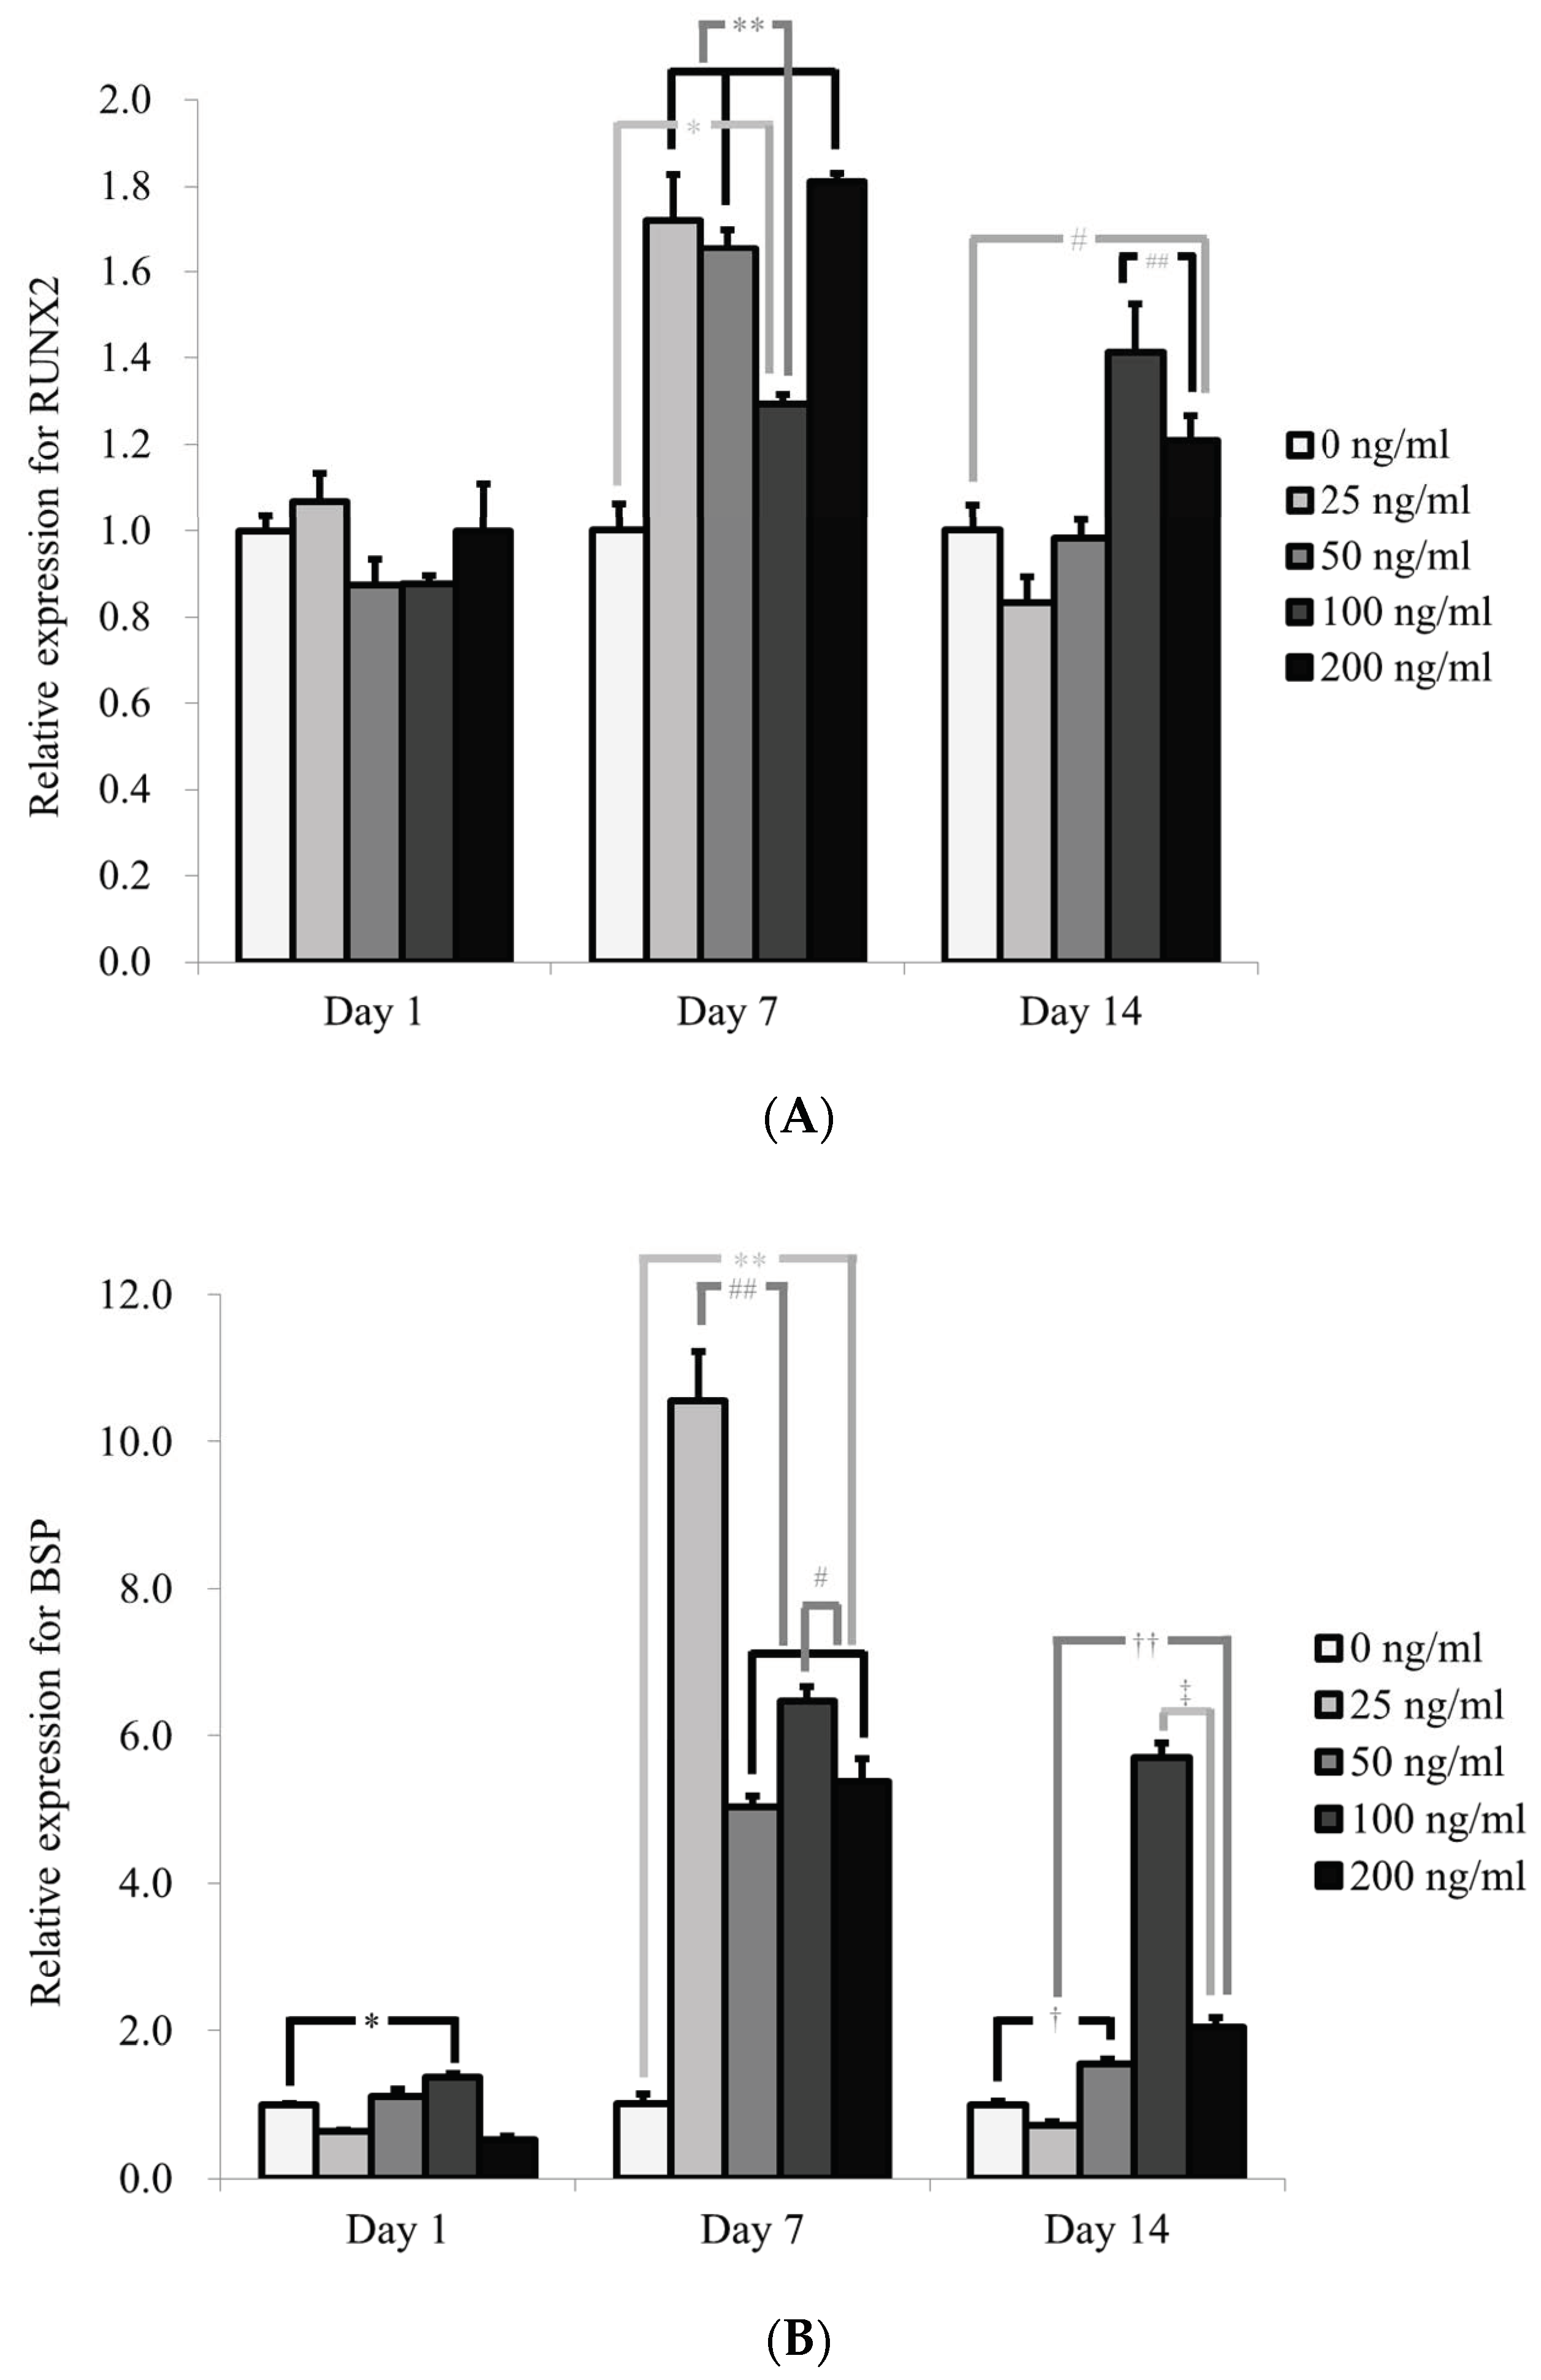
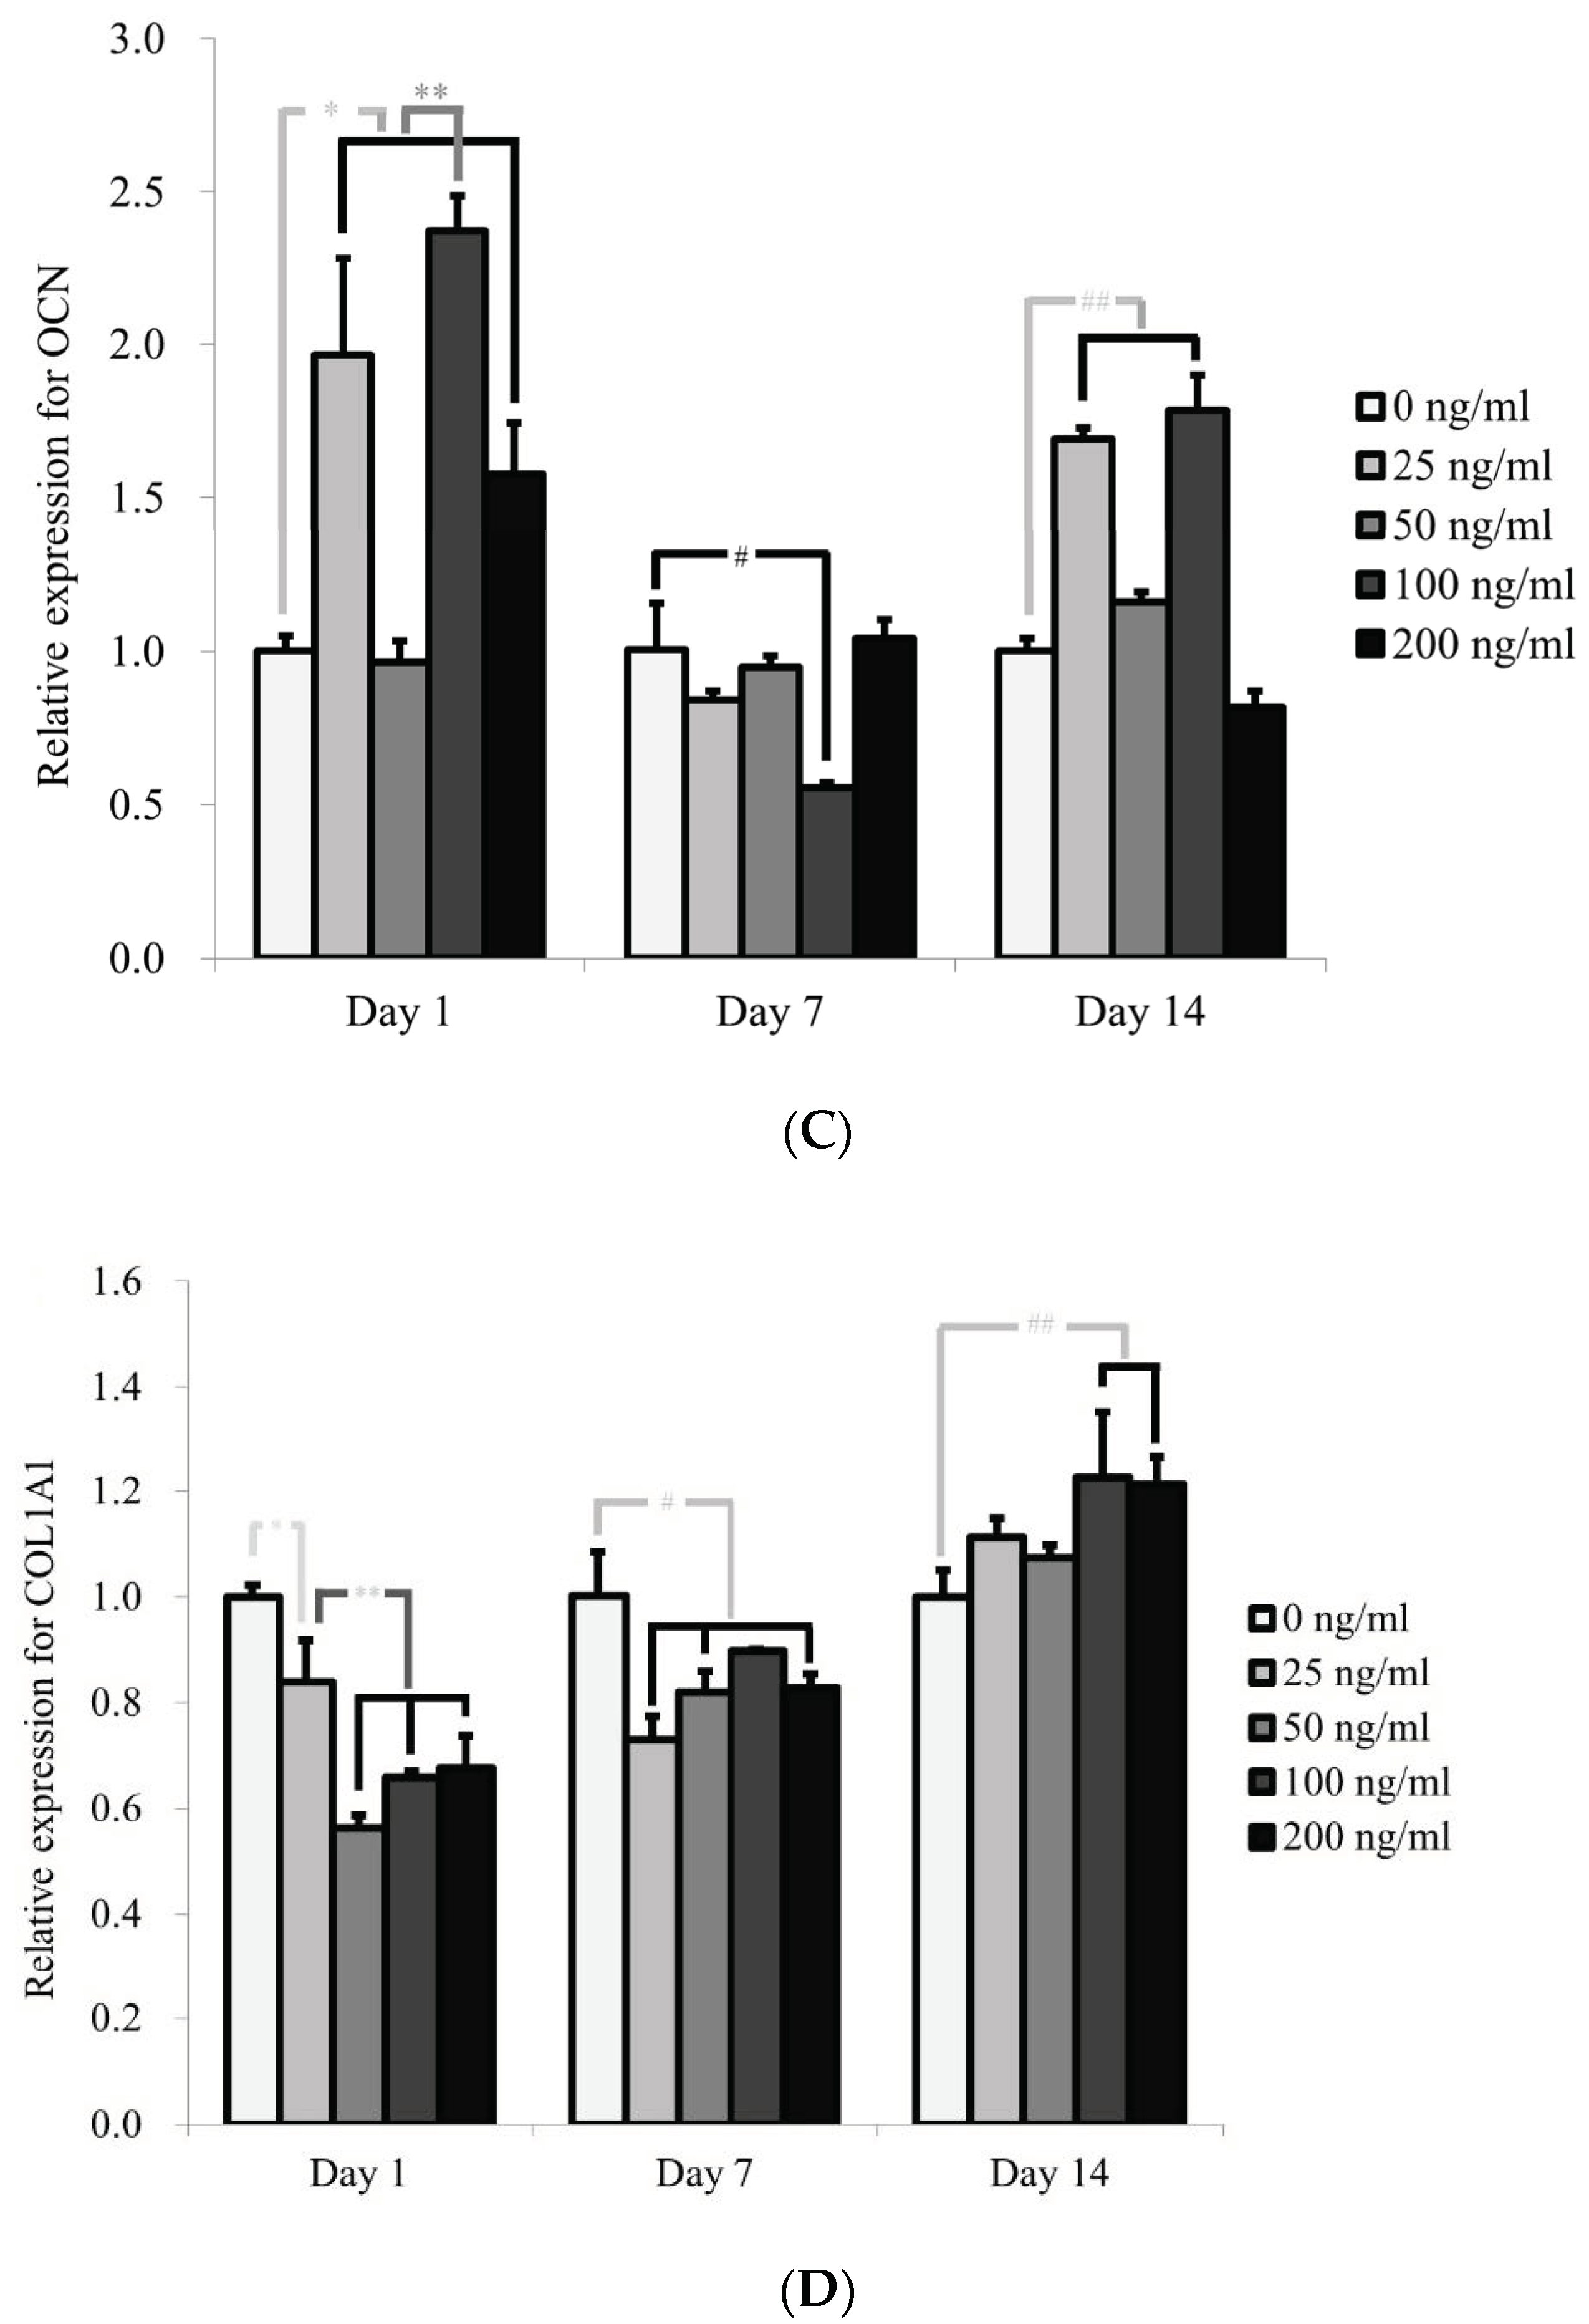
3.4. Evaluation of RUNX2, BSP, OCN, and COL1A1 by qPCR

Generally, the addition of CTGF showed that the mRNA expression levels of RUNX2, BSP, OCN, and COL1A1 were increased at certain time point (Figure 7A–D). The addition of CTGF led to the significant increase of RUNX2 expression on Day 7 (p < 0.05) (Figure 7A). The expression of RUNX2 on Day 7 was highest in 200 ng/mL group. The results on Day 14 showed that a significant increase in RUNX2 expression was shown only in 100 and 200 ng/mL groups when compared with the control group on Day 14 (p < 0.05). RUNX2 expression on Day 14 was highest in 100 ng/mL group. qPCR revealed that the mRNA levels of BSP was significantly increased at 100 ng/mL group at Day 1 (p < 0.05) (Figure 7B). Expressions of BSP on Day 14 were significantly higher in 50, 100, and 200 ng/mL groups compared with control group on Day 14 (p < 0.05). The expression of BSP on Day 14 was highest in 100 ng/mL group. qPCR revealed that the mRNA levels of OCN was significantly increased at 25, 100, and 200 ng/mL group with the highest value at 100 ng/mL on Day 1 (p < 0.05). The mRNA level of OCN on Day 1 and 14 revealed that significant increase was seen at 25 and 100 ng/mL groups with the highest value at 100 ng/mL (p < 0.05). qPCR revealed that the mRNA levels of COL1A1 was significantly increased at 100 and 200 ng/mL group with the highest value at 100 ng/mL on Day 14 (p < 0.05).

4. Discussion

This research examined the effects of CTGF on cellular viability, osteogenic differentiation, and mRNA expression of stem cell spheroids.
The effects of CTGF on various models have been reported previously [8,21,22]. The present study showed no significant difference in cellular viability between the groups. However, in one study, the effects of recombinant CTGF on osteoblast proliferation were evaluated using MTT and BrdU assays (a colorimetric assay used to quantify cell proliferation) on Day 3 after adding different concentrations (1, 10, 50, and 100 ng/mL) of CTGF to rat osteoblasts [8]. The results showed dose-dependent increases in cell number and proliferation. ALP activity is considered to be a relative early marker of osteoblast differentiation [23,24]. In a previous report, the maximal ALP activity of mesenchymal stem cells was achieved at day 7 [25]. This study showed that the application of CTGF led to significant increase in the 200 ng/mL group on Day 1. The previous report evaluated the effects of recombinant CTGF on ALP activity in animal osteoblasts after applying 50 ng/mL for 48 h, resulting in significantly increased activity [8]. Similarly, this study showed a statistically significant increase in Alizarin Red S staining values at 25, 100, and 200 ng/mL. In a previous report, cultures treated with 100 ng/mL recombinant CTGF exhibited a significant increase in calcium deposits on Day 11 [8]. GMSCs showed positive marker expression greater than 90% for CD29, CD44, CD73, CD90, and CD105 at passage 13 and expression greater than 85% at passage 16 [26]. Moreover, GMSCs have the ability to undergo multilineage differentiation when specific culture conditions are used in the third to eighth passages. The differences in cellular viability may be due to the type of culture, type of cells, or culture period [21,22]. Passage number may also influence the results [27].
Various attempts have been made to evaluate or suggest the optimal concentration of CTGF [28,29]. One study found CTGF in 10% of basal tears, with a maximum level of 17 ng/mL [30]. CTGF was detected in the subretinal fluid of all research cases at a mean concentration of 10.1 ± 3.68 ng/mL [28]. Another study evaluated the effects of CTGF on type I collagen transcription in quiescent hepatic stellate cells at concentrations of 10, 50, and 100 ng/mL for 16 and 48 h [29]. Incubation for 16 h did not produce any notable difference, but significant increases in collagen transcription were seen in the 50 and 100 ng/mL CTGF groups after 48 h. In the present study, the highest values were seen at 200 ng/mL for alkaline phosphatase activity and Alizarin Red S staining. qPCR results showed the highest expression of RUNX2, BSP, OCN, and COL1A1 at 100 ng/mL group. Our study shows some similarity pattern of previous report, which evaluated osteogenic capacity of elderly osteoblasts in three-dimensional cultivation. It showed that expression of OCN was in high level on Day 0, which went down and rose again [31].
Expression levels of various genes were tested to evaluate osteogenic capacity, including those of RUNX2, BSP, OCN, and COL1A1 [1,18]. RUNX2 is a widely used biomarker for osteogenic differentiation and is considered an important transcription factor for osteoblasts [32]. BSP is highly expressed in bone and is reported to play a functional role in bone formation [33]. OCN is reported to be a bone-specific marker and is associated with the maturation of osteogenesis [34]. The expression of OCN is indicator of maturation of extracellular matrix [35]. COL1A1 is considered an early marker of osteoblasts, and increased COL1A1 expression was seen with the transition of osteoprogenitor cells to pre-osteoblasts [36]. Moreover, early expression of the COl1A1 is indicates an early stage of maturation [31]. In a previous report, CTGF treatment was found to lead to significant enhancement in the synthesis of collagen I [37]. In the present report, a significant increase was seen in all the groups including RUNX2, BSP, OCN, and COL1A1, and this may suggest the feasibility of CTGF. The results suggest that CTGF enhances the transcription factor and this leads to the increase in the expression of genes involved in osteogenic differentiation. These may lead to higher deposition of calcium deposits, which may be revealed as higher Alizarin red S staining [38].
Many studies have been performed to isolate stem cells from different parts of the human body [11,14]. Stem cells can be isolated from multiple intraoral tissues including the periodontal ligament, dental pulp, alveolar bone, exfoliated deciduous teeth, apical papilla, and gingiva [39,40]. GMSCs can be considered a promising source for tissue engineering because they can be easily obtained under local anesthesia during routine procedures [41]. Moreover, GMSCs exhibit self-renewal and potential for osteogenic, adipogenic, and chondrogenic differentiation with immunomodulatory capacity [14,26,42]. GMSCs can be applied for the treatment of periodontal defects [21,43,44]. Testing stem cells of other origins may expand the applicability of the current approach [45]. Combinatorial approach using synthetic collagen matrix and stem cells can enhance periodontal regeneration [43]. This approach can be applied for the sinus augmentation procedures [46].

5. Conclusions

This research showed that application of CTGF had the tendency to increase the osteogenic differentiation, seen from alkaline phosphatase activity and Alizarin Red S staining and mRNA expression of stem cell spheroids. Conclusively, this research showed that application of CTGF in the tested concentrations increased osteogenic differentiation of stem cell spheroids. It can be suggested that CTGF may be applied along with stem cells in tissue regeneration.

Author Contributions

Conceptualization, A.Z.A., Y.-M.S., S.-K.M., H.-J.L., M.-J.K., Y.-H.P., J.-U.P. and J.-B.P.; methodology, A.Z.A., Y.-M.S., S.-K.M., H.-J.L., M.-J.K., Y.-H.P., J.-U.P. and J.-B.P.; formal analysis, A.Z.A., Y.-M.S., S.-K.M., H.-J.L., M.-J.K., Y.-H.P., J.-U.P. and J.-B.P.; writing—original draft preparation, A.Z.A., Y.-M.S., S.-K.M., H.-J.L., M.-J.K., Y.-H.P., J.-U.P. and J.-B.P.; and writing—review and editing, A.Z.A., Y.-M.S., S.-K.M., H.-J.L., M.-J.K., Y.-H.P., J.-U.P. and J.-B.P. All authors have read and agreed to the published version of the manuscript.

Funding

This study was supported by the National Research Foundation of Korea grant funded by the Korean government (MSIT: Ministry of Science and ICT; grant no. 2020R1A2C4001624).

Institutional Review Board Statement

This study and all the experimental schemes were reviewed and approved (KC19SESI0228; approved date: 17 April 2019) to be performed according to the relevant guidelines.

Informed Consent Statement

Written informed consent has been obtained from the participant.

Data Availability Statement

All data analyzed during this study are included in this published article.

Conflicts of Interest

The authors do not have any conflict of interest to declare.

References

  1. Lee, H.; Min, S.K.; Song, Y.; Park, Y.H.; Park, J.B. Bone morphogenetic protein-7 upregulates genes associated with osteoblast differentiation, including collagen I, Sp7 and IBSP in gingiva-derived stem cells. Exp. Ther. Med. 2019, 18, 2867–2876. [Google Scholar] [CrossRef]
  2. Lee, H.; Lee, S.I.; Ko, Y.; Park, J.B. Evaluation of the secretion and release of vascular endothelial growth factor from two-dimensional culture and three-dimensional cell spheroids formed with stem cells and osteoprecursor cells. Adv. Clin. Exp. Med. 2018, 27, 971–977. [Google Scholar] [CrossRef]
  3. Lee, H.; Park, J.B. Evaluation of the effects of dimethylsulphoxide on morphology, cellular viability, mRNA, and protein expression of stem cells culture in growth media. Biomed. Rep. 2017, 7, 291–296. [Google Scholar] [CrossRef] [Green Version]
  4. Son, J.; Tae, J.Y.; Min, S.K.; Ko, Y.; Park, J.B. Fibroblast growth factor-4 maintains cellular viability while enhancing osteogenic differentiation of stem cell spheroids in part by regulating RUNX2 and BGLAP expression. Exp. Therap. Med. 2020, 20, 2013–2020. [Google Scholar] [CrossRef]
  5. Chen, X.; Chen, Y.; Hou, Y.; Song, P.; Zhou, M.; Nie, M.; Liu, X. Modulation of proliferation and differentiation of gingiva-derived mesenchymal stem cells by concentrated growth factors: Potential implications in tissue engineering for dental regeneration and repair. Int. J. Mol. Med. 2019, 44, 37–46. [Google Scholar] [CrossRef] [PubMed]
  6. Mundy, C.; Gannon, M.; Popoff, S.N. Connective tissue growth factor (CTGF/CCN2) negatively regulates BMP-2 induced osteoblast differentiation and signaling. J. Cell. Physiol. 2014, 229, 672–681. [Google Scholar] [CrossRef] [PubMed] [Green Version]
  7. Kanaan, R.A.; Aldwaik, M.; Al-Hanbali, O.A. The role of connective tissue growth factor in skeletal growth and development. Med. Sci. Monit. 2006, 12, Ra277–Ra281. [Google Scholar]
  8. Safadi, F.F.; Xu, J.; Smock, S.L.; Kanaan, R.A.; Selim, A.H.; Odgren, P.R.; Marks, S.C., Jr.; Owen, T.A.; Popoff, S.N. Expression of connective tissue growth factor in bone: Its role in osteoblast proliferation and differentiation in vitro and bone formation in vivo. J. Cell Physiol. 2003, 196, 51–62. [Google Scholar] [CrossRef] [PubMed]
  9. Choi, Y.; Yoo, J.H.; Lee, J.H.; Lee, Y.; Bae, M.K.; Kim, Y.D.; Kim, H.J. Connective tissue growth factor (CTGF) regulates the fusion of osteoclast precursors by inhibiting Bcl6 in periodontitis. Int. J. Med. Sci. 2020, 17, 647–656. [Google Scholar] [CrossRef] [Green Version]
  10. Smerdel-Ramoya, A.; Zanotti, S.; Stadmeyer, L.; Durant, D.; Canalis, E. Skeletal overexpression of connective tissue growth factor impairs bone formation and causes osteopenia. Endocrinology 2008, 149, 4374–4381. [Google Scholar] [CrossRef] [Green Version]
  11. Han, Y.; Li, X.; Zhang, Y.; Han, Y.; Chang, F.; Ding, J. Mesenchymal Stem Cells for Regenerative Medicine. Cells 2019, 8, 886. [Google Scholar] [CrossRef] [Green Version]
  12. Lee, H.; Min, S.K.; Park, J.B. Effects of demographic factors on adipogenic and chondrogenic differentiation in bone marrow-derived stem cells. Exp. Ther. Med. 2019, 17, 3548–3554. [Google Scholar] [CrossRef] [Green Version]
  13. Ryu, N.E.; Lee, S.H.; Park, H. Spheroid Culture System Methods and Applications for Mesenchymal Stem Cells. Cells 2019, 8, 1620. [Google Scholar] [CrossRef] [PubMed] [Green Version]
  14. Jin, S.H.; Lee, J.E.; Yun, J.H.; Kim, I.; Ko, Y.; Park, J.B. Isolation and characterization of human mesenchymal stem cells from gingival connective tissue. J. Period. Res. 2015, 50, 461–467. [Google Scholar] [CrossRef]
  15. Lee, S.I.; Yeo, S.I.; Kim, B.B.; Ko, Y.; Park, J.B. Formation of size-controllable spheroids using gingiva-derived stem cells and concave microwells: Morphology and viability tests. Biomed. Rep. 2016, 4, 97–101. [Google Scholar] [CrossRef] [Green Version]
  16. Tae, J.Y.; Ko, Y.; Park, J.B. Evaluation of fibroblast growth factor-2 on the proliferation of osteogenic potential and protein expression of stem cell spheroids composed of stem cells derived from bone marrow. Exp. Ther. Med. 2019, 18, 326–331. [Google Scholar] [CrossRef]
  17. Lee, H.; Lee, H.; Na, C.B.; Park, J.B. The effects of simvastatin on cellular viability, stemness and osteogenic differentiation using 3-dimensional cultures of stem cells and osteoblast-like cells. Adv. Clin. Exp. Med. Off. Organ Wroclaw Med. Univ. 2019, 28, 699–706. [Google Scholar] [CrossRef]
  18. Min, S.K.; Kim, M.; Park, J.B. Bone morphogenetic protein 2-enhanced osteogenic differentiation of stem cell spheres by regulation of Runx2 expression. Exp. Ther. Med. 2020, 20, 79. [Google Scholar] [CrossRef] [PubMed]
  19. Tae, J.-Y.; Park, Y.-H.; Ko, Y.; Park, J.-B. The Effects of Bone Morphogenetic Protein-4 on Cellular Viability, Osteogenic Potential, and Global Gene Expression on Gingiva-Derived Stem Cell Spheroids. Coatings 2020, 10, 1055. [Google Scholar] [CrossRef]
  20. Lee, H.-J.; Min, S.-K.; Park, Y.-H.; Park, J.-B. Application of Bone Morphogenetic Protein 7 Enhanced the Osteogenic Differentiation and Mineralization of Bone Marrow-Derived Stem Cells Cultured on Deproteinized Bovine Bone. Coatings 2021, 11, 642. [Google Scholar] [CrossRef]
  21. Kang, S.H.; Park, J.B.; Kim, I.; Lee, W.; Kim, H. Assessment of stem cell viability in the initial healing period in rabbits with a cranial bone defect according to the type and form of scaffold. J. Period. Implant Sci. 2019, 49, 258–267. [Google Scholar] [CrossRef] [PubMed]
  22. Lee, H.; Son, J.; Yi, G.; Koo, H.; Park, J.B. Cellular viability and osteogenic differentiation potential of human gingiva-derived stem cells in 2D culture following treatment with anionic, cationic, and neutral liposomes containing doxorubicin. Exp. Ther. Med. 2018, 16, 4457–4462. [Google Scholar] [CrossRef] [PubMed] [Green Version]
  23. Wrobel, E.; Leszczynska, J.; Brzoska, E. The Characteristics Of Human Bone-Derived Cells (HBDCS) during osteogenesis in vitro. Cellul. Mol. Biol. Lett. 2016, 21, 26. [Google Scholar] [CrossRef] [Green Version]
  24. Kim, J.E.; Kim, T.G.; Lee, Y.H.; Yi, H.K. Phelligridin D maintains the function of periodontal ligament cells through autophagy in glucose-induced oxidative stress. J. Period. Implant Sci. 2020, 50, 291–302. [Google Scholar] [CrossRef]
  25. Tsai, M.T.; Li, W.J.; Tuan, R.S.; Chang, W.H. Modulation of osteogenesis in human mesenchymal stem cells by specific pulsed electromagnetic field stimulation. J. Orthop. Res. Off. Publ. Orthop. Res. Soc. 2009, 27, 1169–1174. [Google Scholar] [CrossRef] [PubMed] [Green Version]
  26. Tomar, G.B.; Srivastava, R.K.; Gupta, N.; Barhanpurkar, A.P.; Pote, S.T.; Jhaveri, H.M.; Mishra, G.C.; Wani, M.R. Human gingiva-derived mesenchymal stem cells are superior to bone marrow-derived mesenchymal stem cells for cell therapy in regenerative medicine. Biochem. Biophys. Res. Commun. 2010, 393, 377–383. [Google Scholar] [CrossRef] [PubMed]
  27. Mohammadi Farsani, T.; Motevaseli, E.; Neyazi, N.; Khorramizadeh, M.R.; Zafarvahedian, E.; Ghahremani, M.H. Effect of Passage Number and Culture Time on the Expression and Activity of Insulin-Degrading Enzyme in Caco-2 Cells. Ir. Biomed. J. 2018, 22, 70–75. [Google Scholar] [CrossRef]
  28. van Setten, G.; Berglin, L.; Blalock, T.D.; Schultz, G. Detection of connective tissue growth factor in subretinal Fluid following retinal detachment: Possible contribution to subretinal scar formation, preliminary results. Ophth. Res. 2005, 37, 289–292. [Google Scholar] [CrossRef]
  29. Paradis, V.; Dargere, D.; Bonvoust, F.; Vidaud, M.; Segarini, P.; Bedossa, P. Effects and regulation of connective tissue growth factor on hepatic stellate cells. Lab. Investig. J. Tech. Methods Pathol. 2002, 82, 767–774. [Google Scholar] [CrossRef] [PubMed] [Green Version]
  30. van Setten, G.B.; Blalock, T.D.; Grotendorst, G.; Schultz, G.S. Detection of connective tissue growth factor (CTGF) in human tear fluid: Preliminary results. Acta Ophthalmol. Scand. 2003, 81, 51–53. [Google Scholar] [CrossRef]
  31. Payr, S.; Rosado-Balmayor, E.; Tiefenboeck, T.; Schuseil, T.; Unger, M.; Seeliger, C.; van Griensven, M. Direct comparison of 3D and 2D cultivation reveals higher osteogenic capacity of elderly osteoblasts in 3D. J. Orthop. Surg. Res. 2021, 16, 13. [Google Scholar] [CrossRef]
  32. Lv, H.; Yang, H.; Wang, Y. Effects of miR-103 by negatively regulating SATB2 on proliferation and osteogenic differentiation of human bone marrow mesenchymal stem cells. PLoS ONE 2020, 15, e0232695. [Google Scholar] [CrossRef] [PubMed]
  33. Malaval, L.; Wade-Guéye, N.M.; Boudiffa, M.; Fei, J.; Zirngibl, R.; Chen, F.; Laroche, N.; Roux, J.P.; Burt-Pichat, B.; Duboeuf, F.; et al. Bone sialoprotein plays a functional role in bone formation and osteoclastogenesis. J. Exp. Med. 2008, 205, 1145–1153. [Google Scholar] [CrossRef] [PubMed] [Green Version]
  34. Lee, H.; Song, Y.; Park, Y.H.; Uddin, M.S.; Park, J.B. Evaluation of the Effects of Cuminum cyminum on Cellular Viability, Osteogenic Differentiation and Mineralization of Human Bone Marrow-Derived Stem Cells. Med. Kaunas Lith. 2021, 57, 38. [Google Scholar] [CrossRef]
  35. Murphy, C.M.; Duffy, G.P.; Schindeler, A.; O’Brien F, J. Effect of collagen-glycosaminoglycan scaffold pore size on matrix mineralization and cellular behavior in different cell types. J. Biomed. Mater. Res. Part A 2016, 104, 291–304. [Google Scholar] [CrossRef]
  36. Köllmer, M.; Buhrman, J.S.; Zhang, Y.; Gemeinhart, R.A. Markers Are Shared Between Adipogenic and Osteogenic Differentiated Mesenchymal Stem Cells. J. Dev. Biol. Tissue Eng. 2013, 5, 18–25. [Google Scholar] [CrossRef] [PubMed]
  37. Tong, Z.; Zerdoum, A.B.; Duncan, R.L.; Jia, X. Dynamic vibration cooperates with connective tissue growth factor to modulate stem cell behaviors. Tissue Eng. Part A 2014, 20, 1922–1934. [Google Scholar] [CrossRef] [Green Version]
  38. Lee, H.; Min, S.K.; Park, Y.-H.; Park, J.-B. The Role of Insulin-Like Growth Factor-2 on the Cellular Viability and Differentiation to the Osteogenic Lineage and Mineralization of Stem Cells Cultured on Deproteinized Bovine Bone Mineral. Appl. Sci. 2020, 10, 5471. [Google Scholar] [CrossRef]
  39. Liu, J.; Yu, F.; Sun, Y.; Jiang, B.; Zhang, W.; Yang, J.; Xu, G.T.; Liang, A.; Liu, S. Concise reviews: Characteristics and potential applications of human dental tissue-derived mesenchymal stem cells. Stem Cells 2015, 33, 627–638. [Google Scholar] [CrossRef]
  40. Ramírez-Rámiz, A.; Brunet, L.L.; Lahor-Soler, E.; Miranda-Rius, J. On the Cellular and Molecular Mechanisms of Drug-Induced Gingival Overgrowth. Open Dent. J. 2017, 11, 420–435. [Google Scholar] [CrossRef] [Green Version]
  41. Kim, B.B.; Tae, J.Y.; Ko, Y.; Park, J.B. Lovastatin increases the proliferation and osteoblastic differentiation of human gingiva-derived stem cells in three-dimensional cultures. Exp. Therap. Med. 2019, 18, 3425–3430. [Google Scholar] [CrossRef] [Green Version]
  42. Mitrano, T.I.; Grob, M.S.; Carrión, F.; Nova-Lamperti, E.; Luz, P.A.; Fierro, F.S.; Quintero, A.; Chaparro, A.; Sanz, A. Culture and characterization of mesenchymal stem cells from human gingival tissue. J. Periodontol. 2010, 81, 917–925. [Google Scholar] [CrossRef] [Green Version]
  43. Yoo, S.Y.; Lee, J.S.; Cha, J.K.; Kim, S.K.; Kim, C.S. Periodontal healing using a collagen matrix with periodontal ligament progenitor cells in a dehiscence defect model in beagle dogs. J. Period. Implant Sci. 2019, 49, 215–227. [Google Scholar] [CrossRef] [PubMed]
  44. Ahmad, N.; Tewari, S.; Narula, S.C.; Sharma, R.K.; Tanwar, N. Platelet-rich fibrin along with a modified minimally invasive surgical technique for the treatment of intrabony defects: A randomized clinical trial. J. Period. Implant Sci. 2019, 49, 355–365. [Google Scholar] [CrossRef] [PubMed]
  45. Nancarrow-Lei, R.; Mafi, P.; Mafi, R.; Khan, W. A Systemic Review of Adult Mesenchymal Stem Cell Sources and their Multilineage Differentiation Potential Relevant to Musculoskeletal Tissue Repair and Regeneration. Curr. Stem Cell Res. Ther. 2017, 12, 601–610. [Google Scholar] [CrossRef]
  46. Hwang, J.H.; Oh, S.; Kim, S. Improvement of the osteogenic potential of ErhBMP-2-/EGCG-coated biphasic calcium phosphate bone substitute: In vitro and in vivo activity. J. Period. Implant Sci. 2019, 49, 114–126. [Google Scholar] [CrossRef]
Figure 1. Study flow diagram illustrating the overview.
Applsci 11 06572 g001
Figure 2. The morphologies of stem cell spheroids treated with different concentrations of CTGF on Days 1, 3, 5, and 7. The scale bar represents 200 μm (original magnification ×100). No significant changes were seen in the morphology of cell spheroids with addition of CTGF.
Applsci 11 06572 g002
Figure 3. The diameters of the stem cell spheroids on Days 1, 4, and 7. p > 0.05 between time-matched groups.
Applsci 11 06572 g003
Figure 4. (A) Live, dead, and merged cell images of stem cell spheroids on Day 1. The scale bar represents 100 μm (original magnification ×200). (B) Live, dead, and merged cell images of stem cell spheroids on Day 7 with the length of the scale of 100 μm. (C) Cell viability using Cell Counting Kit-8 on Days 1, 4, and 7. * p < 0.05 vs. time-matched 0 ng/mL group.
Applsci 11 06572 g004aApplsci 11 06572 g004b
Figure 5. Graphical representation of alkaline phosphatase activity results on Days 2, 8, 15, and 22.
Applsci 11 06572 g005
Figure 6. (A) Alizarin Red S staining on Days 2, 8, 14, and 22 with the length of the scale of 200 μm. (B) Quantification results of Alizarin Red S staining on Days 2, 8, 15 and 22. * p < 0.05 vs. the 0 ng/mL group on Day 2. ** p < 0.05 vs. the 0 ng/mL group on Day 8. # p < 0.05 vs. the 0 ng/mL group on Day 22.
Applsci 11 06572 g006
Figure 7. (A) Quantification of expression of RUNX2 mRNA by real-time polymerase chain reaction on Days 1, 7, and 14. * p < 0.05 vs. the 0 ng/mL group on Day 7. ** p < 0.05 vs. the 100 ng/mL group on Day 7. # p < 0.05 vs. the 0 ng/mL group on Day 14. ## p < 0.05 vs. the 200 ng/mL group on Day 14. (B) Quantification of expression of BSP mRNA by real-time polymerase chain reaction on Days 1, 7, and 14. * p < 0.05 vs. the 0 ng/mL group on Day 1. ** p < 0.05 vs. the 0 ng/mL group on Day 7. # p < 0.05 vs. the 100 ng/mL group on Day 7. ## p < 0.05 vs. the 25 ng/mL group on Day 7.  p < 0.05 vs. the 0 ng/mL group on Day 14. †† p < 0.05 vs. the 200 ng/mL group on Day 14.  p < 0.05 vs. the 100 ng/mL group on Day 14. (C) Quantification of expression of OCN mRNA by real-time polymerase chain reaction on Days 1, 7, and 14. * p < 0.05 vs. the 0 ng/mL group on Day 1. ** p < 0.05 vs. the 100 ng/mL group on Day 7. # p < 0.05 vs. the 0 ng/mL group on Day 7. ## p < 0.05 vs. the 0 ng/mL group on Day 14. (D) Quantification of expression of COL1A1 mRNA by real-time polymerase chain reaction on Days 1, 7, and 14. * p < 0.05 vs. the 0 ng/mL group on Day 1. ** p < 0.05 vs. the 25 ng/mL group on Day 7. # p < 0.05 vs. the 0 ng/mL group on Day 7. ## p < 0.05 vs. the 0 ng/mL group on Day 14.
Applsci 11 06572 g007aApplsci 11 06572 g007b
Publisher’s Note: MDPI stays neutral with regard to jurisdictional claims in published maps and institutional affiliations.

