
The Temporal and Spatial Variation of Arthropod Associations Inhabiting Non-Crop Vegetation in a Sisal Crop, Agave sisalana in the Caatinga Biome


 , ,
, , 
Abstract
1. Introduction
2. Materials and Methods
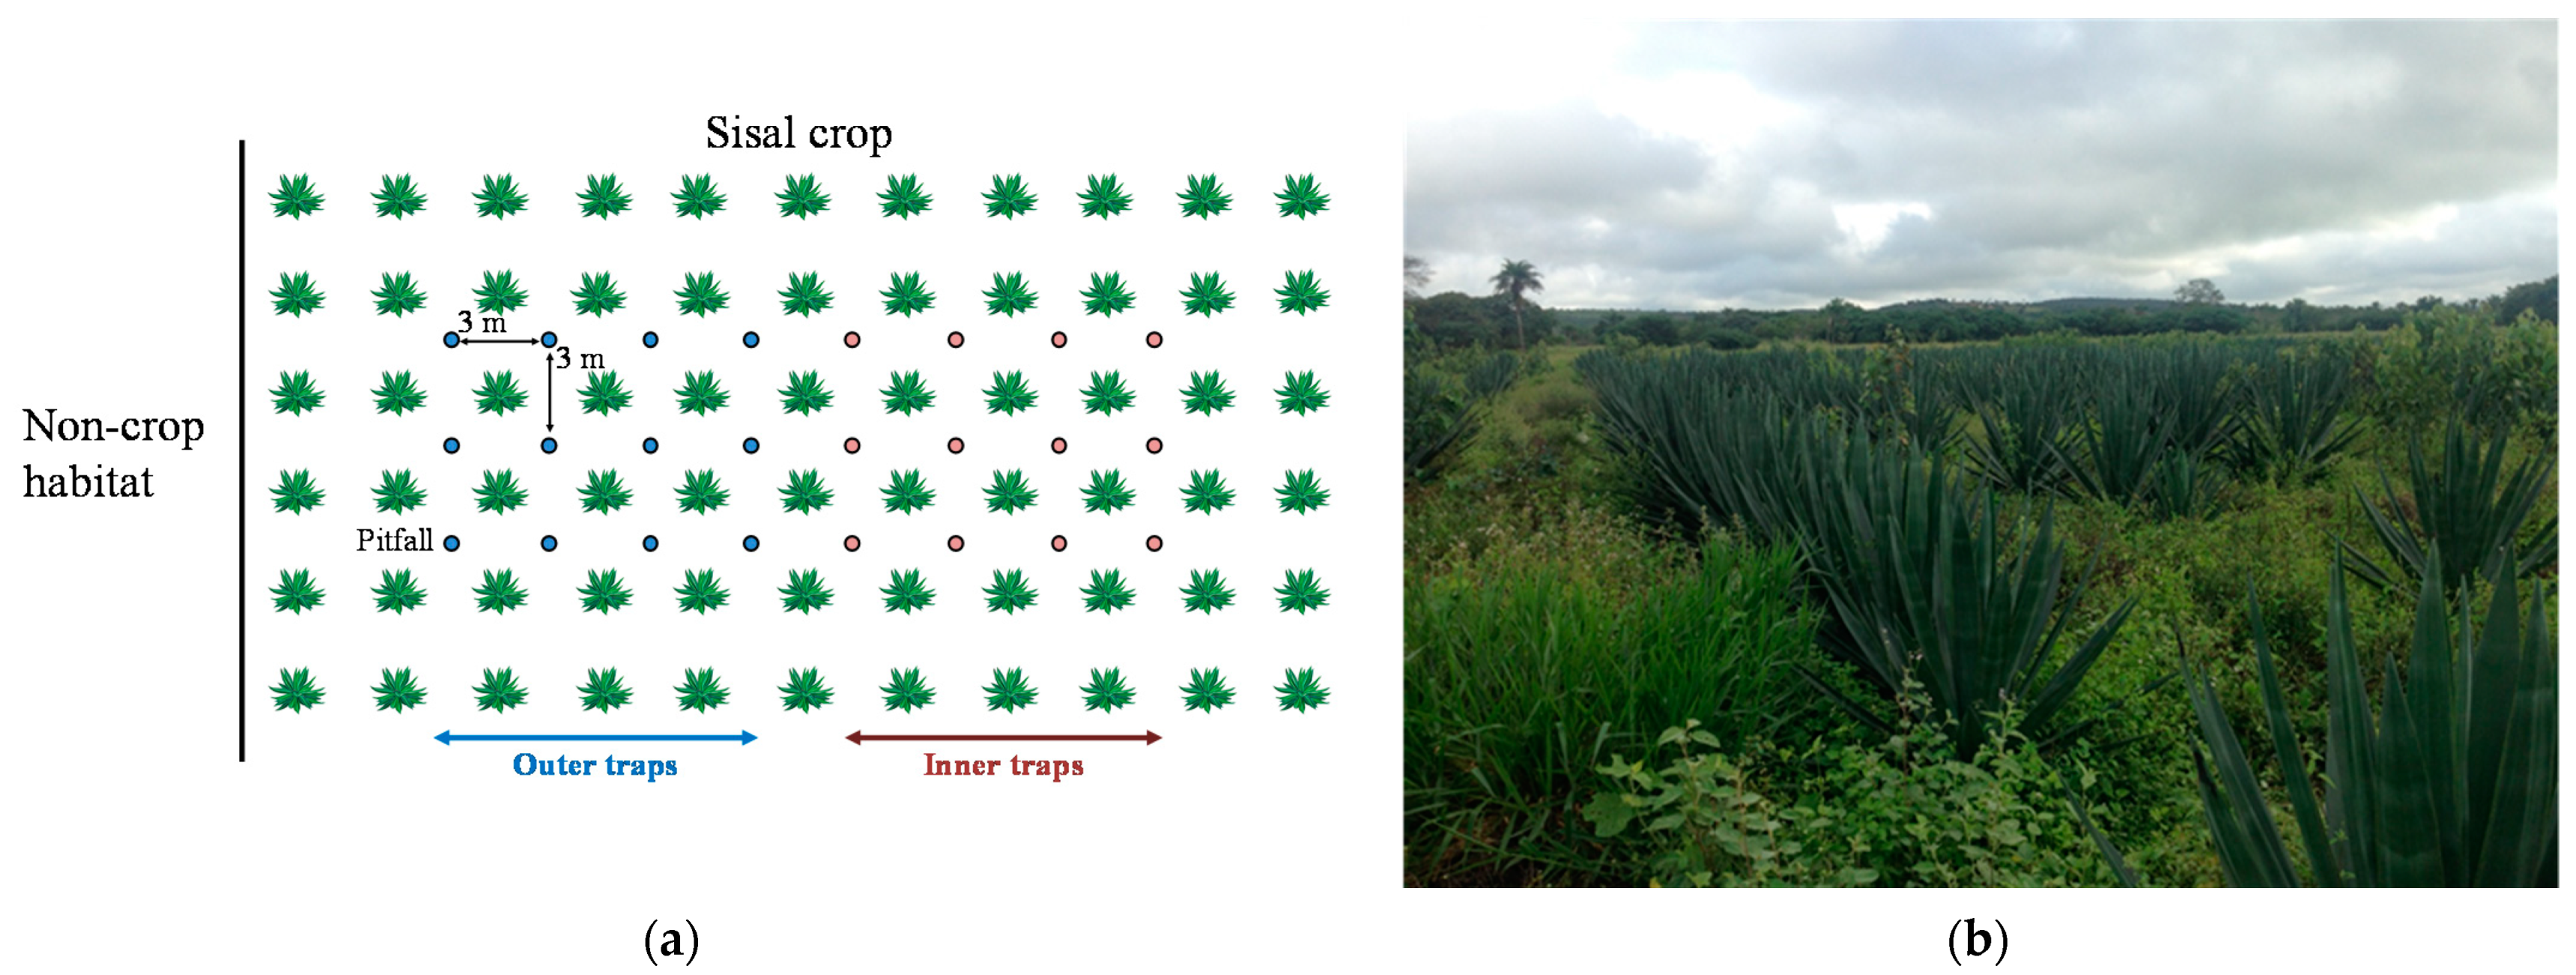
2.1. Study Area
2.2. Arthropods and Plants Sampling
2.3. Data Analysis
2.3.1. Arthropods and Plants Diversity
2.3.2. Analysis of Differences between Outer and Inner Samples
2.3.3. Sampling Protocol
3. Results and Discussion
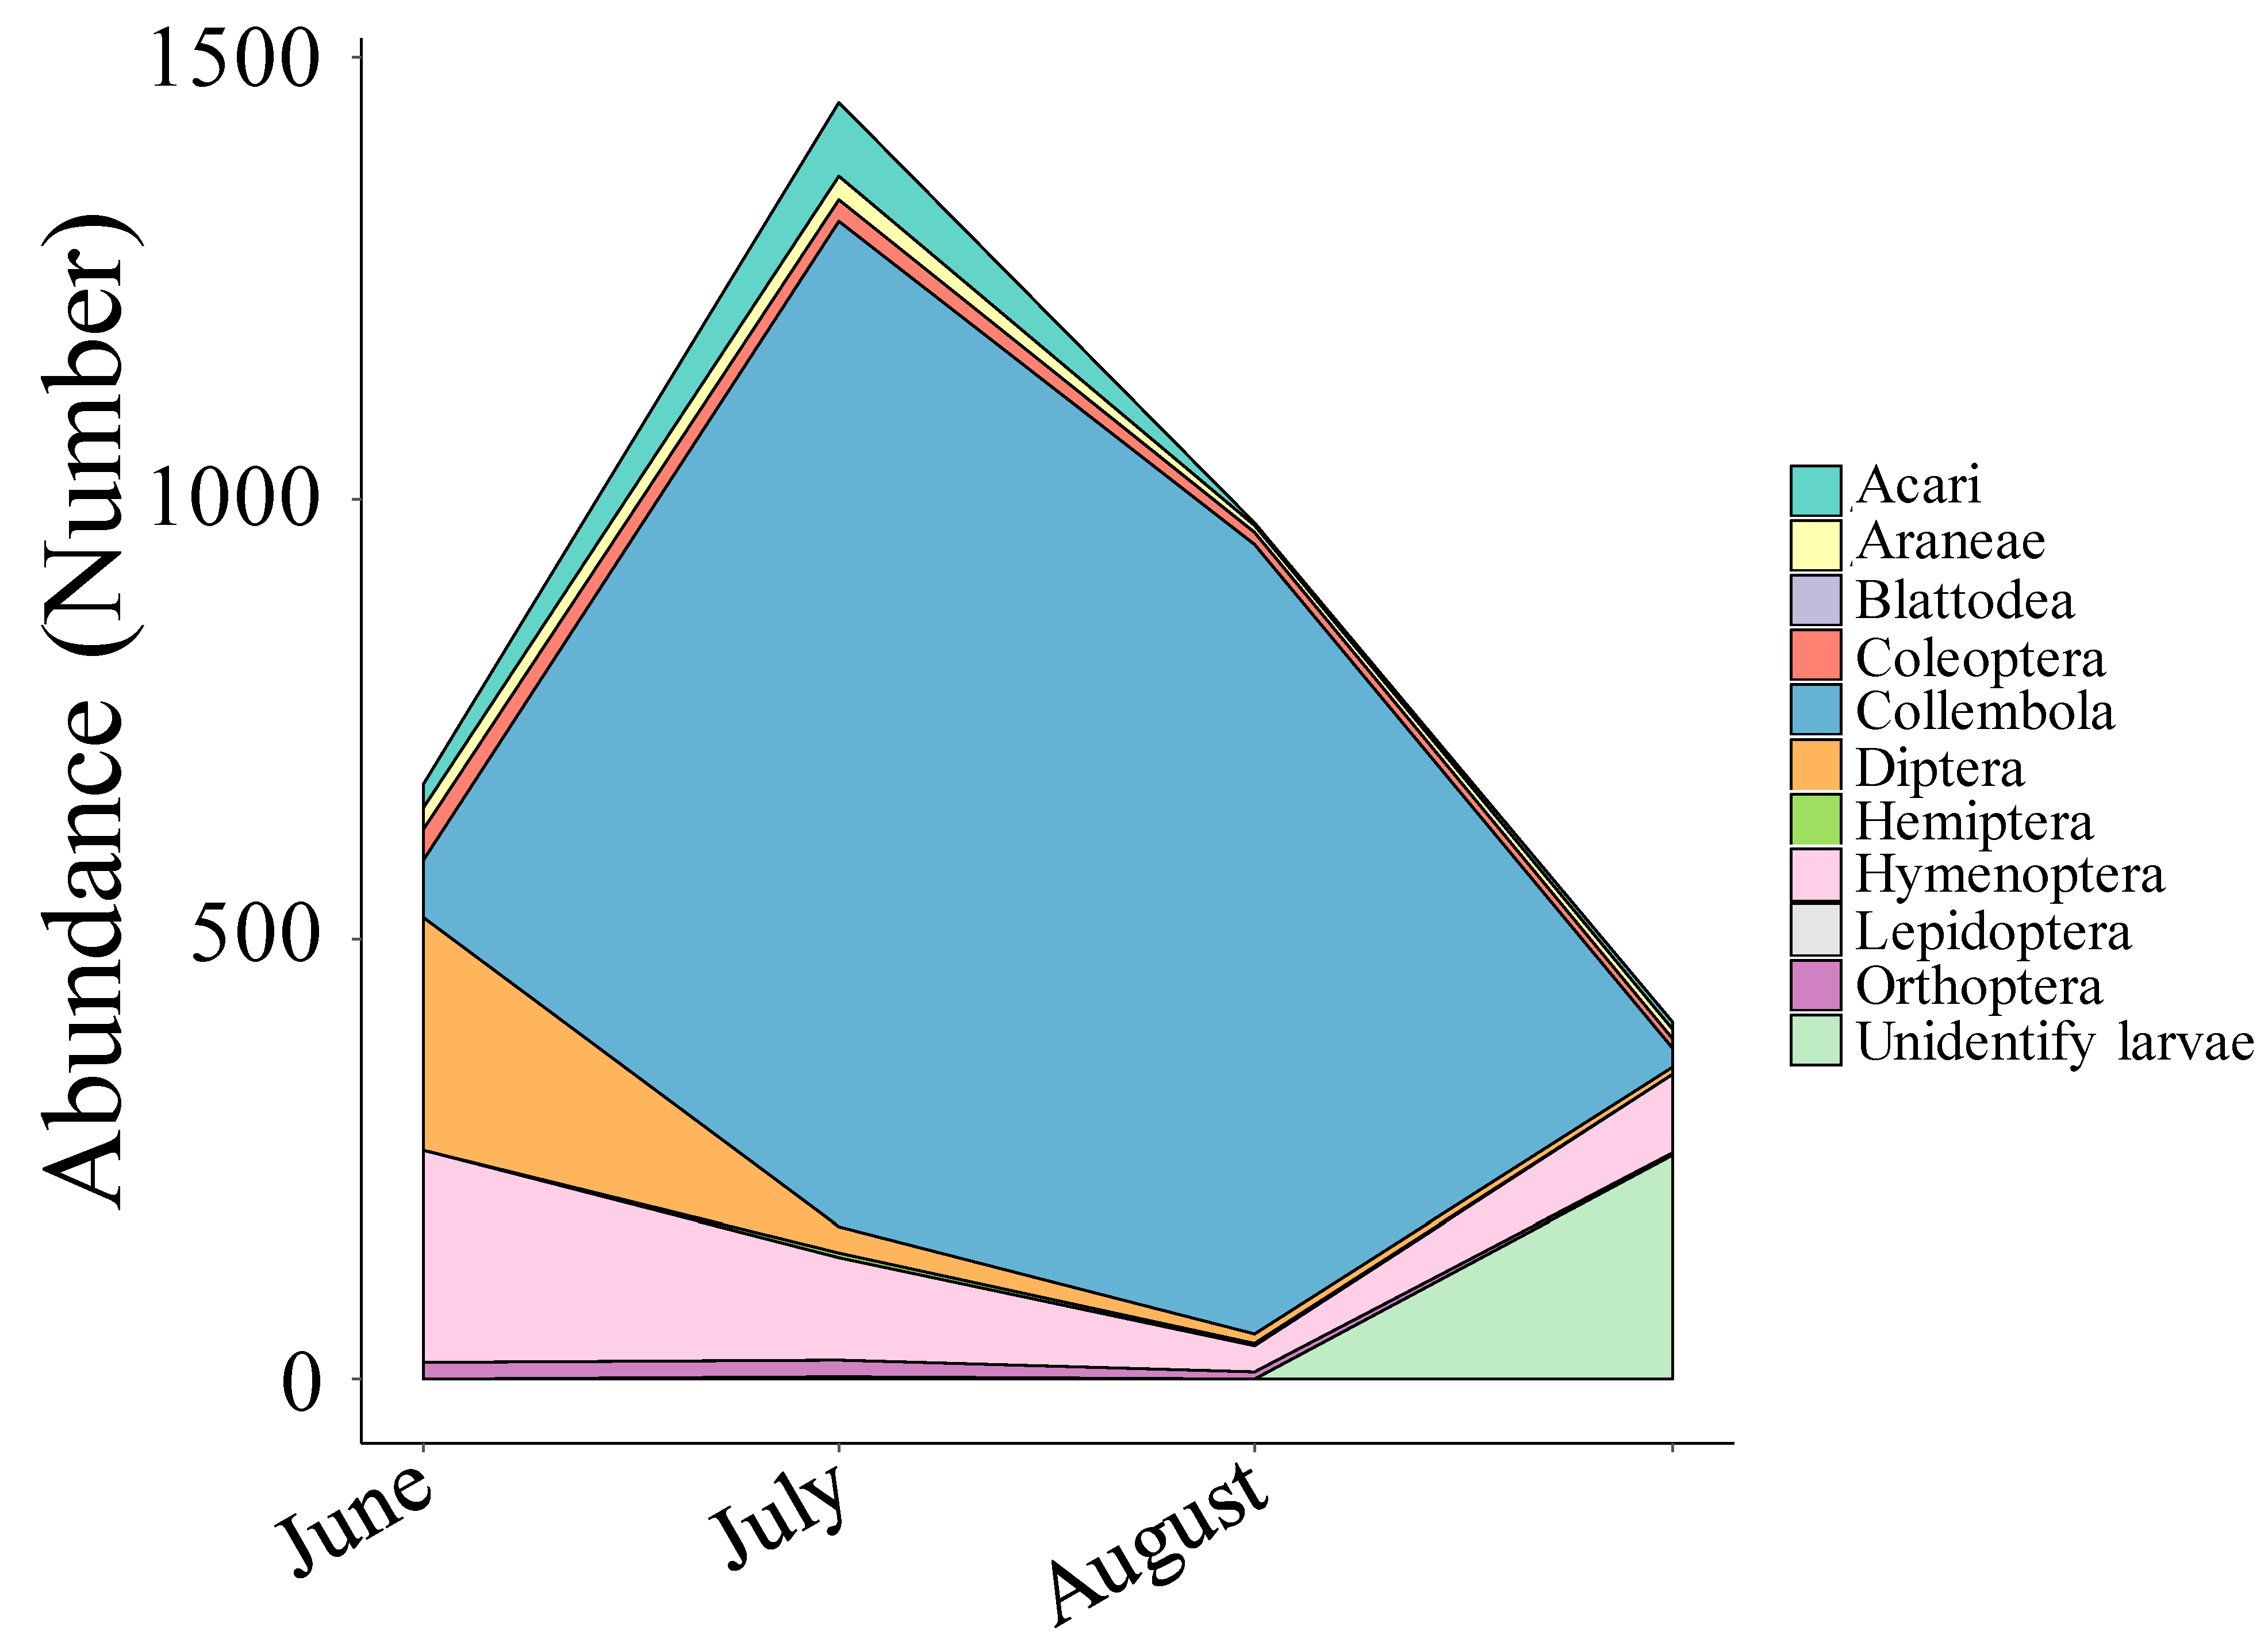
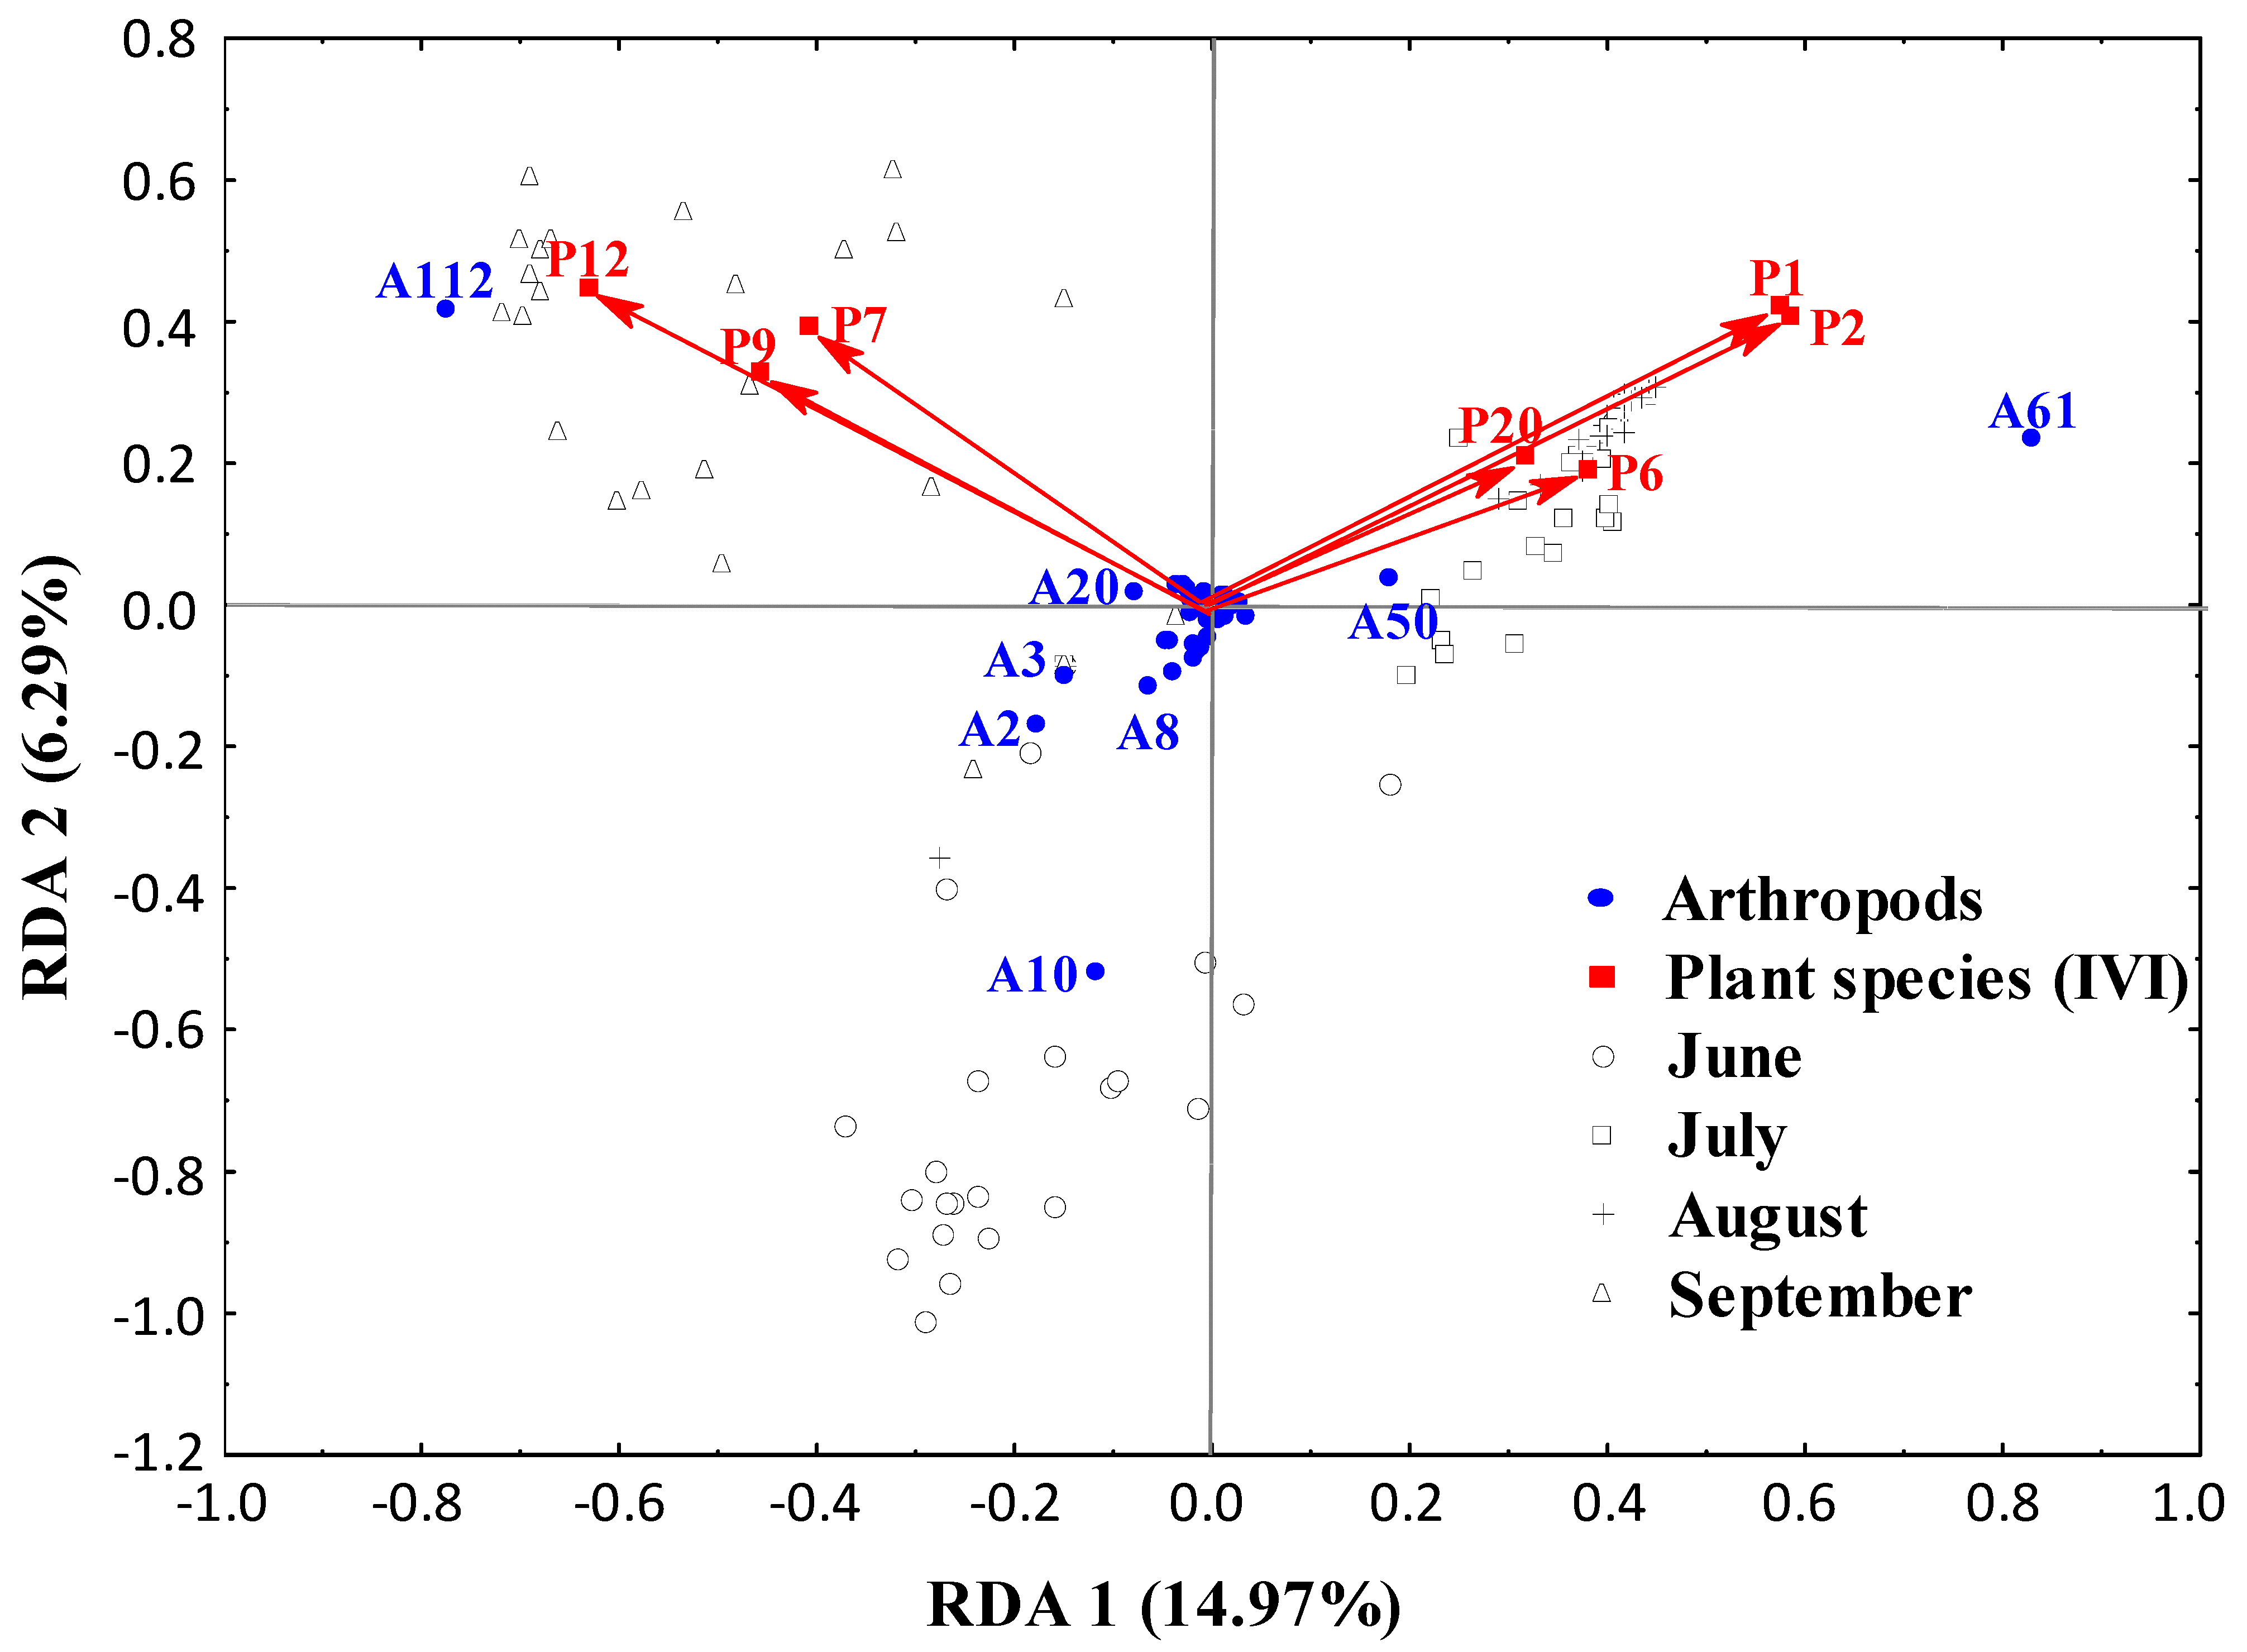
3.1. Arthropods and Plants Diversity
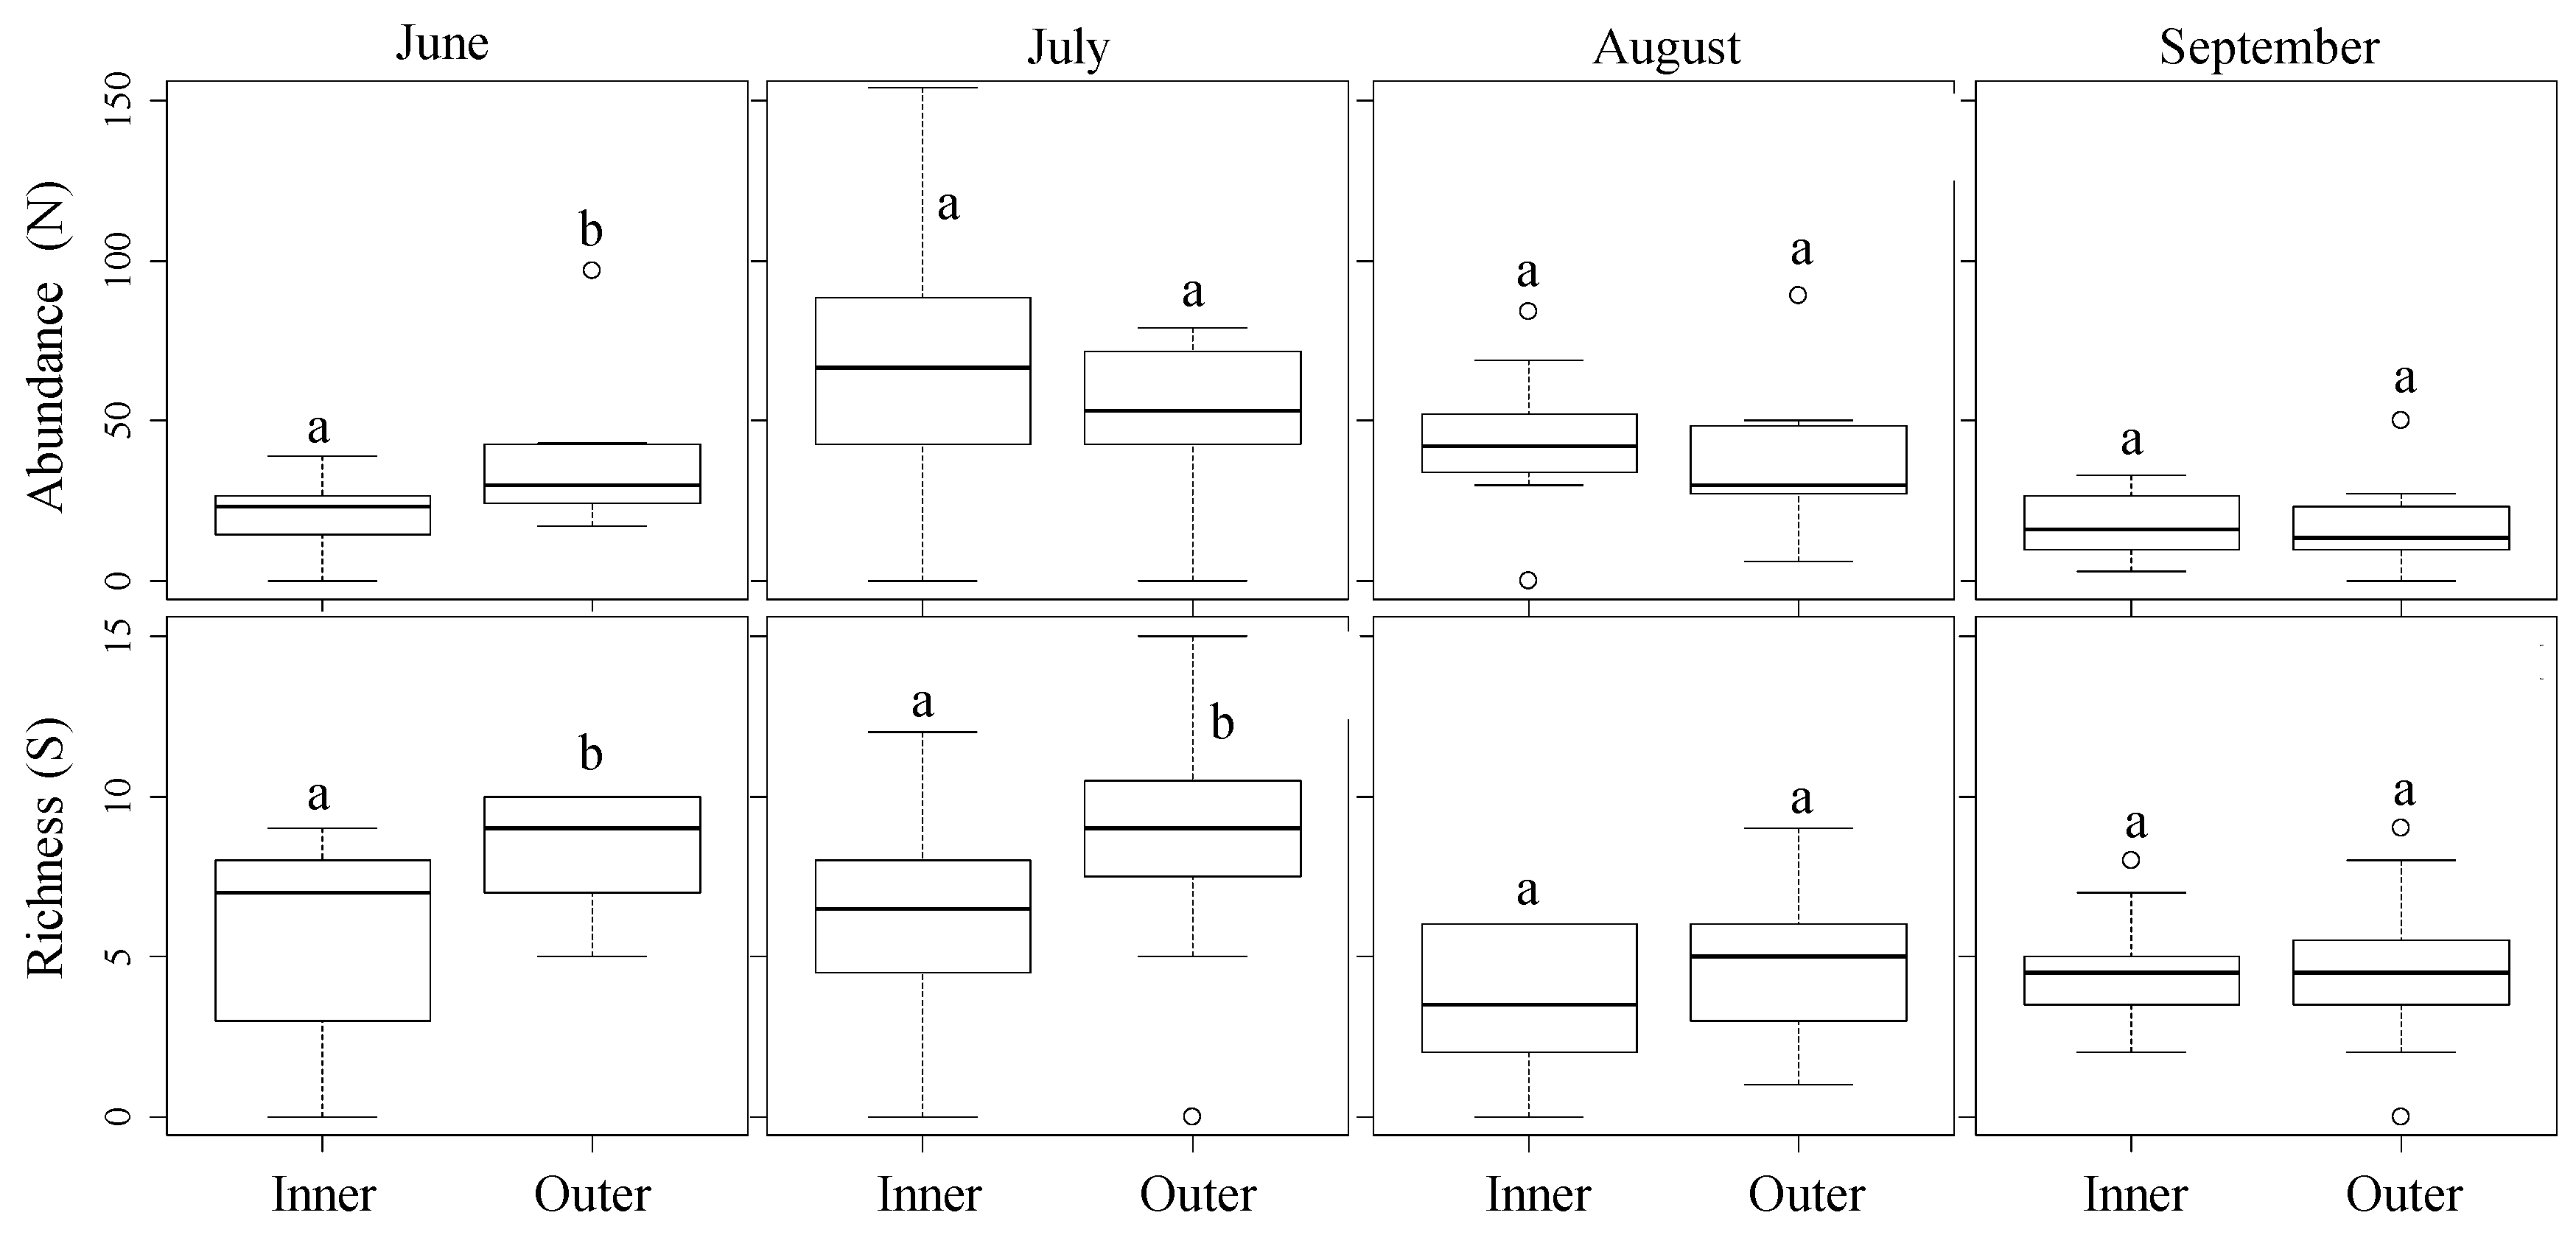
3.2. Spatial Distribution from the Field Margins
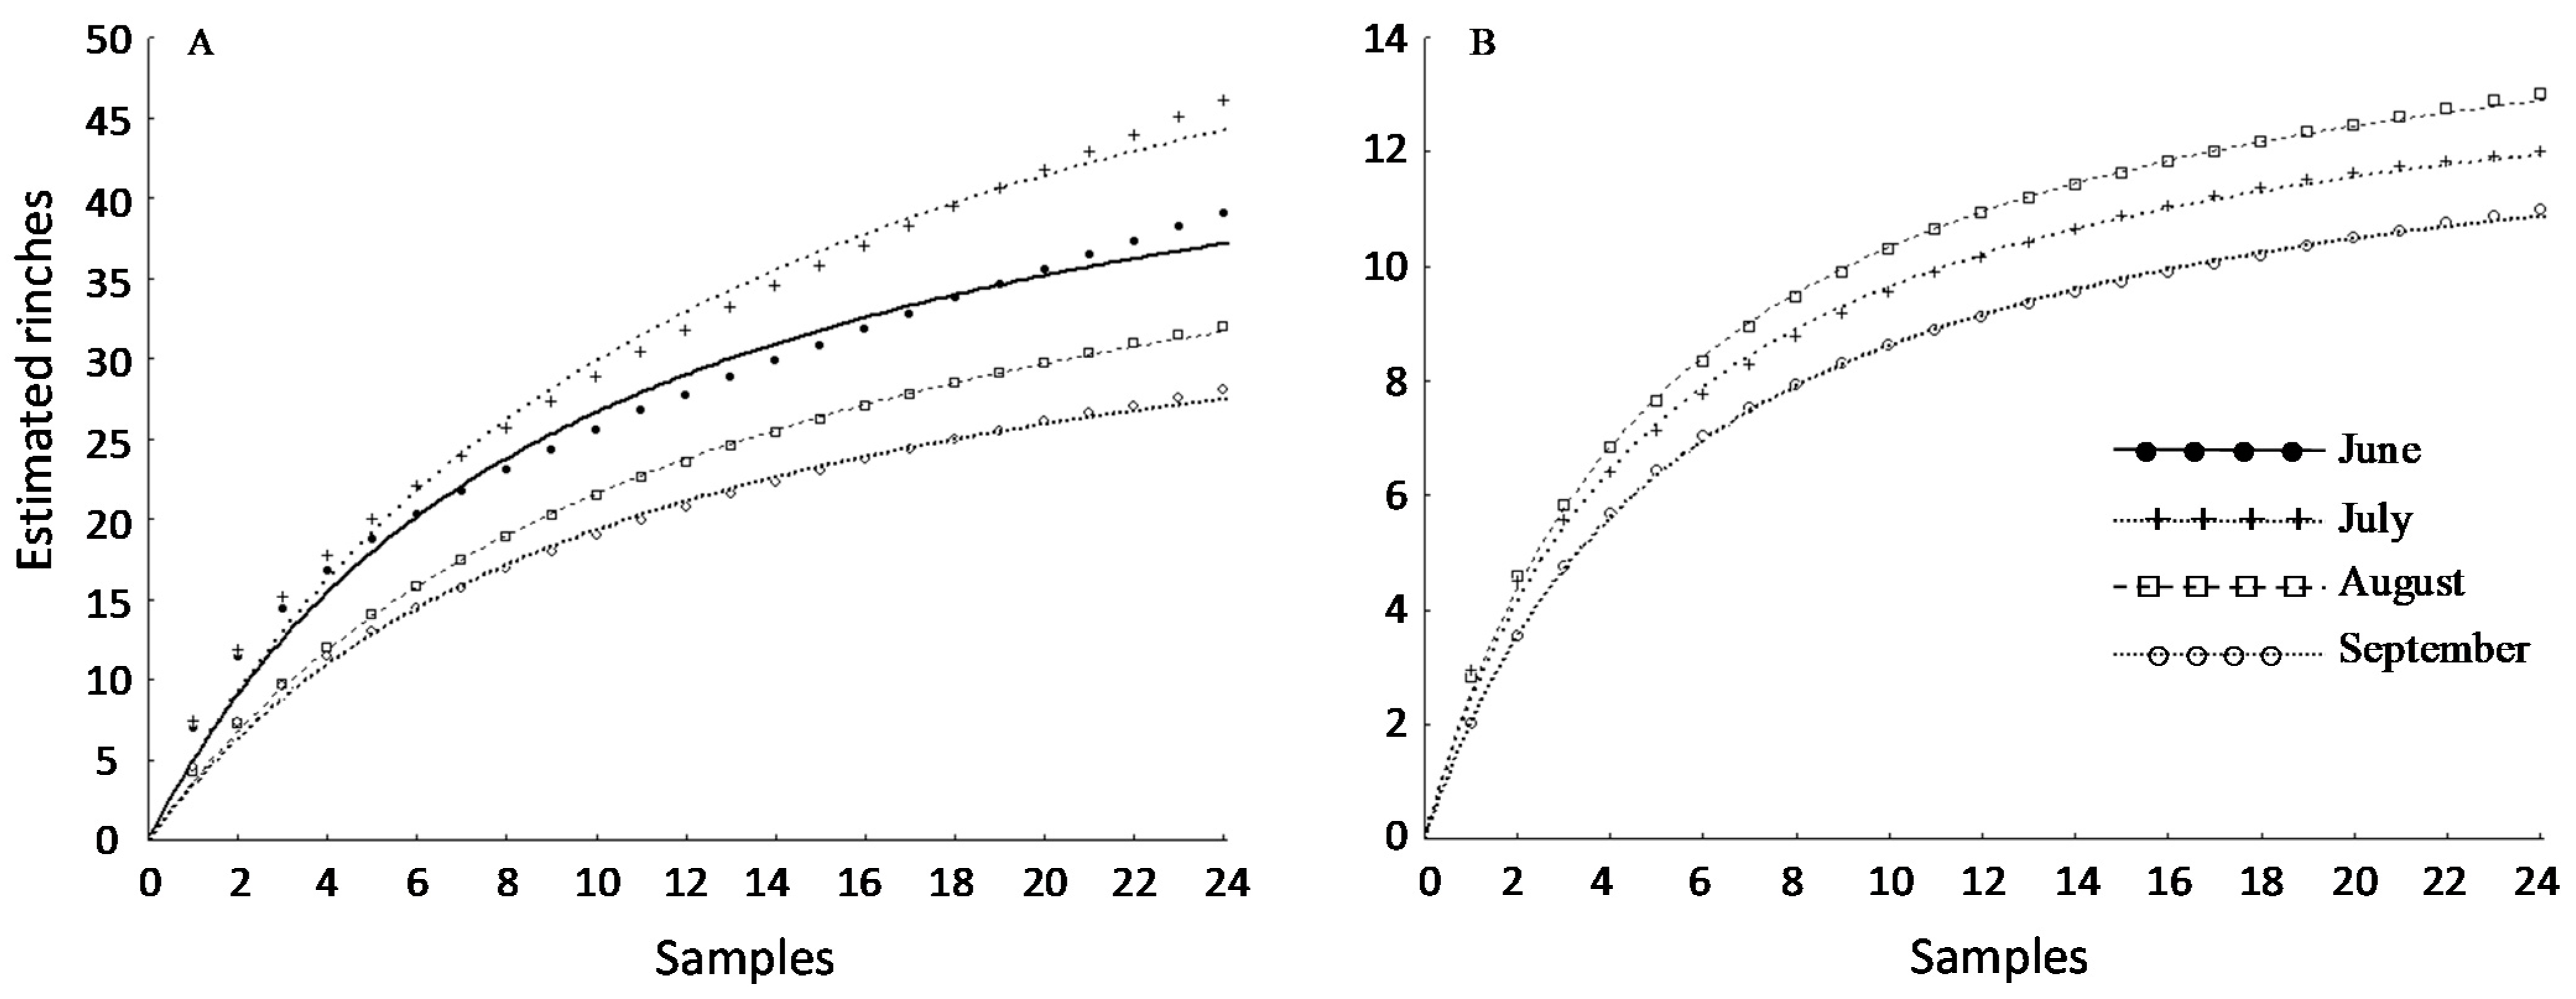
3.3. Sampling Protocol
4. Conclusions
Author Contributions
Funding
Institutional Review Board Statement
Informed Consent Statement
Conflicts of Interest
References
- Saxena, M.; Muralli, S.; Nanda, M.J.; Ramakrishnan, N. Sisal: Potential for employment generation and rural development. In Rural India: Achieving Millennium Development Goals and Grassroots Development; Moni, M., Misra, S., Eds.; Concept Publishing Company: New Delhi, India, 2009; pp. 110–117. [Google Scholar]
- Instituto Brasileiro de Geografia e Estatística. Produção Agrícola Municipal (PAM). Sisal. Sidra. Sistema IBGE de Recuperação Automática. 2015. Available online: http://www.sidra.ibge.gov.br/bda/pesquisas/pam/default.asp?o=29&i=P (accessed on 3 January 2018).
- FAO. Jute, Kenaf, Sisal, Abaca, Coir and Allied Fibres. Market and Policy Analysis of Raw Materials, Horticulture and Tropical (RAMHOT). Products Team Trade and Markets Division. In Statistics Bulletin 2017; Food and Agriculture Organization of the United Nations: Rome, Italy, 2017. [Google Scholar]
- Silva, F.P.M. O Mercado Internacional das Fibras Naturais: Uma Análise Comparativa do Abacá, Coco, Juta e Sisal. FPMS; Textos para Discussão: Salvador, Brasil, 2014; pp. 1–28.
- Coutinho, W.M.; Suassuna, N.D.; Luz, C.M.; Suinaga, F.A.; Silva, O.R.R.F. Bole rot of sisal caused by Aspergillus niger in Brazil. Fitopatololgia Bras. 2006, 31, 605. [Google Scholar] [CrossRef]
- Cabi. Invasive Species Compedium. 2017. Available online: https://www.cabi.org/isc/datasheet/3855#7653AB7A-0D29-4346-833E-BF36D323BEA7 (accessed on 3 January 2018).
- Terán-Vargas, A.P.; Azuara-Domínguez, A.; Vegaaquino, P.; Zambrano-Gutiérrez, J.; Blancomontero, C. Biological effectiveness of insecticides to control the agave weevil, Scyphophorus acupunctatus Gyllenhal (Coleoptera: Curculionidae), in Mexico. Southwest. Entomol. 2012, 37, 47–53. [Google Scholar] [CrossRef]
- Landis, D.A.; Wratten, S.D.; Gurr, G.M. Habitat management to conserve natural enemies of arthropod pests in agriculture. Annu. Rev. Entomol. 2000, 45, 175–201. [Google Scholar] [CrossRef] [PubMed]
- Valdés-Estrada, M.; Aldana-Llanos, L.; Salinas-Sánchez, D.O.; Figueroa-Brito, F.; Hernández-Reyes, M.C.; Valladares-Cisneros, M.G. Toxicity of Plant Extracts to Scyphophorus acupunctatus (Coleoptera: Curculionidae). Fla. Entomol. 2016, 99, 226–230. [Google Scholar] [CrossRef]
- González-Castillo, M.P.; Quintos Escalante, M.; Castaño-Meneses, G. Arthropods in natural communities in Mescal Agave (Agave durangensis Gentry) in an Arid Zone. Am. J. Appl. Sci. 2011, 8, 933–944. [Google Scholar] [CrossRef]
- Villa, M.; Santos, S.A.P.; Marrão, R.; Pinheiro, L.A.; López-Saez, J.A. Syrphids feed on multiple patches in heterogeneous agricultural landscapes during the autumn season, a period of food scarcity. Agric. Ecosyst. Environ. 2016, 233, 262–269. [Google Scholar] [CrossRef]
- Hammer, Ø.; Harper, D.A.T.; Ryan, P.D. PAST: Paleontological statistics software package for education and data analysis. Palaeontol. Electron. 2001, 4, 9. [Google Scholar]
- Oksanen, J.; Guillaume, B.F.; Kindt, R.; Legendre, P.; Minchin, P.R.; O’Hara, B. Vegan: Community Ecology Package. R Package Version 2.3-4. 2016. Available online: http://CRAN.R-project.org/package=vegan (accessed on 3 January 2018).
- R Core Team. R: A Language and Environment for Statistical Computing; R Foundation for Statistical Computing: Vienna, Austria, 2016; Available online: http://www.R-project.org/ (accessed on 3 January 2018).
- Rao, C.R. A review of canonical coordinates and an alternative to correspondence analysis using Hellinger distance. Qüestiió 1995, 19, 23–63. [Google Scholar]
- Benhadi-Marín, J.; Pereira, J.A.; Barrientos, J.A.; Bento, A.; Santos, S.A.P. Diversity of predaceous arthropods in the almond tree canopy in Northeastern Portugal: A methodological approach. Entomol. Sci. 2011, 14, 347–358. [Google Scholar] [CrossRef]
- Colwell, R.K. EstimateS: Statistical Estimation of Species Richness and Shared Species from Samples. Version 8.2. User’s Guide and Application. 2009. Available online: http://purl.oclc.org/estimates (accessed on 3 January 2018).
- StatSof. Statistica (Data Analysis Software System); Version 7; StatSoft Inc.: Tulsa, OK, USA, 2008. [Google Scholar]
- Soberón, J.; Llorente, J. The use of species accumulation functions for the prediction of species richness. Conserv. Biol. 1993, 7, 480–488. [Google Scholar] [CrossRef]
- Gwendolyn, L.W.; Smith, R.L. Patterns of faunal succession in Agave palmeri. Southwest Nat. 1987, 32, 489–497. [Google Scholar] [CrossRef]
- Marques, G.D.V.; del-Claro, K. Sazonalidade, abundância e biomassa de insetos de solo em uma reserva de Cerrado. Rev. Bras. Zoociências 2010, 12, 141–150. [Google Scholar]
- Fenoglio, M.S.; Videla, M.; Salvo, A.; Valladares, G. Beneficial insects in urban environments: Parasitism rates increase in large and less isolated plant patches via enhanced parasitoid species richness. Biol. Conserv. 2013, 164, 82–89. [Google Scholar] [CrossRef]
- Szaparaga, A.; Kocira, S.; Kapusta, I.; Zagula, G. Prototyping extracts from Artemisia absinthium L. for their biostimulating properties yield-enhancing, and farmer income-increasing properties. Ind. Crops. Prod. 2021, 160. [Google Scholar] [CrossRef]
- Zhong, Z.; Huang, X.; Feng, D.; Xing, D.; Xing, S.; Weng, B. Long-term effects of legume mulching on soil chemical properties and bacterial community composition and structure. Agr. Ecosyst. Environ. 2018, 268, 24–33. [Google Scholar] [CrossRef]
- Pino-Otín, M.R.; Val, J.; Ballestero, D.; Navarro, E.; Sánchez, E.; Mainar, A.M. Impact of Artemisia absinthium hydrolate extracts with nematicidal activity on non-target soil organism of different trophic levels. Ecotox. Environ. Safe. 2019, 180, 565–574. [Google Scholar] [CrossRef]
- Ahalya, S.R.; Pushpalatha, E. IGR Activity of three indigenous plants belonging to Asteraceae Family and its potential role on control of filarial vector, Culex quinquefasciatus Say (Diptera: Culicidae). J. Commun. Dis. 2020, 52, 57–62. [Google Scholar] [CrossRef]
- Sarmento Silva, T.M.; Câmara, C.A.; Agra, M.F.; Geraldo de Carvalho, M.G.; Frana, M.T.; Blanco Brandoline, S.V.P.; da Silva Paschoal, L.; Braz-Filho, R. Molluscicidal activity of Solanum species of the Northeast of Brazil on Biomphalaria glabrata. Fitoterapia 2006, 77, 449–452. [Google Scholar] [CrossRef] [PubMed]
- Deladino, L.; Alvarez, I.; De Ancos, B.; Sánchez-Moreno, C.; Molida-Garciía, A.D.; Schneider, T. Betalains and phenolic compounds of leaves and stems of Alternanthera brasiliana and Alternanthera tenella. Food Res. Int. 2017, 97, 240–249. [Google Scholar] [CrossRef]
- Shankaran, K.S.; Ganai, G.A.; Arun, K.P.; Brindha, P.; Mahadevan, V. In silico and in vitro evaluation of the anti-inflammatory potential of Centratherum punctatum Cass-A. J. Biomol. Struct. Dyn. 2017, 35, 765–780. [Google Scholar] [CrossRef] [PubMed]
- Otsuka, F.A.M.; Santos, R.B.; Chaves, L.F.; Santos, R.S.; Chaves Filho, A.B.; Miyamoto, S.; Matos, H.R. Identification of caffeic acid and rutin by UHPLC MS/MS and antioxidant activity of Commelina erecta Lineu. In cell culture. An Acad. Bras. Cienc. 2020, 92, 1–10. [Google Scholar] [CrossRef]
- Rodrigues, F.C.; Morais de Oliveira, A.F. The genus Sida L. (Malvaceae): An update of its ethnomedicinal use, pharmacology and phytochemistry. SAfr. J. Bot. 2020, 132, 432–462. [Google Scholar] [CrossRef]
- Teixeira, N.; Melo, J.C.S.; Batista, L.F.; Paula-Souza, J.; Fonza, P.; Brandão, M.G.L. Edible fruits from Brazilian biodiversity: A review on their sensorial characteristics versus bioactivity as tool to select research. Food Res. Int. 2019, 119, 325–348. [Google Scholar] [CrossRef]
- Celebi, O.; Tolga Cinisli, K.; Celebi, D. Antimicrobial activity of the combination (Nano-Bio) of Artemisia absinthium with copper nanoparticles. Mater Today Proc. 2021, 45, 3809–3813. [Google Scholar] [CrossRef]
- Sharbidre, A.; Dhage, P.; Duggal, H.; Meshram, R. In silico investigation of Tridax procumbens phytoconstituents against sars-cov-2 infection. Biointerface Res. Appl. Chem. 2021, 11, 12120–12148. [Google Scholar]
- Bàrberi, P.; Burgio, G.; Dinelli, G.; Moonen, C.; Otto, S.; Vazzana, C.; Zanin, G. Functional biodiversity in the agricultural landscape: Relationships between weeds and arthropod fauna. Weed Res. 2010, 50, 388–401. [Google Scholar] [CrossRef]
- Borcard, D.; Gillet, F.; Legendre, P. Numerical Ecology with R; Springer: New York, NY, USA, 2011; p. 306. [Google Scholar]
- Bardgetta, R.D.; Yeatesc, G.W. Linking above-ground and below-ground interactions: How plant responses to foliar herbivory influence soil organisms. Soil Biol. Biochem. 1998, 30, 1867–1878. [Google Scholar] [CrossRef]
- Bardgett, R.; Chan, K.F. Experimental evidence that soil fauna enhance nutrient mineralization and plant nutrient uptake in montane grassland ecosystems. Soil Biol. Biochem. 1999, 31, 1007–1014. [Google Scholar] [CrossRef]
- Salamon, J.A.; Schaefer, M.; Alphei, J.; Schimd, B.; Scheu, S. Effects of plant diversity on Collembola in an experimental grassland ecosystem. Oikos 2004, 106, 51–60. [Google Scholar] [CrossRef]
- Pimentel, M.S.; Silva Carvalho, R.; Pionório Vilaronga, D.; Vieira Martins, L.M.; Lopes da Silva, A.V. Dynamic of epigeous macrofauna under organic soil management in the Brazilian semi-arid region. Semin. Ciênc. Agrár. Londrina 2012, 33, 183–192. [Google Scholar] [CrossRef]
- Bravo, F. Perspectives for the study of Diptera (Insecta) in the Brazilian semi-arid. In Towards Greater Knowledge of the Brazilian Semi-Arid Biodiversity; Paganucci de Queiroz, L., Rapini, A., Giuletti, A.M., Eds.; Ministério da Ciência e Tecnologia (MCT): Brasilia, Brasil, 2006; pp. 87–88. [Google Scholar]
- Leal, I.R.; Cardoso da Silva, J.M.; Tabarelli, M.; Lancher, T.E.J.R. Changing the Course of Biodiversity Conservation in the Caatinga of Northeastern Brazil. Conserv. Biol. 2005, 19, 701–706. [Google Scholar] [CrossRef]
- Prasifka, J.R.; Lopez, M.D.; Hellmich, R.L.; Lewis, L.C.; Dively, G.P. Comparison of pit-fall traps and litter bags for sampling ground-dwelling arthropods. J. Appl. Entomol. 2007, 131, 115–120. [Google Scholar] [CrossRef]


| Family/Species | IVI | |||
|---|---|---|---|---|
| June | July | August | September | |
| Amaranthaceae | ||||
| Alternanthera tenella Colla | 0 | 40.04 | 22.54 | 9.19 |
| Asteraceae | ||||
| Artemisia absinthium L. | 0 | 0 | 0.68 | 0 |
| Centratherum punctatum Cass. | 0 | 6.73 | 11.91 | 0 |
| Lepidaploa cotoneaster (Willd. ex Spreng.) | 0 | 13.14 | 8.5 | 18.09 |
| Lourteigia ballotaefolia (Kunth) R.M.King and H.Rob. | 0 | 36.23 | 26.19 | 9.85 |
| Tridax procumbens L. | 0 | 6.23 | 0 | 0 |
| Commelinaceae | ||||
| Commelina erecta L. | 100 | 7.16 | 7.45 | 0 |
| Fabaceae | ||||
| Calopogonium sp. | 0 | 9.67 | 6.97 | 6.56 |
| Chamaecrista rotundifolia Moench | 0 | 0 | 0 | 20.15 |
| Mimosa sp. | 0 | 3.32 | 5.75 | 2.71 |
| Malvaceae | ||||
| Sida cordifolia L. | 0 | 9.98 | 5.72 | 5.62 |
| Pavonia cancellata (L.) Cav. | 0 | 2.38 | 0 | 11.67 |
| Sidastrum paniculatum (L.) Fryxell | 0 | 0 | 3.89 | 0 |
| Sida sp. | 0 | 0 | 1.07 | 0 |
| Poaceae | ||||
| Specie 1 | 0 | 1.43 | 0 | 0 |
| Rubiaceae | ||||
| Borreria verticilata (L.) G.Mey. | 0 | 0 | 1.95 | 0 |
| Solanaceae | ||||
| Solanum lycocarpum A.St.-Hil. | 0 | 3.74 | 1.07 | 0 |
| Solanum agrarium Sendtn. | 0 | 2.56 | 0 | 0 |
| Unidentified | ||||
| Specie 2 | 0 | 0 | 0 | 0.96 |
| Specie 3 | 0 | 0 | 0 | 1.05 |
| Specie 4 | 0 | 0 | 1.07 | 0 |
| Specie 5 | 0 | 0 | 3.04 | 0 |
Publisher’s Note: MDPI stays neutral with regard to jurisdictional claims in published maps and institutional affiliations. |
© 2021 by the authors. Licensee MDPI, Basel, Switzerland. This article is an open access article distributed under the terms and conditions of the Creative Commons Attribution (CC BY) license (https://creativecommons.org/licenses/by/4.0/).
Share and Cite
da Silva Brito, S.S.; Villa, M.; Benhadi-Marín, J.; da Silva, F.; Pereira, J.A. The Temporal and Spatial Variation of Arthropod Associations Inhabiting Non-Crop Vegetation in a Sisal Crop, Agave sisalana in the Caatinga Biome. Appl. Sci. 2021, 11, 6498. https://doi.org/10.3390/app11146498
da Silva Brito SS, Villa M, Benhadi-Marín J, da Silva F, Pereira JA. The Temporal and Spatial Variation of Arthropod Associations Inhabiting Non-Crop Vegetation in a Sisal Crop, Agave sisalana in the Caatinga Biome. Applied Sciences. 2021; 11(14):6498. https://doi.org/10.3390/app11146498
Chicago/Turabian Styleda Silva Brito, Sara Samanta, María Villa, Jacinto Benhadi-Marín, Franceli da Silva, and José Alberto Pereira. 2021. "The Temporal and Spatial Variation of Arthropod Associations Inhabiting Non-Crop Vegetation in a Sisal Crop, Agave sisalana in the Caatinga Biome" Applied Sciences 11, no. 14: 6498. https://doi.org/10.3390/app11146498
APA Styleda Silva Brito, S. S., Villa, M., Benhadi-Marín, J., da Silva, F., & Pereira, J. A. (2021). The Temporal and Spatial Variation of Arthropod Associations Inhabiting Non-Crop Vegetation in a Sisal Crop, Agave sisalana in the Caatinga Biome. Applied Sciences, 11(14), 6498. https://doi.org/10.3390/app11146498