Article

Efficient Management of Power Losses from Renewable Sources Using Removable E.V. Batteries

by
Claudiu George Bocean
1,*,
Anca Antoaneta Vărzaru
2,
Andreea Teodora Al-Floarei
3,
Simona Dumitriu
4,
Dragoş Laurenţiu Diaconescu
5 and
Mihai Constantin Răzvan Barbu
5
1
Department of Management, Marketing and Business Administration, University of Craiova, 200585 Craiova, Romania
2
Department of Economics, Accounting and International Business, University of Craiova, 200585 Craiova, Romania
3
Faculty of Law, Doctoral School, Western University of Timișoara, 300223 Timișoara, Romania
4
Sanitary Postgraduate School Omenia, 210167 Târgu Jiu, Romania
5
Department of Theory and Methodology of Motricity Activities, Faculty of Physical Education and Sport, University of Craiova, 200585 Craiova, Romania
*
Author to whom correspondence should be addressed.
Appl. Sci. 2021, 11(14), 6413; https://doi.org/10.3390/app11146413
Submission received: 30 June 2021 / Revised: 8 July 2021 / Accepted: 9 July 2021 / Published: 12 July 2021
(This article belongs to the Special Issue Renewable and Sustainable Energy Integration in Power Systems)

Abstract

:
Electric vehicles (E.V.) are one of the feasible solutions to address the challenges of sustainable development that require particular attention, such as climate change, depletion of fossil fuel reserves, and greenhouse gas emissions. In addition to the environmental benefits of electric vehicles, they can also be used as a storage system to alleviate the challenges posed by the variability of renewable electricity sources and to provide the network with ancillary benefits, such as voltage regulation and frequency regulation. Furthermore, using removable batteries by electric vehicles to store renewable energy is an innovative and effective solution to combat the increase in GHG emissions. In this article, using the autoregressive integrated moving average forecast model, we estimate the necessary storage capacity to contribute to the adjustment of the energy system increasingly powered by renewable energy sources. Also, we estimate the number of electric vehicles needed to take over the excess energy produced by renewable sources when the conventional grid cannot take over this surplus. The forecasts have the year 2050 as a time horizon. The results show that removable E.V. batteries can be an efficient solution for managing and storing energy lost in the temporal incongruity of demand with supply in the energy market.

1. Introduction

Almost a quarter of greenhouse gas emissions come from the transport sector, with urban mobility responsible for 40% of all CO2 emissions from road transport [1]. According to estimates [1], nine out of ten European citizens are exposed to harmful particulate emissions that exceed acceptable limits. The harmful environmental effects of transport, a vulnerability in terms of power supply disruptions, and price volatility due to its dependence on oil, are challenges to be considered shortly. Thus, growing concerns about the certainty of energy sources, climate change, and health have led to the shift from fossil fuels to renewable energy and the implementation of new propulsion systems for vehicles with a higher long-term sustainability potential. Among these propulsion systems are those based on electricity, electric or hybrid electric vehicles currently having a development momentum being supported at the state and interstate level. However, the expansion of electricity-based vehicles is presently limited by the high price of energy-storing batteries, which are larger and heavier to ensure long battery life for vehicles. One solution to lower costs would be reusable, removable batteries, which can also help balance the energy system. To extract maximum benefits from the use of electric vehicles and to create positive effects on the renewable energy distribution network, energy policymakers should consider optimizing the integration of electric vehicles into the grid [2]. However, although battery costs have decreased [3,4,5], no evidence has been provided to date that investments in battery storage are profitable if the current technological level is maintained.
Technologies based on the use of renewable energy are a tool that will become essential in mitigating the consequences of climate change in the context of depletion of fossil fuel resources. However, these technologies have some limitations generated by geographical and meteorological factors. For example, electricity production from photovoltaic solar systems or wind turbines is characterized by intermittency and volatility, depending on daytime conditions (photovoltaic cells) or local weather conditions (wind turbines). Currently, a feasible way to make these dissonances compatible is to adjust the energy system by using conventional power plants, (such as modern gas-fired power plants), that can provide power at any time and operate relatively easily and quickly. However, these plants have limited capacities, and the gas used as fuel will run out by the end of the 21st century. At the same time, an increasing amount of energy is supplied by renewable sources. Renewable energy storage technologies can provide the possibility of compatibility and harmonization of supply and demand. For example, reusable batteries in electric or hybrid vehicles can be a storage technology that can bring economic and environmental benefits.
This paper aims to estimate the impact of the paradigm shift in road transport (from fossil fuel-based to electricity-based propulsion) on the energy system in general and on energy from renewable sources. To achieve this, we will estimate the necessary storage capacity to help adjust the energy system, increasingly powered by renewable energy sources. Based on the required storage capacity, we will evaluate the number of electric vehicles needed to take over the excess energy produced by renewable sources when the conventional grid cannot take over this surplus, and compare it with the estimation on vehicles stock. All forecasts are undertaken at the European Union level and consider the proposed targets for 2050 regarding the share of renewable energy in total energy and the percentage of electric vehicles in total vehicles.
This paper is structured in six sections. The following two sections expose the research and discussions. After the introduction and review of the literature, the research variables, assumptions, and methodology used are presented. Next, the following two sections show the results of the research and the discussions. Finally, the conclusions, the research limitations, and future research directions complete the paper.

2. Literature Review

2.1. Relationship between Variable Renewable Energy and Storage Requirements

The relationship between variable renewable energy (from wind and solar sources) and energy storage needs at peak generation times has been addressed by researchers in different fields and from different perspectives: how to integrate variable renewable energy sources into the energy system [6], the need to store part of renewable energy [7,8,9] the technical and economic characteristics of energy models [10,11], the role of long-term variable renewable energy storage [12]. Most researchers show that the requirements for electricity storage from renewable sources are generally moderate at the current level. These requirements increase substantially only in the transition to a predominantly renewable energy system [9,13], as expected in the European Union by the 2050s. The need for increased storage capacity was addressed in their studies on the German energy market Sinn, Schill, and Zerrahn [8,14]. Regarding the European market, Scholz et al. and Cebulla et al. [15,16] conducted studies on energy storage models obtained from renewable sources. For the United States of America, a series of researchers [17,18,19,20,21,22] investigated the impact of the increase in the share of renewable energy in total energy generated. Most of these researchers promote a strategy for the incongruity between the supply and demand of renewable energy curtailment to avoid imbalances and protect the power grid in case of excessive feed-in. These researchers offer solutions for variable renewable energy peaks, such as geographic balancing [20,22,23,24], demand management [14], flexible use of renewable energy sources in other sectors such as heat or mobility [18] and greater flexibility on both supply and demand [25]. Other researchers approach issues as the value of energy storage in decarbonizing the electricity sector [21], the spillover effects in exchange-traded funds [26], and energy cooperation between countries [27].
A 2017 analysis [8] shows that the demand for electricity storage will be extremely high, which will hamper investment in wind and solar power generation sources. Sinn [8] demonstrates, based on historical time series illustrating electricity demand and production from variable renewable energy sources, that, without storage, approximately 61% of the energy from wind and solar generators could not be used, unable to find demand at the time of production. Considerable investments in storage capacity are needed to prevent such non-cash generation peaks in market demand [9]. Sinn [8] show that current storage facilities would not allow an increase in the share of renewable energy from solar and wind sources of more than 30%, with storage requirements more than 400 times higher than existing ones if switched to fully renewable electricity sources [8,9,28]. Consequently, research on efficient energy management of renewable energy sources is essential for informing policymakers. One solution available to policymakers is to help car manufacturers use removable batteries to ensure electric vehicles’ energy.

2.2. Policies and Models for Electric Vehicles

Given the increasing environmental pollution and climate warming and the role of road transport in producing these phenomena [29], the large-scale deployment of electric vehicles is a serious and viable option for sustainable transport [30].
Cho and Blommestein [31] state that to increase the use of electric vehicles, it is necessary to reduce the price of electric vehicles, increasing the cost of fossil fuel. These measures must undertake so that consumers lean towards electric vehicles at the expense of internal combustion vehicles due to the increase in the intensity of the rewards offered. National policies can play an essential role in promoting electric vehicles among consumers. For example, Norway has provided incentives to encourage electric vehicles [32]. Low or even zero charging and low-priced services (related to supply and maintenance) could accelerate the early promotion of electric vehicles [33]. Both [34,35] believe that state governments should formulate a policy package that clarifies the industry’s development objectives, the charging facilities offered, provide an appropriate guidance and market access mechanism, and build a preferential tax system. State governments should combine taxes and subsidies to reduce the cost of purchases of electric vehicles and promote electric vehicles by businesses and individuals [36,37]. As in other areas of the economy, the state can play an essential role in regulating market mechanisms [38,39,40].
The business model on which the development of electric vehicles is based is a widely debated issue in the literature. These business models relate mainly to the ownership of electric vehicles. Gong [34] believes that car-sharing or financial leasing should be encouraged for more and more consumers to accept the use of electric vehicles. Free charging can encourage people to use electric vehicles, but this is not a long-term business model but only a model to promote and stimulate the use of electric vehicles [41,42]. Wang et al. [43] believe that the transactional model should be changed, and a more appropriate model would be the battery and vehicle separation model. Better Place and Tesla were the first companies to implement the battery replacement model. However, Better Place failed due to low profit, slow expansion speed, high cost of battery replacement stations, and lack of substantial support from government authorities. Tesla’s failure had two reasons. The first was derived from the fact that the service was more expensive than internal combustion vehicles, and the second was the difficulty of replacing the battery [44,45]. Separation of battery from the vehicle is a business model that is considered appropriate to solve the blockage of the development of electric vehicles and can help solve the problem of storage of electricity produced from renewable sources and which has no demand on the market at the time of production.

2.3. Integrated Electricity Storage and Supply System

The increasing penetration of electric vehicles into the automotive market has led to problems related to the quality of the distribution network, in particular network congestion and nominal frequency problems. Electric vehicles are based on a mobile single-phase load, so they can be randomly connected to any distribution network points, leading to a scenario in which the network can be overloaded. In addition, since electric vehicles have an asymmetrical spatial layout and have a temporally uncertain evolution, the additional loads generated are a danger to maintaining the reliability and security of the network. Furthermore, overlapping the charging of electric vehicles above the peak of household consumption may result in additional system peaks [46]. Therefore, optimal integration of electric vehicles into distribution networks is an important area of research, particularly concerning reducing the impact of consumption peaks and the possibility of synchronizing these consumption peaks with the extremes of renewable energy generation produced, sometimes at times when there is no market demand [47].
A significant source contributing to greenhouse gas emissions is the electricity industry, particularly energy generation through fossil fuels in the combustion process. Renewable energy sources, such as wind and solar, are increasingly being deployed at the level of states to mitigate greenhouse gas emissions from the energy industry. The variable nature of renewable energy sources, which depend on weather or location, causes problems for the stability and reliability of the electricity grid, which leads to the need to integrate the energy storage system [48]. As a result, there may not be sufficient demand during which renewable energy sources deliver to the system, leading to an underutilization of the average capacity generated. Using the integration of the energy storage system to optimize the use of renewable energy sources can lead to the full use of the energy generated. An integrated energy storage system can receive energy when demand is low and can be supplied when demand is high [49].
Electric vehicles are increasingly used to combat greenhouse gas emissions. Although these electric vehicles are essentially battery-powered, electric vehicles can also act as a dynamic energy storage system, thanks to the vehicle-to-grid (V2G) feature. Electric vehicles provide energy stored in their batteries back into the grid [50]. In addition, electric vehicles are located a considerable amount of time (22 h on average) in parking conditions [47], so they can be used adequately for energy sources without creating inconvenience to users. However, battery degradation is still a problem that can be offset by providing incentives for users to participate in the integrated electricity storage and supply system. Since the battery capacity of each electric vehicle is minuscule compared to the network charging requirements, an aggregation of the installed power of electric vehicles is generally required to provide the grid with backup power. In addition to storing excess energy generated by renewable energy sources, electric vehicles may provide additional ancillary services to the grid, such as voltage regulation and frequency regulation. Electric vehicles can also participate in energy trading as a source of income for users, thus offsetting battery degradation due to participation in the integrated electricity storage and supply system [2].
Figure 1 shows the role of a network of removable batteries in taking over the excess electricity supplied at certain times by renewable sources and adjusting the entire energy system.
Figure 1 describes an integrated electricity storage and supply system based on removable batteries that can be used to propel electric vehicles within households or companies as sources of energy complementary to the distribution network. These removable batteries could store energy when energy demand is low (default and energy price is low) and provide energy when there are peaks of consumption (default and energy price is high). Such a removable battery network is needed because the share of electricity produced by conventional sources (based on fossil fuels) decreases in total energy production. In addition to the production role and a regulating role, classical energy sources had provided electricity when requested by the market and can be temporarily closed when demand is reduced. Our paper studies the possibility of implementing removable batteries in the stock of electric vehicles and the impact that the energy storage capacity in these batteries could have on the entire energy system. The research question is: Can removable batteries provide storage capacity to help adjust the energy system, increasingly powered by renewable energy sources? The research uses predictive models based on historical trends recorded of selected variables to answer this question.

3. Materials and Methods

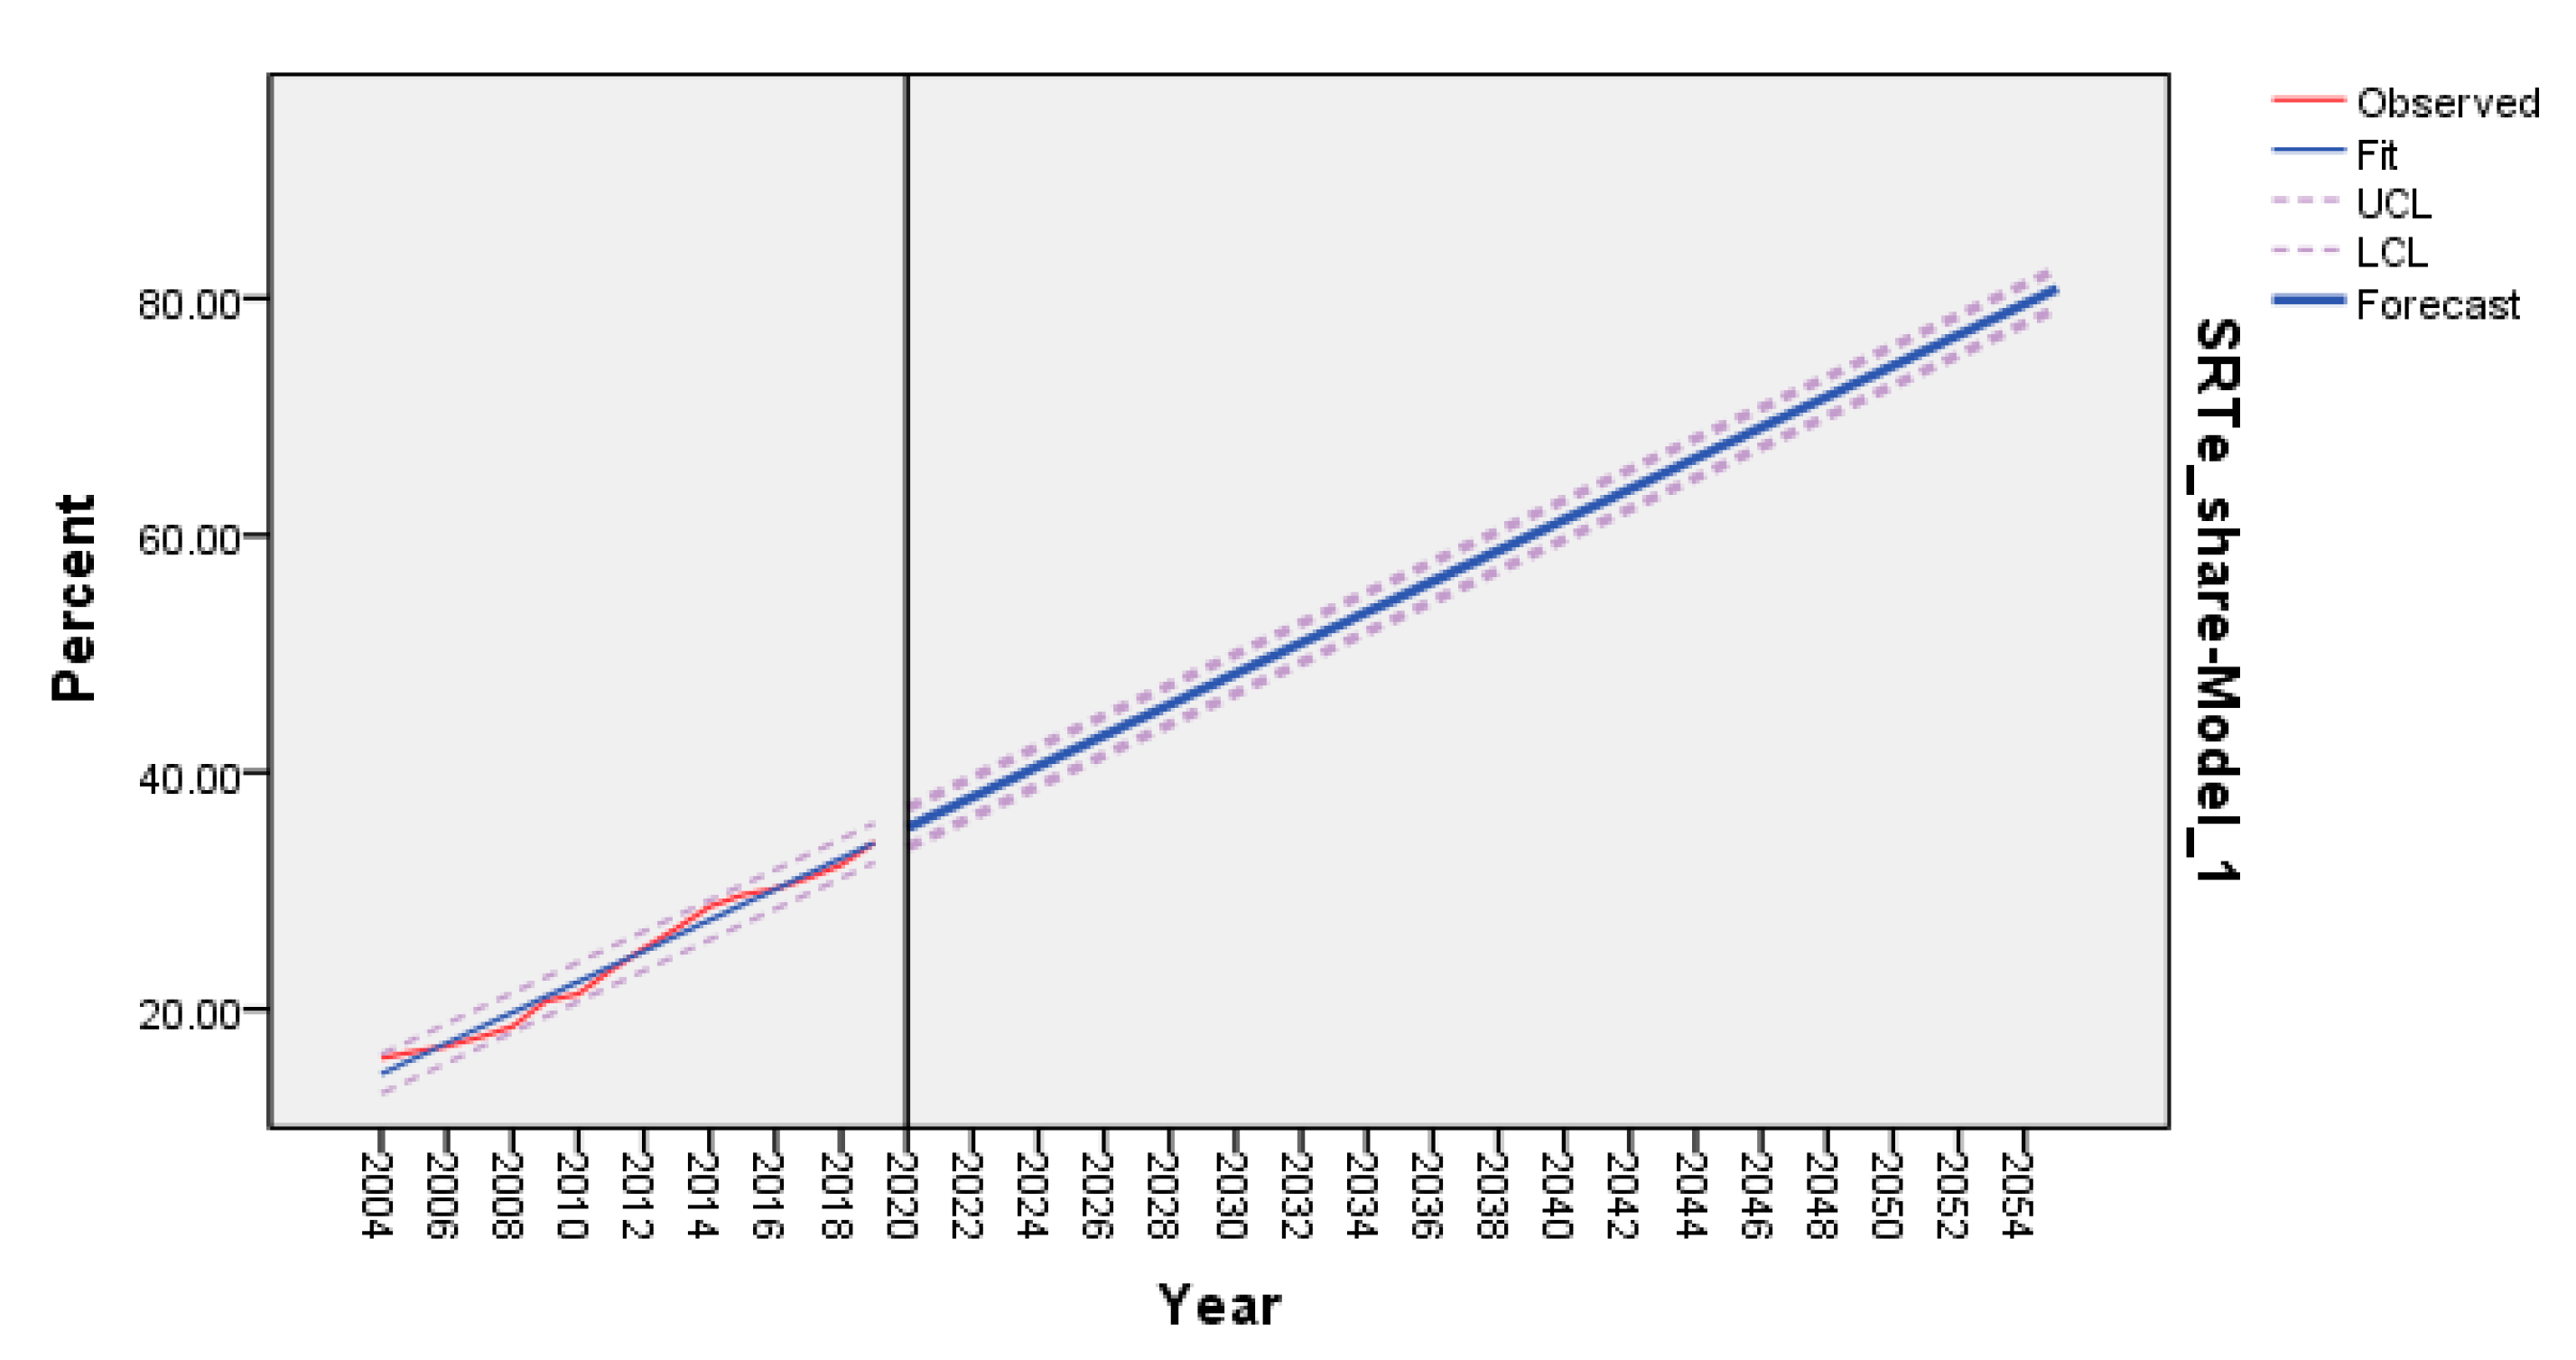
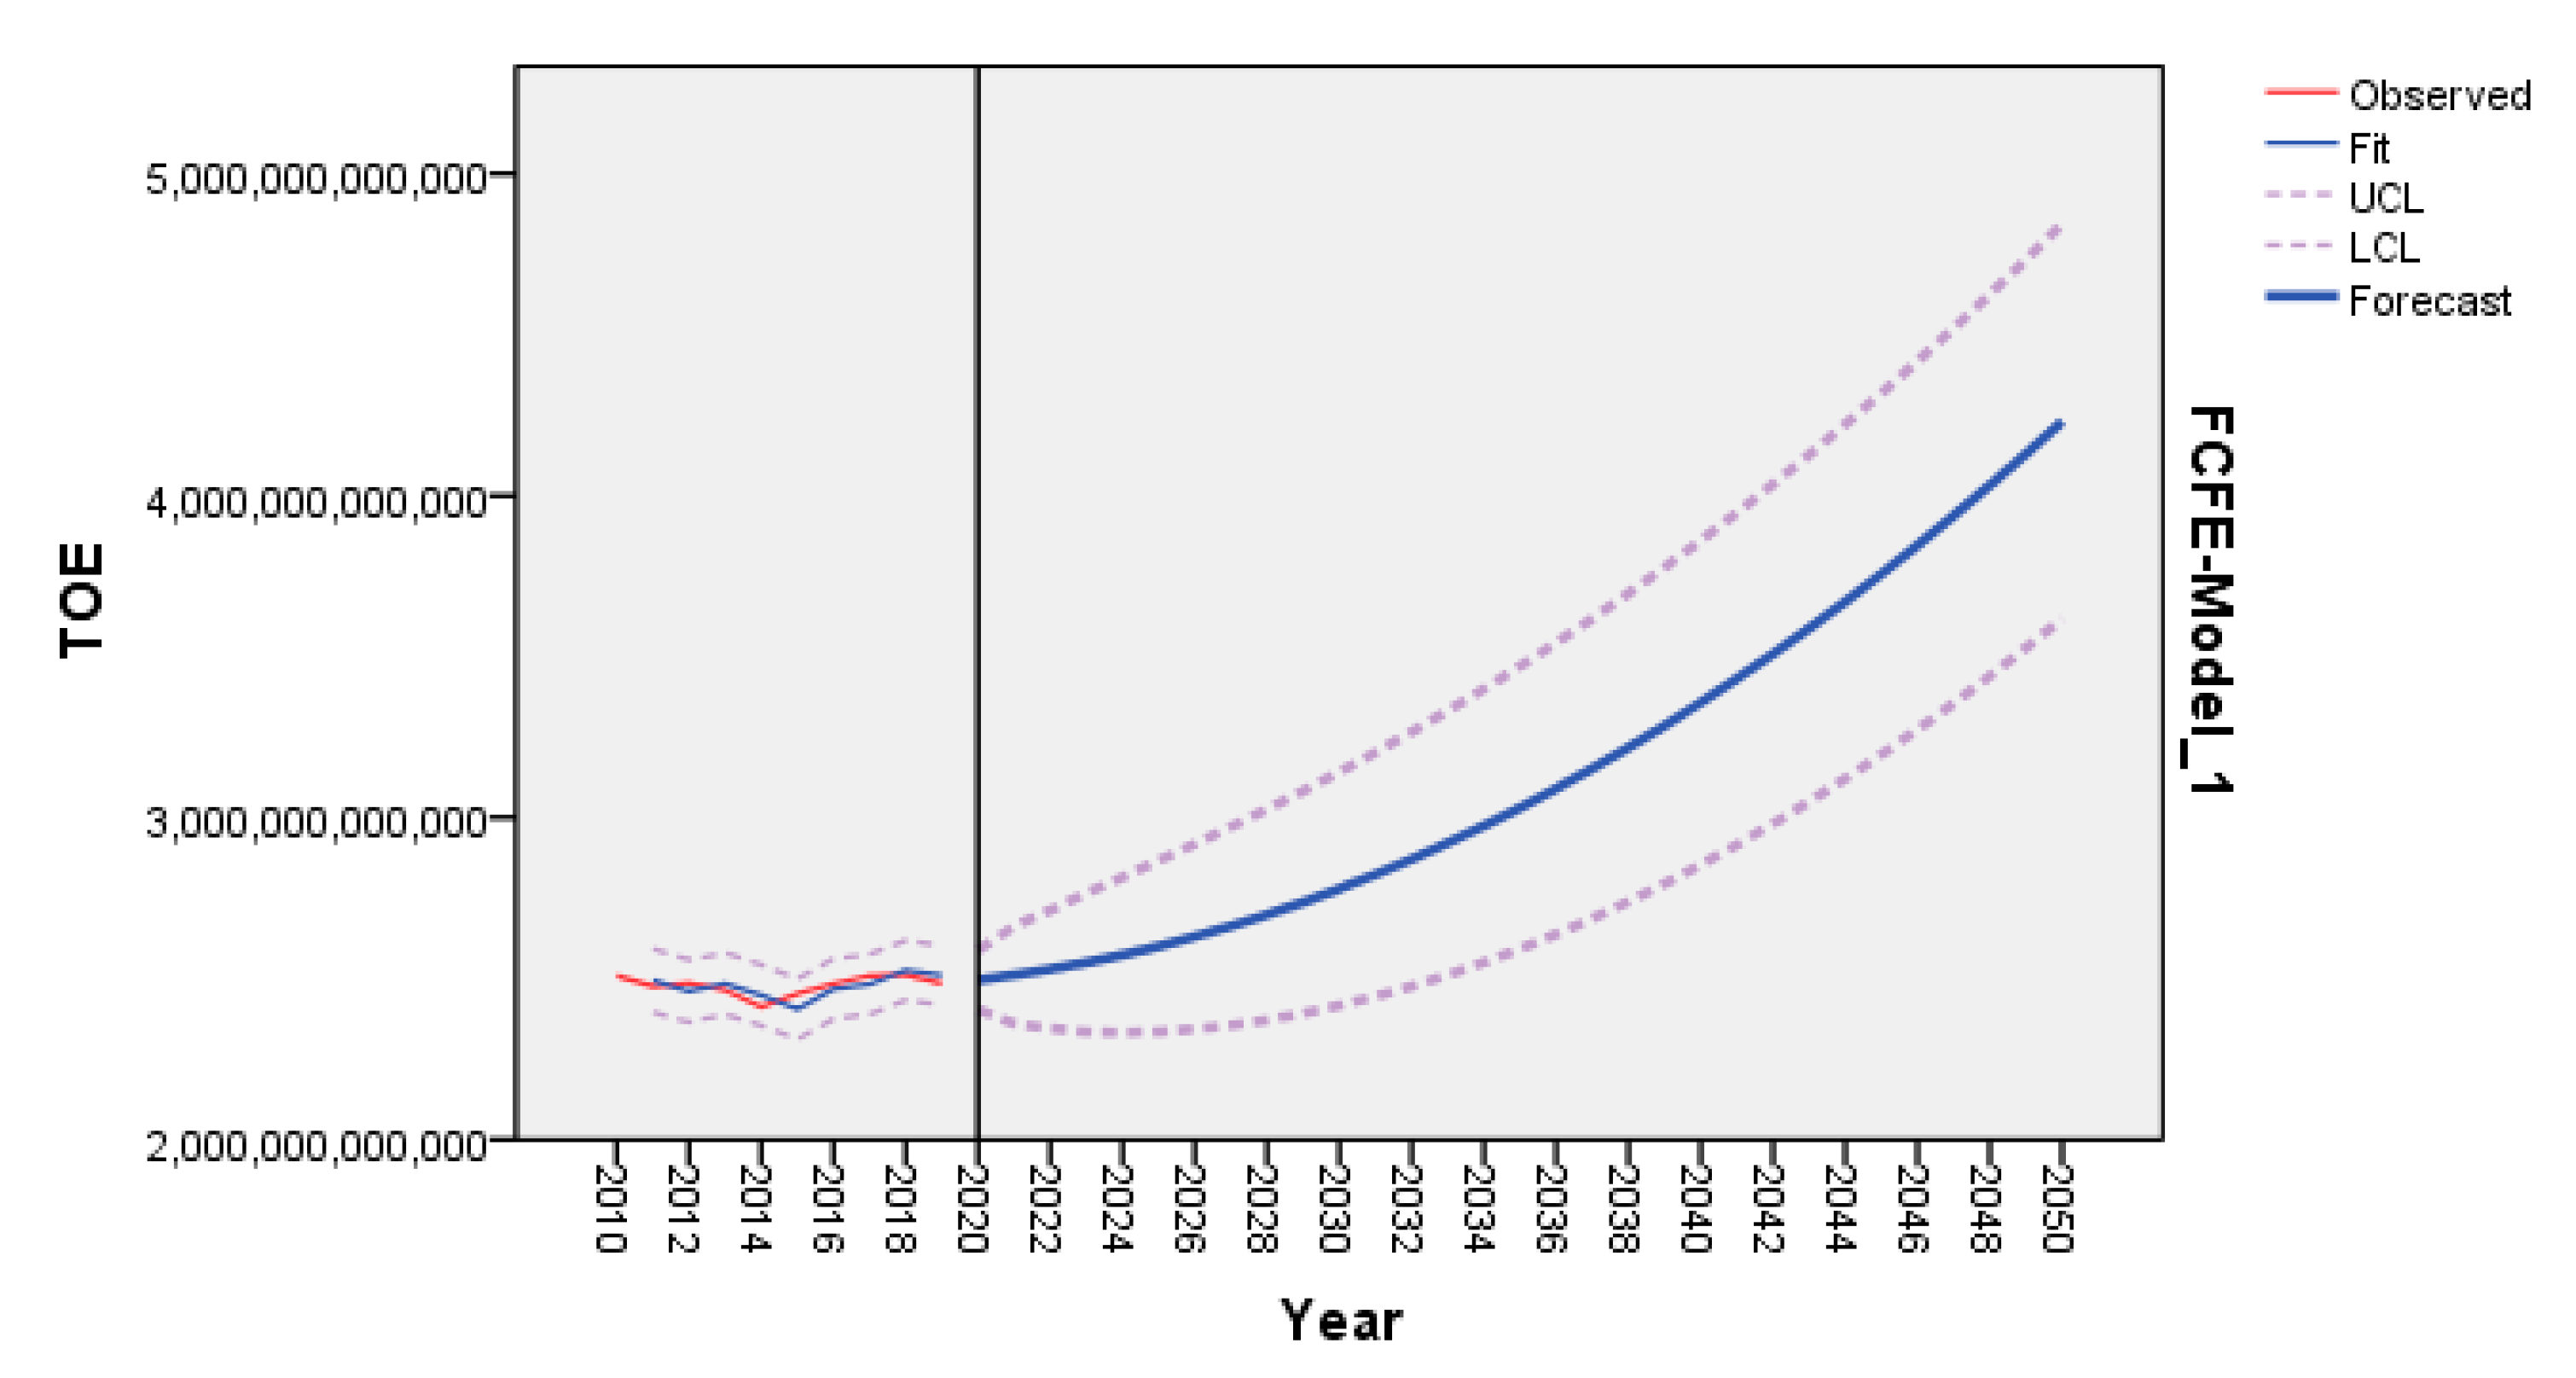
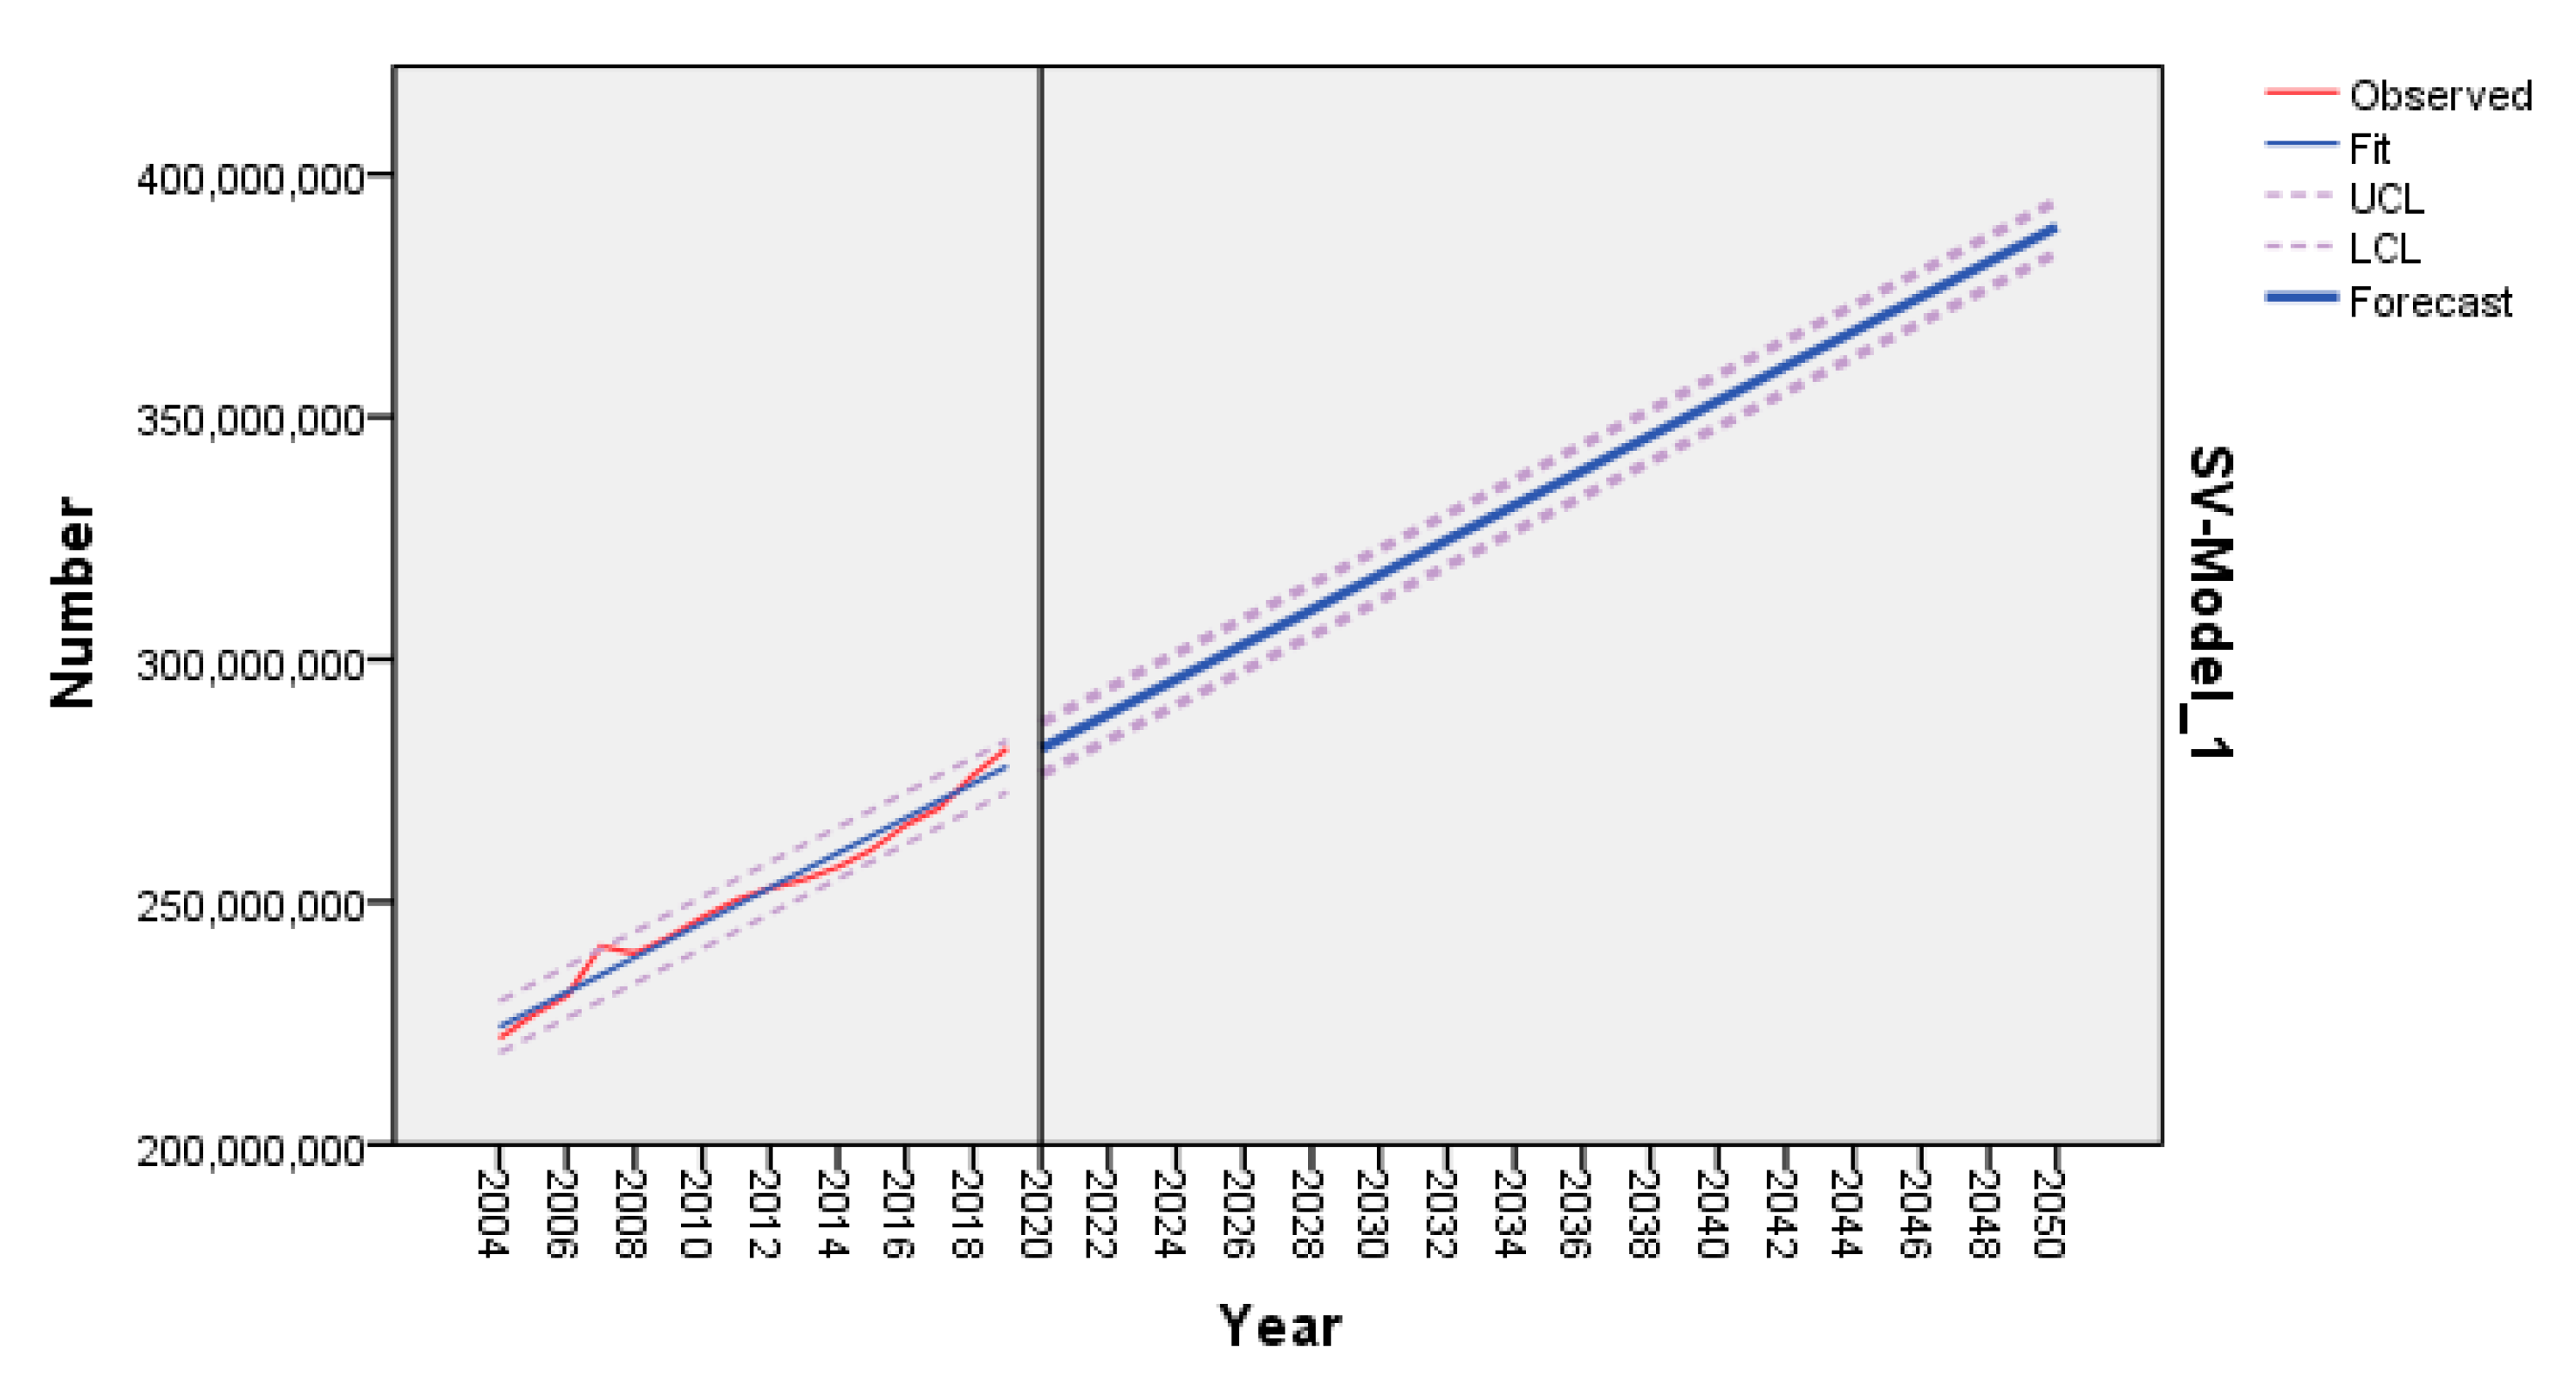
3.1. Selected Variable

To study the impact of removable electric batteries as storage capacities for adjusting the energy system, we used several variables based on data collected throughout the European Union from the Eurostat database.
FCFE represents the final energy consumption for the electricity source [51]. Therefore, we collected the data measured in Toe (Tonnes of oil equivalent) for this variable, subsequently converting to KWh (1 toe = 11,630 Kwh).
SRTe_share represents the share of the total electricity consumed from renewable sources [52], and SRTe means the total electricity consumed from renewable sources. Therefore, we calculated SRTe directly in KWh based on FCFE and SRTe share.
SRTen is the amount of electricity from renewable sources that cannot be used and consumed at the time of production (due to the under-sizing of the transmission network or lack of demand).
SV represents the total number of vehicles used in the European Union for transport [53], while SEV represents the number of vehicles powered by stored potential renewable energy.

3.2. Research Hypothesis

The large-scale deployment of renewable energy sources will decentralize and increase electricity production. As a result, by 2050, approximately 80% of electricity will come from renewable energy sources, with electricity providing half of the E.U.’s final energy demand (which implies approximately 40% of all energy produced in 2050). Production will increase up to 2.5 times above current levels to achieve the European Commission’s [54] emission reduction target. As a result of these estimates, we have established the first research hypothesis that verifies the feasibility of the European Union’s objective based on past trends.
Hypothesis 1 (H1).
Renewable energy production (SRETe), at the E.U. level, will account for 40% of total energy consumed in 2050 (all sectors), which means 80% of the total electricity consumed in 2050.
Electricity from renewable sources is produced at non-standard hours when consumption is reduced. Therefore, a significant part cannot be consumed and used, despite network optimization and resizing. Therefore, a storage solution is needed to replace classic solutions (inverters, storage in conventional batteries), as fossil fuel energy production (which can be programmed, thus ensuring the balance of the energy system at present) will decrease considerably. Given Zerrahna et al. [9] allegations, we have taken into account (as a working hypothesis) that a percentage of 30% of all electricity produced from renewable sources (SRTe) cannot be used and consumed at the time of production and must be stored, defining the variable (SRTen). Based on this assumption, we formulated the second hypothesis, which aims to establish whether the amount of electricity that cannot be used and consumed at the time of production (SRTen) can be stored in removable modular batteries, for which there will be demand until the level of 2050.
Hypothesis 2 (H2).
At the level of 2050, there will be demand for removable modular batteries (used in electric vehicles) that can take the amount of unsolicited electricity on the market at the time of production (SRTen), ensuring its storage and mobility.
To test the hypothesis, we will determine the number of electric vehicles powered by potential renewable energy obtained by storing quantities that cannot be used and consumed at the time of production (SEV). Then we will compare this number of potential electric vehicles with the number of vehicles estimated based on the historical trend for 2050 (estimates based on SV). Furthermore, we assume that all vehicles will be electric by 2050, according to the E.U. Transport White Paper [1]. Finally, we will consider an average consumption of 0.2 Kwh/km (consumption calculated according to [55]) and an average annual distance traveled of 12,000 km/vehicle (average length assumed based on [56]).

3.3. Research Methods

Given the paper’s purpose, which involves analyzing time series to create predictive models for the selected variables [57,58], we used the ARIMA (autoregressive integrated moving average) model, representing a generalization of the autoregressive moving average (ARMA) model. Both models are used to understand the historical evolution of the researched data and make forecasts based on independent variables (other variables in full correlation with the studied variables or the time variable). The condition of using the ARIMA model is that the data is non-stationary according to the average data series and that the initial differentiation step can be applied continuously to remove the non-stationarity of the mean [57]. We will use the non-seasonal ARIMA (p, d, q) model for the selected variables, including three parameters p, d, and q (positive integers). Parameter p represents the order (number of gaps) of the self-regressive model. Parameter d means the degree of differentiation (how many times the step in the regressive model has been used). Parameter q represents the order of the model with a moving average [58].
An ARIMA (p, d, q) model is given by the following formula [57]:
( 1 i = 1 p φ i L i ) ( 1 L ) d X t = ( 1 + i = 1 q θ i L i ) ε t
where X t —data series, L —lag operator, φ i —parameters of the autoregressive part of the model, θ i —parameters of the moving average part, ε t —error.
The ARIMA model (p, d, q) is used in the paper to forecast developments in energy production, the share of renewable energy in total energy, renewable energy losses, and the stock of vehicles.

4. Results

In order to assess the impact that the paradigm shift in road transport (switching from fossil fuel-based to electricity-based propulsion) could have on the energy system in general and on energy from renewable sources in particular, we have made a series of forecasts on the indicators selected in Table A1 of Appendix A. We presented in tabular form the historical evolutions of the data collected from the Eurostat database [51,52,53] and calculated based on the assumptions made in the paper.
To investigate the first hypothesis (H1), we applied an ARIMA prediction model (0,0,0) to the variable SRTe_share (part of the total electricity consumed from renewable sources). Then, having time as an independent variable and based on historical developments in 2010–2019, we made the predictions for the period 2020–2050. Table 1 shows indicators illustrating the fit model.
Table A2 of Appendix A shows the forecast values for 2020–2050 according to the ARIMA model (0,0,0). Figure 2 illustrates the developments of the variable SRTe_share in the period 2020–2050.
Figure 2 and the values shown in Table A2 of Appendix A show that the H1 hypothesis is invalidated if the historical trend is maintained. In 2025, renewable energy production (SRETe) will account for 74.31% of the total electricity consumed in 2050, with the 80% share (The European Union’s target) expected to be achieved in 2055.
We have determined predictions for the FCFE variable (final energy consumption for the electricity source) based on historical trends to forecast the absolute values of renewable energy production. Table 2 shows indicators illustrating the fit model.
The forecast values for the period 2020–2050 according to the ARIMA model (1,1,1) are shown in Table A2 of Appendix A. Figure 3 illustrates the developments of the FCFE variable in the period 2020–2050.
Based on the values obtained for the SRETe_share and the forecast values for FCFE (final energy consumption for the electricity source), obtained from the application of an ARIMA Predictive Model (1,1,1), we calculated the forecast values of SRETe (as can be seen in Table A2 of Appendix A). Based on the SRETe values, we determined the forecast values for the SRETen variable (the amount of electricity from renewable sources that cannot be used and consumed at the time of production). As a working hypothesis, we used the assumption that 30% of all renewable electricity (SRTe) cannot be used and consumed at the time of production and should be stored (SRTen), based on [9].
The second hypothesis (H2) would investigate the level of potential demand for removable modular batteries (used in electric vehicles) if they were used as a means of storing the amount of unsolicited electricity on the market at the time of production (SRTen), ensuring the storage and adjustment of the energy system. Starting from working hypotheses based on previous research [1,56,57], the average annual distance traveled by a vehicle (12,000 km/vehicle), the average consumption of an electric motor vehicle (0.2 Kwh/km) and the replacement of fossil-powered vehicles with electric vehicles by 2050, we have determined the number of potential electric vehicles that can be powered by potential renewable energy obtained by storing quantities that cannot be used and consumed at the time of production (EVS). The possible evolution of this variable was calculated for the period 2020–2050 based on the amount of energy that cannot be used and consumed at the time of production to be stored (SRTen), and the assumptions on the average annual distance and consumption per kilometer of electric vehicles. To be able to compare the SEV variable with the SV variable (the total number of vehicles used in the European Union for transport), in the forecast period 2020–2050, we applied an ARIMA Predictive Model (0,0,0) to the SV variable, starting from historical trends (shown in Table A1 of Appendix A). Table 3 shows the indicators that illustrate the fit model.
The forecast values for the period 2020–2050 according to the ARIMA model (0,0,0) are shown in Table A2 of Appendix A. Figure 4 illustrates the developments of the SV variable in the period 2020–2050.
Figure 4 and the values shown in Table A2 of Appendix A indicate that the H2 hypothesis is validated. Figure 5 comparatively illustrates the forecasted trends for the SV and SEV variables.
Figure 5 shows a balancing of the two variables at the level of 2039, starting from 2040, the variable SEV exceeding the SV. At the level of 2050, there will be demand for removable modular batteries (used in electric vehicles) that can take over some of the amount of unsolicited electricity on the market at the time of production (SRTen), ensuring its storage and mobility. The energy resulting from the variability of renewable sources, which cannot be taken up by the removable modular batteries used in electric vehicles, can be taken over by the removable modular batteries used for residential or industrial purposes. Solutions for variable renewable energy generation peaks, such as geographic balancing [20,23,24], demand management [14], and flexible use of renewable energy sources in other sectors such as heat or mobility [18] can also be used.

5. Discussion

With the 2015 Paris Agreement, states worldwide have set a series of targets to reduce greenhouse gas emissions to combat climate change across the globe [59]. The most crucial strategy for building a low-carbon economy is increasing renewable energy sources, gradually giving up fossil fuel-based sources. Depending on geographical characteristics, some countries have invested in the development of hydro, geothermal, or biomass-based energy sources. However, wind and solar photovoltaic energy, which occupies an increasingly important place in the total energy produced, has been chosen in countries that do not have such possibilities. Because of the European Union’s ambitious objective of increasing gross electricity consumption from renewable sources to at least 80% of total electricity produced by 2050 [54] and evolving from a 15.7% share in 2004 to 34.1% in 2019, a massive expansion of wind and solar energy use is needed.
Increasing the share of renewable energy sources in total energy produced is crucial to minimize climate change. However, given the limited electricity storage capacity and the expanding storage requirements, the further expansion of wind and solar energy sources, characterized by temporal variability, is limited [8,9]. This is why solutions are needed to store renewable energy produced at times when there is insufficient demand. As we have shown in our research by comparing trends obtained by predictive models, one of the most viable solutions is the use of removable batteries for electric vehicles, keeping eyes on the objectives of the European Union about electric vehicles [1].
Following the running of predictive models on data on energy production, the share of renewable energy in total energy, renewable energy losses, and the European Union’s stock of vehicles, we have concluded that the storage of electricity in removable batteries is one of the solutions for the transition to renewable energy predominant in the total energy produced.
The electricity generated by wind and solar power plants is characterized by temporal and spatial variability, depending on exogenous weather conditions [8,9,60,61]. This is a significant disadvantage compared to conventional plants (using coal or natural gas) to produce electricity at a reasonable price whenever needed. Production plants can be switched off and switched on whenever energy is required in the market. Maintaining the stability of the supply system under the conditions of an already undersized network concerning demand requires a total correlation of supply with electricity demand. The temporal incongruity of supply and demand, generated by the variability of solar and wind energy sources, raises two fundamental complementary questions: what do we do with excess renewable energy at times when there is too much supply and how we will cover demand at times when renewable energy supply is low [7,8,9]. The easiest solution is to store electricity, and removable batteries on electric vehicles answer both questions. The storage of electricity in removable batteries on electric vehicles allows electricity transmission both in space and time. It can be a successful business model that serves two objectives: a cleaner environment using green energy for vehicle propulsion and efficient management of potential losses from renewable energy variability.

6. Conclusions

The strategy that can efficiently manage losses resulting from generating electricity with renewable sources when demand cannot take over the entire supply involves storing the surplus of renewable energy. Given that the integration of increasing quantities requires an oversizing of storage capacity, which is currently not economically efficient, an innovative solution is needed [8,9,17,62]. Such an innovative solution must avoid inefficiently high storage costs and balance investment in storage, renewables, and other capacities.
Classical energy production sources ensure the adjustment of the energy system through their temporal adaptability since they can provide energy when requested and can reduce or increase relatively flexibly the amount of energy supplied, depending on the installed power and the specifics of the production process. Instead, the removable battery system adjusts the energy system by taking over the amount of electricity that cannot be used and consumed at the time of production and storing it. Thus, consumers can use it or return it to the energy system when additional energy is demanded. As a result of the fact that most energy markets worldwide require a minimum capacity to participate, it is necessary to have a large number of electric vehicles using removable batteries that can ensure the adjustment of the entire energy system. Answering the research question, we analyze the viability of the solution of taking over the surplus of energy produced by renewable sources (at times when the classical grid cannot take over this surplus) within an integrated energy system that would use the removable batteries of electric vehicles for storage and adjustments. The conclusion we have reached is that the storage of electricity in removable batteries on electric vehicles will allow electricity transport without being burdened by temporal or spatial boundaries. Our paper has made a modest contribution to analytical research on the impact of the paradigm shift in road transport (from fossil fuel-based to electricity-based propulsion) on more efficient management of variable renewable energy, characterized by uncertainty. Among the limitations of our research worth mentioning is the focus is only on storing energy from unsolicited renewable sources on the market at the production moment. Another limitation is that the study considers static data on the average consumption of an electric car, the average number of km traveled by a vehicle (without making predictions on technological advances). Potential future research directions may expand the study to several variables, considering technical progress and other methods of efficient management of renewable energy sources, which can reduce the excess energy produced by renewable sources when the classical grid cannot take over this surplus.

Author Contributions

Conceptualization, C.G.B., and A.A.V.; methodology, C.G.B., and A.A.V.; software, C.G.B.; validation, A.T.A.-F., S.D., D.L.D., and M.C.R.B.; formal analysis, A.T.A.-F., S.D., D.L.D., and M.C.R.B.; investigation, C.G.B., and AAV; resources, A.T.A.-F., S.D., D.L.D., M.C.R.B.; data curation, C.G.B.; writing—original draft preparation, C.G.B.; writing—review and editing, C.G.B., A.A.V., A.T.A.-F., S.D., D.L.D., M.C.R.B.; visualization, A.A.V.; supervision, C.G.B.; project administration, C.G.B. All authors have read and agreed to the published version of the manuscript.

Funding

This research received no external funding.

Institutional Review Board Statement

Not applicable.

Informed Consent Statement

Not applicable.

Data Availability Statement

Data can be found at web addresses: Eurostat, https://appsso.eurostat.ec.europa.eu/nui/submitViewTableAction.do (accessed on 28 June 2021); Eurostat, https://appsso.eurostat.ec.europa.eu/nui/submitViewTableAction.do (accessed on 28 June 2021); Eurostat, https://ec.europa.eu/eurostat/databrowser/view/TRAN_R_VEHST__custom_1105130/default/table?lang=en (accessed on 28 June 2021).

Conflicts of Interest

The authors declare no conflict of interest.

Appendix A

Table A1. Historical trends of selected data.
YearFCFE
(toe)
FCFE
(kwh)
SRTe Share
(%)
SRTe
(kwh)
SRTen
(kwh)
SV
(Number)
2010215,697,9282,508,566,902,64021.3534,324,750,262228,996,321,541246,780,541
2011212,912,8202,476,176,096,60023.32577,444,265,727247,476,113,883250,392,058
2012213,722,0932,485,587,941,59025.15625,125,367,310267,910,871,704252,759,003
2013211,895,4452,464,344,025,35026.85661,676,370,806283,575,587,488254,593,235
2014207,395,4622,412,009,223,06028.68691,764,245,174296,470,390,789257,176,539
2015210,895,2732,452,712,024,99029.66727,474,386,612311,774,737,119260,787,022
2016213,621,4352,484,417,289,05030.16749,300,254,377321,128,680,447265,787,532
2017215,740,6192,509,063,398,97031.09780,067,810,740334,314,776,031269,370,978
2018215,972,9312,511,765,187,53032.18808,286,037,347346,408,301,720276,127,390
2019213,650,6722,484,757,315,36034.08846,805,293,075362,916,554,175281,677,483
Table A2. Forecasts for data series selected using ARIMA.
YearFCFE
(kwh)
SRTe Share
(%)
SRTe
(kwh)
SRTen
(kwh)
SEV
(Number)
SV
(Number)
20202,495,754,808,36035.33881,750,173,794377,892,931,626157,455,388281,572,610
20212,511,413,464,27736.62919,679,610,618394,148,404,551164,228,502285,157,790
20222,528,970,622,35437.92958,985,659,997410,993,854,284171,247,439288,742,971
20232,550,133,479,26739.221,000,162,350,569428,641,007,387178,600,420292,328,151
20242,573,847,066,36640.521,042,922,831,292446,966,927,696186,236,220295,913,331
20252,600,763,305,52241.821,087,639,214,369466,131,091,873194,221,288299,498,511
20262,630,479,339,14643.121,134,262,691,040486,112,581,874202,546,909303,083,692
20272,663,244,114,61244.421,183,013,035,711507,005,586,733211,252,328306,668,872
20282,698,903,793,94745.721,233,938,814,593528,830,920,540220,346,217310,254,052
20292,737,553,441,90947.021,287,197,628,386551,656,126,451229,856,719313,839,232
20302,779,134,312,87048.321,342,877,699,979575,519,014,277239,799,589317,424,412
20312,823,682,708,91449.621,401,111,360,163600,476,297,213250,198,457321,009,593
20322,871,176,197,03150.921,462,002,919,528626,572,679,798261,071,950324,594,773
20332,921,628,639,78452.221,525,674,475,695653,860,489,584272,441,871328,179,953
20342,975,031,470,75053.521,592,236,843,145682,387,218,491284,328,008331765133
20353,031,389,983,58254.821,661,807,989,000712,203,423,857296,751,427335,350,314
20363,090,700,907,04756.121,734,501,349,035743,357,721,015309,732,384338,935,494
20373,152,966,262,61757.421,810,433,227,995775,899,954,855323,291,648342,520,674
20383,218,184,801,11558.721,889,718,115,215809,879,192,235337,449,663346,105,854
20393,286,357,294,47460.021,972,471,648,143845,344,992,061352,227,080349,691,035
20403,357,483,265,67661.322,058,808,738,513882,346,602,220367,644,418353,276,215
20413,431,563,009,49662.622,148,844,756,546920,933,467,091383,722,278356,861,395
20423,508,596,343,77663.912,242,343,923,307961,004,538,560400,418,558360,446,575
20433,588,583,381,08265.212,340,115,222,8041,002,906,524,059417,877,718364,031,755
20443,671,524,051,85366.512,441,930,646,8871,046,541,705,809436,059,044367,616,936
20453,757,418,399,07467.812,547,905,416,4121,091,959,464,177454,983,110371,202,116
20463,846,266,396,18369.112,658,154,706,4021,139,209,159,887474,670,483374,787,296
20473,938,068,059,59470.412,772,793,720,7601,188,340,166,040495,141,736378,372,476
20484,032,823,379,16471.712,891,937,645,1991,239,401,847,942516,417,437381,957,657
20494,130,532,361,16173.013,015,701,676,8841,292,443,575,807538,518,157385,542,837
20504,231,195,001,71174.313,144,201,005,7711,347,514,716,759561,464,465389,128,017

References

  1. EVUE. Electric Vehicle in Urban Europe. 2012. Available online: https://urbact.eu/file/2015/download?token=lnO3HY-H (accessed on 5 June 2021).
  2. Mohammad, A.; Zamora, R.; Lie, T.T. Integration of Electric Vehicles in the Distribution Network: A Review of P.V. Based Electric Vehicle Modelling. Energies 2020, 13, 4541. [Google Scholar] [CrossRef]
  3. Braun, M.; Büdenbender, K.; Magnor, D.; Jossen, A. Photovoltaic Self-Consumption in Germany Using Lithium-Ion Storage to Increase Self-Consumed Photovoltaic Energy. In The Compiled State-of-the-Art of P.V. Solar Technology and Deployment, Proceedings of the 24th European Photovoltaic Solar Energy Conference and Exhibition, Hamburg, Germany, 21–25 September 2009; Sinke, W., Ed.; EU PVSEC: Munich, Germany, 2009. [Google Scholar]
  4. Bost, M.; Hirschl, B.; Aretz, A. Effekte von Eigenverbrauch und Netzparität bei der Photovoltaik: Beginn der Dezentralen Energierevolution oder Nischeneffekt; Greenpeace Energy eG: Berlin/Hamburg, Germany, 2011. [Google Scholar]
  5. Colmenar-Santos, A.; Campiñez-Romero, S.; Pérez-Molina, C.; Castro-Gil, M. Profitability analysis of grid-connected photovoltaic facilities for household electricity self-sufficiency. Energy Policy 2012, 51, 749–764. [Google Scholar] [CrossRef]
  6. Perez-Arriaga, I.; Batlle, C. Impacts of intermittent renewables on electricity generation system operation. Econ. Energy Environ. Policy 2012, 1, 3–17. [Google Scholar] [CrossRef] [Green Version]
  7. Brown, T.W.; Bischof-Niemz, T.; Blok, K.; Breyer, C.; Lund, H.; Mathiesen, B.V. Response to ‘Burden of proof: A comprehensive review of the feasibility of 100% renewable-electricity systems’. Renew. Sustain. Energy Rev. 2018, 92, 834–847. [Google Scholar] [CrossRef]
  8. Sinn, H.-W. Buffering volatility: A study on the limits of Germany’s energy revolution. Eur. Econ. Rev. 2017, 99, 130–150. [Google Scholar] [CrossRef]
  9. Zerrahn, A.; Schilla, W.-P.; Kemferta, C. On the economics of electrical storage for variable renewable energy sources. Eur. Econ. Rev. 2018, 108, 259–279. [Google Scholar] [CrossRef]
  10. Pfenninger, S.; Hawkes, A.; Keirstead, J. Energy systems modeling for twenty-first-century energy challenges. Renew. Sustain. Energy Rev. 2014, 33, 74–86. [Google Scholar] [CrossRef]
  11. Pfenninger, S. Energy scientists must show their workings. Nature 2017, 542, 393. [Google Scholar] [CrossRef]
  12. Blanco, H.; Faaij, A. A review at the role of storage in energy systems with a focus on power to gas and long-term storage. Renew. Sustain. Energy Rev. 2018, 81, 1049–1086. [Google Scholar] [CrossRef]
  13. Zerrahn, A.; Schill, W.-P. Long-run power storage requirements for high shares of renewables: Review and a new model. Renew. Sustain. Energy Rev. 2017, 79, 1518–1534. [Google Scholar] [CrossRef]
  14. Schill, W.-P.; Zerrahn, A. Long-Run power storage requirements for high shares of renewables: Results and sensitivities. Renew. Sustain. Energy Rev. 2018, 83, 156–171. [Google Scholar] [CrossRef]
  15. Scholz, Y.; Gils, H.C.; Pietzcker, R.C. Application of a high-detail energy system model to derive power sector characteristics at high wind and solar shares. Energy Econ. 2017, 64, 568–582. [Google Scholar] [CrossRef] [Green Version]
  16. Cebulla, F.; Naegler, T.; Pohl, M. Electrical energy storage in highly renewable European energy systems: Capacity requirements, spatial distribution, and storage dispatch. J. Energy Storage 2017, 14, 211–223. [Google Scholar] [CrossRef] [Green Version]
  17. Denholm, P.; Hand, M. Grid flexibility and storage required to achieve very high penetration of variable renewable electricity. Energy Policy 2011, 39, 1817–1830. [Google Scholar] [CrossRef]
  18. Budischak, C.; Sewell, D.; Thomson, H.; Mach, L.; Veron, D.E.; Kempton, W. Cost-Minimized combinations of wind power, solar power and electro-chemical storage, powering the grid up to 99.9% of the time. J. Power Sources 2013, 225, 60–74. [Google Scholar] [CrossRef] [Green Version]
  19. Jacobson, M.Z.; Delucchi, M.A.; Cameron, M.A.; Frew, B.A. Low-Cost solution to the grid reliability problem with 100% penetration of intermittent wind, water, and solar for all purposes. Proc. Natl. Acad. Sci. USA 2015, 112, 15060–15065. [Google Scholar] [CrossRef] [Green Version]
  20. MacDonald, A.E.; Clack, C.T.M.; Alexander, A.; Dunbar, A.; Wilczak, J.; Xie, Y. Future cost-competitive electricity systems and their impact on U.S. CO emissions. Nat. Clim. Chang. 2016, 6, 526–531. [Google Scholar] [CrossRef]
  21. de Sisternes, F.J.; Jenkins, J.D.; Botterud, A. The value of energy storage in decarbonizing the electricity sector. Appl. Energy 2016, 175, 368–379. [Google Scholar] [CrossRef] [Green Version]
  22. Denholm, P.; Mai, T. Timescales of Energy Storage Needed for Reducing Renewable Energy Curtailment; Technical Report; National Renewable Energy Laboratory: Golden, CO, USA, 2017; Available online: https://www.nrel.gov/docs/fy17osti/68960.pdf (accessed on 12 June 2021).
  23. Fürsch, M.; Hagspiel, S.; Jägemann, C.; Nagl, S.; Lindenberger, D.; Tröster, E. The role of grid extensions in a cost-efficient transformation of the European electricity system until 2050. Appl. Energy 2013, 104, 642–652. [Google Scholar] [CrossRef] [Green Version]
  24. Haller, M.; Ludig, S.; Bauer, N. Decarbonization scenarios for the E.U. and MENA power system: Considering spatial distribution and short term dynamics of renewable generation. Energy Policy 2012, 36, 149–184. [Google Scholar] [CrossRef]
  25. Lund, P.D.; Lindgren, J.; Mikkola, J.; Salpakari, J. Review of energy system flexibility measures to enable high levels of variable renewable electricity. Renew. Sustain. Energy Rev. 2015, 45, 785–807. [Google Scholar] [CrossRef] [Green Version]
  26. Lisin, A.; Senjyu, T. Renewable Energy Transition: Evidence from Spillover Effects in Exchange-Traded Funds. Int. J. Energy Econ. Policy 2021, 11, 1–6. [Google Scholar] [CrossRef]
  27. Lisin, A. Prospects and Challenges of Energy Cooperation between Russia and South Korea. Int. J. Energy Econ. Policy 2020, 10, 130–135. [Google Scholar] [CrossRef]
  28. van de Vegte, H. Overview of Potential Locations for New Pumped Storage Plants in EU 15, Switzerland and Norway. Deliverable D4.2 Final Report of the Research Project eSTORAGE within the Seventh EU Framework Programme. 2015. Available online: http://www.estorage-project.eu/wp-content/uploads/2013/06/eStorage_D4.2-Overview-of-potential-locations-for-new-variable-PSP-in-Europe.pdf (accessed on 12 February 2018).
  29. Yang, S.X.; Zhang, D.; Fu, J.; Fan, S.; Ji, Y. Market cultivation of electric vehicles in China: Survey based on consumer behavior. Sustainability 2018, 10, 4056. [Google Scholar] [CrossRef] [Green Version]
  30. Boyle, G. Renewable Energy: Power for a Sustainable Future, 3rd ed.; Oxford University Press: Oxford, UK, 2012. [Google Scholar]
  31. Cho, Y.; Blommestein, K.V. Investigating the Adoption of Electric Vehicles Using Agent-based Model. In Proceedings of the 2015 Portland International Conference Management Engineering Technology, Portland, OR, USA, 2–6 August 2015; pp. 2337–2345. [Google Scholar]
  32. Mersky, A.C.; Sprei, F.; Samaras, C.; Qian, Z.S. Effectiveness of incentives on electric vehicle adoption in Norway. Transp. Res. Part D Transp. Environ. 2016, 46, 56–68. [Google Scholar] [CrossRef] [Green Version]
  33. Longo, M.; Zaninelli, D.; Viola, F.; Romano, P.; Miceli, R. How Is the Spread of the Electric Vehicles? In Proceedings of the 2015 IEEE 1st International Forum on Research and Technologies for Society and Industry Leveraging a Better Tomorrow (RTSI), Turin, Italy, 16–18 September 2015; pp. 439–445. [Google Scholar] [CrossRef]
  34. Wang, E.Q. Research on Business Mode and Planning of E.V.’s Charging Facilities. Master’s Thesis, North China Electric Power University, Beijing, China, 2012. [Google Scholar]
  35. Zhang, X.R. Research on policy promotion mechanism optimization of technological innovation in electric vehicle industry. Manag. Adm. 2019, 5, 88–92. [Google Scholar]
  36. Gong, L.Y. Study on New Energy Vehicles Application Strategies in Transportation Industry. In Proceedings of the 2016 2nd International Conference on Energy Equipment Science and Engineering, Guangzhou, China, 12–14 November 2016. [Google Scholar]
  37. Vander Steen, M.; Van Schelven, R.; Kotter, R.; Van Twist, M.; Peter van Deventer, M.E.V. Policy compared: An international comparison of governments policy strategy towards e-mobility. In E-Mobility in Europe; Springer: Berlin/Heidelberg, Germany, 2015; pp. 27–53. [Google Scholar]
  38. Mishina, V.Y.; Khomyakova, L.I. Dedollarization and settlements in national currencies: Eurasian and Latin American experience. Vopr. Ekon. 2020, 9, 61–79. [Google Scholar] [CrossRef]
  39. Mikhaylov, A. Development of Friedrich von Hayek’s theory of private money and economic implications for digital currencies. Terra Econ. 2021, 19, 53–62. [Google Scholar] [CrossRef]
  40. Mikhaylov, A. Cryptocurrency Market Analysis from the Open Innovation Perspective. J. Open Innov. Technol. Mark. Complex. 2020, 6, 197. [Google Scholar] [CrossRef]
  41. Harrysson, S.; Ulmefors, M.; Kazlova, A. Overview and Analysis of Electric Vehicle Incentives Applied across Eight Selected Country Markets; Technical Report; Blekinge Institute of Technology, The Department for Strategic Sustainable Development: Blekinge, Sweden, 2015. [Google Scholar]
  42. Bocken, N.M.P.; Short, S.W.; Rana, P.; Evans, S. A literature and practice review to develop sustainable business model archetypes. J. Clean. Prod. 2014, 65, 42–56. [Google Scholar] [CrossRef] [Green Version]
  43. Wang, Y.; Jin, L.; Xiao, K.; Jia, H.G.; Li, Z.H. The Government Subsidy Research of New Energy Sedan Industry Based on the Consumer Demand. Adv. Mater. Res. 2013, 711, 446–451. [Google Scholar] [CrossRef]
  44. Cheyunwang. How to Turn Better Place into a Dead End. Available online: http://www.cheyun.com/content/1837 (accessed on 18 June 2019).
  45. Luntan. The Failure of Better Place and Tesla. Available online: http://club.autohome.com.cn/bbs/thread/9263471c0eda58fc/73669881-1.html (accessed on 20 June 2019).
  46. Shepero, M.; Munkhammar, J.; Widen, J.; Bishop, J.D.; Boström, T. Modeling of photovoltaic power generation and electric vehicles charging on city-scale: A review. Renew. Sustain. Energy Rev. 2018, 89, 61–71. [Google Scholar] [CrossRef] [Green Version]
  47. Pasaoglu, G.; Fiorello, D.; Martino, A.; Zani, L.; Zubaryeva, A.; Thiel, C. Travel patterns and the potential use of electric cars—Results from a direct survey in six European countries. Technol. Forecast. Soc. Chang. 2014, 87, 51–59. [Google Scholar] [CrossRef]
  48. Jordehi, A.R. Optimisation of demand response in electric power systems, a review. Renew. Sustain. Energy Rev. 2019, 103, 308–319. [Google Scholar] [CrossRef]
  49. Strbac, G. Demand side management: Benefits and challenges. Energy Policy 2008, 36, 4419–4426. [Google Scholar] [CrossRef]
  50. Kempton, W.; Letendre, S. Electric vehicles as a new power source for electric utilities. Transp. Res. Part D Transp. Environ. 1997, 2, 157–175. [Google Scholar] [CrossRef]
  51. Eurostat, 1. Final Energy Consumption by Product. Electricity. Available online: https://appsso.eurostat.ec.europa.eu/nui/submitViewTableAction.do (accessed on 15 June 2021).
  52. Eurostat, 2. Share of Renewable Energy in Gross Final Energy Consumption by Sector. Electricity. Available online: https://appsso.eurostat.ec.europa.eu/nui/submitViewTableAction.do (accessed on 15 June 2021).
  53. Eurostat, 3. Stock of Vehicles by Category and NUTS 2 Regions. Available online: https://ec.europa.eu/eurostat/databrowser/view/TRAN_R_VEHST__custom_1105130/default/table?lang=en (accessed on 16 June 2021).
  54. European Commission. Going Climate Neutral by 2050. 2019. Available online: https://op.europa.eu/en/publication-detail/-/publication/92f6d5bc-76bc-11e9-9f05-01aa75ed71a1 (accessed on 17 June 2021).
  55. Electric Vehicle Database Energy Consumption of Full Electric Vehicles. 2021. Available online: https://ev-database.org/cheatsheet/energy-consumption-electric-car (accessed on 18 June 2021).
  56. Odyssee-Mure. Change in Distance Travelled by Car. 2021. Available online: https://www.odyssee-mure.eu/publications/efficiency-by-sector/transport/distance-travelled-by-car.html (accessed on 19 June 2021).
  57. Hamilton, J. Time Series Analysis; Princeton University Press: Princeton, NJ, USA, 1994. [Google Scholar]
  58. Papoulis, A. Probability, Random Variables, and Stochastic Processes; Tata McGraw-Hill Education: New York, NY, USA, 2002. [Google Scholar]
  59. United Nations. 2015 Paris Agreement. Available online: http://unfccc.int/files/essentialbackground/convention/application/pdf/englishparisagreement.pdf (accessed on 16 June 2021).
  60. Joskow, P.L. Comparing the costs of intermittent and dispatchable electricity generation technologies. Am. Econ. Rev. Pap. Proc. 2011, 100, 238–241. [Google Scholar] [CrossRef] [Green Version]
  61. Edenhofer, O.; Hirth, L.; Knopf, B.; Pahle, M.; Schlömer, S.; Schmid, E.; Ueckerdt, F. On the economics of renewable energy sources. Energy Econ. 2013, 40, S12–S23. [Google Scholar] [CrossRef]
  62. Schill, W.-P. Residual load, renewable surplus generation and storage requirements in Germany. Energy Policy 2014, 73, 65–79. [Google Scholar] [CrossRef] [Green Version]
Figure 1. Integrated electricity storage and supply system. Source: developed by authors.
Applsci 11 06413 g001
Figure 2. Forecast of developments in the share of the total electricity consumed from renewable sources. Notes: UCL—upper-case limits; LCL—lower confidence limits. Source: developed using SPSS v.20.
Applsci 11 06413 g002
Figure 3. Forecast for developments in final energy consumption for the electricity source. Notes: UCL—upper-case limits; LCL—lower confidence limits. Source: developed using SPSS v.20.
Applsci 11 06413 g003
Figure 4. Forecast for developments in the total number of vehicles used in the European Union for transport. Notes: UCL—upper-case limits; LCL—lower confidence limits. Source: developed using SPSS v.20.
Applsci 11 06413 g004
Figure 5. Comparative vehicle stock trends and the number of vehicles powered by stored potential renewable energy. Source: developed on data obtained using SPSS v.20.
Applsci 11 06413 g005
Table 1. Model fit for ARIMA forecast of share of total electricity consumed from renewable sources.
Fit StatisticMean
Stationary R-squared0.986
R-squared0.986
RMSE0.772
MAPE2.825
MaxAPE8.409
MAE0.601
MaxAE1.334
Normalized BIC−0.171
Source: developed using SPSS v.20.
Table 2. Model fit for ARIMA forecast of final energy consumption for electricity source.
Fit StatisticMean
Stationary R-squared0.188
R-squared0.091
RMSE36,645,514,031
MAPE1.029
MaxAPE1.924
MAE25,396,358,399
MaxAE47,184,942,301
Normalized BIC49.626
Source: developed using SPSS v.20.
Table 3. Model fit for ARIMA forecast of the total number of vehicles used in the European Union for transport.
Fit StatisticMean
Stationary R-squared0.981
R-squared0.981
RMSE2,479,209
MAPE0.734
MaxAPE2.453
MAE1,849,343
MaxAE5,907,565
Normalized BIC29.793
Source: developed using SPSS v.20.
Publisher’s Note: MDPI stays neutral with regard to jurisdictional claims in published maps and institutional affiliations.

