Article

Valorization of Waste Tires by Pyrolysis and Activation Processes

by
Reyna Berenice González-González
1,
Nadia Ruiz-Gómez
2,
Gloria Gea
2,
Matias Vazquez-Pinon
1,
Sergio O. Martinez-Chapa
1,
Porfirio Caballero
1 and
Alberto Mendoza
1,*
1
Tecnologico de Monterrey, School of Engineering and Sciences, Ave. Eugenio Garza Sada 2501, Monterrey 64849, Mexico
2
Aragón Institute for Engineering Research (I3A), Universidad de Zaragoza, Edificio I+D, C/Mariano Esquillor s/n, 50018 Zaragoza, Spain
*
Author to whom correspondence should be addressed.
Appl. Sci. 2021, 11(14), 6342; https://doi.org/10.3390/app11146342
Submission received: 17 June 2021 / Revised: 6 July 2021 / Accepted: 6 July 2021 / Published: 8 July 2021
(This article belongs to the Special Issue Advances in Waste Treatment and Material Recycling)

Abstract

:
The problems related to the increase in the generation of discarded tires demonstrate the need for profitable, efficient, cost-effective, and sustainable processes for their waste management. In particular, the valorization of pyrolytic solids for energy storage applications is of interest. In this study, four processes were performed: (1) pyrolysis; (2) chemical activation and pyrolysis; (3) pyrolysis and physical activation; and (4) chemical activation, pyrolysis, and physical activation. The process consisting of chemical activation, pyrolysis, and physical activation yielded 52% solid material with the highest electrical conductivity (2.43 Ω–1 cm–1) and a surface area of 339 m2/g with an average pore size of 3.6 nm. In addition, it was found that pore size had a greater effect on the conductivity than surface area. Liquid and gas fraction compositions were modified by the presence of chemical activation: aromatization reactions were favored, and limonene was not observed in the liquid fraction, while an increase on the CH4 concentration caused an increment in the heating value of the gas fraction. It was demonstrated that chemical and physical activation enhance the properties of the pyrolytic solid product derived from waste tires that make it suitable for the partial substitution of materials for electric energy storage applications.

1. Introduction

Economic and population growth, as well as increased urbanization and industrialization, have caused accelerated waste generation [1]. Among the different types of solid waste, tires are particularly problematic. The global annual generation of waste tires is estimated at 1.2 billion tires, in addition to the 4 billion tires already accumulated in landfills [2]. Inadequate management of these waste tires generates environmental and health problems, such as the propagation of disease-carrying pests [3] and uncontrolled release of atmospheric pollutants (including highly toxic species such as dioxins, polycyclic aromatic hydrocarbons, and fine particulate matter), when burned in open fires [4]. Additionally, stockpiles of waste tires have a negative effect on communities’ perceptions of their surrounding areas. The vast amount of waste generated nowadays dictates the need for an urgent transition towards circular economy schemes, reducing waste generation and minimizing the extraction of non-renewable resources [5].
Waste tires have a high calorific value and volatile matter content, as well as a moderate sulfur content [6]. These properties make them an ideal material for thermochemical processes like pyrolysis, which can lead to the recovery of liquid fuels, syngas, and pyrolytic carbon black [7]. Typically, after pyrolysis, 40–60% ends as liquid fraction [8] that can be used as fuel or as chemical feedstock [9]. Between 5 and 20% results in a gas fraction [8] with a high calorific value that allows its use as fuel for the pyrolysis processes [10]. The solid fraction is mainly composed of carbon black and represents 30–40% of the total pyrolytic products [8].
Waste tire pyrolysis has been the subject of ample research, such as the kinetics of the pyrolysis reaction [11], reactor design, and product characterization [6,12]. This thermochemical conversion pathway has demonstrated that the recycling of waste tires, accompanied by material and energy recovery, is important from both an economic and environmental aspect [13]. Despite advances in the proper management of waste tires, there are still environmental problems related to their inadequate disposal, probably because the conventional processes are expensive or the products do not have a commercial application [14,15]. As Wójtowicz and Serio [16] reported, economic viability of the pyrolysis process is obtained when the products generated are not limited only to primary products. Furthermore, some authors [14,17,18,19] suggest that the profitability of the pyrolysis of waste tires could depend on the application of the solid fraction.
Activation processes are used to produce high-quality activated carbon from waste tires [20] and the activation process used plays an important role regarding the commercial applications of this solid product obtained from waste tire pyrolysis. Several investigations analyze the effect of the activation methods with the objective of improving the morphological characteristics of the carbonaceous solid [21,22]. There are two types of activation process: physical and chemical. The main advantages of physical activation are simplicity and low cost, with steam and CO2 being the most common agents used [23]. On the other hand, during chemical activation, the tire is impregnated with a chemical agent prior to carbonization. The advantages of this process include a higher carbon yield and better control of porosity [23]. Some chemical agents used in waste tire activation are ZnCl2, H3PO4 [21], H2O2 [24], KOH [25], and H2SO4 [26]. Different applications have been explored for the pyrolytic solids from waste tires, such as reinforcement on the rubber industry [27], as adsorbents mainly used for the removal of pollutants [28], activated carbon used as catalyst for biodiesel production [2,29], and recently as anodes in energy storage devices [25,26]. These studies provide information on the application of the solid fraction as an electrode; however, a complete valorization of all the pyrolytic tire products and an analysis of the effects on their properties of the parameters of the process are still necessary. Chemical composition, a high surface area, and proper porosity formation in the solid fraction are the main factors contributing to their good performance as electrodes [15]. In this study, we explore combinations of waste tire activation, using physical and chemical pathways, and pyrolysis to recover pyrolytic carbon black with suitable properties for its use in energy-storage devices (high surface area, type of pores created, and high electrical conductivity). In addition, liquid and gas products are analyzed with the aim of performing a preliminary analysis of the value of these subproducts.

2. Materials and Methods

2.1. Overview

Four different pyrolysis/activation experiments were performed in which the presence of chemical or physical activation is varied. In Process 1, waste tire powder was pyrolyzed without the presence of either chemical or physical activation. In Process 2, waste tire powder was chemically activated and then pyrolyzed. In Process 3, pyrolysis was performed, followed by physical activation. Finally, Process 4 consisted of chemical activation followed by pyrolysis, and then physical activation. The feedstock (waste tire powder and chemically activated waste tire powder) was characterized, as well as the resulting solid, liquid, and gas products. In the following sections of the manuscript, the products obtained are identified with the initial letter of the product followed by the number of the process. For example, products from Process 1 are represented as solid: S1, liquid: L1, and gas: G1.

2.2. Feedstock Preparation and Characterization

Prior to pyrolysis, the waste tires (untreated and acid-treated waste tire) were subjected to proximal analysis, elemental analysis, heating value tests, and thermogravimetric analysis. Metal- and textile-free waste tire powder was obtained from Lehigh Technologies, Inc. (Georgia, USA) with a particle size range of 75–125 µm. The chemical activation process was based on an adapted version of the methodology suggested by Naskar et al. [26]: tire powder was impregnated with H2SO4 98% w/w for 14 h at 70 °C, in a volume tire/H2SO4 ratio of 1:3 to ensure complete impregnation. Then, the sample was filtered under vacuum and washed with distilled water to achieve neutral pH, followed by final drying at 105 °C for 24 h. Moisture content was determined by the ISO 5068:1983 method, ash content by ASTM D3172-13, volatile matter by ISO 562-1981, and fixed carbon was determined by difference. An elemental analyzer (Leco, model CHN628, St. Joseph, MI, USA) was utilized to determine carbon, hydrogen, and nitrogen content according to ASTM D5373-08, while sulfur determination was done using the S-628 module of the same analyzer according to ASTM D4239. The heating value was obtained using a Parr Calorimeter 1341 (Parr Instruments, Moline, IL, USA) and a thermogravimetric analysis was performed using a thermogravimetric analyzer (Linseis, model STA PT1600, Selb, Germany). For this last analysis, approximately 10 mg of sample was heated at a rate of 20 °C/min until a temperature of 850 °C was reached, which was maintained for 1 h under N2 atmosphere.

2.3. Pyrolysis Process

A fixed bed reactor consisting of a vertical cylindrical quartz tube with a diameter of 1 cm and length of 40 cm, with a thermocouple controller placed in the center of the sample bed, was used for the pyrolysis tests (Figure 1). The pyrolysis parameters were fixed for all processes (tests): approximately 1.5 g of sample was heated at a rate of 20 °C/min until a maximum temperature of 850 °C was reached and maintained for 1 h with an N2 flow of 50 mL/min throughout the pyrolysis tests. Physical activation, when included in the test, was performed after pyrolysis by introducing CO2 with a flowrate of 150 mL/min during 3 h at 850 °C. Each experiment was performed in duplicate. Solid and liquid fraction yield were determined by weighting the reactor and the condensation system before and after each experiment, while the gas yield was calculated by difference. The solid fraction obtained in each replica of the same process was mixed and characterized, while the liquid and gas fractions of each replica were analyzed separately.

2.4. Solid Fraction Characterization

A scanning electron microscope (SEM; JEOL, model JSM-6490LV, Akishima, Japan) was utilized to observe the surface morphology of the solid fraction. N2 adsorption-desorption isotherms at 77 K were obtained with a NOVA 2000e instrument (Quantachrome Instruments, Boynton Beach, FL, USA). The surface area was calculated using the multipoint BET method [30], while pore size distribution was calculated by the BJH method [31]. Before the analysis, samples were outgassed at 300 °C for 1 h to remove moisture and impurities. As electrical conductivity is an important parameter of carbon materials used in electrode applications, it was measured using the four-point probe method (Figure 2). The four-point probe test was performed using approximately 2 mg of sample evenly distributed on adhesive tape resting on a microscope glass slide. Then, 30 resistance measurements were performed using an 34401A digital multimeter (Agilent Technologies, Santa Clara, CA, USA). The four probes were placed in a straight line at equal distance from one another on the sample. During the test, a current was passed through the two outer probes and the potential difference measured across the two inner probes was used to calculate the resistance value [32]. The thickness was measured with a confocal microscope (Carl Zeiss: Axio CSM 700, Jena, Germany) to convert resistance into resistivity. Finally, the conductivity (σ) of the carbon material was calculated. A one-way analysis of variance (ANOVA) test was performed on the collected conductivity data from all solid fractions to detect differences in the mean of the conductivity values. Then, Tukey’s test was conducted to identify which solid fractions were significantly different from one another.

2.5. Liquid and Gas Fraction Characterization

The liquid obtained from the pyrolysis tests was subjected to a qualitative chemical characterization to identify the main compounds and the group to which they belong: aromatic, aliphatic, heterocyclic aromatic, and compounds with heteroatoms. The characterization of a representative replica from each process was performed using a gas chromatograph 7890A coupled to a selective mass detector MSD 5975C (GC-MS; Agilent Technologies, Santa Clara, CA, USA). The experimental procedure is described in [33]. Although this characterization technique is useful and commonly used, detection limitations should be considered. Compound identification by this technique could be uncertain as isomers, homologues, or altogether different compounds have a similar structure. In addition, search results below 80% accuracy indicate that compounds are not presented in the library.
As depicted in Figure 1, an in-line micro-GC (Agilent 3000A, Santa Clara, CA, USA) was used to determine the composition of the gas. The detection of CO2, C2H4, C2H6, C2H2, H2S, H2, N2, CH4, and CO was performed in each sample injection conducted every 160 s. Other gases such as SO2 and H2SO3 were not considered for discussion, as previous studies reported its presence on insignificant amounts [34]. The data provided by the micro-GC were normalized and quantification of the gas species was performed by a numerical integration using N2 as the internal standard. The volume composition was expressed on an N2-free basis. The lower heating value of the gas produced was calculated as a weighted average of the heating value of each compound (Equation (1)):
L H V g a s = X i × L H V i
where LHVgas is the lower heating value of the gas produced during the process, Xi is the molar fraction of each chemical species i in the gas mixture, and LHVi is the lower heating value of each chemical species i.

3. Results and Discussion

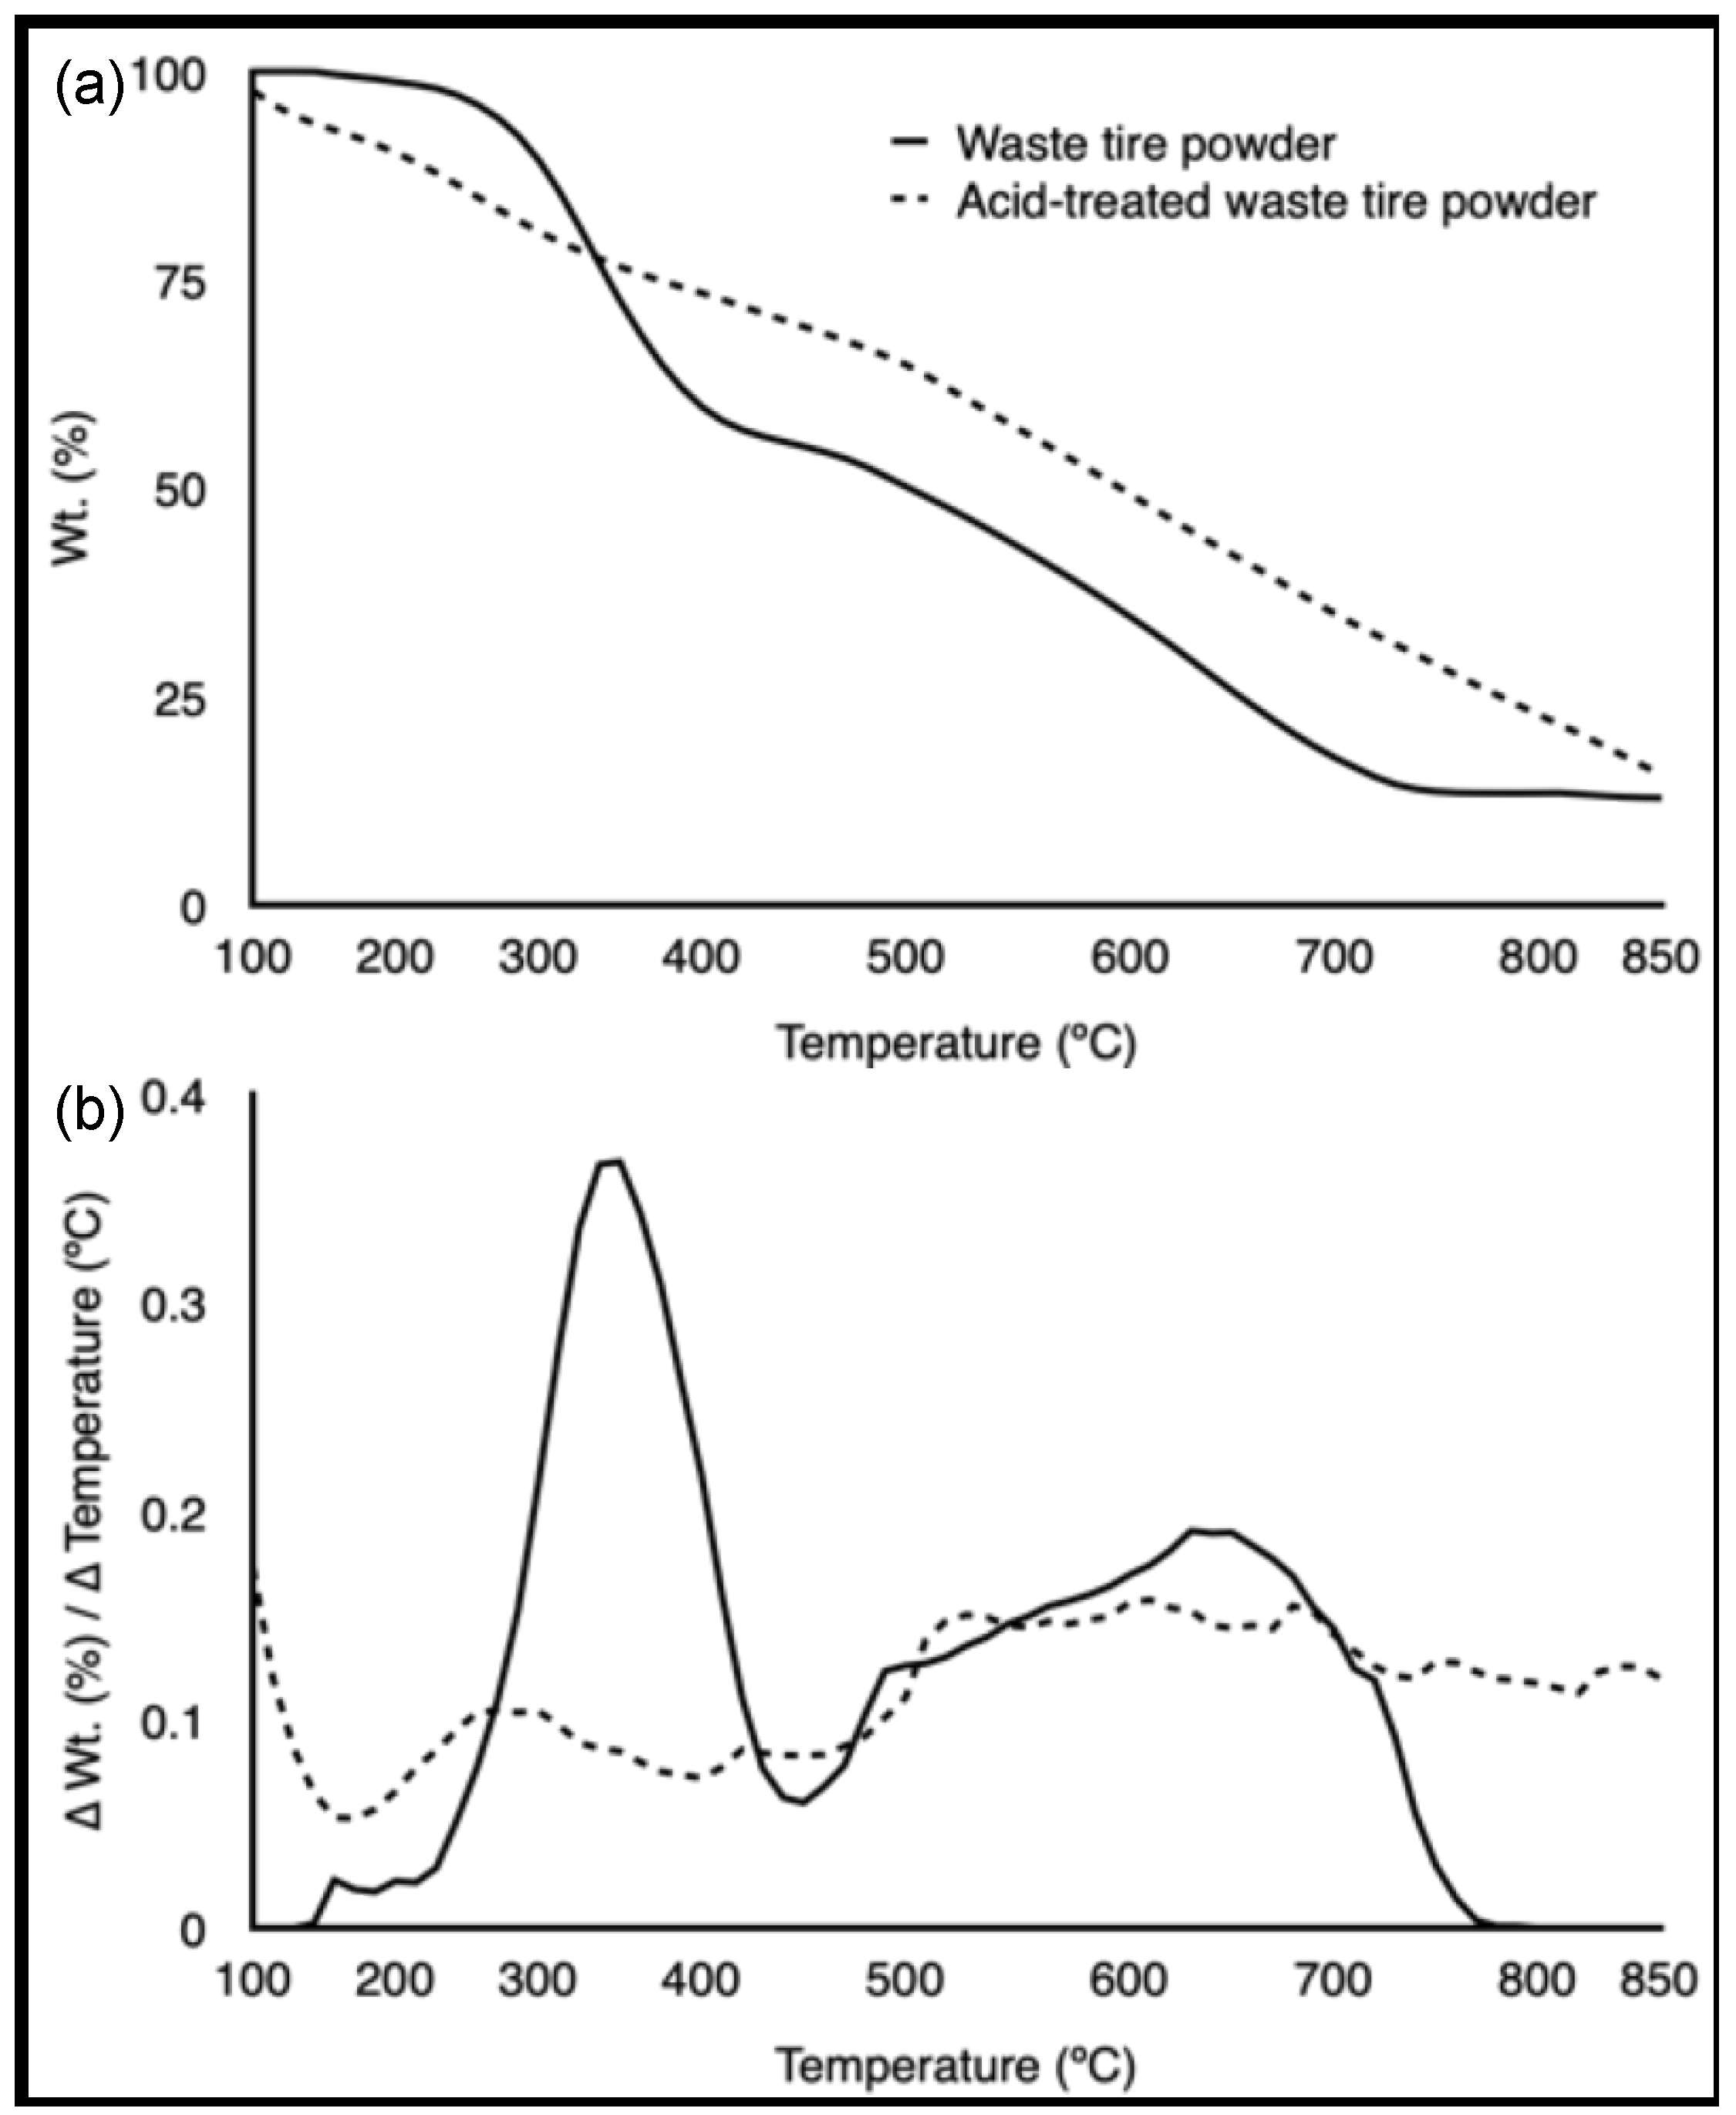
3.1. Feedstock Characterization

Table 1 shows the results of the proximal and elemental analyses conducted on the waste tire powder and acid-treated waste tire powder.
The waste tire powder results are in good agreement with those reported by other authors [35,36]. A slight increase in moisture is observed after H2SO4 activation, which may be associated with an increased surface area and its consequent absorption properties. Volatile matter and ash content decreased with the acid treatment, which leads to a higher fixed carbon content, which could indicate a carbonization of the material. Regarding the elemental analysis, both materials have a high carbon content. The presence of sulfur is attributed to the vulcanization process performed during tire manufacturing, and, although it is present in both materials, the acid-treated waste tire powder has a higher content of sulfur, probably owing to the type of acid used during activation. The higher heating value of the waste tire powder was 36.62 ± 0.18 MJ/kg and the lower heating value was 34.79 ± 0.18 MJ/kg. These results are similar to those found in other investigations [37,38], which are highly dependent on the type and manufacturer of the waste tire [34], mainly by the variations of natural rubber/synthetic rubber composition.
Figure 3 shows the thermogravimetric analysis conducted on both materials. During the waste tire powder decomposition, three mass losses were observed. Up to 250 °C, the loss of moisture and additives occurs; between 250 and 480 °C, the natural rubber and styrene-butadiene rubber decomposition reaches almost 50% of the initial mass; and, after 450 °C, the butadiene rubber decomposes [39]. However, acid-treated waste tire powder loses mass at a lower temperature (~150 °C). This is because of desulfonation reactions where H2SO3 is eliminated, causing the formation of unsaturated groups in the hydrocarbon, which leads to a better char-forming material [26]. The derivative thermograms showed a decrease on the intensity peak associated to the decomposition of rubbers on the acid-treated waste tire, which is consistent with the decrease of the volatile matter content occurred on this sample. Finally, after 700 °C, the degradation of the waste tire powder is diminished, while the acid-treated waste tire powder required a higher temperature. It is reported that waste tire pyrolysis is complete around 600 °C [38]. However, we observed that the decomposition of waste tires ended after 700 °C, which can be attributed to the high heating rate used. Using a heating rate of 10 °C/min, Kwon and Castaldi [40] reported that pyrolysis is completed around 500 °C; however, Williams and Besler [41] analyzed the pyrolysis process at different heating rates, concluding that all samples tested required higher temperatures to complete the thermal degradation when higher heating rates were used, demonstrating that increasing the heating rate results in shifting the loss of mass towards higher temperatures. In addition, the observed differences can also be attributed to differences in composition between the tire samples used in this study compared with those used in referenced studies.

3.2. Pyrolysis Product Yields

Table 2 shows the product yields from each process. An increase in the solid yield is observed during the processes with chemical activation, while the opposite occurs with physical activation. Gas yield was too low (1.32%) when none of the activation process was involved. Although gas yield from waste tire pyrolysis is frequently reported between 5 and 20% [8], there are some studies that report a gas yield lower than 4% [9,18]. Vapor residence time might be associated with the obtained low value in the gas yield, as secondary decomposition of liquids into gases cannot occur [42]. Chemical activation led to higher solid and gas yields; therefore, the liquid yield decreased, which occurred because a significant part of the volatiles that generate the liquid fraction in pyrolysis are lost during chemical activation.

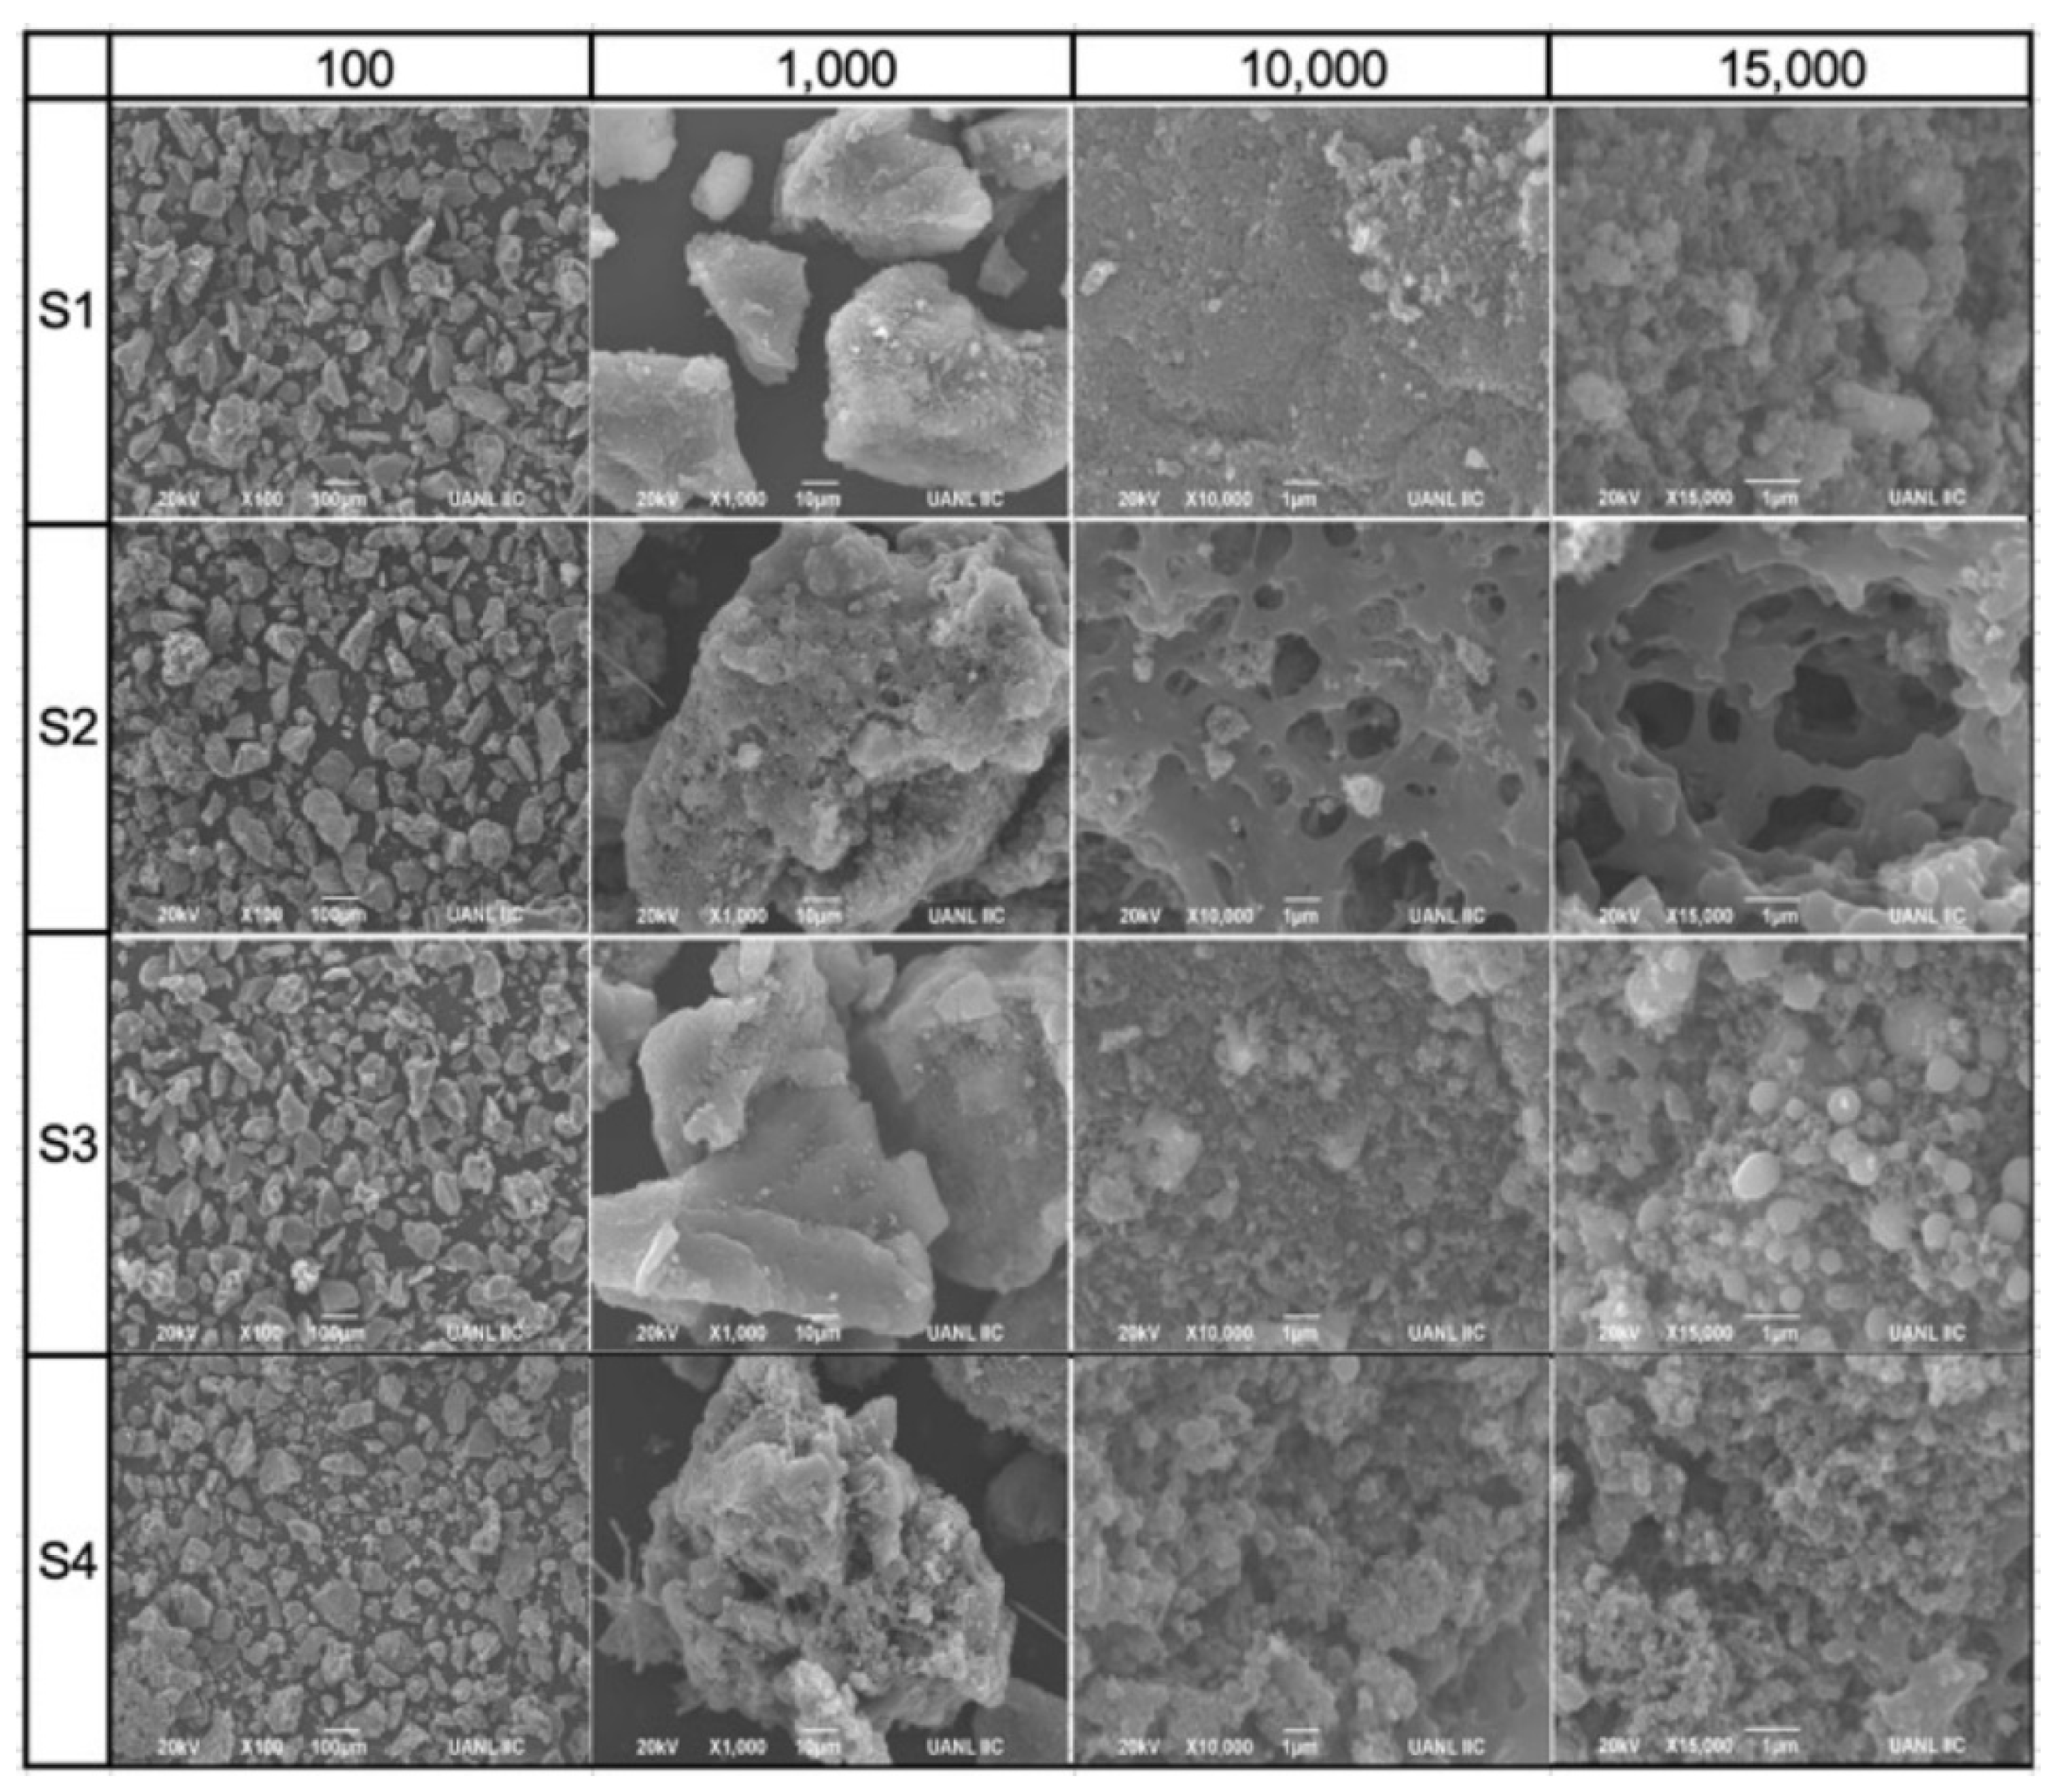
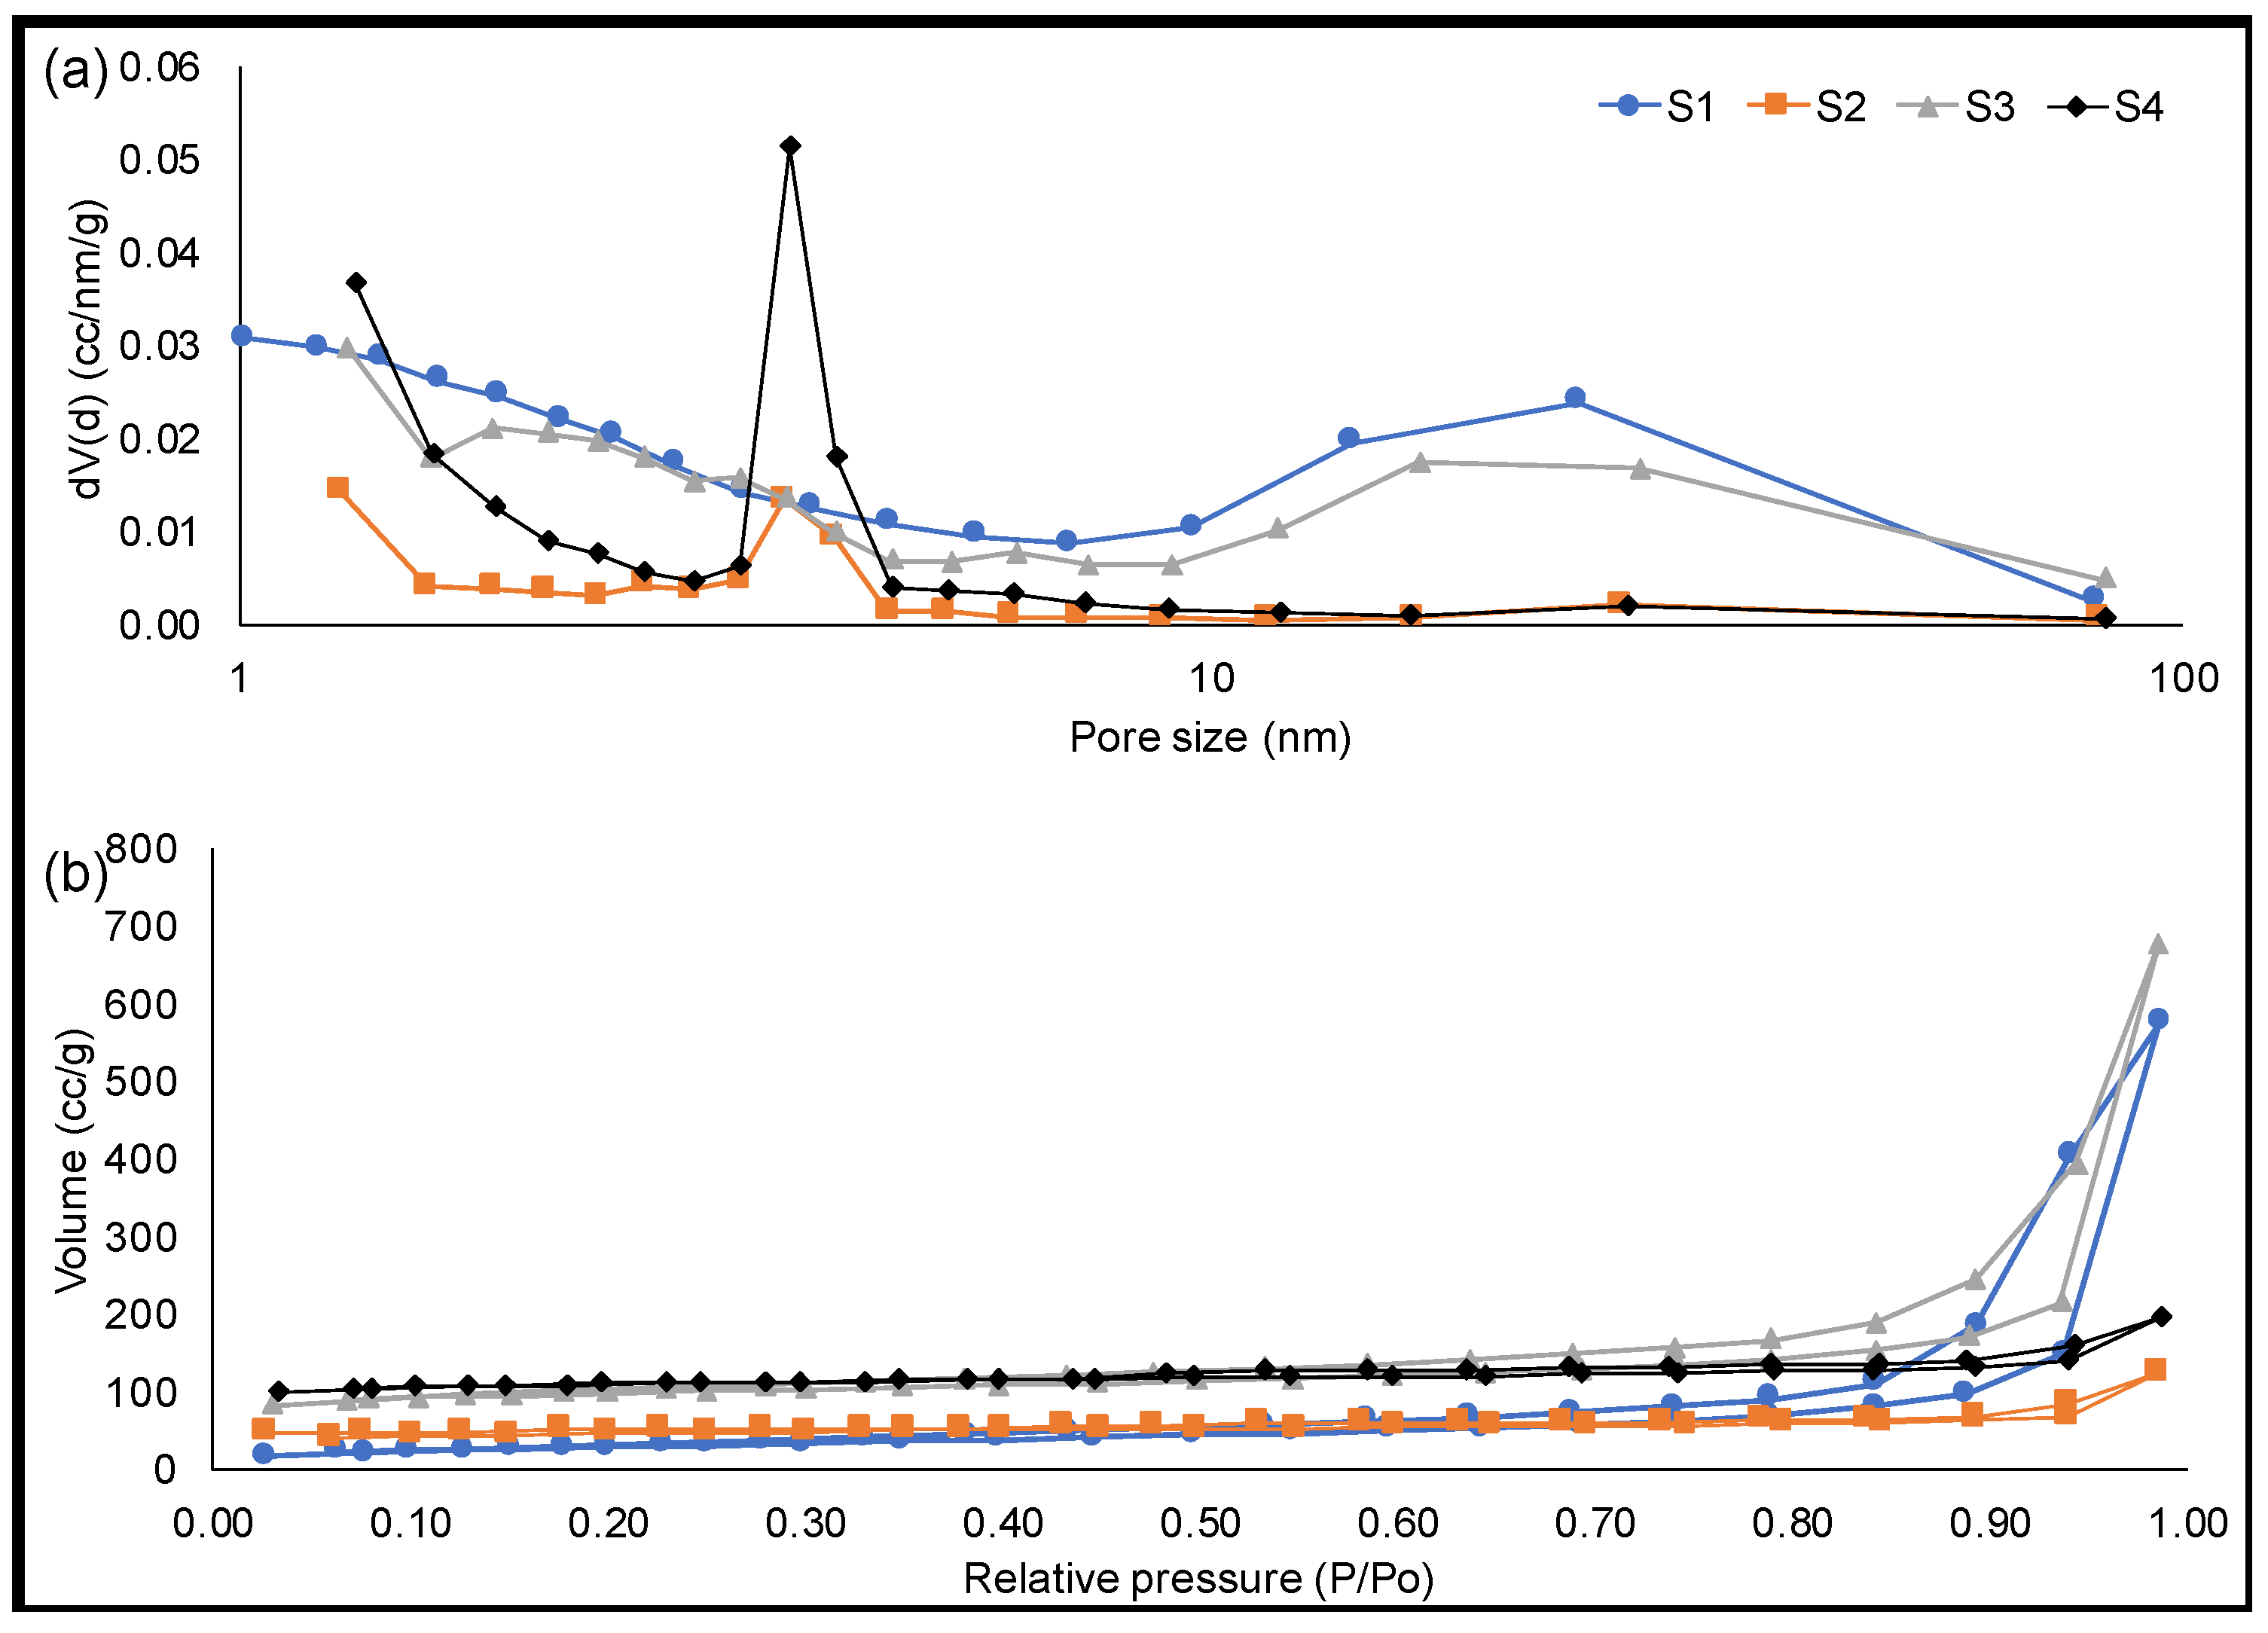
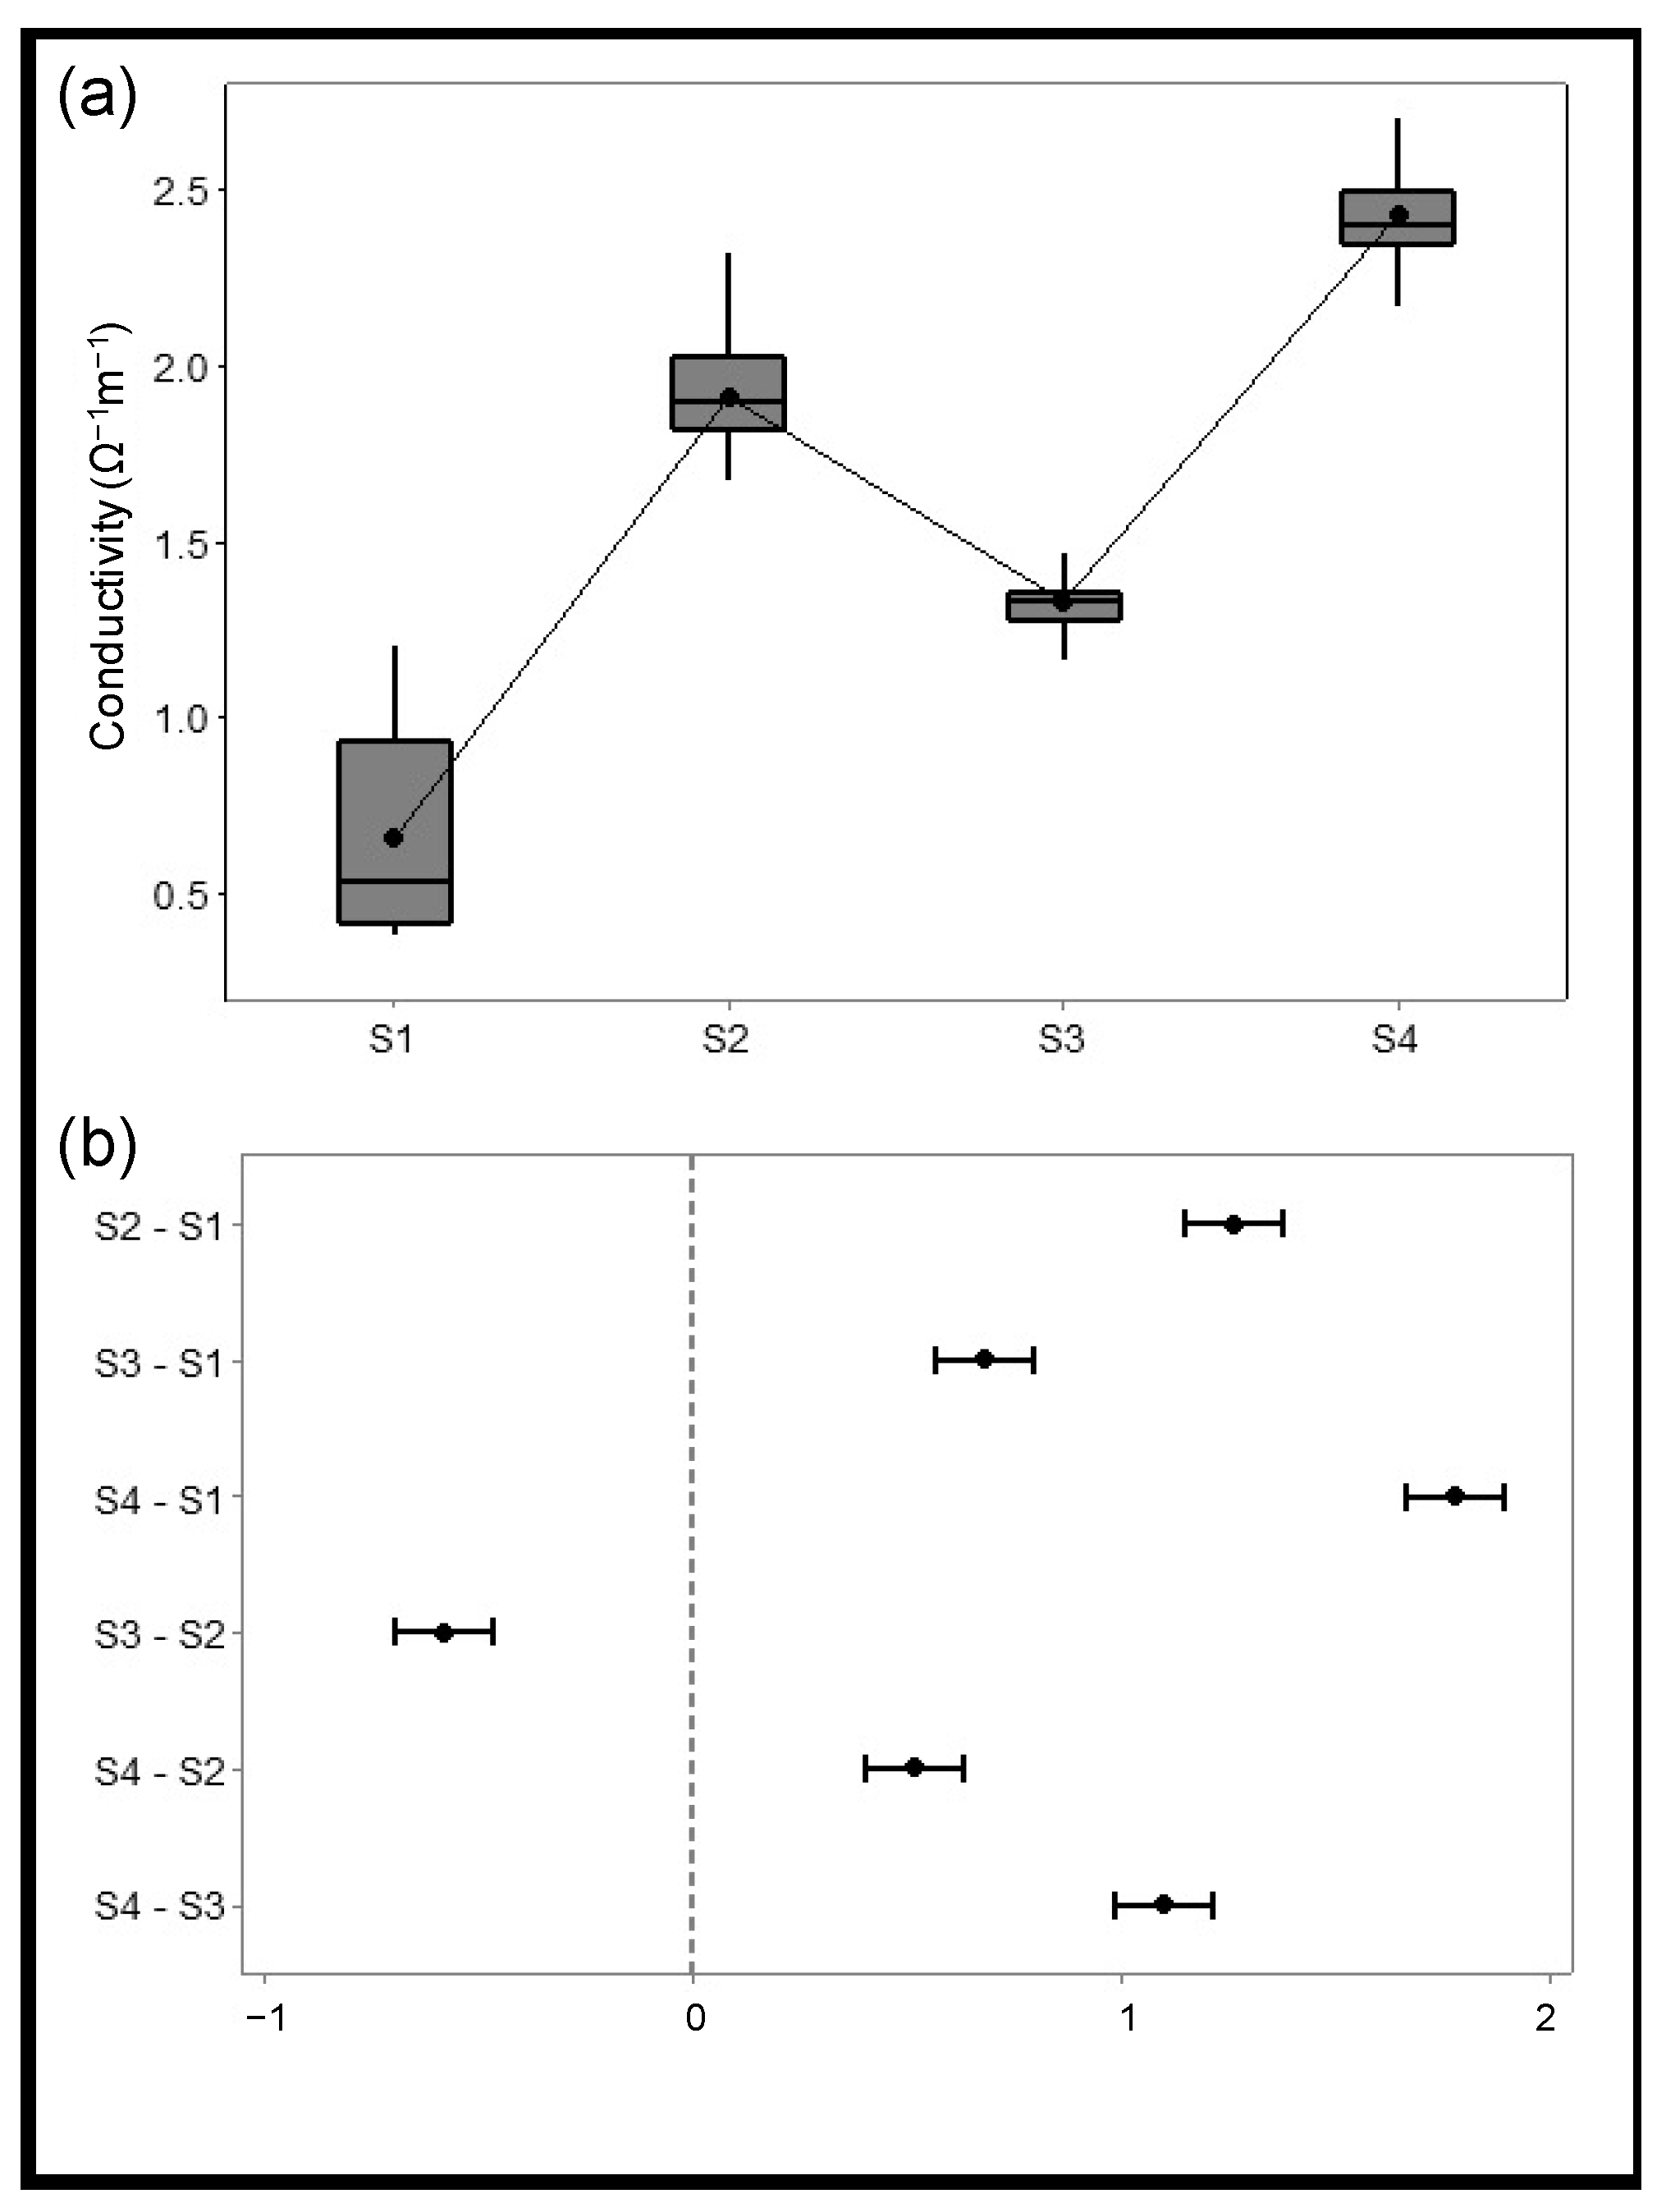
3.3. Solid Fraction Characterization

The chemical and physical activation had an effect on the solid fraction morphology, as can be seen in Figure 4. Carbon black particles have spherical shapes forming aggregates [43], and a rough surface and microporosity were observed in S2 and S4.
In energy storage applications, a high surface area carbon electrode material provides a greater space for charge separation between the electrode and the ions in the electrolyte [15,44]. Surface area and porosity varied between the different pyrolytic solids obtained. It was observed that chemical activation increases surface area, but not as much as physical activation (Table 3). Apparently, the increase in surface area is not related to pore size, which can be attributed to different pore morphologies or pore size distribution.
The adsorption–desorption isotherms and the pore size distribution are presented in Figure 5. The activations performed before pyrolysis had an important effect on the pore size of the solid fraction. The Boudouard reaction that occurs during physical activation causes the development of micropores, mesopores, and macropores [39], which increases surface area. Apparently, chemical activation with H2SO4 generates a more controlled porosity than physical activation, which can be seen in the pore size distribution plot (Figure 5b). The processes with chemical activation presented the formation of micropores. This may be due to the elimination of H2SO3 and sulfur dioxide during carbonization, which previously occupied space.
The conductivity results (Figure 6 and Table 3) indicate that morphological characteristics caused by the chemical activation of the solid fraction led to a higher conductivity value, which is valuable in energy storage applications as electrodes. An ANOVA test was performed to evaluate significant differences in conductivity among processes. A p value < 0.0001 indicated no equal means; therefore, at least one process is different from the rest; similarly, Tukey’s test showed that each of the solids are significantly different from one another.
S1 has the lowest conductivity value, while S4 has the highest conductivity value from all of the solid samples evaluated. S2 reported the second highest conductivity—higher even than that obtained for S3. This suggests that chemical activation favors nanopore size formation, which increases its conductivity. On the other hand, physical activation causes a clear increase in surface area, but the pores formed are not necessarily nanosized. Therefore, despite S3 having a high surface area, its conductivity is lower than S2, which has a lower surface area, but experiences nanopore formation. Figure 7 compares the effect of the surface area and the pore size on the electrical conductivity. As can be seen in Figure 7a, there is not a clear effect of the surface area on the conductivity; despite S3 have a high surface area, its conductivity is lower than S2, which has a lower surface area, but experiences nanopore formation. Figure 7b shows that pore size has a stronger effect on conductivity, which in turn is heavily influenced by the presence of chemical activation.
Similar results were obtained by Zhang et al. [45], who successfully synthetized nitrogen-enriched biochar-based electrode material for supercapacitors from lignosulfonate, graphene oxide, and p-phenylenediamine, with 0.3 Sm−1 (0.3 Ω−1 m−1) being the highest conductivity value obtained. Parant et al. [46] studied the behavior of carbon black particles in a water suspension for their use in flow batteries, concluding that their carbon black sample preparation demonstrates good conductivity between 0.01 Sm−1 and 0.5 Sm−1. The four solid samples obtained in our study presented higher conductivity values. As electrical conductivity is a crucial factor in terms of electrochemical performance [45], the higher conductivity values from solids obtained from processes involving chemical activation demonstrate the material potential in electric energy storage applications.

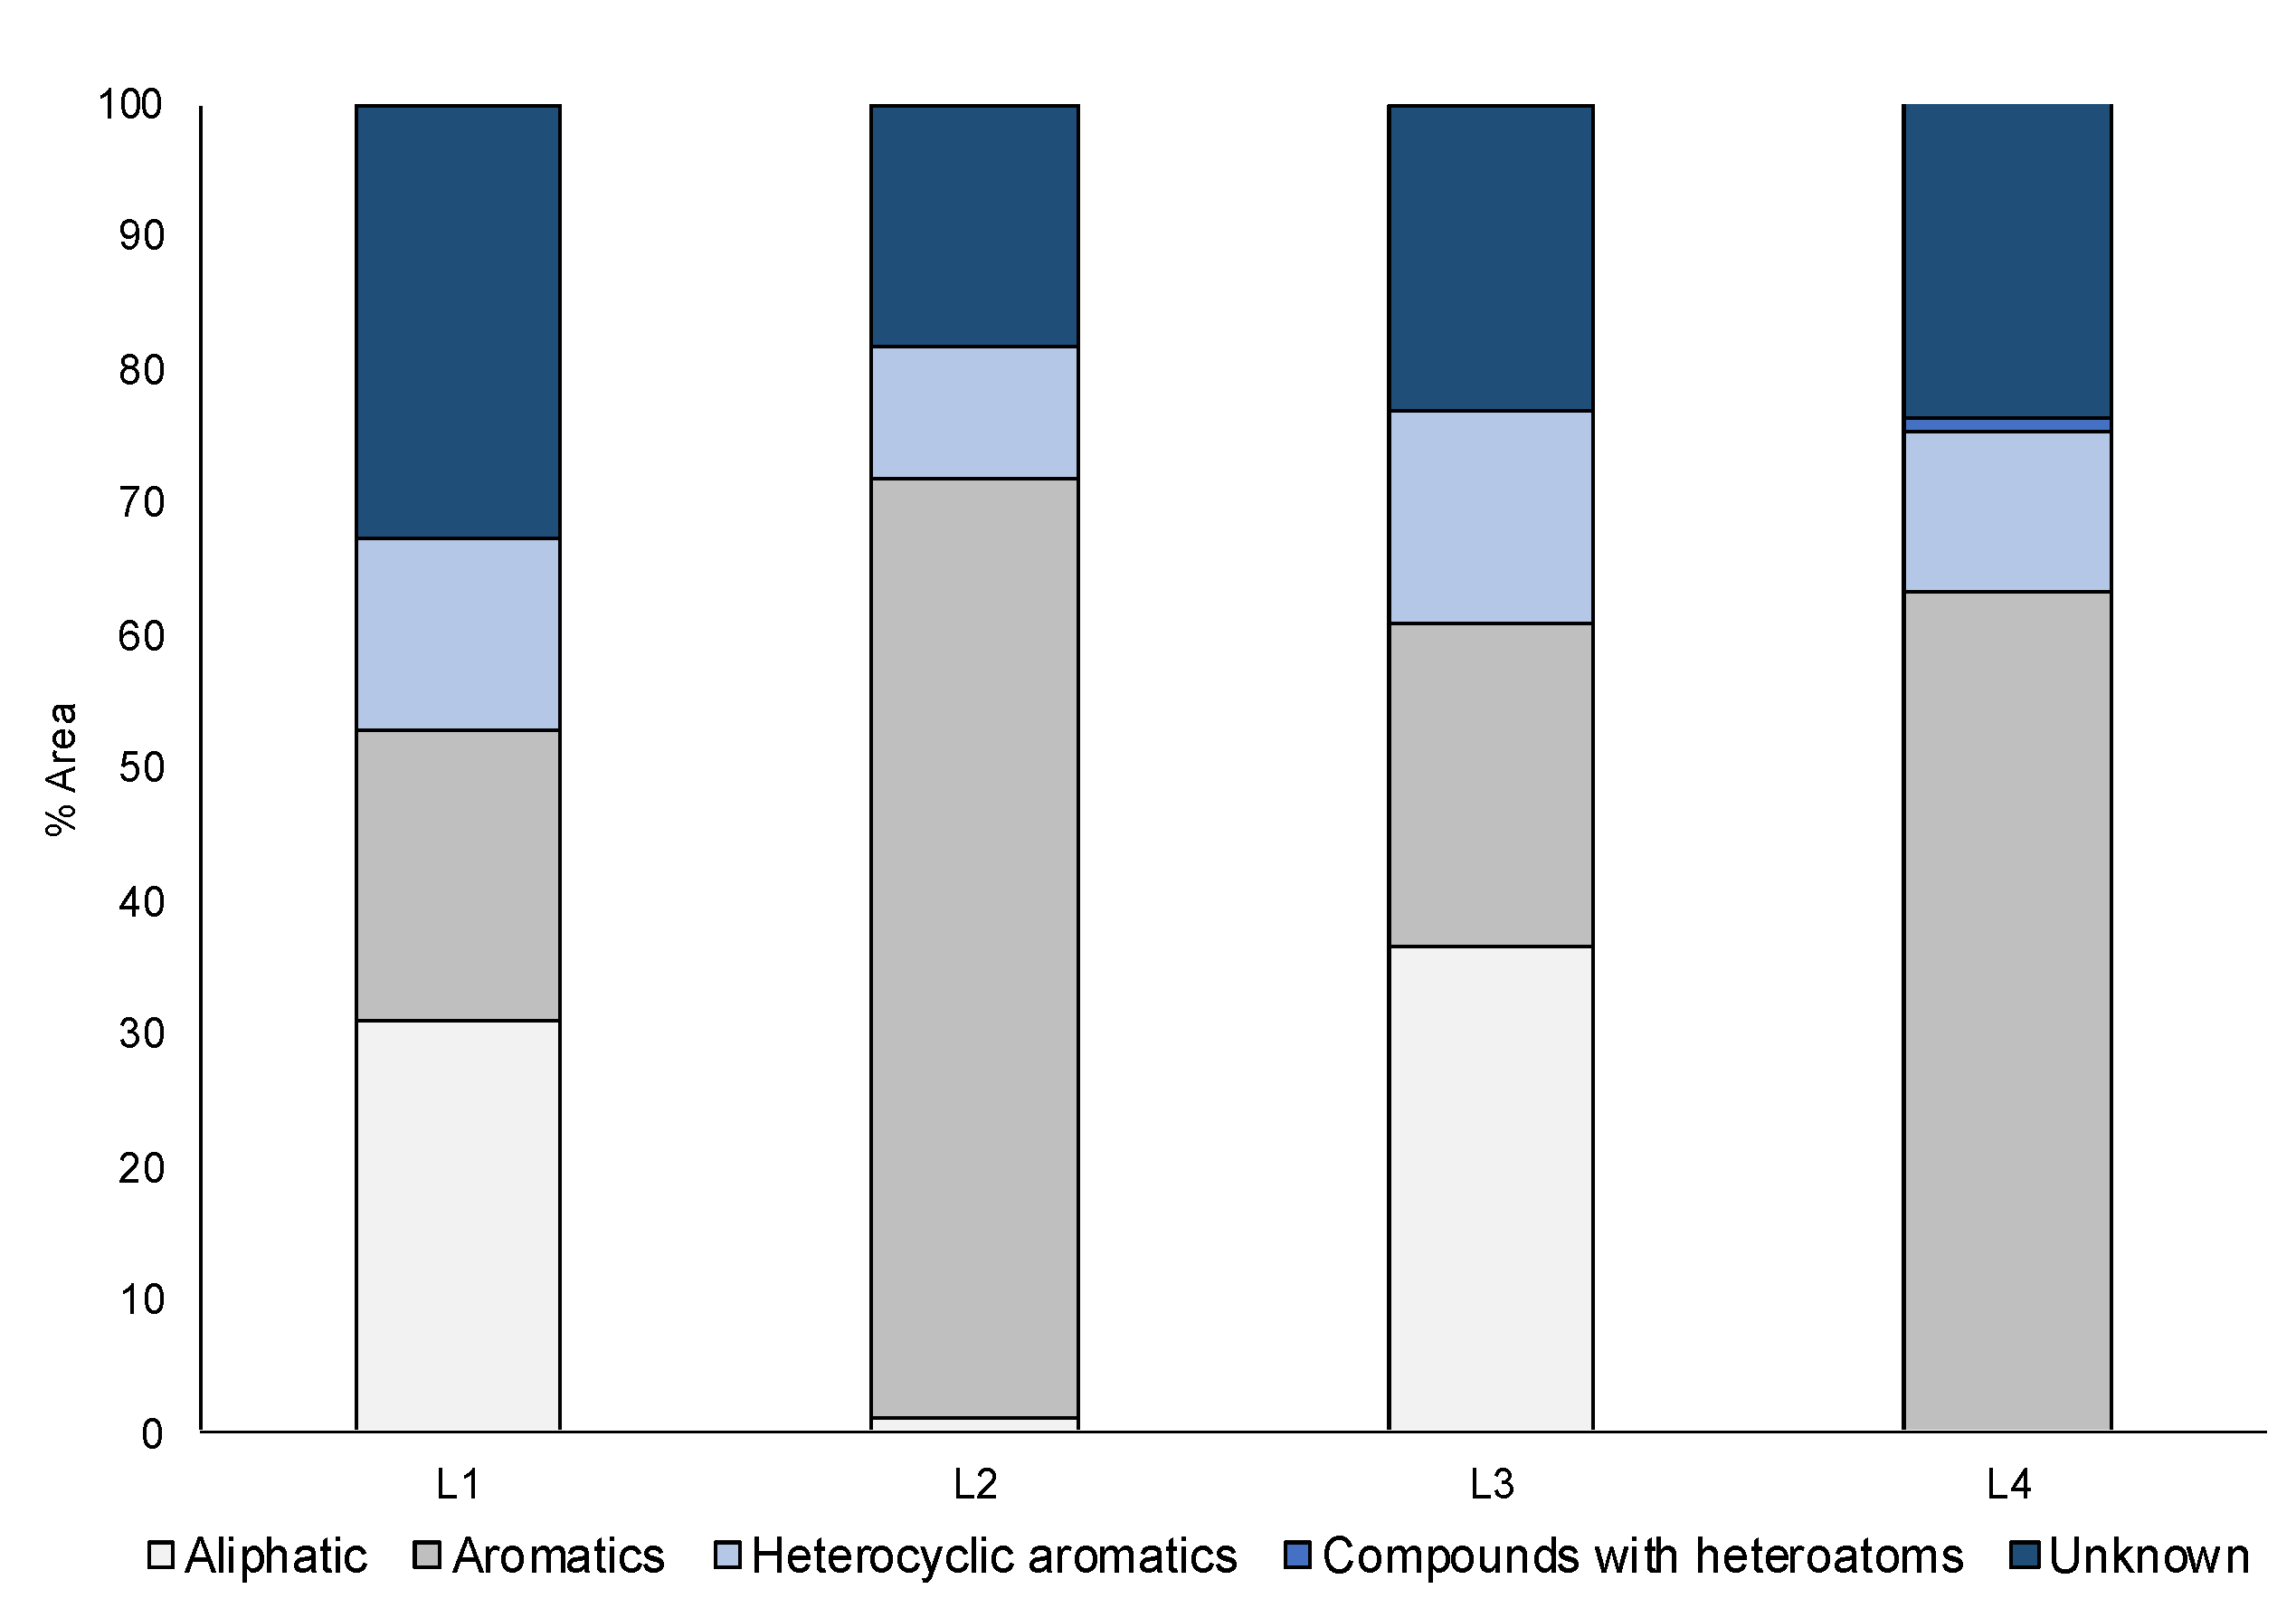
3.4. Liquid Fraction Qualitative Characterization

The qualitative composition of the liquid fraction (Table 4) varied mainly with the presence of chemical activation; physical activation did not have a significant effect on its composition. L1 and L3, which are formed during processes that did not involve a chemical activation, reported the presence of compounds like D-limonene and benzene. On the other hand, naphthalene and its derivatives are compounds found in L2 and L4. The compounds presented on the liquid fraction have also been reported by other authors [10]. Among the complex composition of the liquid fraction, limonene is a major and valuable compound that increases the economic potential of these pyrolytic fractions [47]. It has been reported that limonene concentration significantly decreased at high pyrolysis temperatures [39,47,48], as it is decomposed or transformed into aromatic compounds at higher temperatures (>450 °C) [39,48]; however, some studies have reported the presence of limonene at temperatures above 700 °C [39,47]. In this study, the dominant presence of limonene may be associated with the transient conditions of the pyrolysis system and the vapor residence time. The high heating rate might also be an important factor [47].
The influence of the pyrolysis temperature on the limonene concentration has been amply investigated, while the effect of the heating rate [47] and pressure [48] have received significantly less attention. Moreover, the influence of chemical activations on the feedstock previous pyrolysis has been even less studied. Table 4 shows a clear effect of the chemical activations on limonene yield: D-limonene was not presented on the liquid fraction from acid-treated waste tire (L2 and L4), while it was the main compound on the liquid fraction from nonactivated waste tire (L1 and L3). These results are possibly associated with the decrease on the volatile matter content from 67.16% to 47.04% observed on the acid-treated waste tire (Table 1). As the volatile matter of a tire is mainly constituted by rubbers [49] and limonene is derived from rubber [50], a decrease of the limonene yield was expected on the acid-treated waste tire, which is in agreement with TGA and proximal analysis results.
Liquid fractions from all processes present sulfur-based compounds such as benzothiazole, commonly used during the vulcanization process [51]. The undesirable sulfur content is an obstacle for its utilization as fuel for its environmental pollution potential [4]; therefore, further effort focused on the reduction of its content must be made [39]. Desulfurization processes have been studied by some researchers [52].
Compounds were assigned to major categories, which are depicted in Figure 8. The percentage of aliphatic and aromatic compounds changed considerably depending on whether or not the waste tire was chemically activated. The lower content of aliphatic and higher content of aromatic in L2 and L4 may be attributed to aromatization reactions such as Diels-Alder, converting aliphatic into aromatic compounds. It has been reported that pyrolysis temperatures >600 °C favor aromatic formation reactions [39,47].

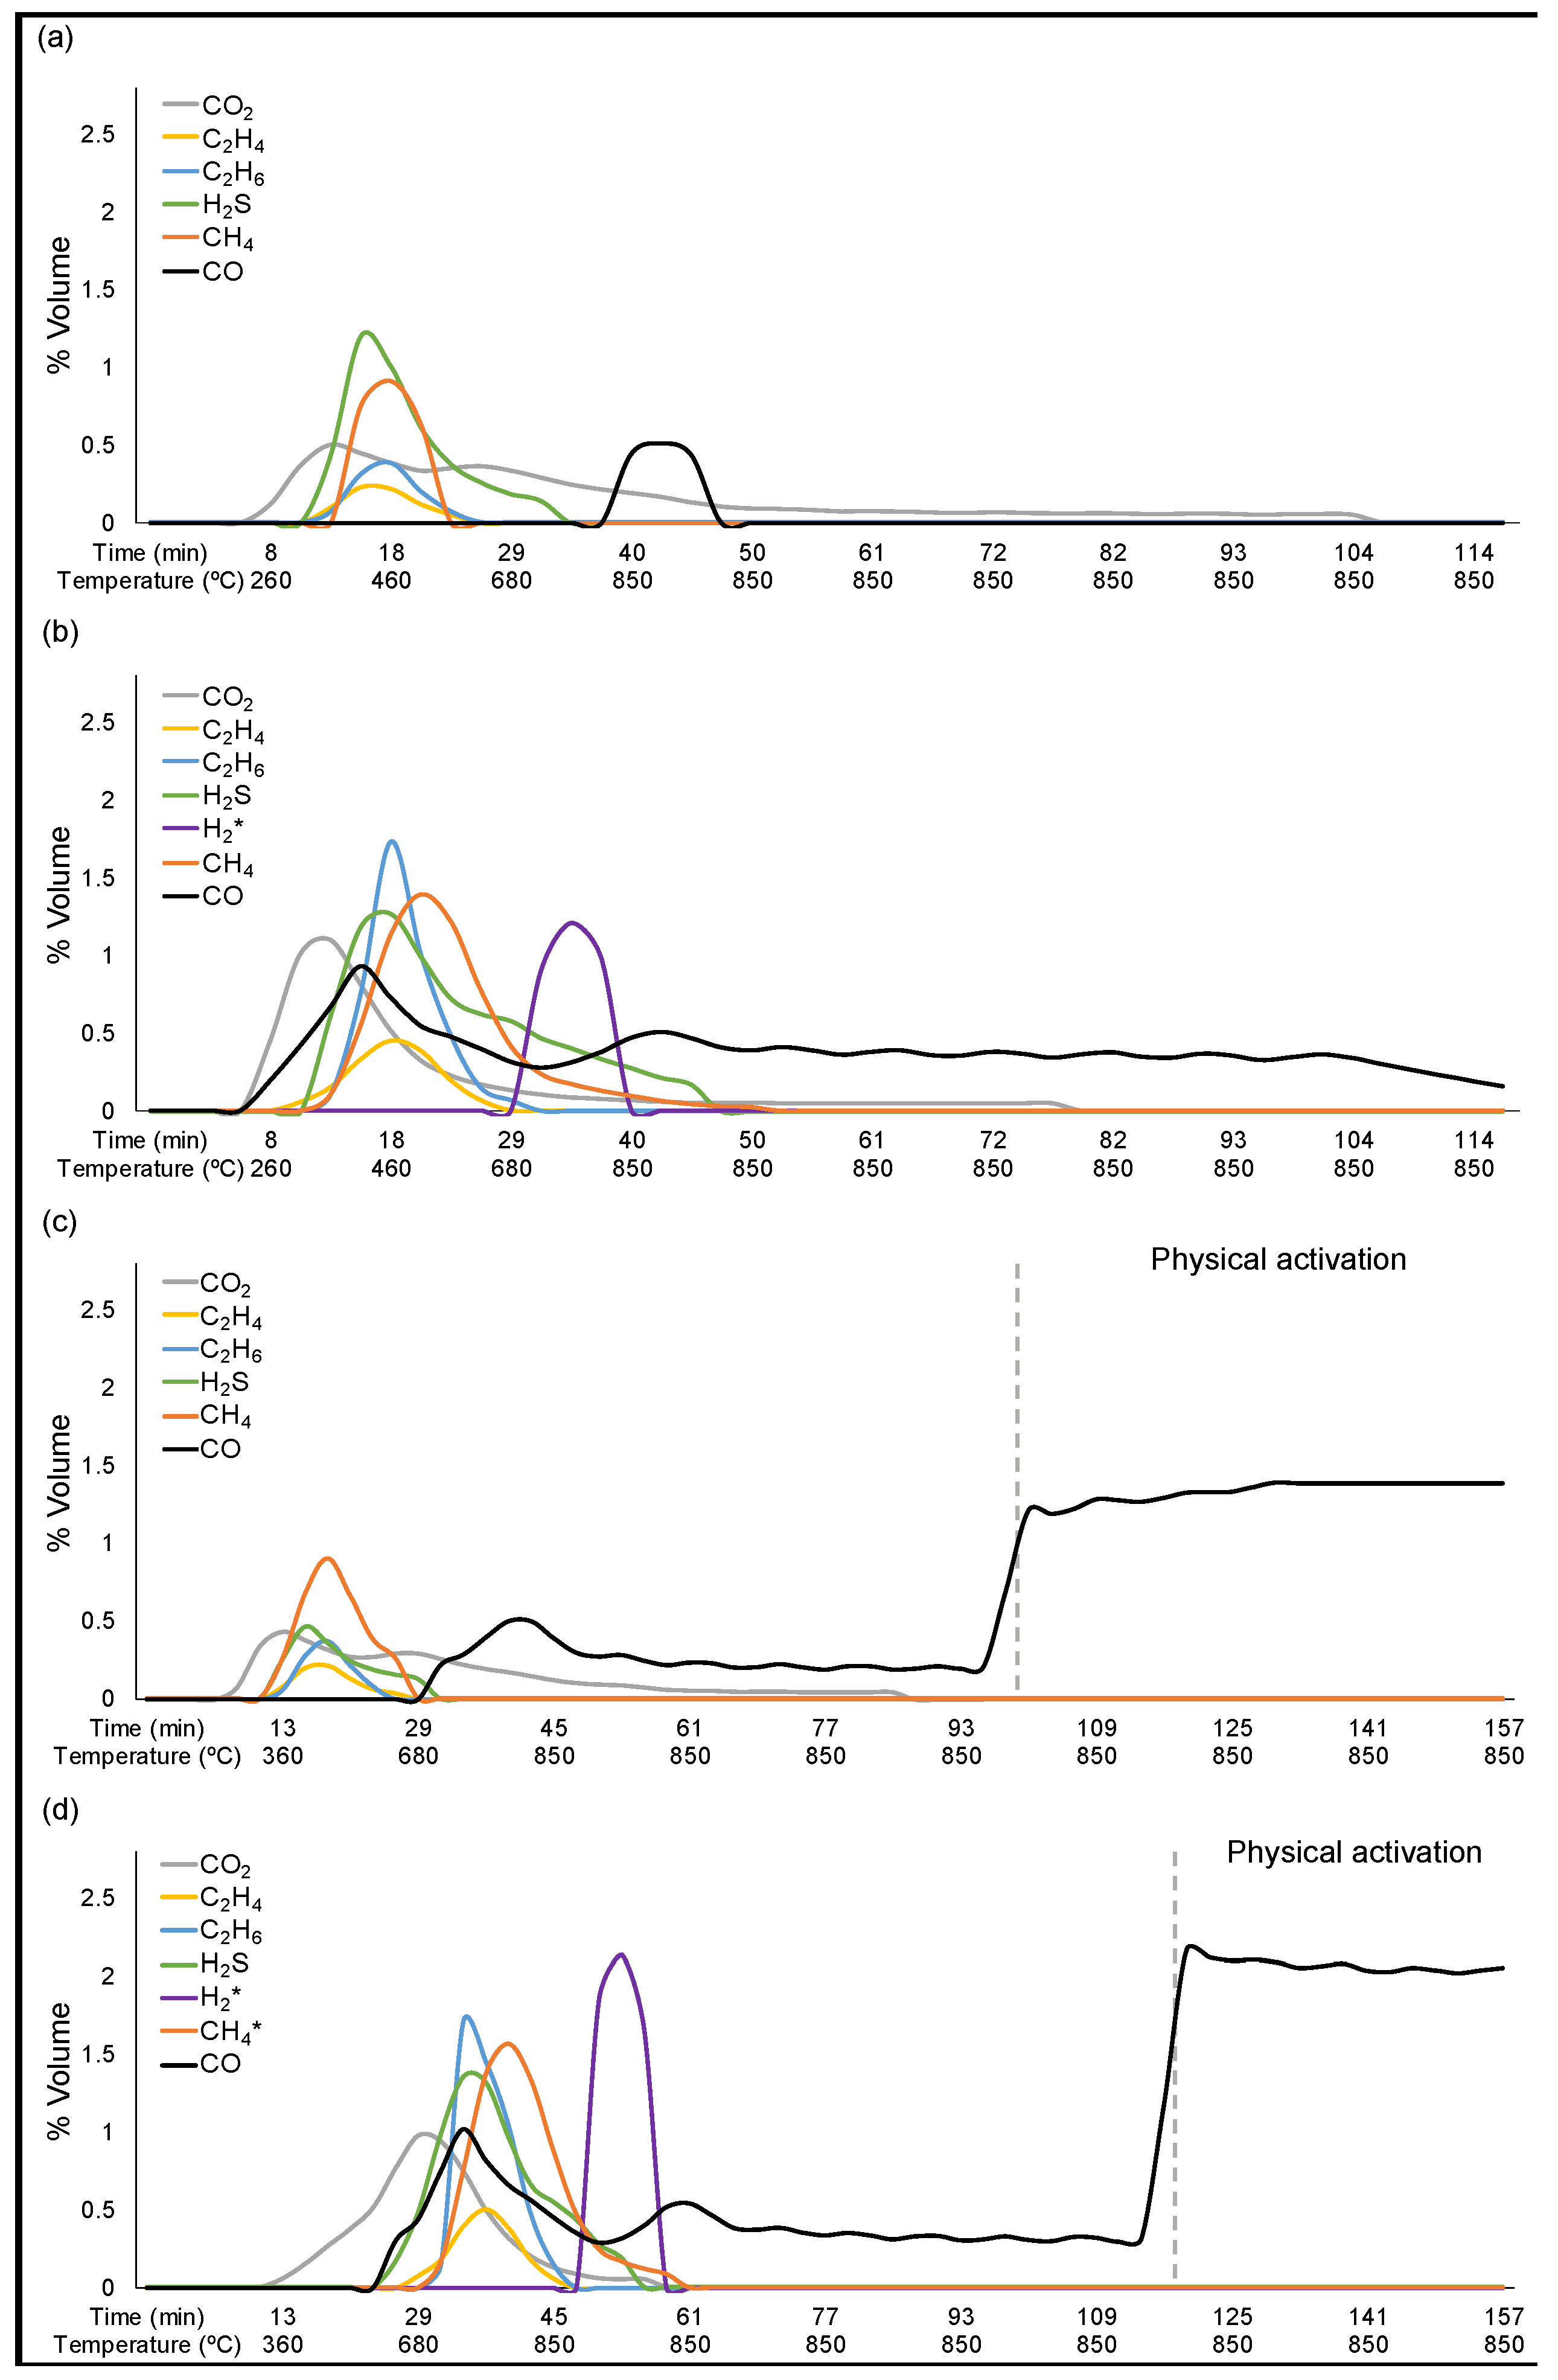
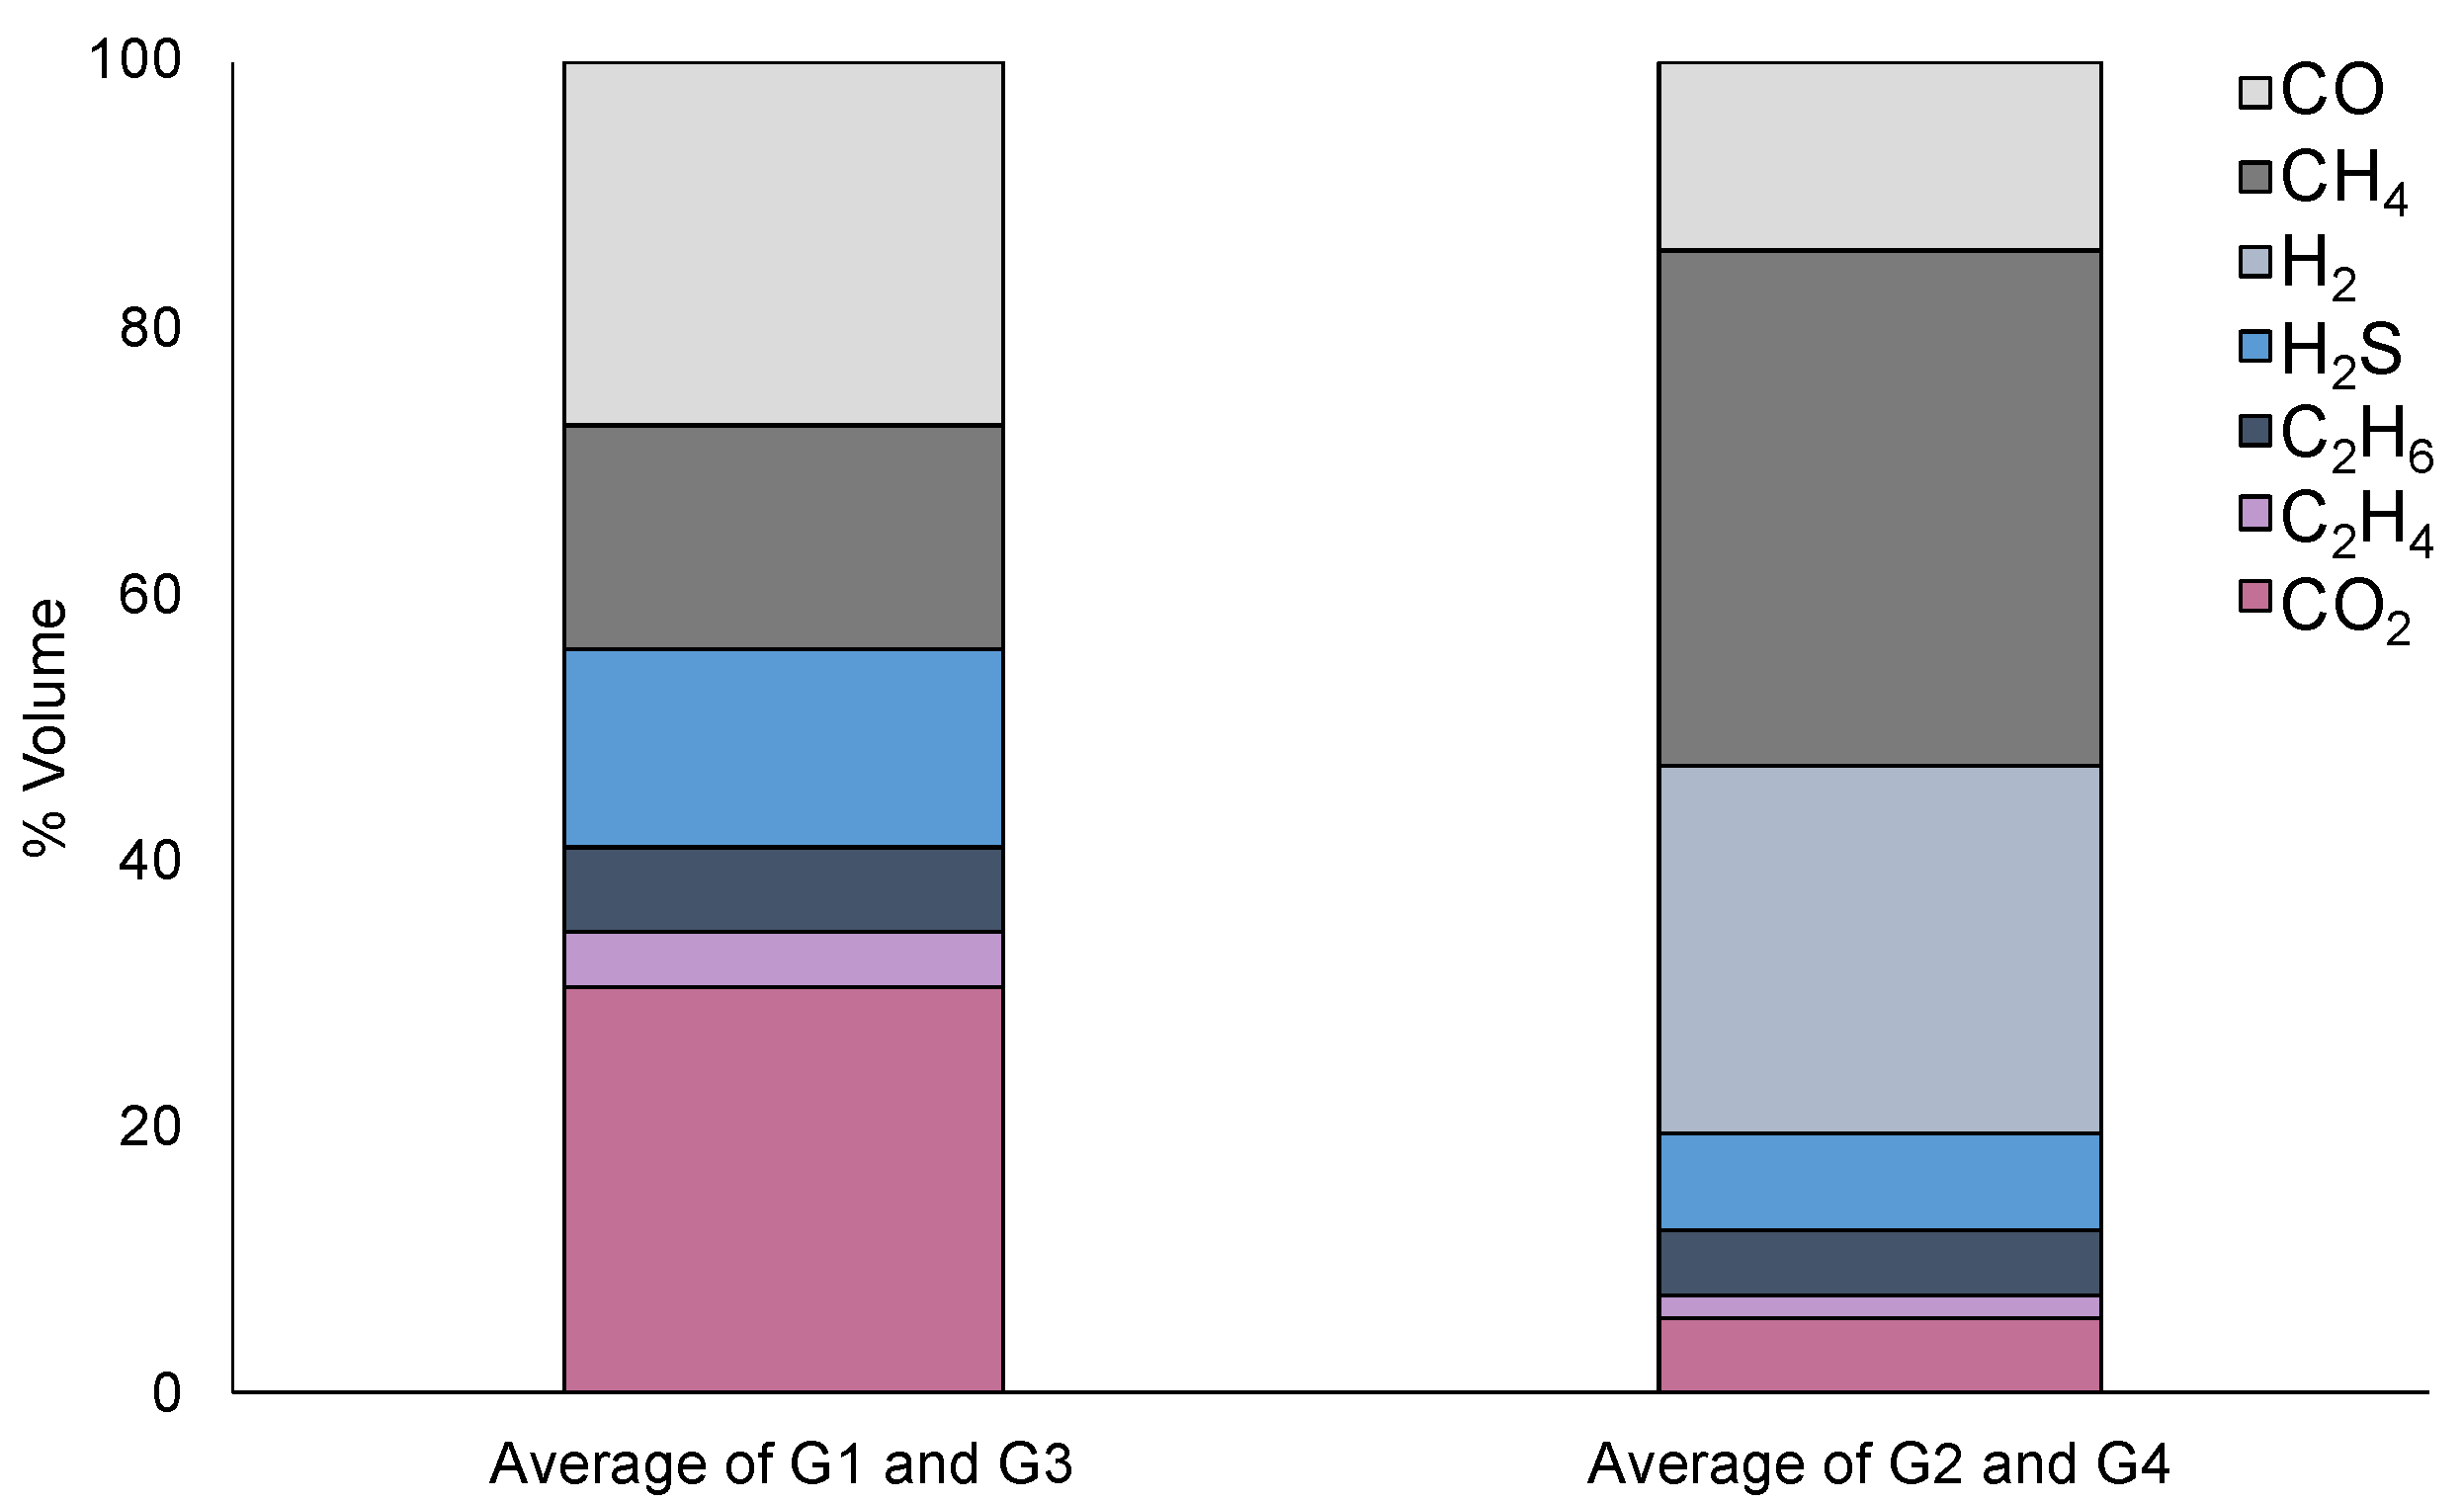
3.5. Gas Fraction Characterization

The gas fraction is mainly composed of H2, CO, CO2, CH4, C2H6, C2H4, and H2S. The changes in the composition of the evolved gas from pyrolysis with respect to time/temperature are presented in Figure 9. Most of the gas was produced after reaching a temperature of 300 °C. During pyrolysis, G1 and G3 presented the same behavior and composition, while the results of G2 and G4 were very similar to each other, indicating that the chemical activation caused the differences presented in the gas fraction. Some of the differences caused by the chemical activation were the generation of H2S at higher temperatures and the presence of H2, which were only observed with the acid-treated waste tire powder (G2 and G4). When temperature was maintained at 850 °C, only low concentrations of CO and CO2 were generated in all processes. Then, during physical activation (Processes 3 and 4), only CO was generated via the Boudouard reaction, in which the solid fraction (carbon) reacts with the injected CO2 to produce CO. The CO concentration was higher in processes involving the acid-treated tire powder.
Of relevance is the observed increase in H2S in the gas fraction, which is depicted in Figure 9b,d. H2SO4 is used during chemical activation; therefore, the gas fraction from the chemically activated waste tires presented a slight increase in H2S, which coincides with Susa and Haydary [34], who reported that, at higher temperatures, the sulfur tends to be distributed in the gas fraction. However, H2S is typically found in the pyrolytic gas from waste tires, owing to the decomposition of the sulfur links of the vulcanized rubber [53]. In addition, it has been reported that the thermal decomposition of H2SO4—adsorbed during the chemical activation—produces SO2. [54] In addition, the presence of H2SO3 could be also presented in the gas phase [55]. Therefore, further studies carefully analyzing the sulfur distribution on the different pyrolytic fractions when using acid-treated waste tire powder are required. As the presence of sulfur represents an obstacle to the utilization of the pyrolytic products, techniques for their removal should also be considered.
The differences in the total % in volume from each gas detected between gases from waste tire pyrolysis and chemically activated tire pyrolysis are presented in Figure 10. As all experiments were performed in a N2 atmosphere, data were analyzed on an N2-free basis. Although H2S is slightly higher in acid-treated waste tire powder, its proportion with respect to the total volume is much lower because a greater amount of other gases was generated. In the case of CO2, it is desirable to keep its percentage at a low level, as it has no energy value. This also occurs in the processes with the chemically activated waste tire powder. Another compound of interest is CH4. In this case, it is desirable to observe an increase that indicates a greater energy capacity of the gas, which is also observed in the processes using chemically activated waste tire powder.
As pyrolytic gas can be used as fuel for the same pyrolysis process, it is relevant to calculate its heating value using Equation 1. The heating value increases considerably when the chemical activation is included; G1 presented a value of 7.73 ± 1.53 MJ/kg and G3 of 12.57 ± 0.37 MJ/kg, while G2 presented a lower heating value of 27.47 ± 0.52 MJ/kg and G4 of 30.49 ± 0.34 MJ/kg.

4. Conclusions

In the present study, the effect of the chemical and physical activations on the characteristics of derived pyrolytic products was analyzed. As the solid fraction utilization can be responsible for the profitability of the pyrolysis process, a higher solid yield is desired, which was observed in the presence of chemical activation prior to pyrolysis. The properties of the solid fraction varied with the type of activation; while CO2 activation increased surface area, chemical activation decreased pore size. We observed a correlation between small pore size and high conductivity values. In this manner, the solid fraction from acid-treated tires presented the best electrical conductivity, higher than that of biomass-based electrode materials. Liquid fraction was highly influenced by the chemical activation; liquids derived from nonactivated waste tires presented limonene as the main compound, while liquids from acid-treated presented a higher percentage of aromatic compounds, suggesting that, during chemical activation, a significant percentage of volatiles that generate the liquid fraction was eliminated and aromatization reactions were favored because of the high pyrolysis temperature. The chemical activation also resulted in a greater concentration of gases, such as H2 and CH4, leading to a higher heating value. The enhanced properties of the pyrolytic products derived from acid-treated waste tires demonstrate the possibility of recovering valuable products, including a solid product for energy storage applications.

Author Contributions

Methodology, R.B.G.-G. and A.M.; investigation, R.B.G.-G., N.R.-G. and M.V.-P.; writing—original draft preparation, R.B.G.-G.; writing—review, A.M., G.G., S.O.M.-C. and P.C.; supervision, A.M.; funding acquisition, A.M. All authors have read and agreed to the published version of the manuscript.

Funding

This research was funded by Tecnologico de Monterrey and the Energy and Climate Change Research Group (Internal Grant 0020209I15).

Institutional Review Board Statement

Not applicable.

Informed Consent Statement

Not applicable.

Data Availability Statement

The data presented in this study are available on request from the corresponding author. The data are not publicly available because the study was funded with institutional resources.

Acknowledgments

R.B.G.-G. acknowledges the support received by Mexico’s National Council for Science and Technology (CONACYT) through its scholarship program.

Conflicts of Interest

The authors declare no conflict of interest.

References

  1. Nichols, W.; Smith, N. Waste Generation and Recycling Indices 2019 Overview and Findings; Verisk Maplecroft: Bath, UK, 2019. [Google Scholar]
  2. Ayoob, A.K.; Fadhil, A.B. Valorization of waste tires in the synthesis of an effective carbon based catalyst for biodiesel production from a mixture of non-edible oils. Fuel 2020, 264, 116754. [Google Scholar] [CrossRef]
  3. Machin, E.B.; Pedroso, D.T.; De Carvalho, J.A. Energetic valorization of waste tires. Renew. Sustain. Energy Rev. 2017, 68, 306–315. [Google Scholar] [CrossRef] [Green Version]
  4. Martínez, J.D.; Puy, N.; Murillo, R.; García, T.; Navarro, M.V.; Mastral, A.M. Waste tyre pyrolysis—A review. Renew. Sustain. Energy Rev. 2013, 23, 179–213. [Google Scholar] [CrossRef]
  5. Peronard, J.P.; Ballantyne, A.G. Broadening the understanding of the role of consumer services in the circular economy: Toward a conceptualization of value creation processes. J. Clean. Prod. 2019, 239, 118010. [Google Scholar] [CrossRef]
  6. Alsaleh, A.; Sattler, M.L. Waste Tire Pyrolysis: Influential Parameters and Product Properties. Curr. Sustain. Energy Rep. 2014, 1, 129–135. [Google Scholar] [CrossRef] [Green Version]
  7. Aylón, E.; Fernández-Colino, A.; Murillo, R.; Navarro, M.V.; García, T.; Mastral, A.M. Valorisation of waste tyre by pyrolysis in a moving bed reactor. Waste Manag. 2010, 30, 1220–1224. [Google Scholar] [CrossRef] [PubMed]
  8. Juma, M.; Koreňová, Z.; Markoš, J.; Jelemensky, L.; Bafrnec, M. Pyrolysis and combustion of scrap tire. Pet. Coal 2006, 48, 15–26. [Google Scholar]
  9. Kar, Y. Catalytic pyrolysis of car tire waste using expanded perlite. Waste Manag. 2011, 31, 1772–1782. [Google Scholar] [CrossRef]
  10. Kyari, M.; Cunliffe, A.; Williams, P.T. Characterization of oils, gases, and char in relation to the pyrolysis of different brands of scrap automotive tires. Energy Fuels 2005, 19, 1165–1173. [Google Scholar] [CrossRef]
  11. Gauthier-Maradei, P.; Valderrama, Y.C.; Nabarlatz, D. Mathematical Model of Scrap Tire Rubber Pyrolysis in a Non-isothermal Fixed Bed Reactor: Definition of a Chemical Mechanism and Determination of Kinetic Parameters. Waste Biomass Valori. 2019, 10, 561–573. [Google Scholar] [CrossRef]
  12. Gauthier-Maradei, P.; Ruiz, C.P.T.; Capron, M. Oil and Aromatic Yield Maximization During Pyrolysis of Scrap Tire Rubber. Waste Biomass Valori. 2019, 10, 3723–3733. [Google Scholar] [CrossRef]
  13. Koreňová, Z.; Juma, M.; Annus, J.; Markoš, J.; Jelemenský, L. Kinetics of pyrolysis and properties of carbon black from a scrap tire. Chem. Pap. 2006, 60, 422–426. [Google Scholar] [CrossRef]
  14. Martínez, J.D.; Cardona-Uribe, N.; Murillo, R.; García, T.; López, J.M. Carbon black recovery from waste tire pyrolysis by demineralization: Production and application in rubber compounding. Waste Manag. 2019, 85, 574–584. [Google Scholar] [CrossRef] [Green Version]
  15. Maroufi, S.; Mayyas, M.; Sahajwalla, V. Nano-carbons from waste tyre rubber: An insight into structure and morphology. Waste Manag. 2017, 69, 110–116. [Google Scholar] [CrossRef] [PubMed]
  16. Wójtowicz, M.A.; Serio, M.A. Pyrolysis of Scrap Tires: Can It Be profitable? Chemtech: Rio de Janeiro, Brazil, 1996. [Google Scholar]
  17. López, F.A.; Centeno, T.A.; Rodríguez, O.; Alguacil, F.J. Preparation and characterization of activated carbon from the char produced in the thermolysis of granulated scrap tyres. J. Air Waste Manag. Assoc. 2013, 63, 534–544. [Google Scholar] [CrossRef] [PubMed] [Green Version]
  18. Kaminsky, W.; Mennerich, C. Pyrolysis of synthetic tire rubber in a fluidised-bed reactor to yield 1,3-butadiene, styrene and carbon black. J. Anal. Appl. Pyrolysis 2001, 58–59, 803–811. [Google Scholar] [CrossRef]
  19. Ko, D.; Mui, E.; Lau, K.; McKay, G. Production of activated carbons from waste tire-Process design and economical analysis. Waste Manag. 2004, 24, 875–888. [Google Scholar] [CrossRef]
  20. López, G.; Olazar, M.; Artetxe, M.; Amutio, M.; Elordi, G.; Bilbao, J. Steam activation of pyrolytic tyre char at different temperatures. J. Anal. Appl. Pyrolysis 2009, 85, 539–543. [Google Scholar] [CrossRef]
  21. Teng, H.; Lin, Y.C.; Hsu, L.Y. Production of activated carbons from pyrolysis of waste tires impregnated with potassium hydroxide. J. Air Waste Manag. Assoc. 2011, 50, 1940–1946. [Google Scholar] [CrossRef] [Green Version]
  22. Li, S.; Yao, Q.; Wen, S.; Chi, Y.; Yan, J.; Li, S.; Yao, Q. Properties of Pyrolytic Chars and Activated Carbons Derived from Pilot-Scale Pyrolysis of Used Tires. J Air Waste Manag. Assoc. 2005, 55, 1315–1326. [Google Scholar] [CrossRef] [PubMed] [Green Version]
  23. Bergna, D.; Varila, T.; Romar, H.; Lassi, U. Comparison of the Properties of Activated Carbons Produced in One-Stage and Two-Stage Processes. C 2018, 4, 41. [Google Scholar] [CrossRef] [Green Version]
  24. Dimpe, K.M.; Ngila, J.C.; Nomngongo, P.N. Application of waste tyre-based activated carbon for the removal of heavy metals in wastewater. Cogent Eng. 2017, 4, 1–11. [Google Scholar] [CrossRef]
  25. Shilpa; Kumar, R.; Sharma, A. Morphologically tailored activated carbon derived from waste tires as high-performance anode for Li-ion battery. J. Appl. Electrochem. 2018, 48, 1–13. [Google Scholar] [CrossRef]
  26. Naskar, A.K.; Bi, Z.; Li, Y.; Akato, S.K.; Saha, D.; Chi, M.; Bridges, C.A.; Paranthaman, M.P. Tailored recovery of carbons from waste tires for enhanced performance as anodes in lithium-ion batteries. RSC Adv. 2014, 4, 38213–38221. [Google Scholar] [CrossRef]
  27. Juma, M.; Koreňová, Z.; Markoš, J.; Jelemensky, L.; Bafrnec, M. Experimental study of pyrolysis and combustion of scrap tire. Polym. Adv. Technol. 2007, 18, 144–148. [Google Scholar] [CrossRef]
  28. Sathiskumar, C.; Karthikeyan, S. Recycling of waste tires and its energy storage application of by-products—A review. Sustain. Mater. Technol. 2019, 22, e00125. [Google Scholar] [CrossRef]
  29. Ayoob, A.K.; Fadhil, A.B. Biodiesel production through transesterification of a mixture of non-edible oils over lithium supported on activated carbon derived from scrap tires. Energy Convers. Manag. 2019, 201, 112149. [Google Scholar] [CrossRef]
  30. Brunauer, S.; Emmett, P.H.; Teller, E. Adsorption of Gases in Multimolecular Layers. J. Am. Chem. Soc. 1938, 60, 309–319. [Google Scholar] [CrossRef]
  31. Barrett, E.P.; Joyner, L.G.; Halenda, P.P. The Determination of Pore Volume and Area Distributions in Porous Substances. I. Computations from Nitrogen Isotherms. J. Am. Chem. Soc. 1951, 73, 373–380. [Google Scholar]
  32. Ansbæk, T.; Petersen, D.H.; Hansen, O.; Larsen, J.B.; Hansen, T.M.; Bøggild, P. Fundamental size limitations of micro four-point probes. Microelectron. Eng. 2009, 86, 987–990. [Google Scholar] [CrossRef]
  33. Ruiz-Gómez, N.; Quispe, V.; Ábrego, J.; Atienza-Martínez, M.; Murillo, M.B.; Gea, G. Co-pyrolysis of sewage sludge and manure. Waste Manag. 2017, 59, 211–221. [Google Scholar] [CrossRef] [Green Version]
  34. Susa, D.; Haydary, J. Sulphur distribution in the products of waste tire pyrolysis. Chem. Pap. 2013, 67, 1521–1526. [Google Scholar] [CrossRef]
  35. Cunliffe, A.M.; Williams, P.T. Composition of oils derived from the batch pyrolysis of tyres. J. Anal. Appl. Pyrolysis 1998, 44, 131–152. [Google Scholar] [CrossRef]
  36. Larsen, M.B.; Schultz, L.; Glarborg, P.; Skaarup-Jensen, L.; Dam-Johansen, K.; Frandsen, F.; Henriksen, U. Devolatilization characteristics of large particles of tyre rubber under combustion conditions. Fuel 2006, 85, 1335–1345. [Google Scholar] [CrossRef]
  37. Lee, J.M.; Lee, J.S.; Kim, J.R.; Kim, S.D. Pyrolysis of waste tires with partial oxidation in a fluidized-bed reactor. Energy 1995, 20, 969–976. [Google Scholar] [CrossRef]
  38. Mikulova, Z.; Sedenkova, I.; Matejova, L.; Vecer, M.; Dombek, V. Study of carbon black obtained by pyrolysis of waste scrap tyres. J. Therm. Anal. Calorim. 2013, 111, 1475–1481. [Google Scholar] [CrossRef]
  39. Choi, G.G.; Jung, S.H.; Oh, S.J.; Kim, J.S. Total utilization of waste tire rubber through pyrolysis to obtain oils and CO2 activation of pyrolysis char. Fuel Process. Technol. 2014, 123, 57–64. [Google Scholar] [CrossRef]
  40. Kwon, E.; Castaldi, M.J. Fundamental understanding of the thermal degradation mechanisms of waste tires and their air pollutant generation in a N2 atmosphere. Environ. Sci. Technol. 2009, 43, 5996–6002. [Google Scholar] [CrossRef]
  41. Williams, P.T.; Besler, S. Pyrolysis-thermogravimetric analysis of tyres and tyre components. Fuel 1995, 74, 1277–1283. [Google Scholar] [CrossRef]
  42. Parthasarathy, P.; Choi, H.S.; Park, H.C.; Hwang, J.G.; Yoo, H.S.; Lee, B.K.; Upadhyay, M. Influence of process conditions on product yield of waste tyre pyrolysis—A review. Korean J. Chem. Eng. 2016, 33, 2268–2286. [Google Scholar] [CrossRef] [Green Version]
  43. Zhang, X.; Li, H.; Cao, Q.; Jin, L.; Wang, F. Upgrading pyrolytic residue from waste tires to commercial carbon black. Waste Manag. Res. 2018, 36, 436–444. [Google Scholar] [CrossRef] [PubMed] [Green Version]
  44. Luo, H.M.; Chen, H.; Chen, Y.Z.; Li, P.; Zhang, J.Q.; Zhao, X. Simple synthesis of porous carbon materials for high-performance supercapacitors. J. Appl. Electrochem. 2016, 46, 703–712. [Google Scholar] [CrossRef]
  45. Zhang, W.; Zou, Y.; Yu, C.; Zhong, W. Nitrogen-enriched compact biochar-based electrode materials for supercapacitors with ultrahigh volumetric performance. J. Power Sources 2019, 439, 227067. [Google Scholar] [CrossRef]
  46. Parant, H.; Muller, G.; Le Mercier, T.; Tarascon, J.M.; Poulin, P.; Colin, A. Flowing suspensions of carbon black with high electronic conductivity for flow applications: Comparison between carbons black and exhibition of specific aggregation of carbon particles. Carbon 2017, 119, 10–20. [Google Scholar] [CrossRef]
  47. Xu, S.; Lai, D.; Zeng, X.; Zhang, L.; Han, Z.; Cheng, J.; Wu, R.; Mašek, O.; Xu, G. Pyrolysis characteristics of waste tire particles in fixed-bed reactor with internals. Carbon Resour. Convers. 2018, 1, 228–237. [Google Scholar] [CrossRef]
  48. Zhang, X.; Wang, T.; Ma, L.; Chang, J. Vacuum pyrolysis of waste tires with basic additives. Waste Manag. 2008, 28, 2301–2310. [Google Scholar] [CrossRef]
  49. Danon, B.; Van Der Gryp, P.; Schwarz, C.E.; Görgens, J.F. A review of dipentene (dl-limonene) production from waste tire pyrolysis. J. Anal. Appl. Pyrolysis 2015, 112, 1–13. [Google Scholar] [CrossRef]
  50. Mkhize, N.M.; van der Gryp, P.; Danon, B.; Görgens, J.F. Effect of temperature and heating rate on limonene production from waste tyre pyrolysis. J. Anal. Appl. Pyrolysis 2016, 120, 314–320. [Google Scholar] [CrossRef]
  51. Zhang, J.; Zhang, X.; Wu, L.; Wang, T.; Zhao, J.; Zhang, Y.; Men, Z.; Mao, H. Occurrence of benzothiazole and its derivates in tire wear, road dust, and roadside soil. Chemosphere 2018, 201, 310–317. [Google Scholar] [CrossRef]
  52. Aydin, H.; Ilkiliç, C. Optimization of fuel production from waste vehicle tires by pyrolysis and resembling to diesel fuel by various desulfurization methods. Fuel 2012, 102, 605–612. [Google Scholar] [CrossRef]
  53. Nkosi, N.; Muzenda, E. A review and discussion of waste tyre pyrolysis and derived products. In Proceedings of the World Congress on Engineering 2014, London, UK, 2–4 July 2014; Volume 2. [Google Scholar]
  54. Corgnale, C.; Gorensek, M.B.; Summers, W.A. Review of sulfuric acid decomposition processes for sulfur-based thermochemical hydrogen production cycles. Processes 2020, 8, 1383. [Google Scholar] [CrossRef]
  55. Sülzle, D.; Verhoeven, M.; Terlouw, J.K.; Schwarz, H. Generation and Characterization of Sulfurous Acid (H2SO3) and of Its Radical Cation as Stable Species in the Gas Phase. Angew. Chem. Int. Ed. Engl. 1988, 27, 1533–1534. [Google Scholar] [CrossRef]
Figure 1. Illustration of the pyrolysis reactor unit, consisting of a fixed bed reactor followed by a condensation system at 0 °C and a micro-GC for gas characterization.
Applsci 11 06342 g001
Figure 2. Four-point methodology (upper panel: schematic representation of the four-point probe device; lower left panel: visualization of the sample thickness distribution; and lower right panel: average longitudinal thickness of the sample).
Applsci 11 06342 g002
Figure 3. Thermogravimetric analysis performed under N2 atmosphere: (a) thermograms and (b) derivative thermograms of waste tire powder and acid-treated waste tire powder.
Applsci 11 06342 g003
Figure 4. Scanning electron microscope images of solid fraction from the pyrolysis/activation processes performed. Note: Magnification is indicated in the columns and carbon black solid samples in the rows.
Applsci 11 06342 g004
Figure 5. Plots of (a) adsorption–desorption isotherms and (b) pore size distribution for all pyrolysis solids.
Applsci 11 06342 g005
Figure 6. (a) Boxplots of conductivity results and (b) plot of Tukey’s test. Notes: Boxplots show the median, mean, interquartile range, and range from each solid fraction; if an interval in Tukey’s test plot does not contain zero, the corresponding means are significantly different.
Applsci 11 06342 g006
Figure 7. Analysis of the conductivity results: (a) surface area effect and (b) pore size effect on the electrical conductivity.
Applsci 11 06342 g007
Figure 8. Liquid fraction qualitative characterization classified by aliphatic, aromatics, heterocyclic aromatics, compounds with heteroatoms, and unknown compounds.
Applsci 11 06342 g008
Figure 9. Composition of the evolved gas with respect to time/temperature from (a) G1, (b) G2, (c) G3, and (d) G4. Notes: H2 and CH4 concentrations in (b,d) were divided by four for comparison purposes with values obtained in (a,c); the remaining % in volume corresponds to injected gases (N2 and CO2).
Applsci 11 06342 g009
Figure 10. Gas fraction composition on a nitrogen-free basis of pyrolysis of waste tire powder without chemical activation (average of G1 and G3) and pyrolysis of chemically activated waste tire powder (average of G2 and G4). Note: Gas produced during physical activation was not considered.
Applsci 11 06342 g010
Table 1. Proximal and elemental analyses of the waste tire powder and acid-treated waste tire powder.
Waste Tire PowderAcid-Treated Waste Tire Powder
Moisture (wt%)1.12 ± 0.091.65 ± 0.19
Ash (wt%)6.55 ± 0.233.94 ± 0.07
Volatile matter (wt%)67.16 ± 0.0447.04 ± 0.58
Fixed carbon a (wt%)25.16 ± 0.1847.37 ± 0.46
Nitrogen (wt%)0.32 ± 0.010.26 ± 0.25
Carbon (wt%)81.52 ± 0.0871.63 ± 0.28
Hydrogen (wt%)7.34 ± 0.094.02 ± 0.12
Sulfur (wt%)1.76 ± 0.096.93 ± 0.19
Oxygen and other a (wt%)9.06 ± 0.1317.16 ± 0.56
a Calculated by difference.
Table 2. Solid, gas, and liquid yields of each pyrolysis process expressed as a percentage of the weight of the sample fed into the pyrolysis reactor. Note: Average and standard deviation were calculated considering only experimentally reliable values.
ProcessSolid (%)Liquid (%)Gas (%) a
1Pyrolysis34.69 ± 2.5465.791.32
2Chemical activation and pyrolysis57.19 ± 0.0713.59 ± 5.5729.21 ± 5.50
3Pyrolysis and physical activation24.82 ± 2.3260.9315.89
4Chemical activation, pyrolysis, and physical activation52.22 ± 1.589.1 ± 1.1038.7 ± 0.48
a Calculated by difference.
Table 3. Surface area, pore size, pore volume, and conductivity results of solid fraction from each process.
Solid SampleProcessSurface Area (m2/g)Pore Size (nm)Pore Volume (cm3/g)Conductivity (Ω−1 m−1)
S1Pyrolysis107.933.00.90.7 ± 0.3
S2Chemical activation and pyrolysis151.55.10.21.9 ± 0.2
S3Pyrolysis and physical activation313.413.41.01.3 ± 0.1
S4Chemical activation, pyrolysis, and physical activation339.13.60.32.4 ± 0.1
Table 4. Main compounds found within the liquid fraction from each process expressed as area %.
L1 L2 L3 L4
CompoundArea %CompoundArea %CompoundArea %CompoundArea %
D-limonene23Naphthalene42D-limonene27Naphthalene32
Benzene8Benzothiazole6Benzene9Benzothiazole7
Quinoline5Anthracene6Benzothiazole5Pyrene6
Benzenediamine5Benzene5Benzenediamine5Anthracene6
Benzothiazole4Indene5Quinoline5Benzene5
Naphthalene3Biphenyl4Styrene5Indene5
Heptan-2-one, 6-hydroxy-5-methyl-6-vinyl3Quinoline4Xylene4Difenil4
Styrene3Pyrene3Heptan-2-one, 6-hydroxy-5-methyl-6-vinyl4Phenanthrene3
Other compounds a12Other compounds b7Other compounds a12Other compounds b9
Unknown33Unknown18Unknown23Unknown24
a Insignificant amounts of compounds such as indene, p-Cymene, heptatriene, and cyclohexene; b insignificant amounts of compounds such as mesitylene, chamazulene, and fluorene.
Publisher’s Note: MDPI stays neutral with regard to jurisdictional claims in published maps and institutional affiliations.

