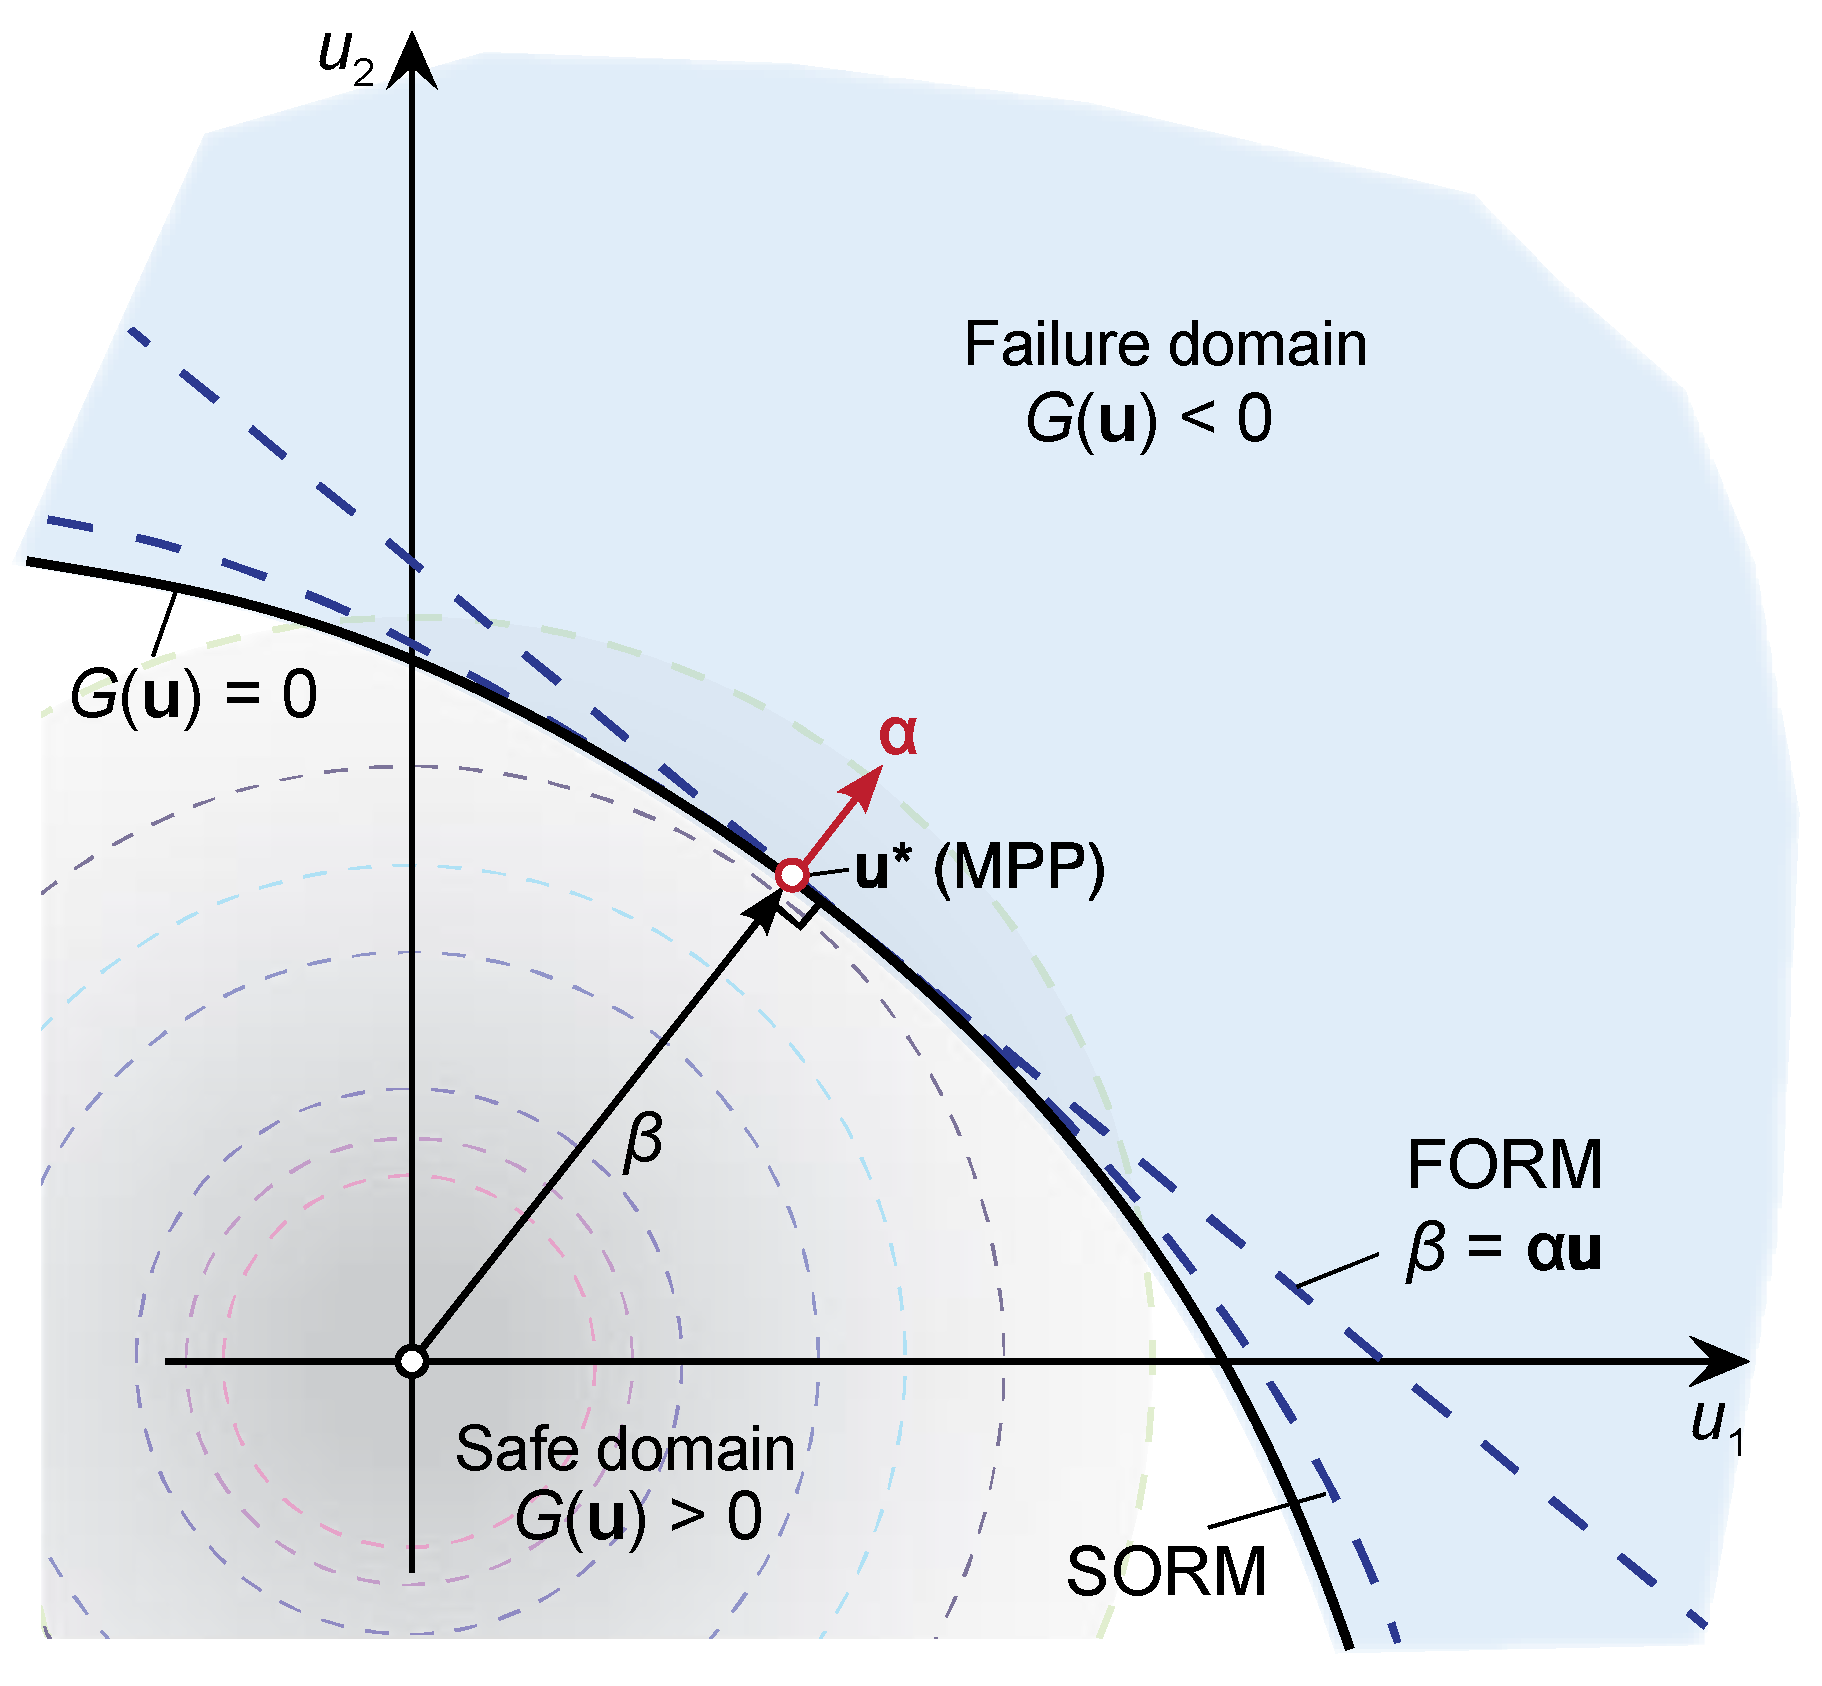
Figure 1.
Illustration of the first-order reliability method (FORM) and second-order reliability method (SORM) for a reliability problem.
Figure 1.
Illustration of the first-order reliability method (FORM) and second-order reliability method (SORM) for a reliability problem.
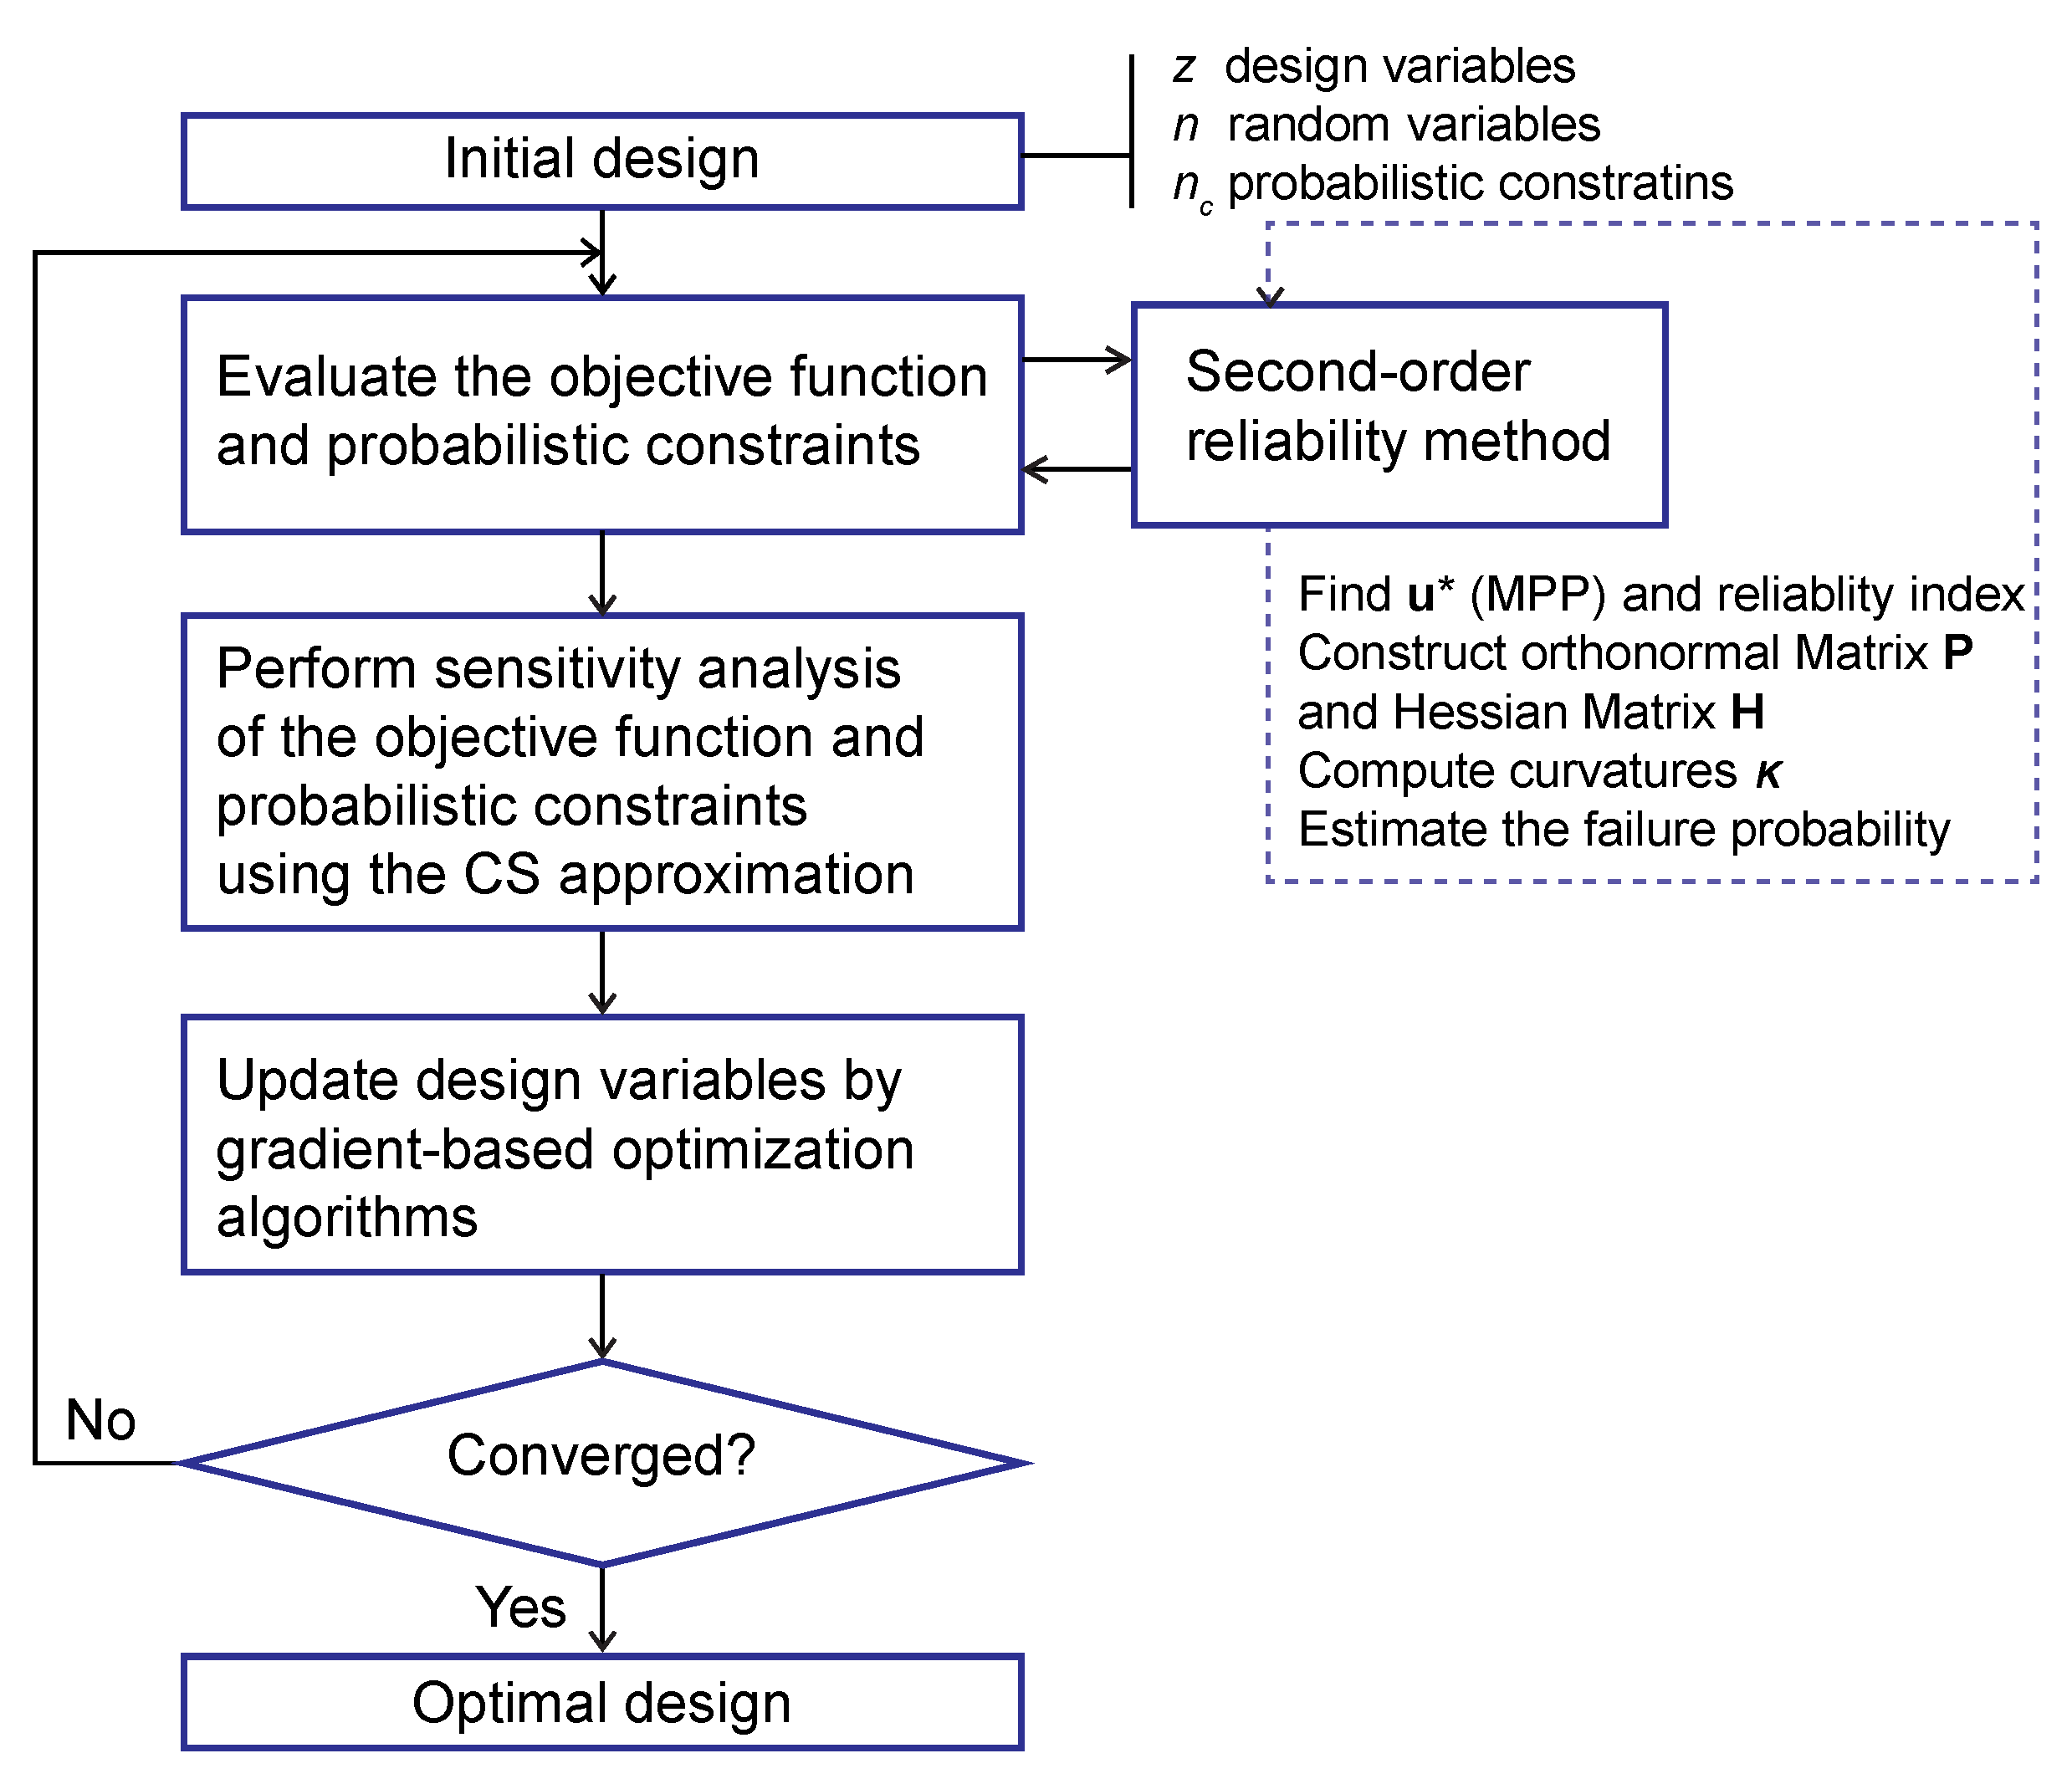
Figure 2.
Process flow of the reliability-based design optimization (RBDO) using the complex-step (CS) derivative approximation with SORM/SORM-i algorithms.
Figure 2.
Process flow of the reliability-based design optimization (RBDO) using the complex-step (CS) derivative approximation with SORM/SORM-i algorithms.
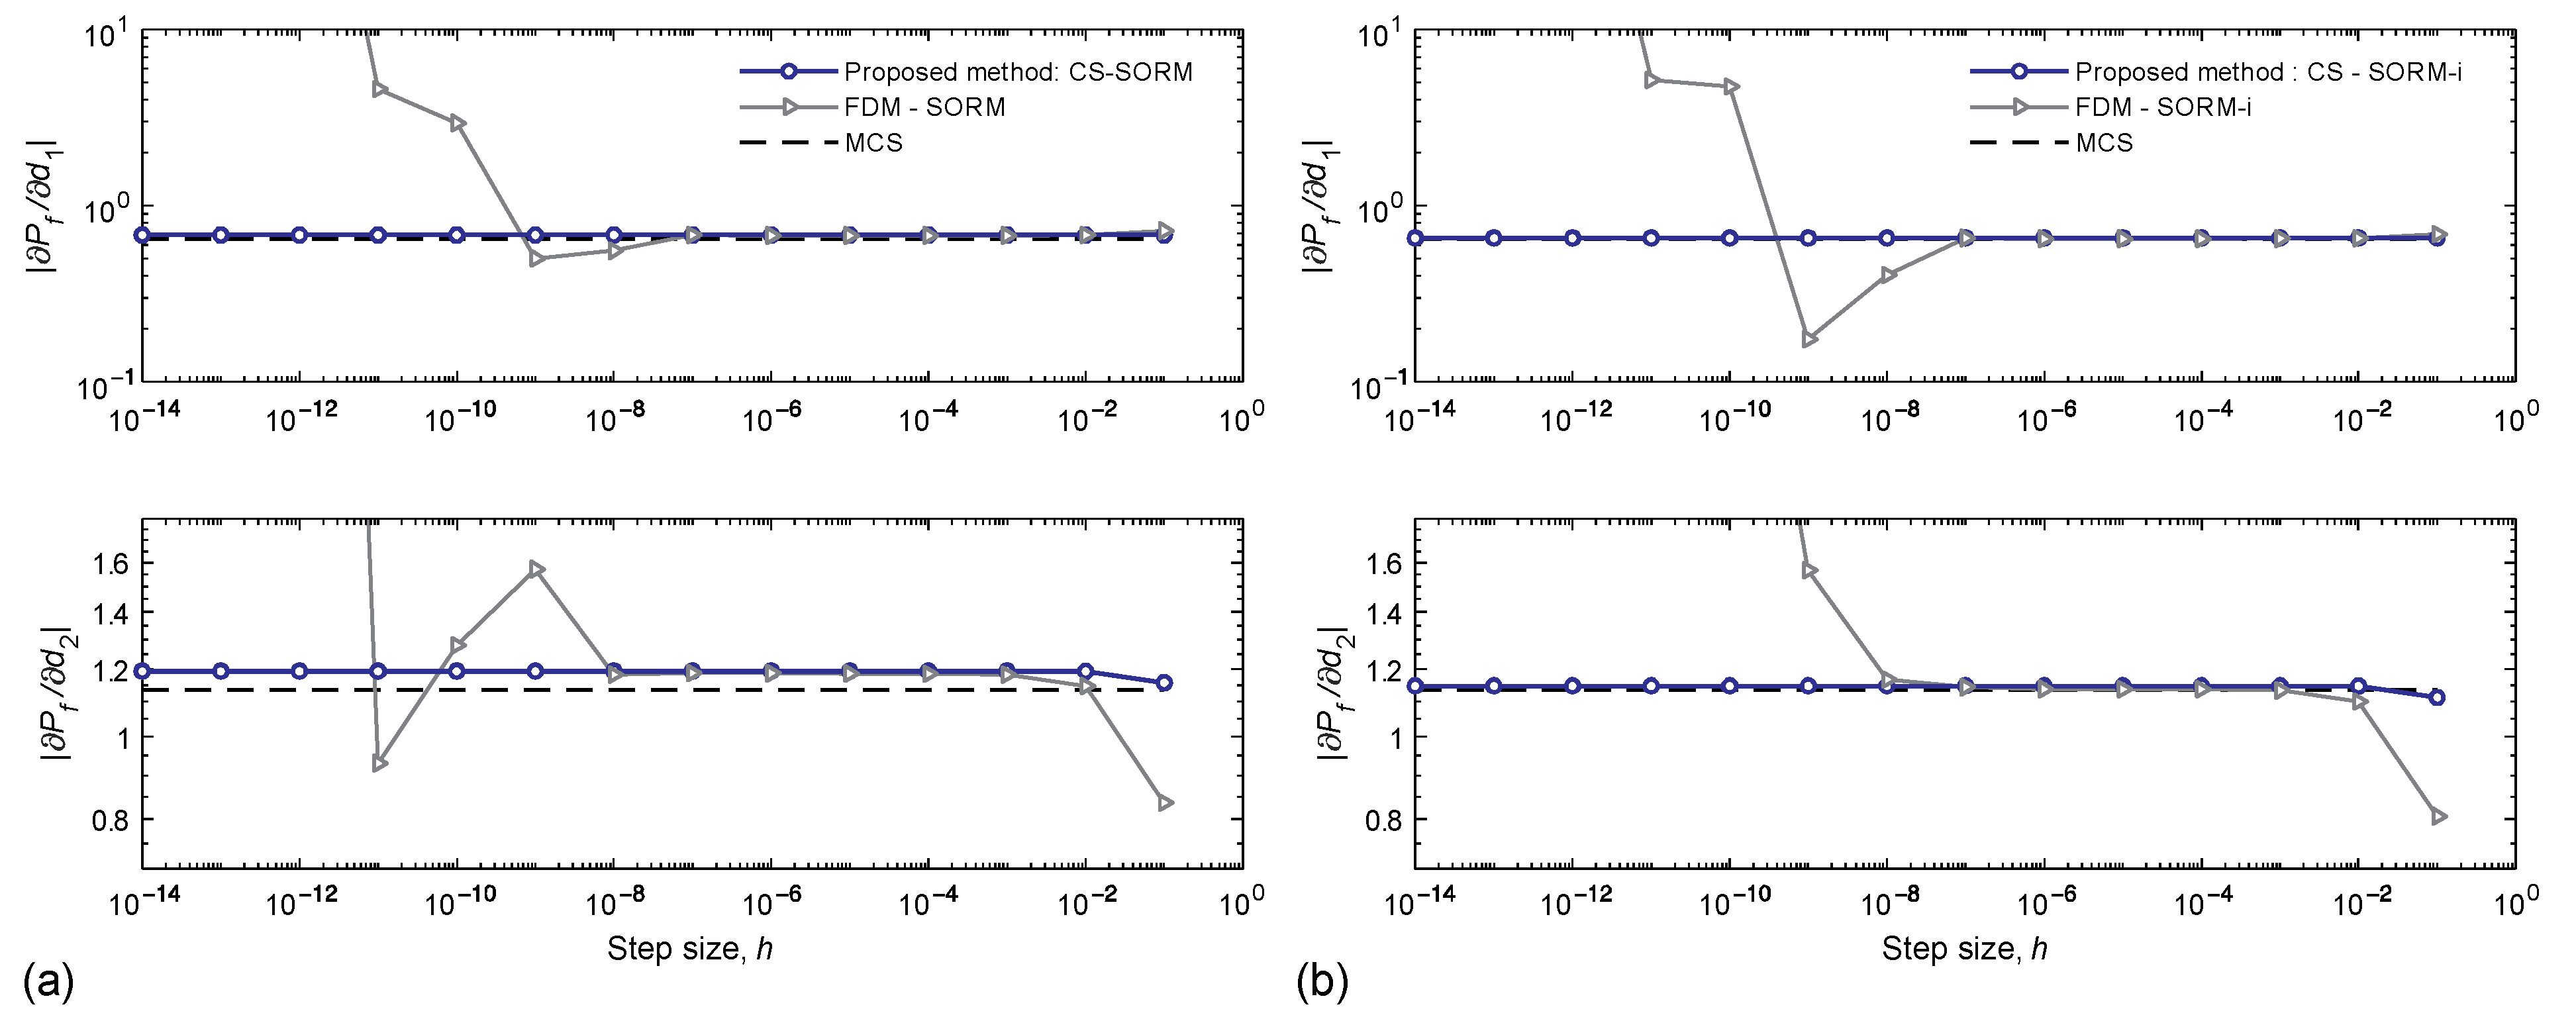
Figure 3.
Effect of the step size on the accuracy of the sensitivity analysis performed using the finite difference method (FDM), monte carlo simulation (MCS), and (a) CS–SORM and (b) CS–SORM-i.
Figure 3.
Effect of the step size on the accuracy of the sensitivity analysis performed using the finite difference method (FDM), monte carlo simulation (MCS), and (a) CS–SORM and (b) CS–SORM-i.
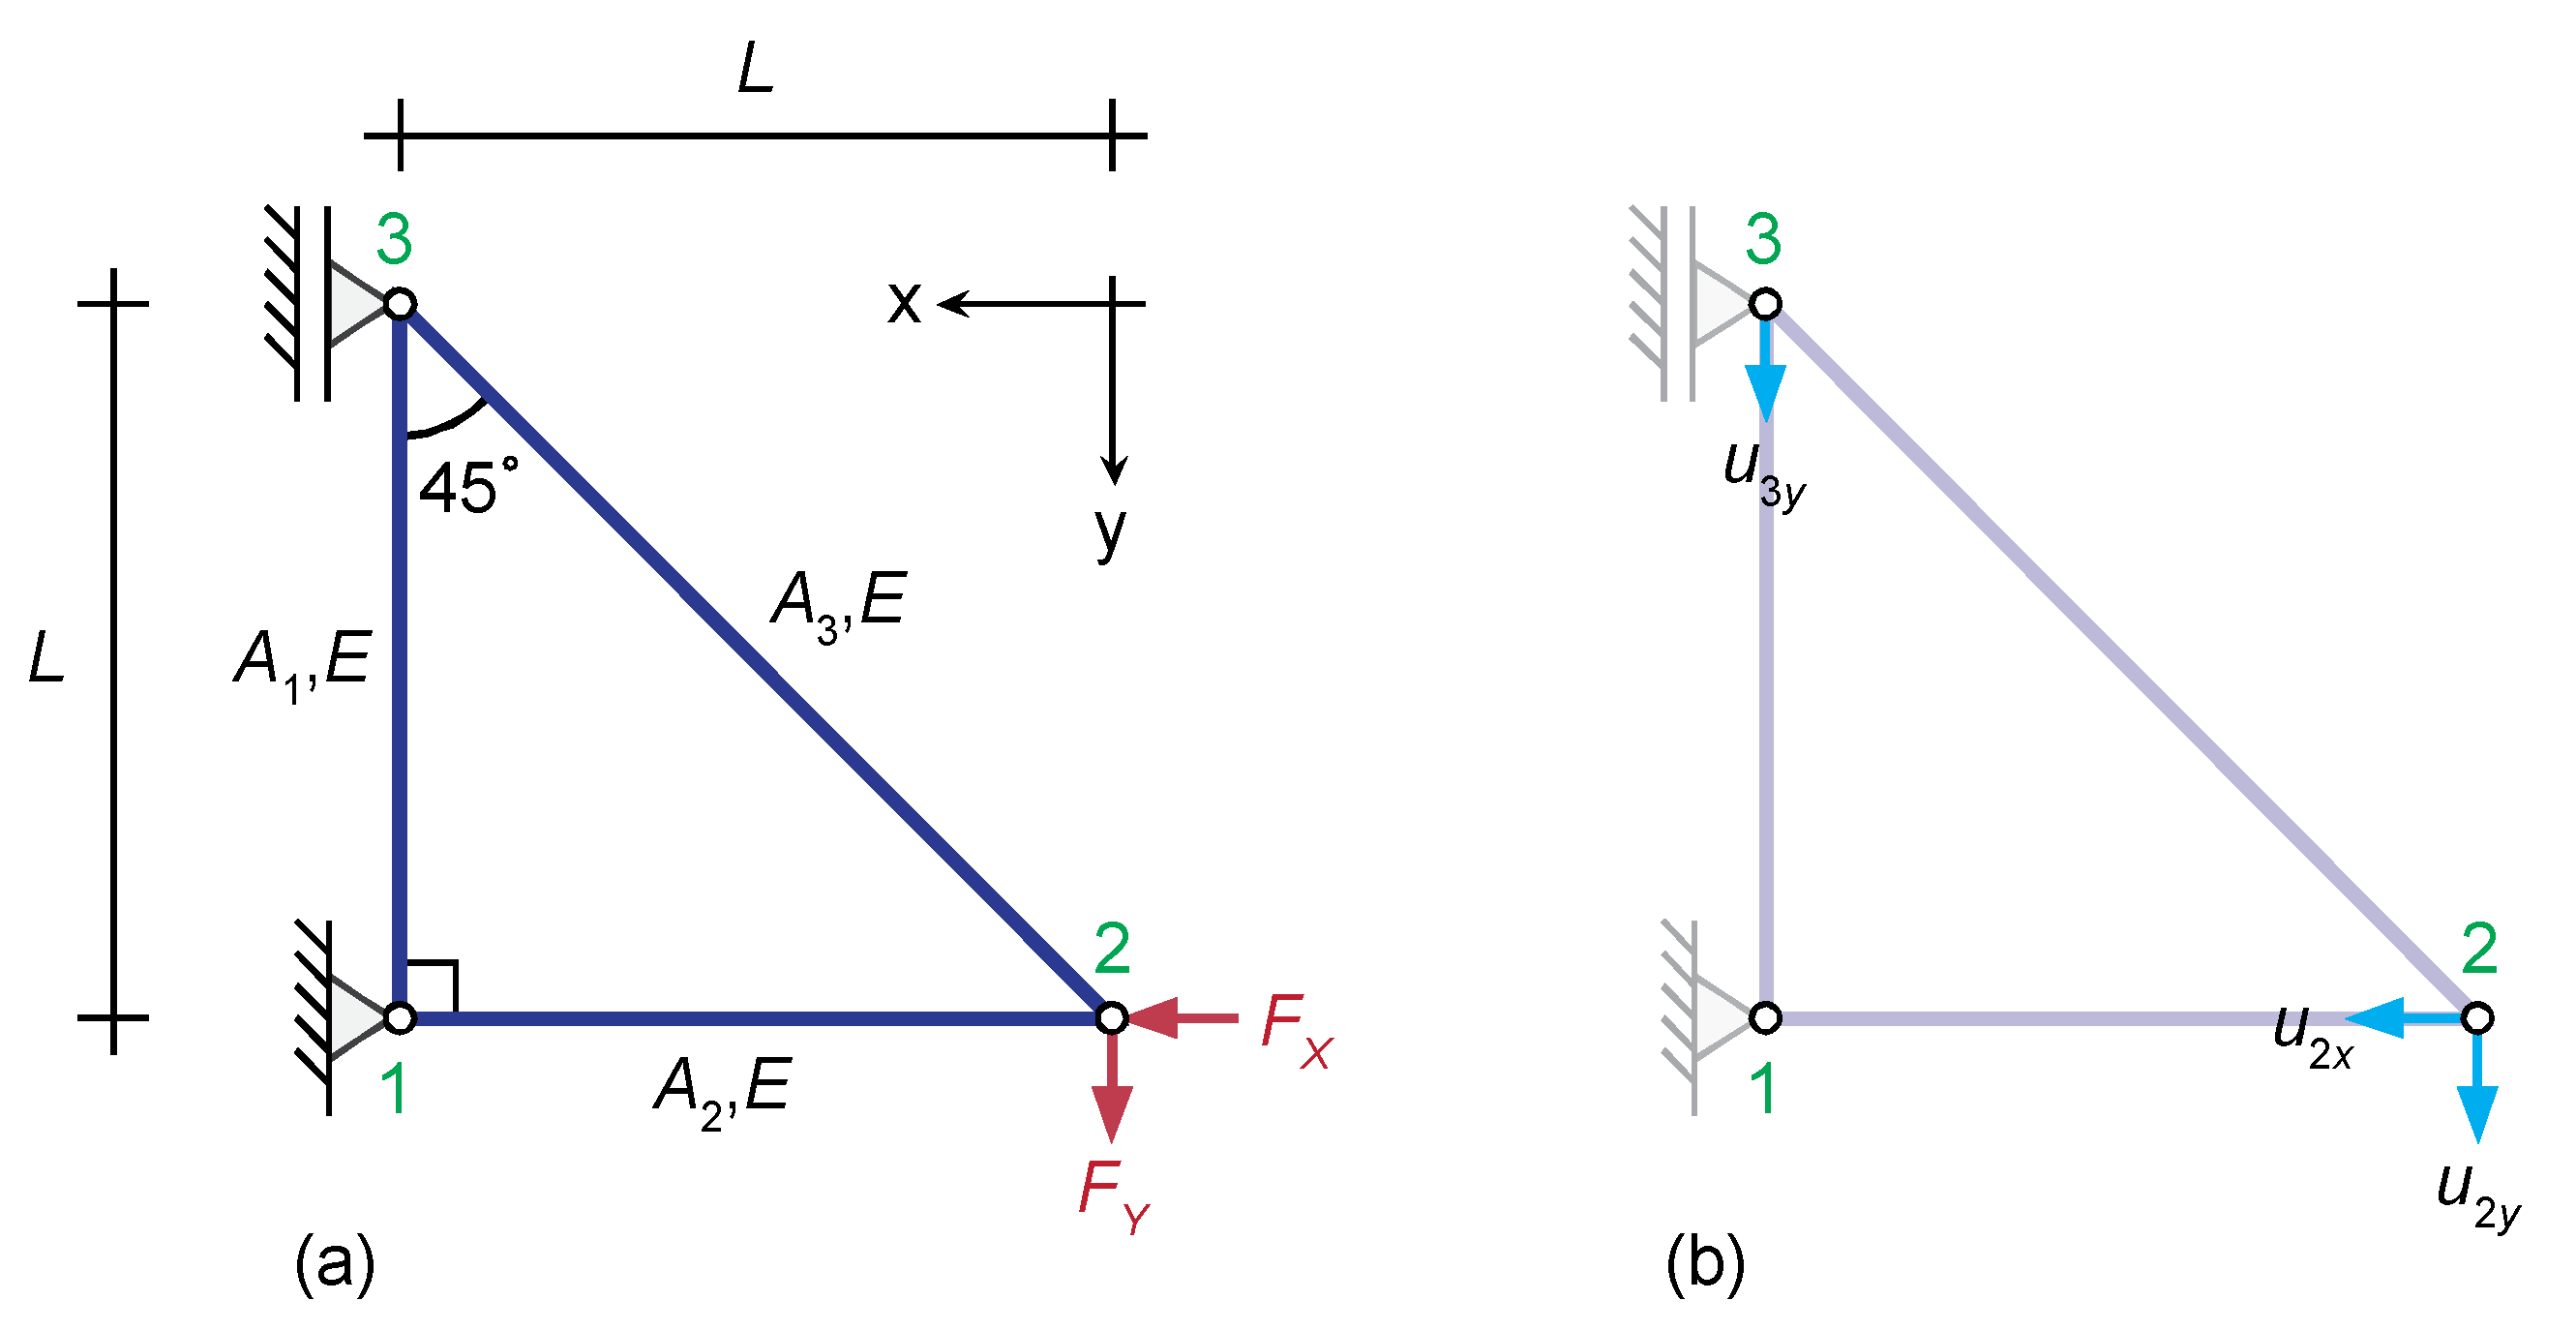
Figure 4.
Three-bar truss: (a) Coordinate system and loading and boundary conditions, and (b) displacements at nodes 2 and 3.
Figure 4.
Three-bar truss: (a) Coordinate system and loading and boundary conditions, and (b) displacements at nodes 2 and 3.
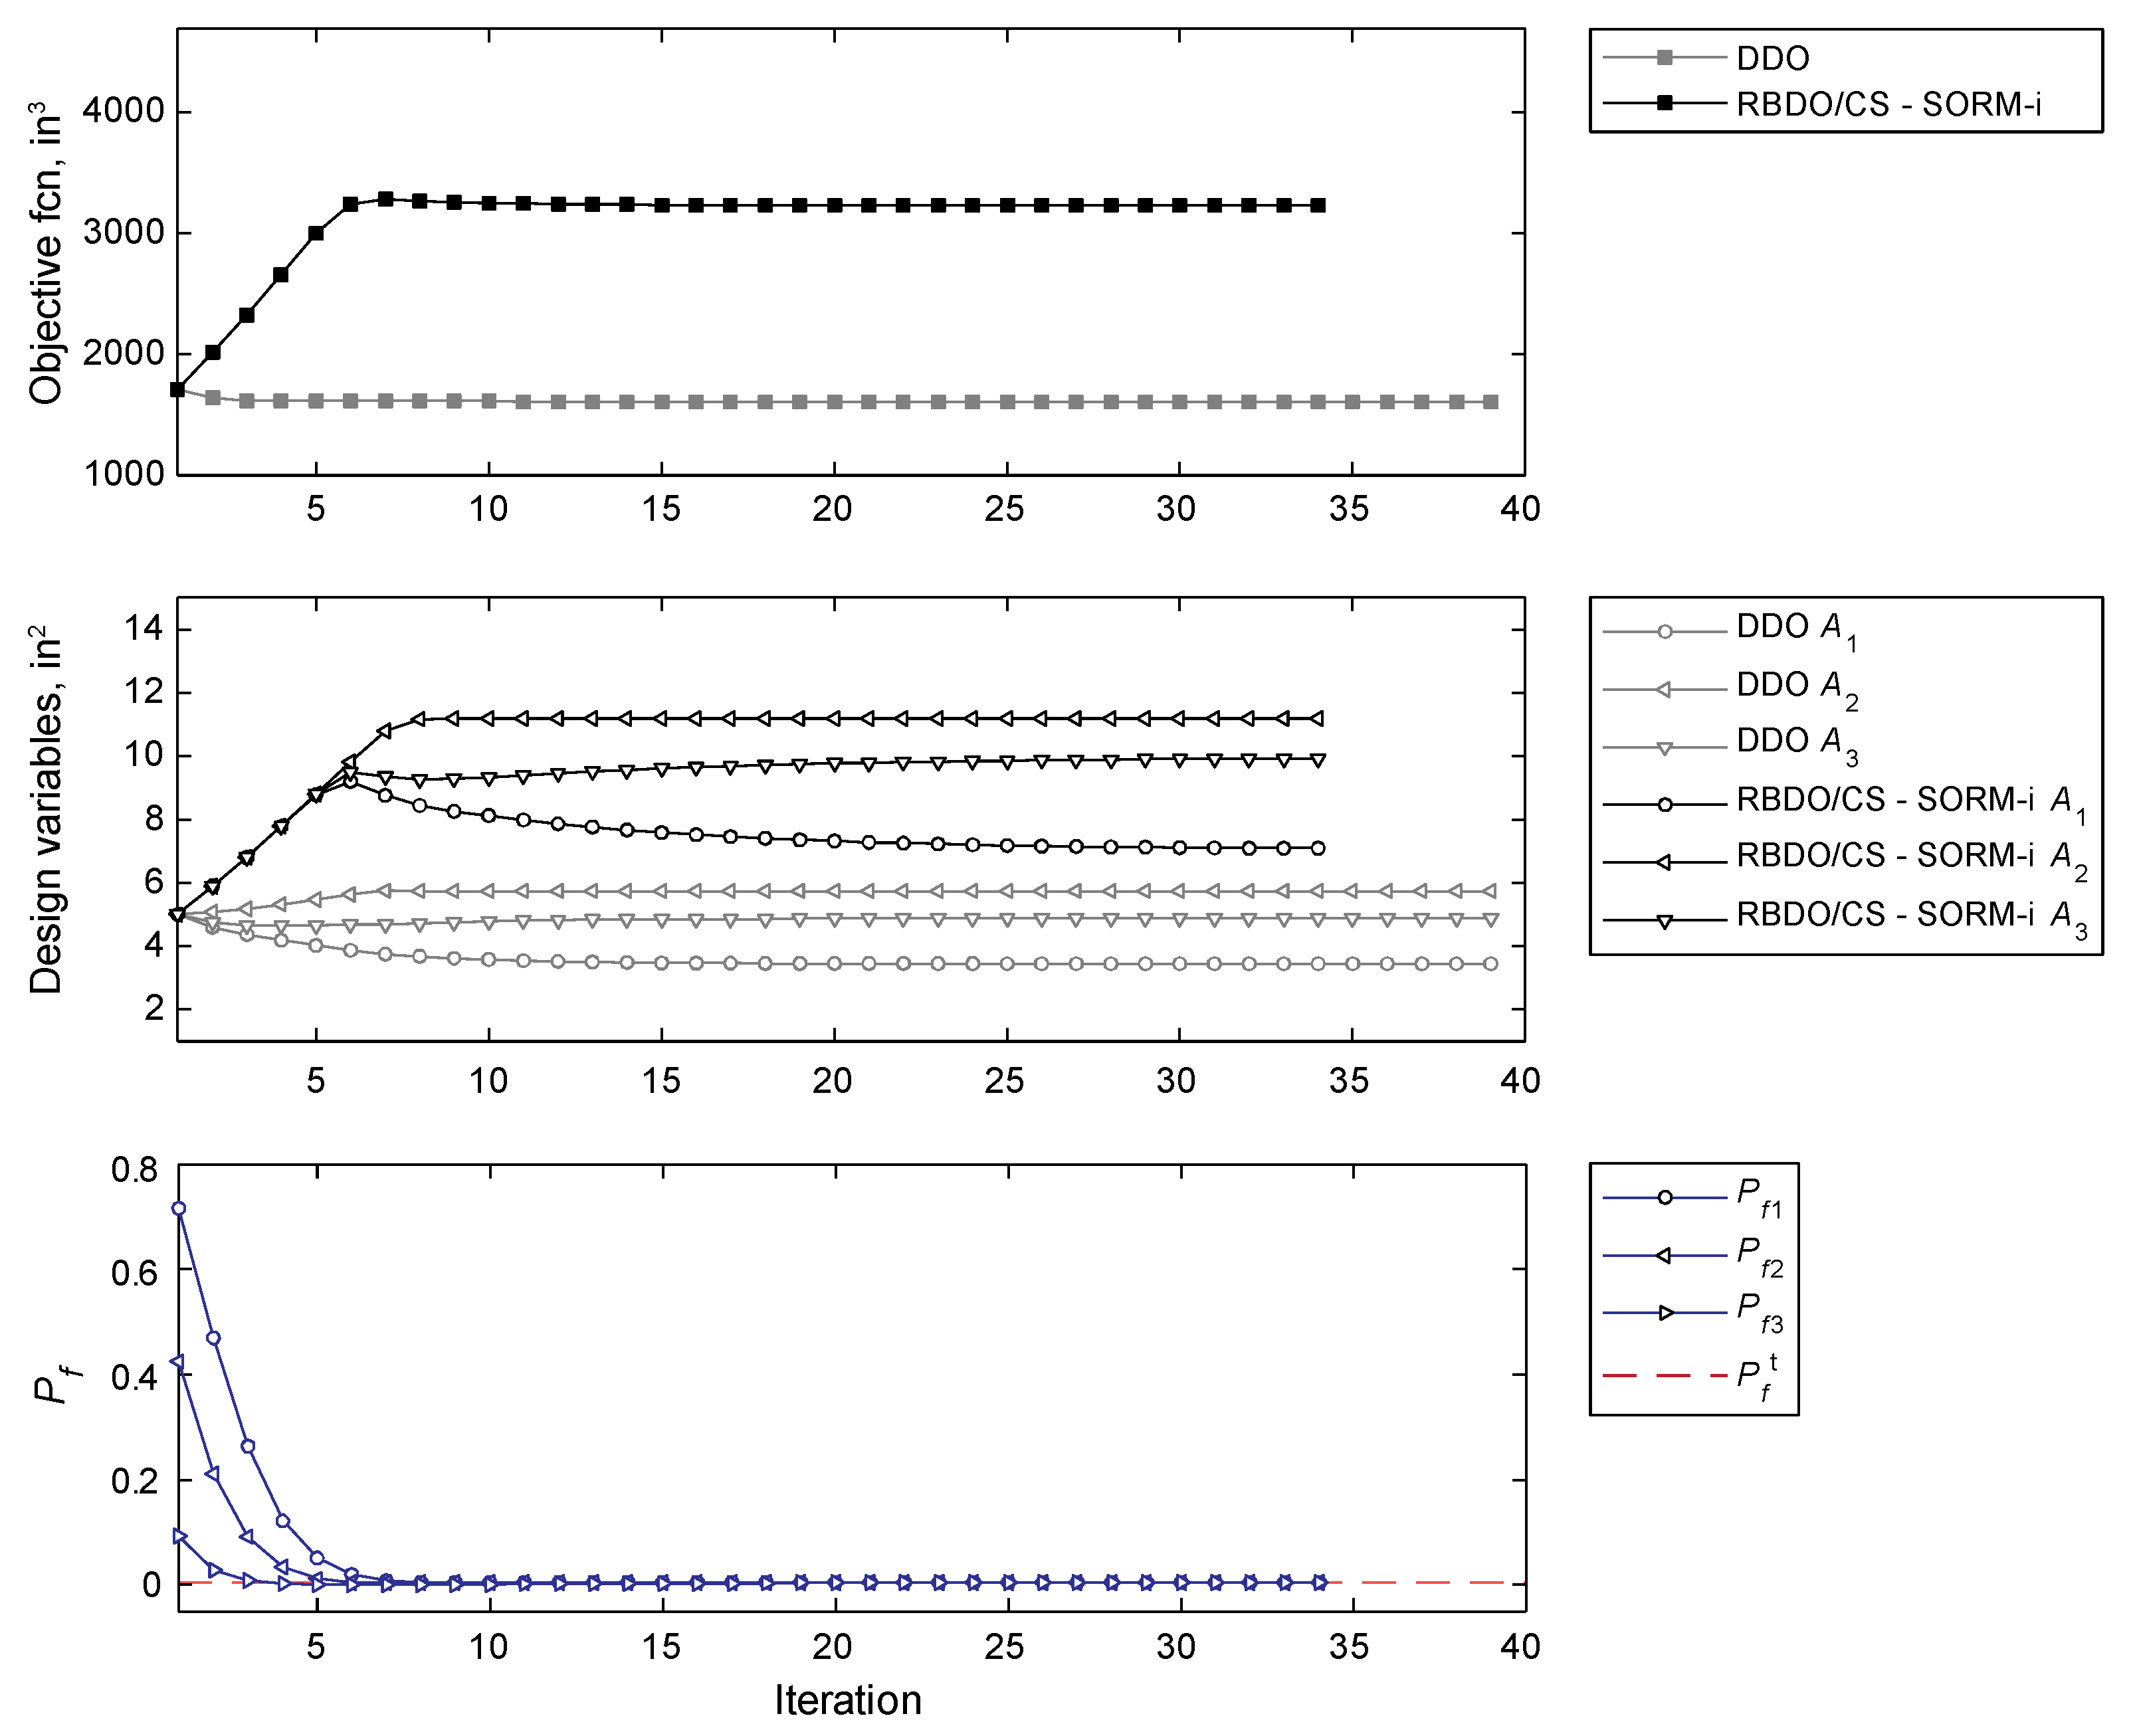
Figure 5.
Convergence history of the objective function and design variables pertaining to the deterministic design optimization (DDO) and RBDO/CS–SORM-i, and failure probabilities obtained using the RBDO/CS–SORM-i framework.
Figure 5.
Convergence history of the objective function and design variables pertaining to the deterministic design optimization (DDO) and RBDO/CS–SORM-i, and failure probabilities obtained using the RBDO/CS–SORM-i framework.
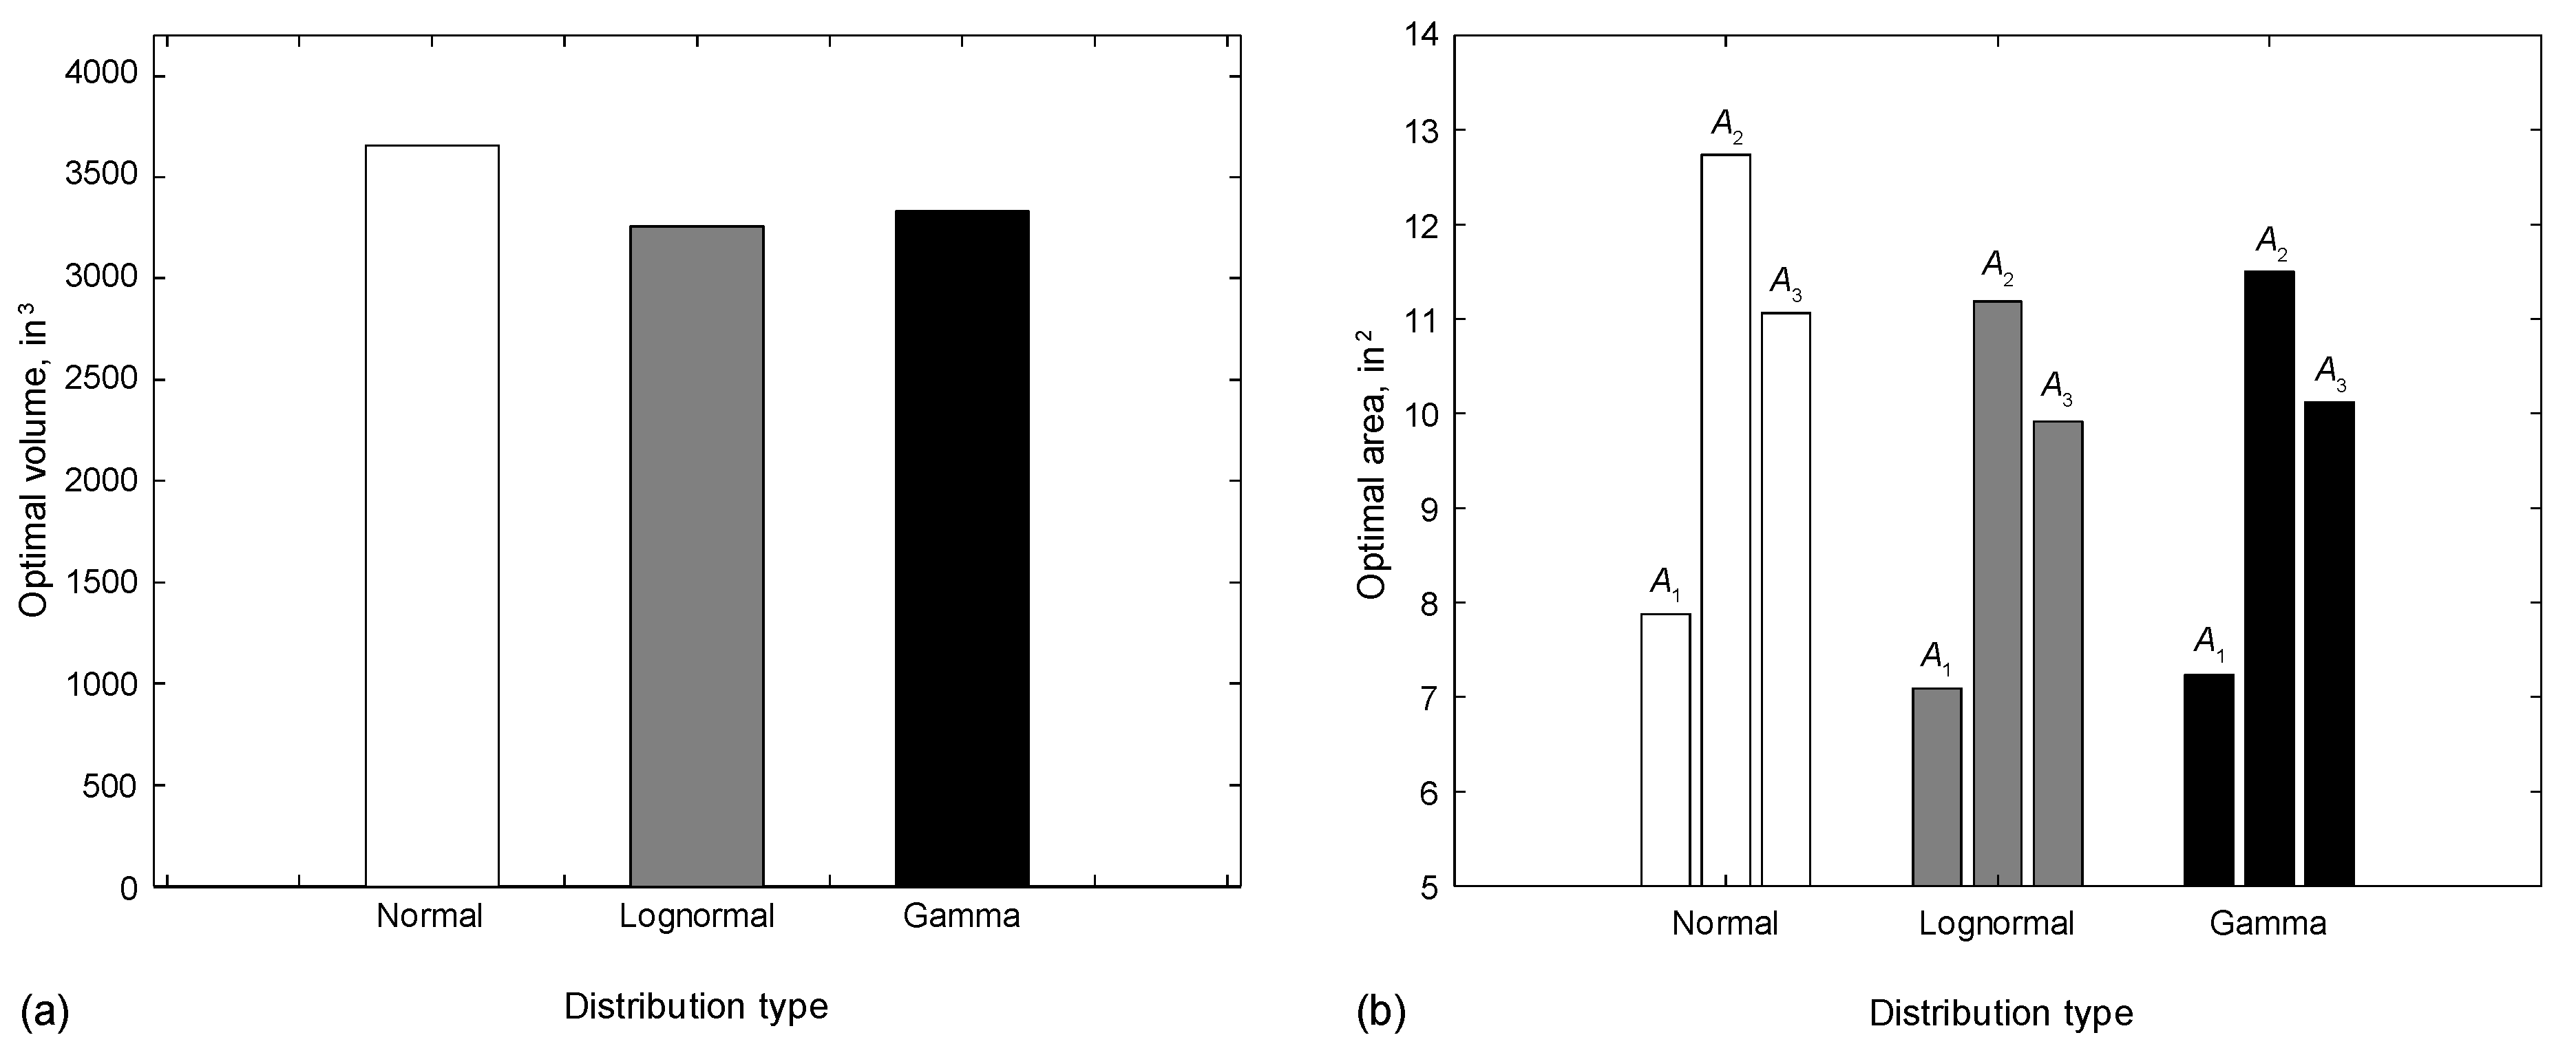
Figure 6.
Results of the RBDO/CS–SORM-i framework for normal, lognormal, and gamma distribution cases. (a) Optimal volume, and (b) optimal areas.
Figure 6.
Results of the RBDO/CS–SORM-i framework for normal, lognormal, and gamma distribution cases. (a) Optimal volume, and (b) optimal areas.
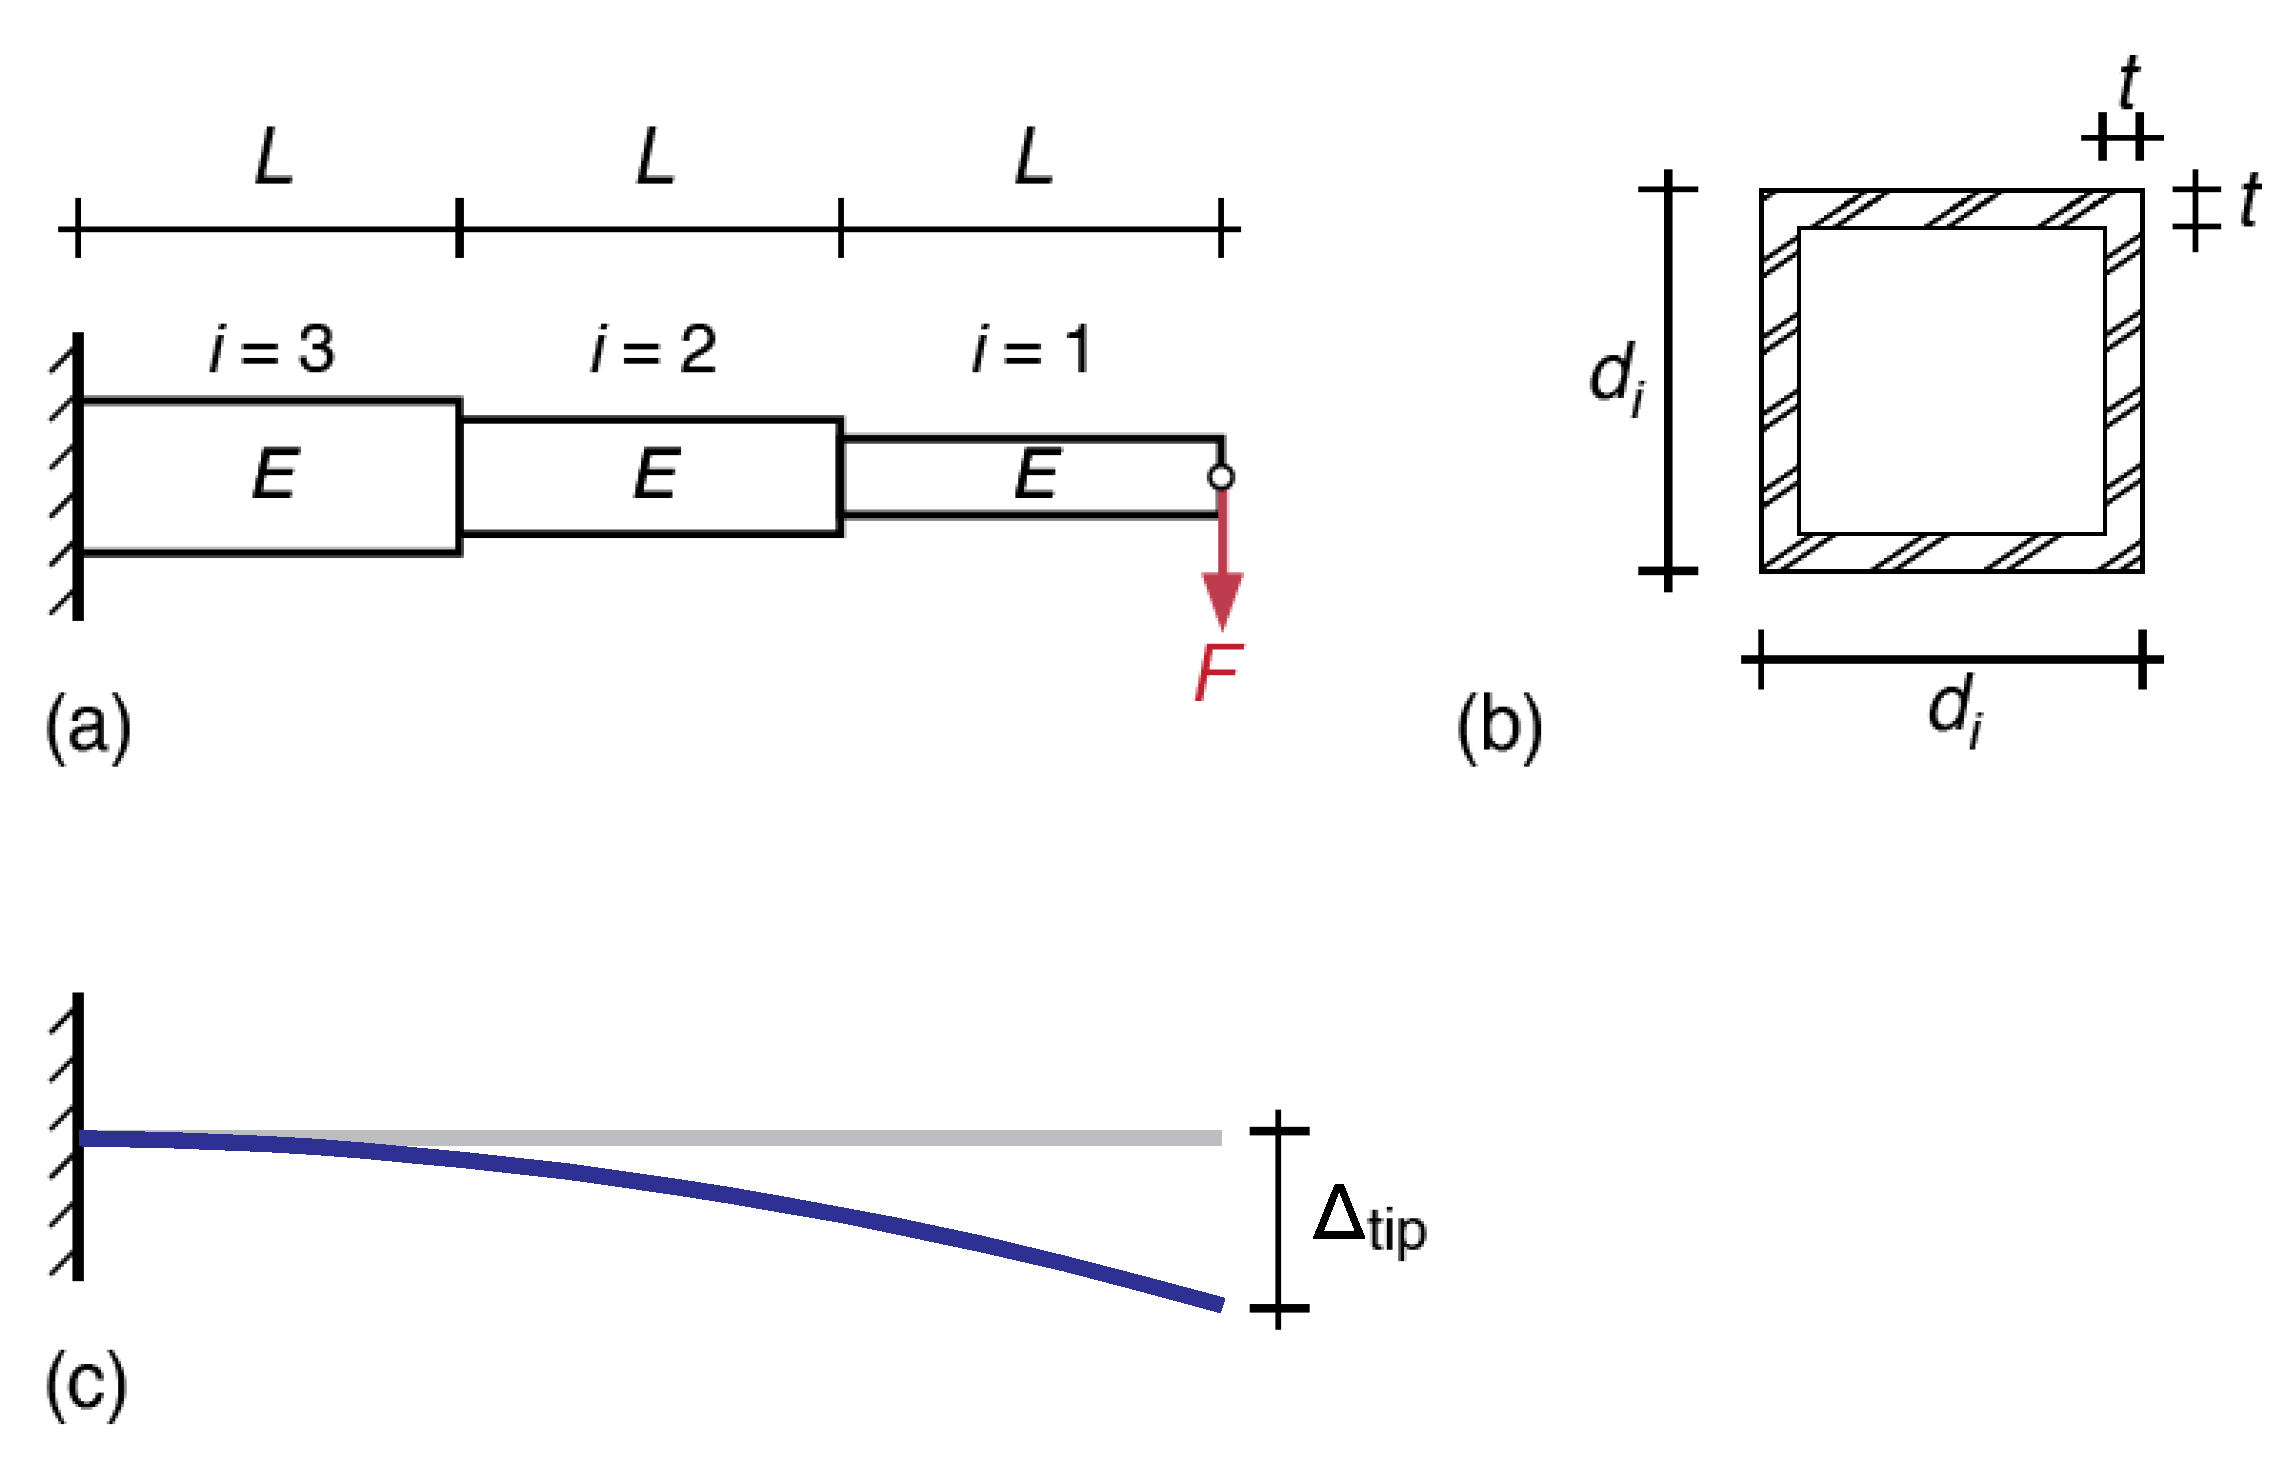
Figure 7.
(a) Cantilever beam consisting of three segments, (b) hollow square cross-section, (c) deformation under a vertical force.
Figure 7.
(a) Cantilever beam consisting of three segments, (b) hollow square cross-section, (c) deformation under a vertical force.
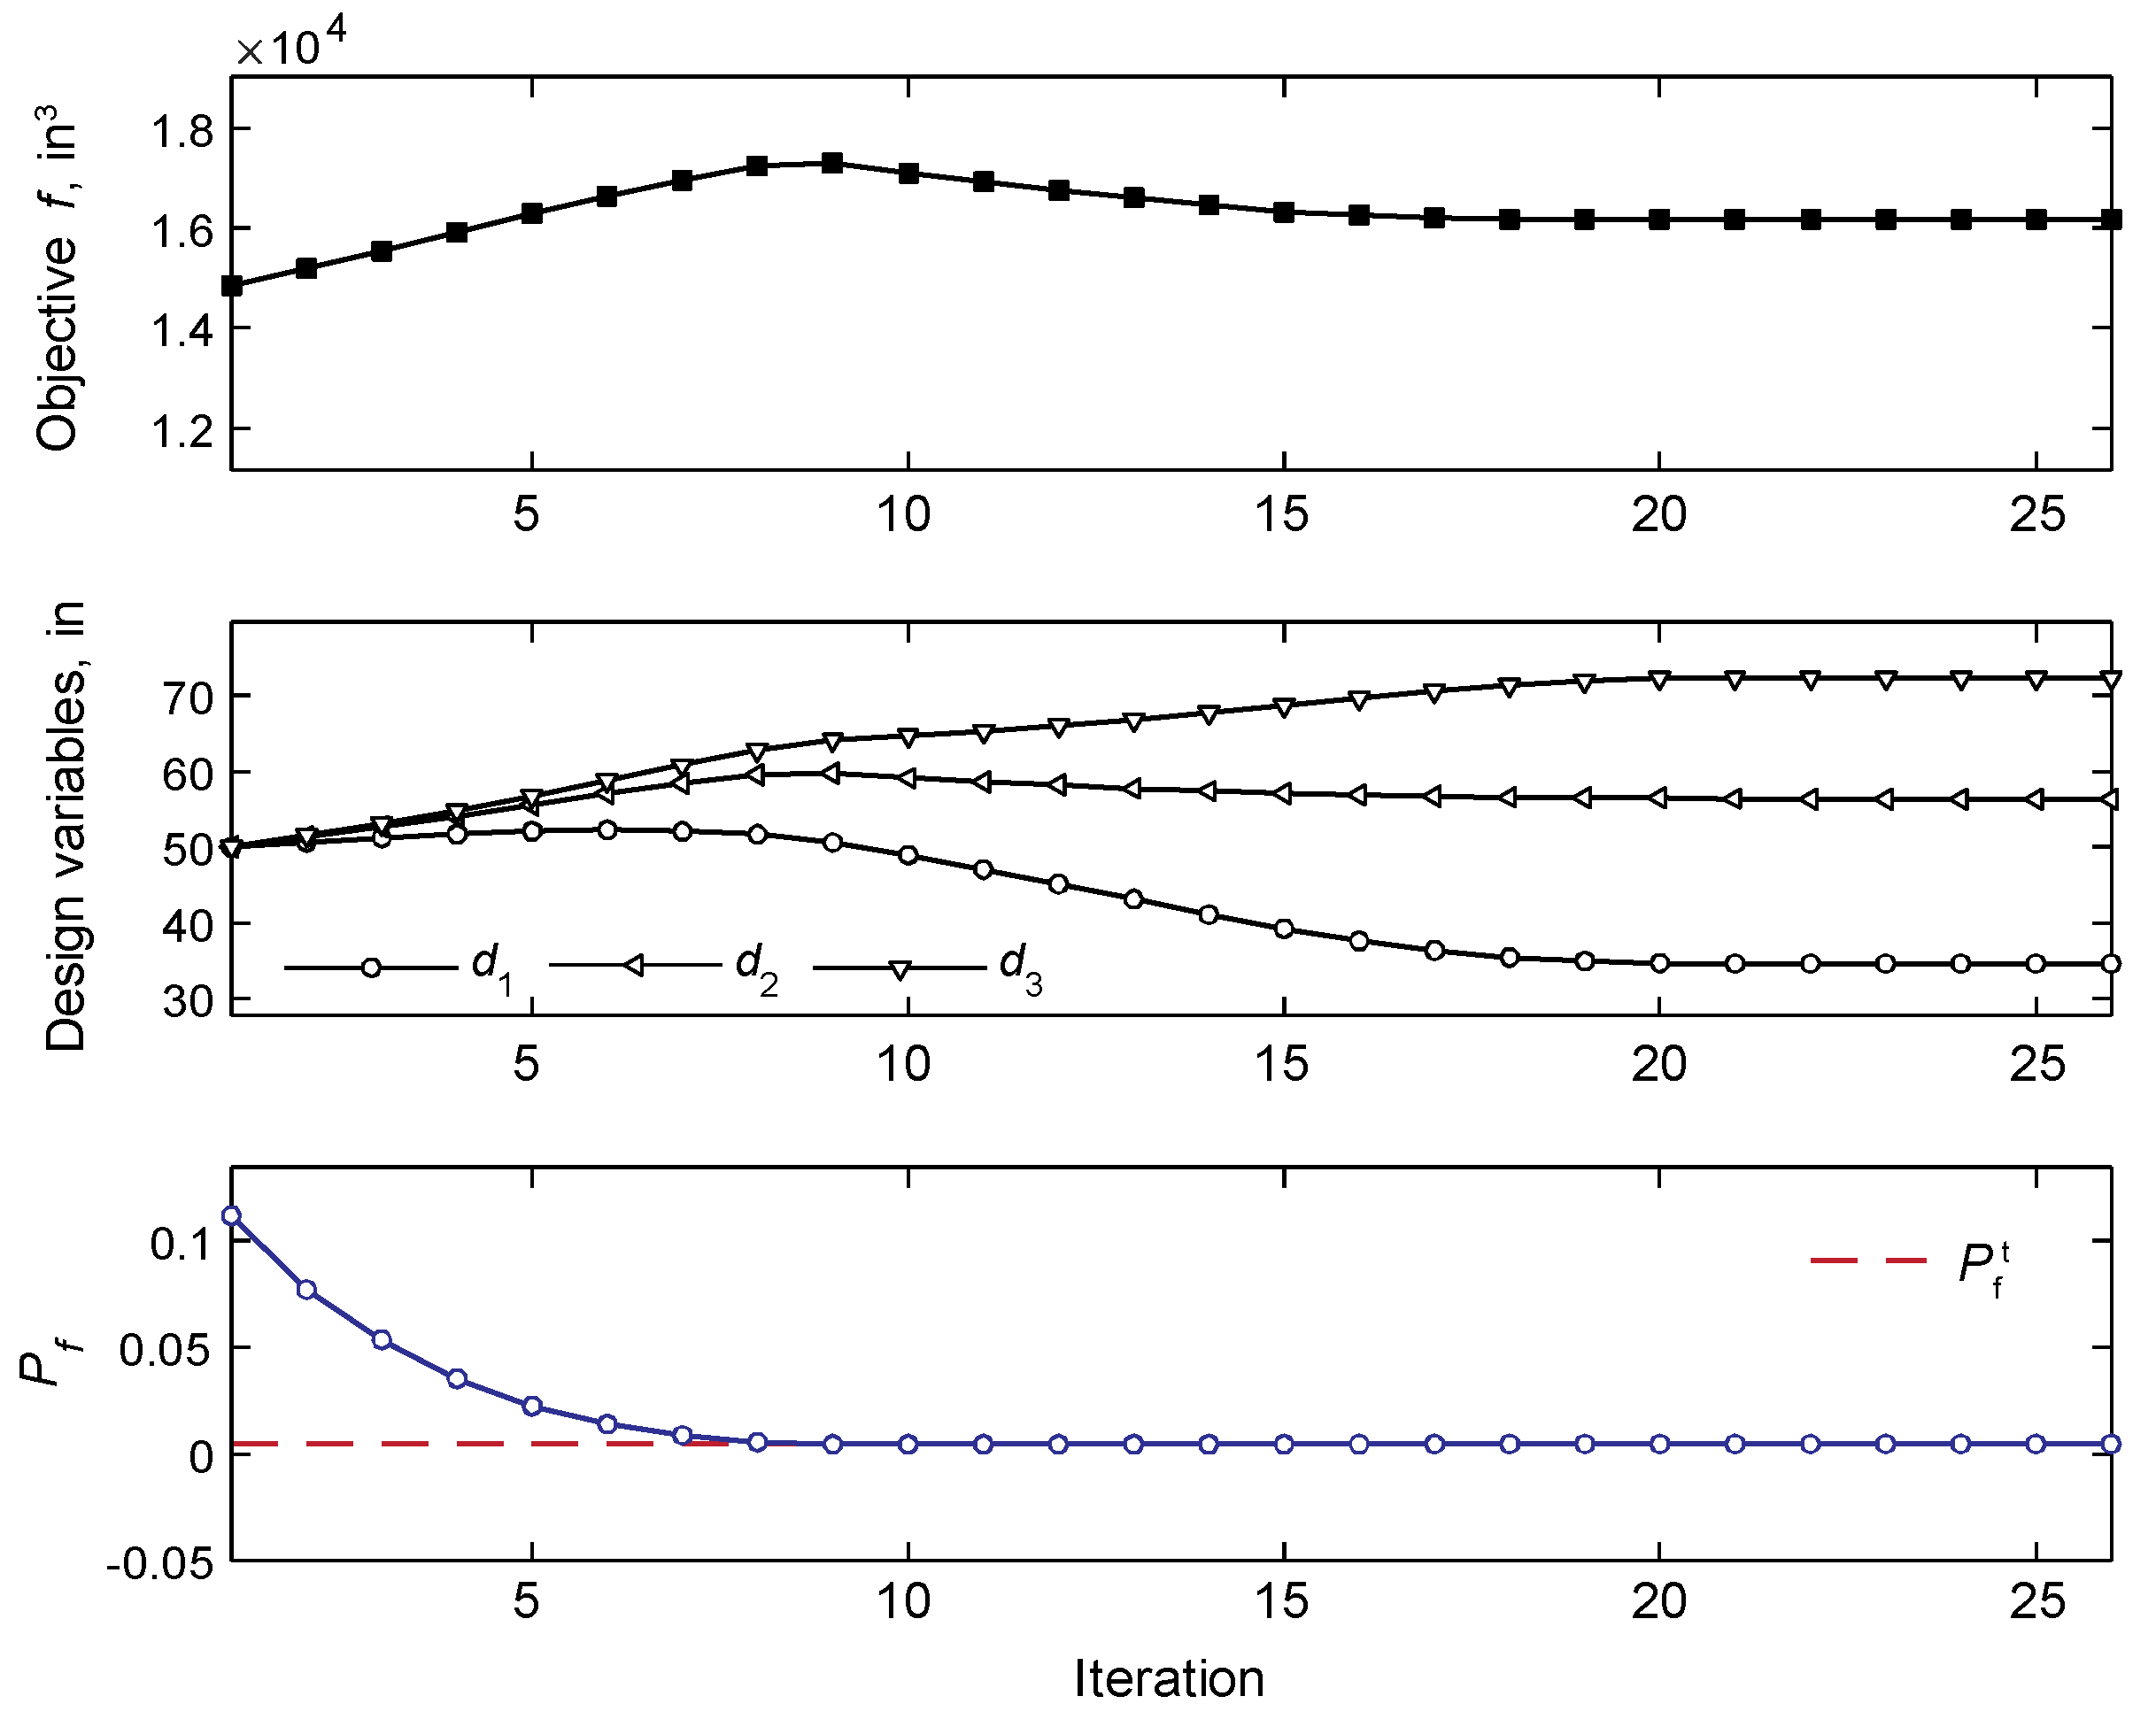
Figure 8.
Convergence history of the objective function, design variables, and probabilistic constraints (by RBDO/CS–SORM-i).
Figure 8.
Convergence history of the objective function, design variables, and probabilistic constraints (by RBDO/CS–SORM-i).
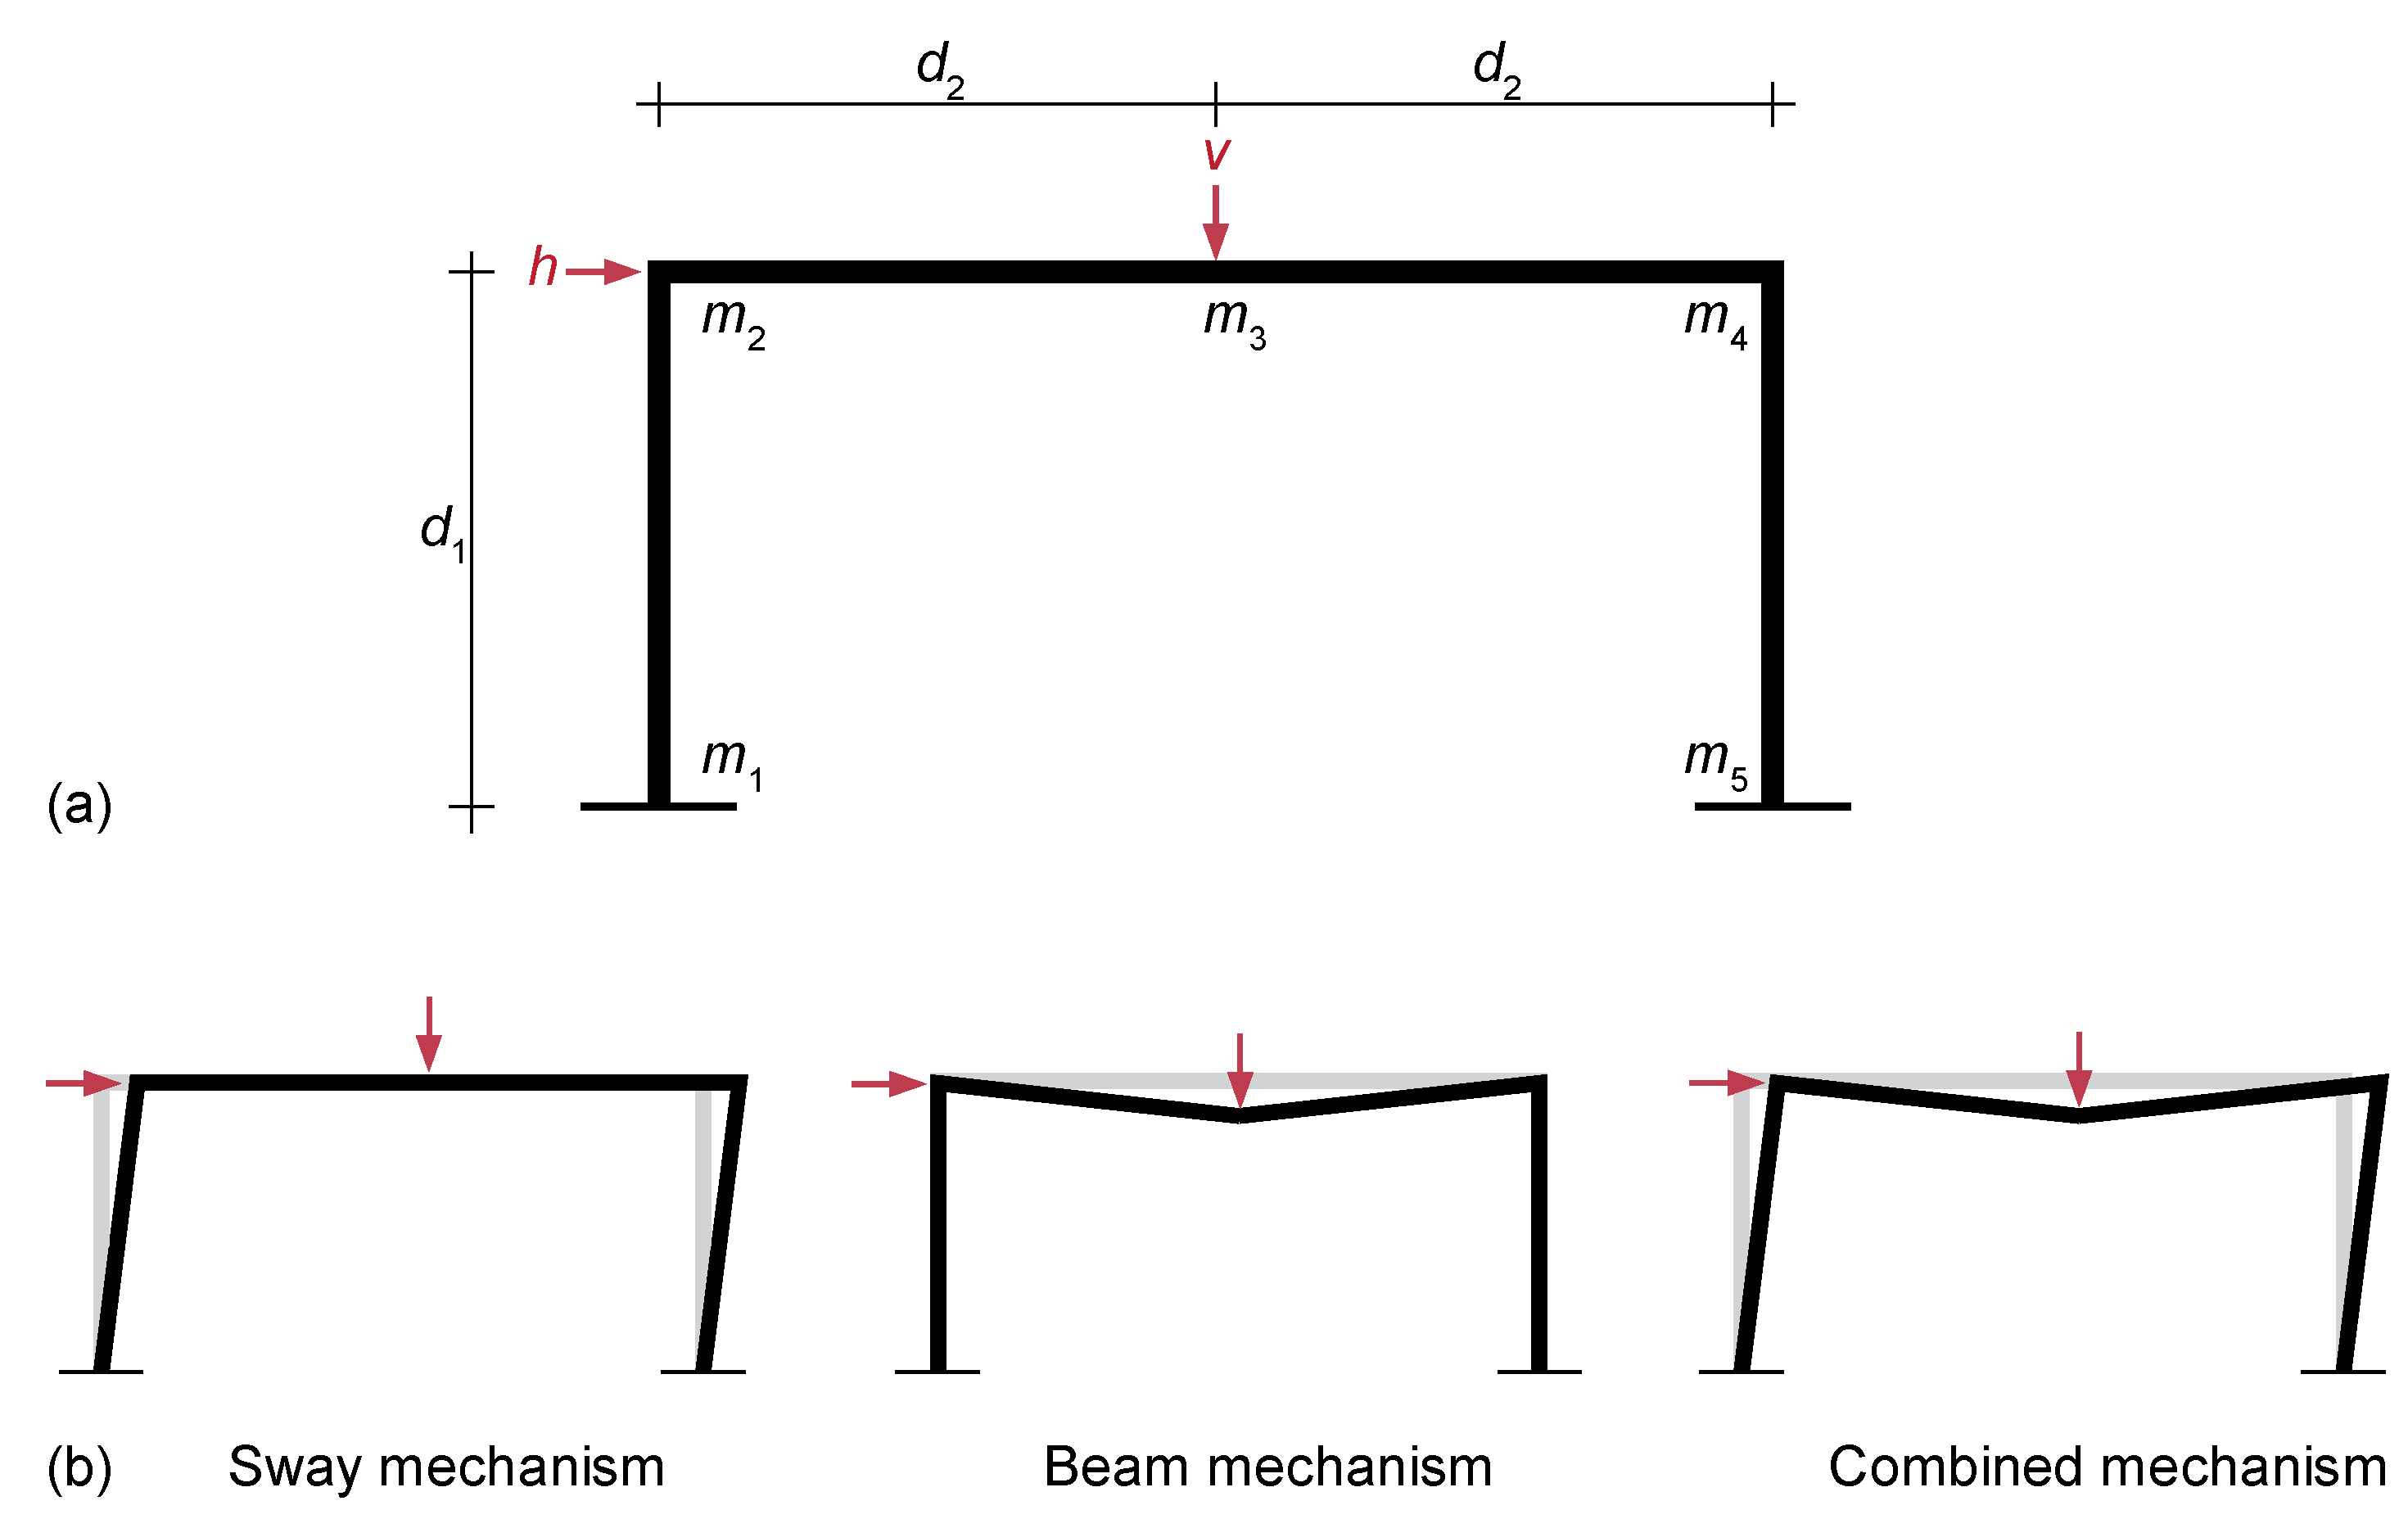
Figure 9.
(a) Ductile frame structure and (b) failure mechanisms.
Figure 9.
(a) Ductile frame structure and (b) failure mechanisms.
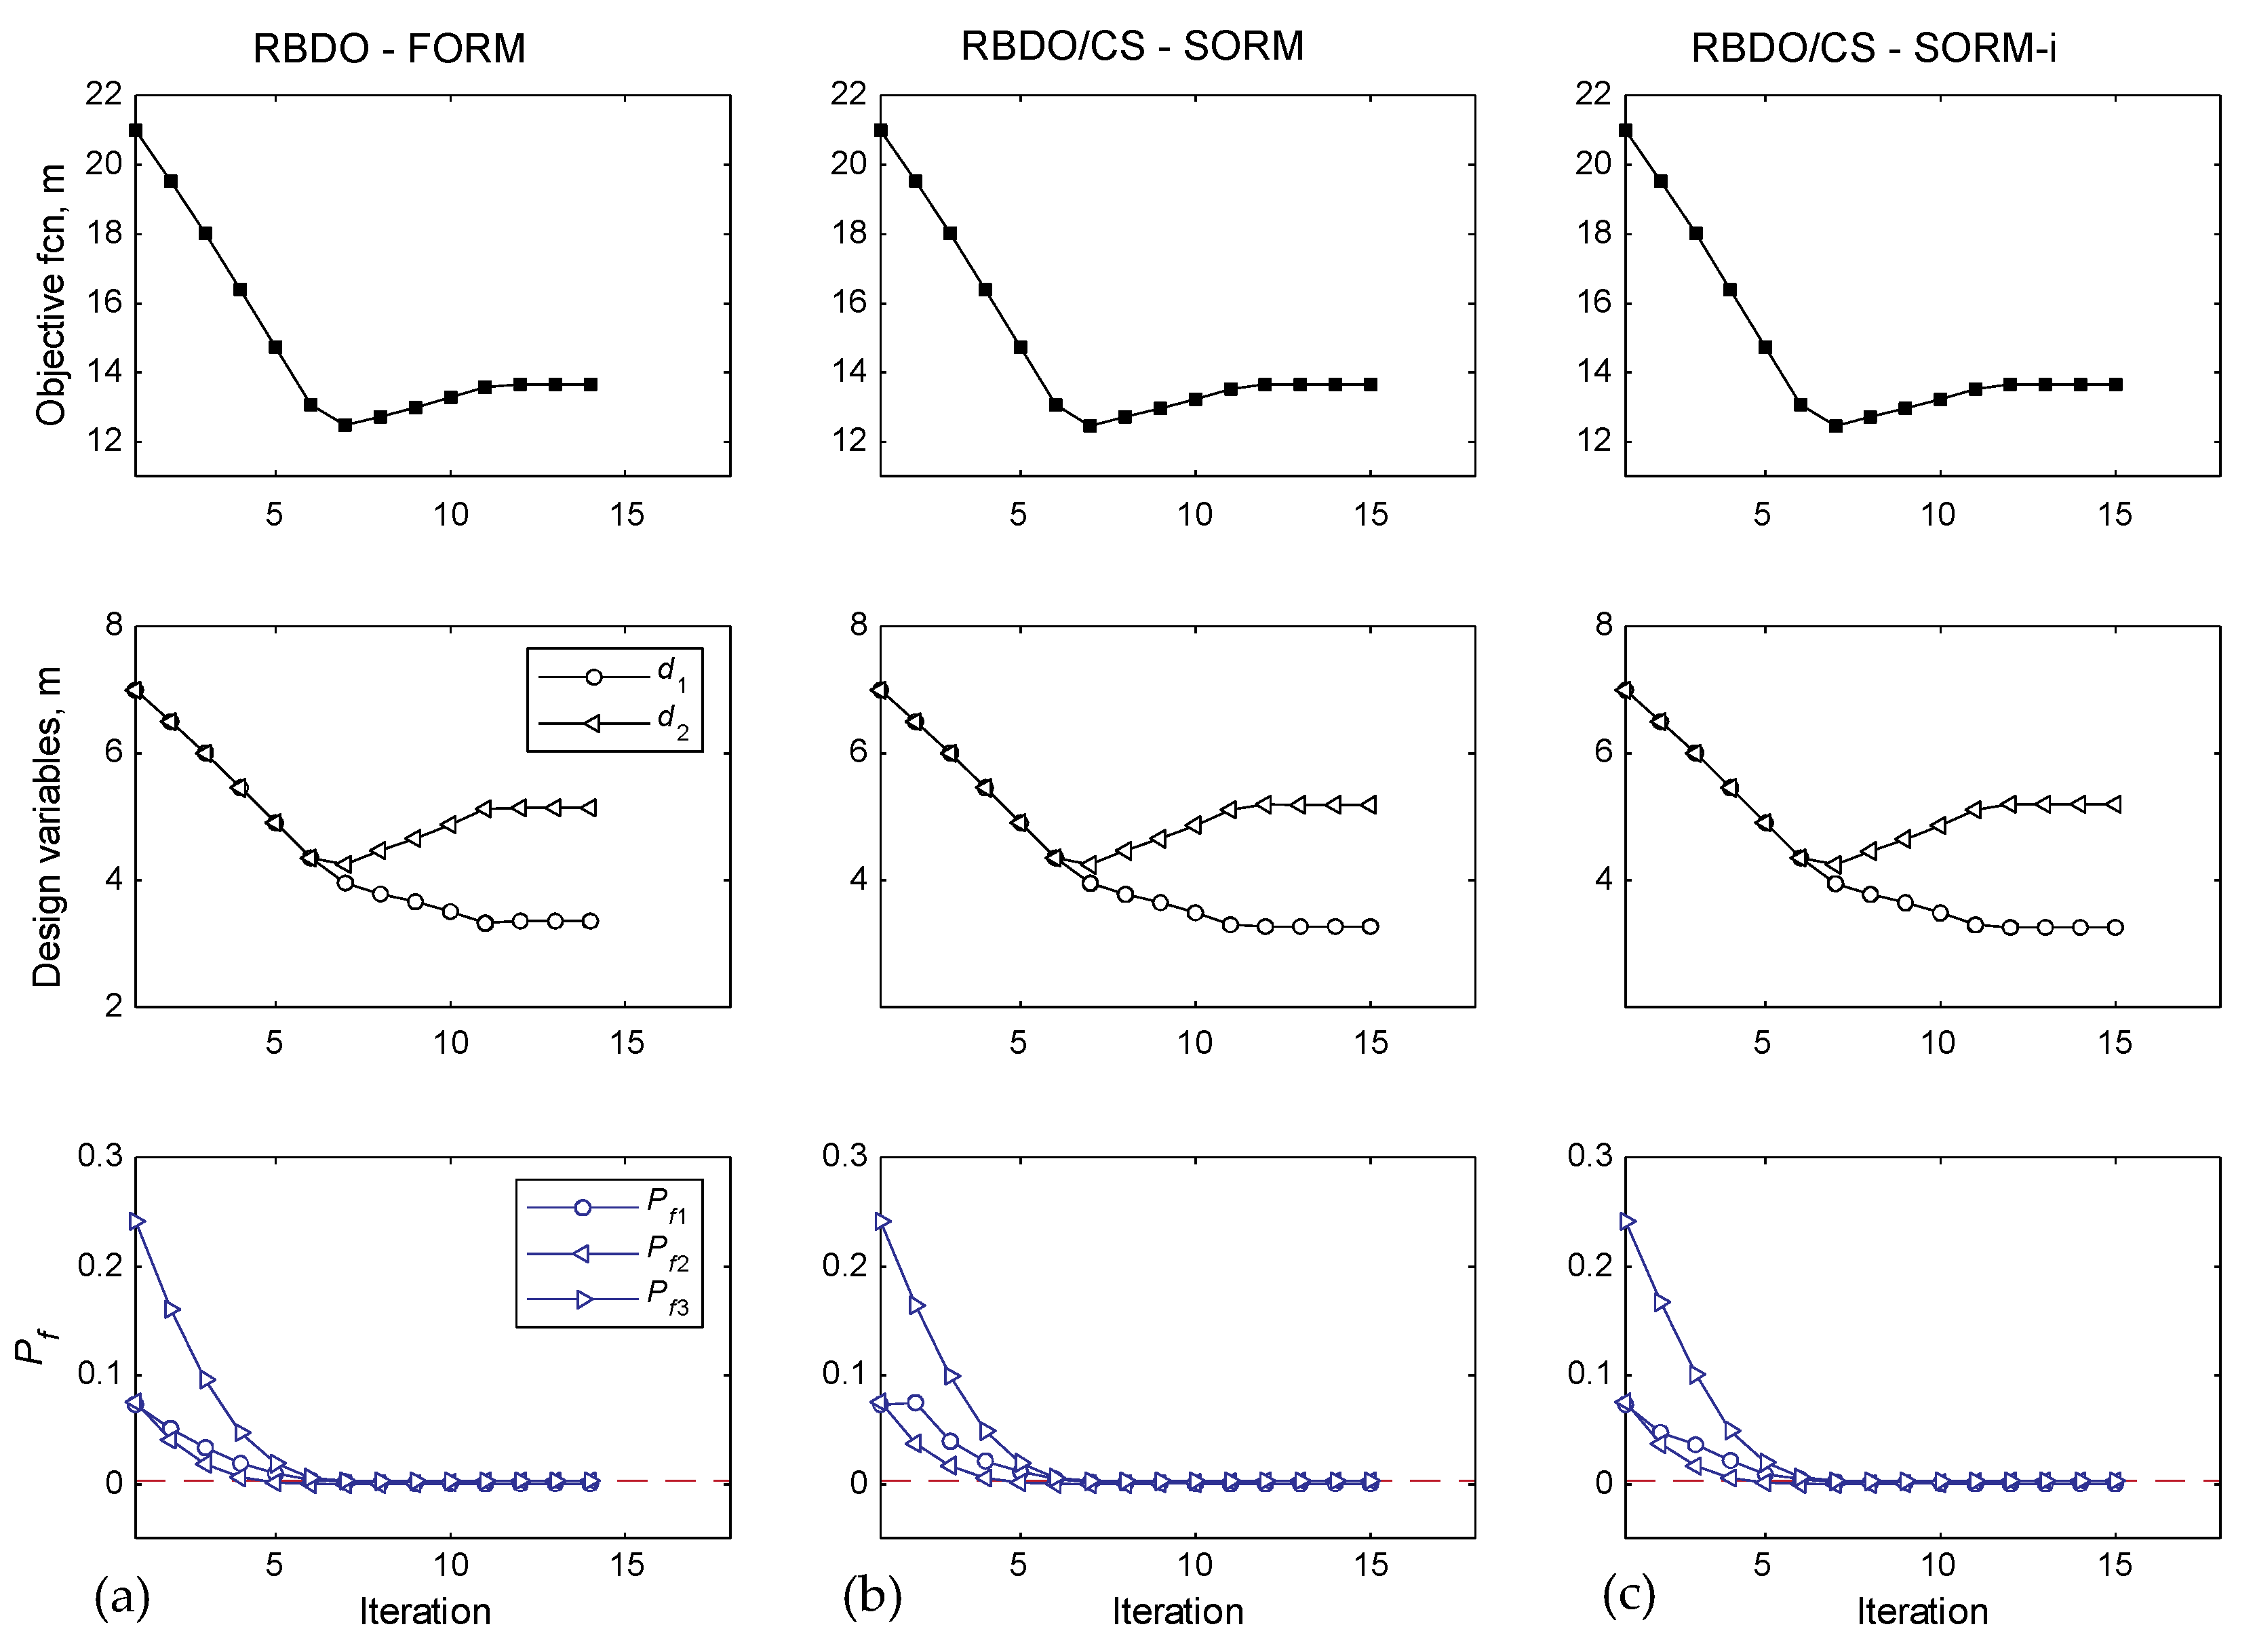
Figure 10.
Convergence history of the objective function, design variables, and failure probability pertaining to the (a) RBDO–FORM, (b) RBDO/CS–SORM, and (c) RBDO/CS–SORM-i.
Figure 10.
Convergence history of the objective function, design variables, and failure probability pertaining to the (a) RBDO–FORM, (b) RBDO/CS–SORM, and (c) RBDO/CS–SORM-i.
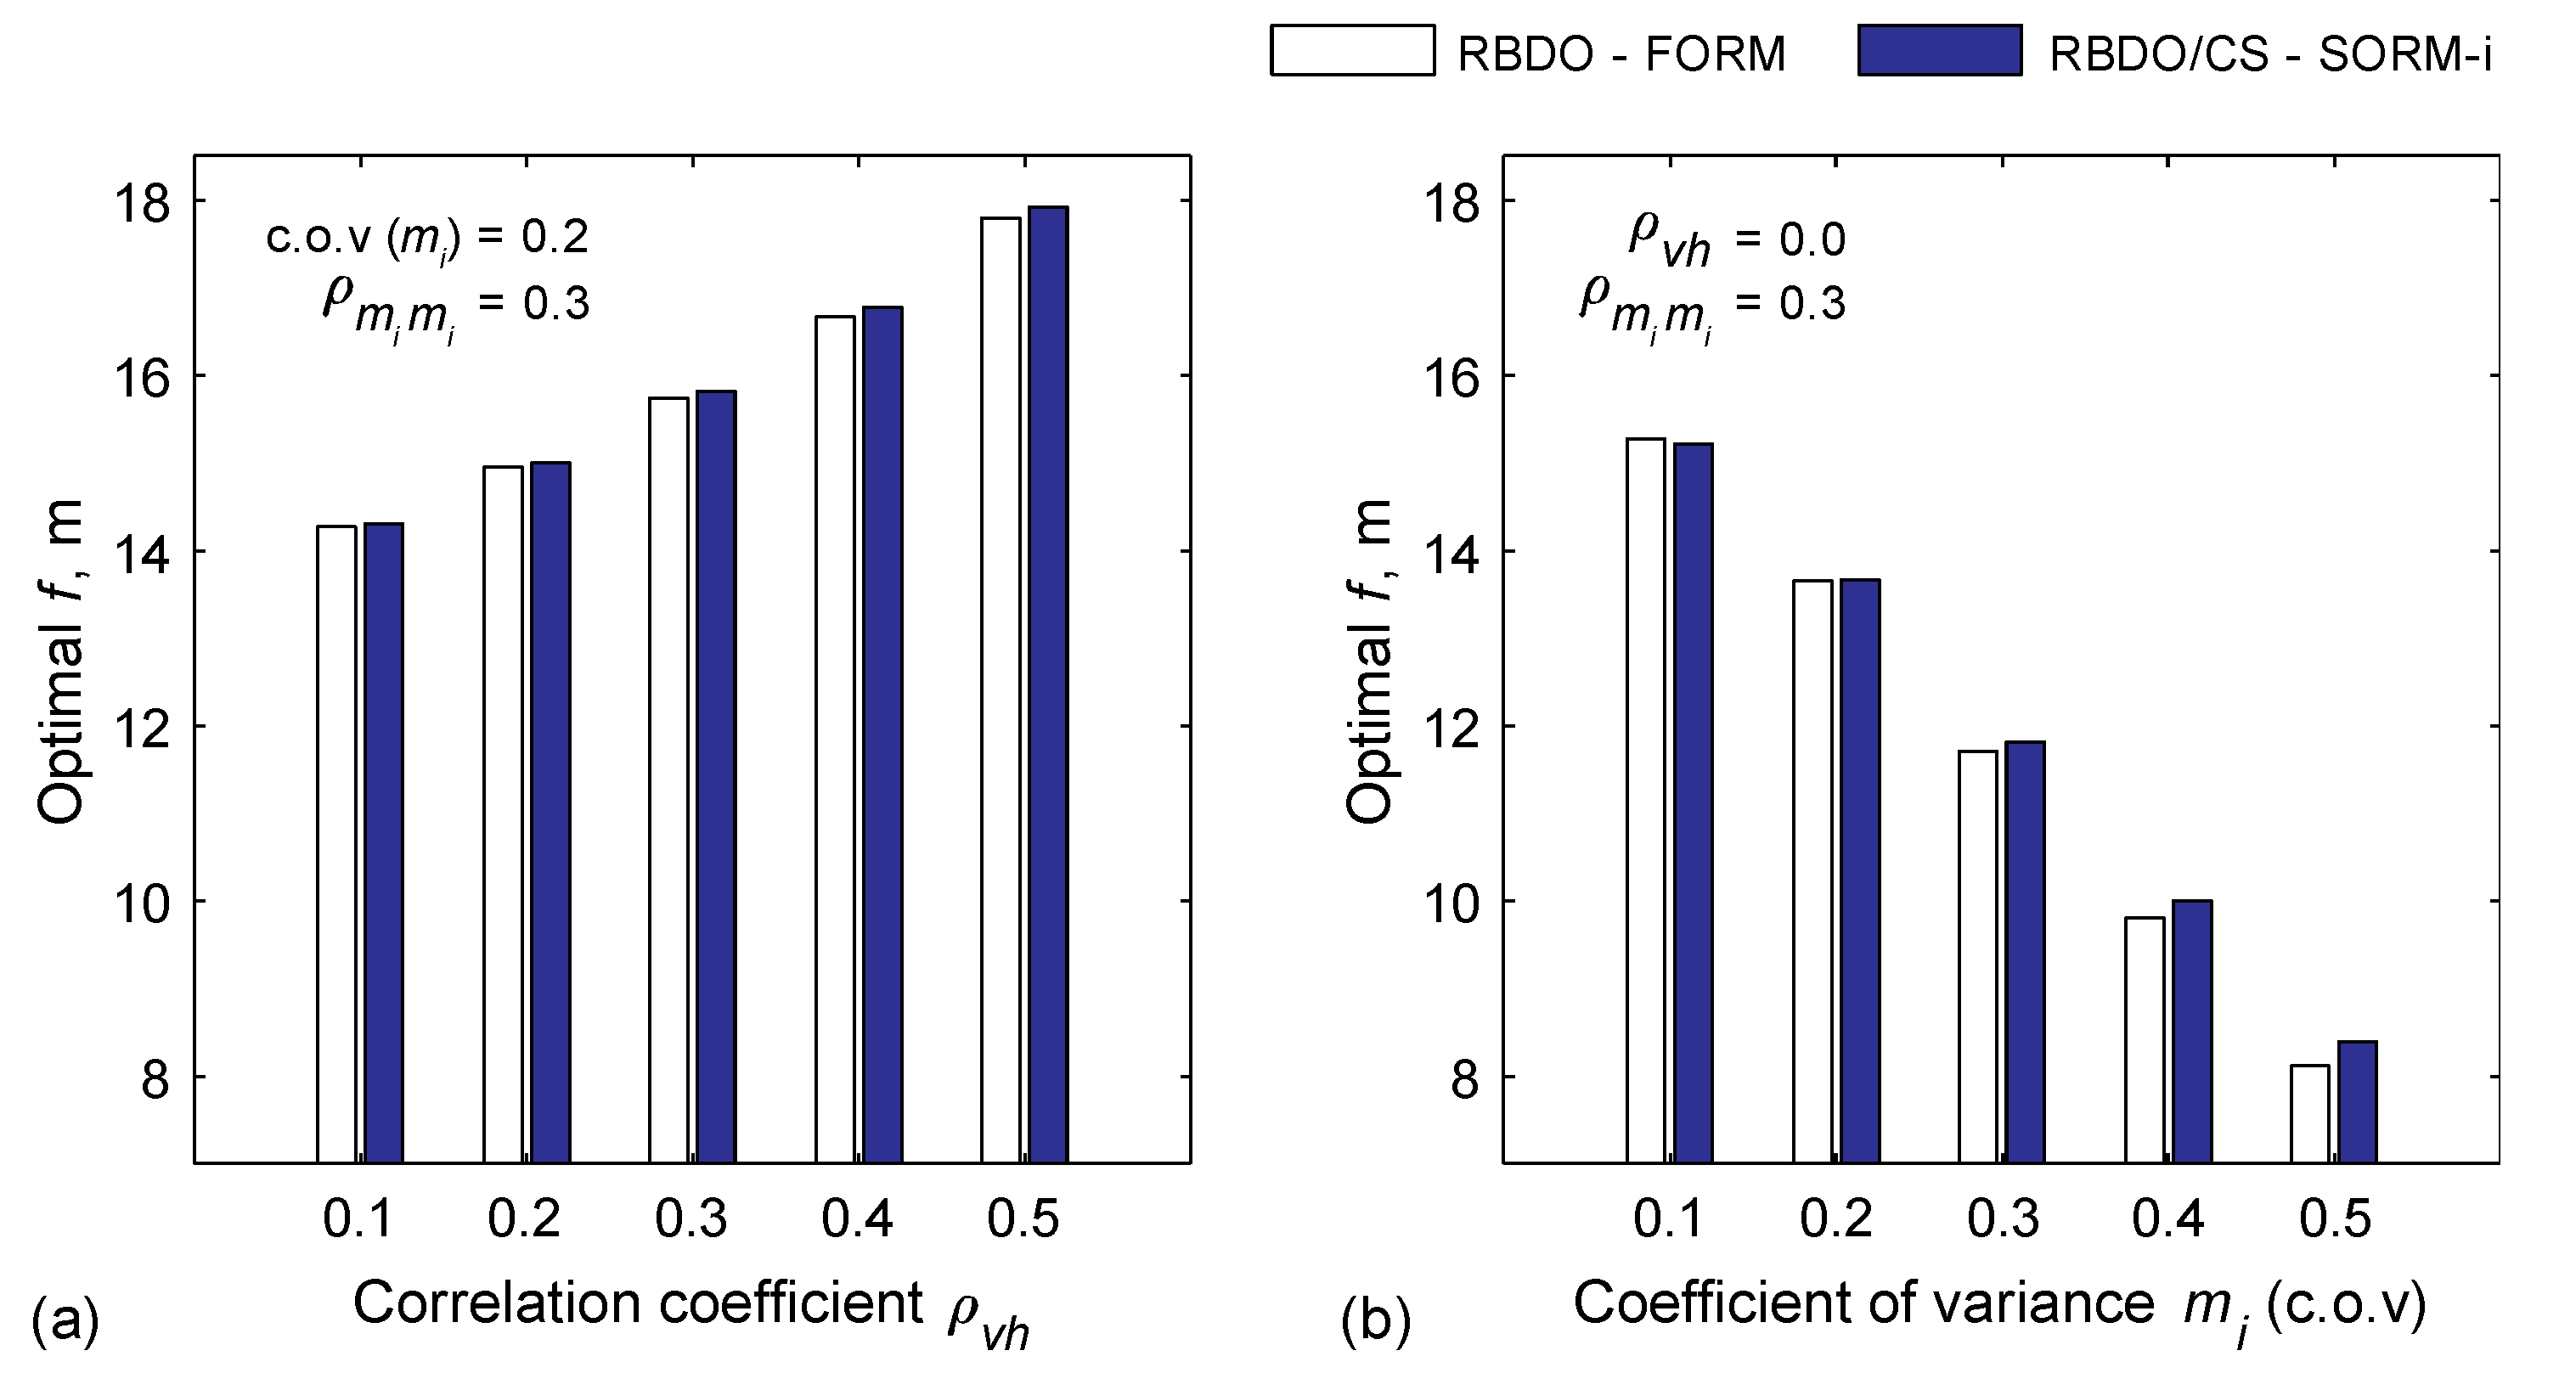
Figure 11.
Influence of the changes in the (a) correlation coefficients of the forces random variables, and (b) coefficients of variation of the moment capacity random variables on the FORM/SORM-i-based RBDO results.
Figure 11.
Influence of the changes in the (a) correlation coefficients of the forces random variables, and (b) coefficients of variation of the moment capacity random variables on the FORM/SORM-i-based RBDO results.
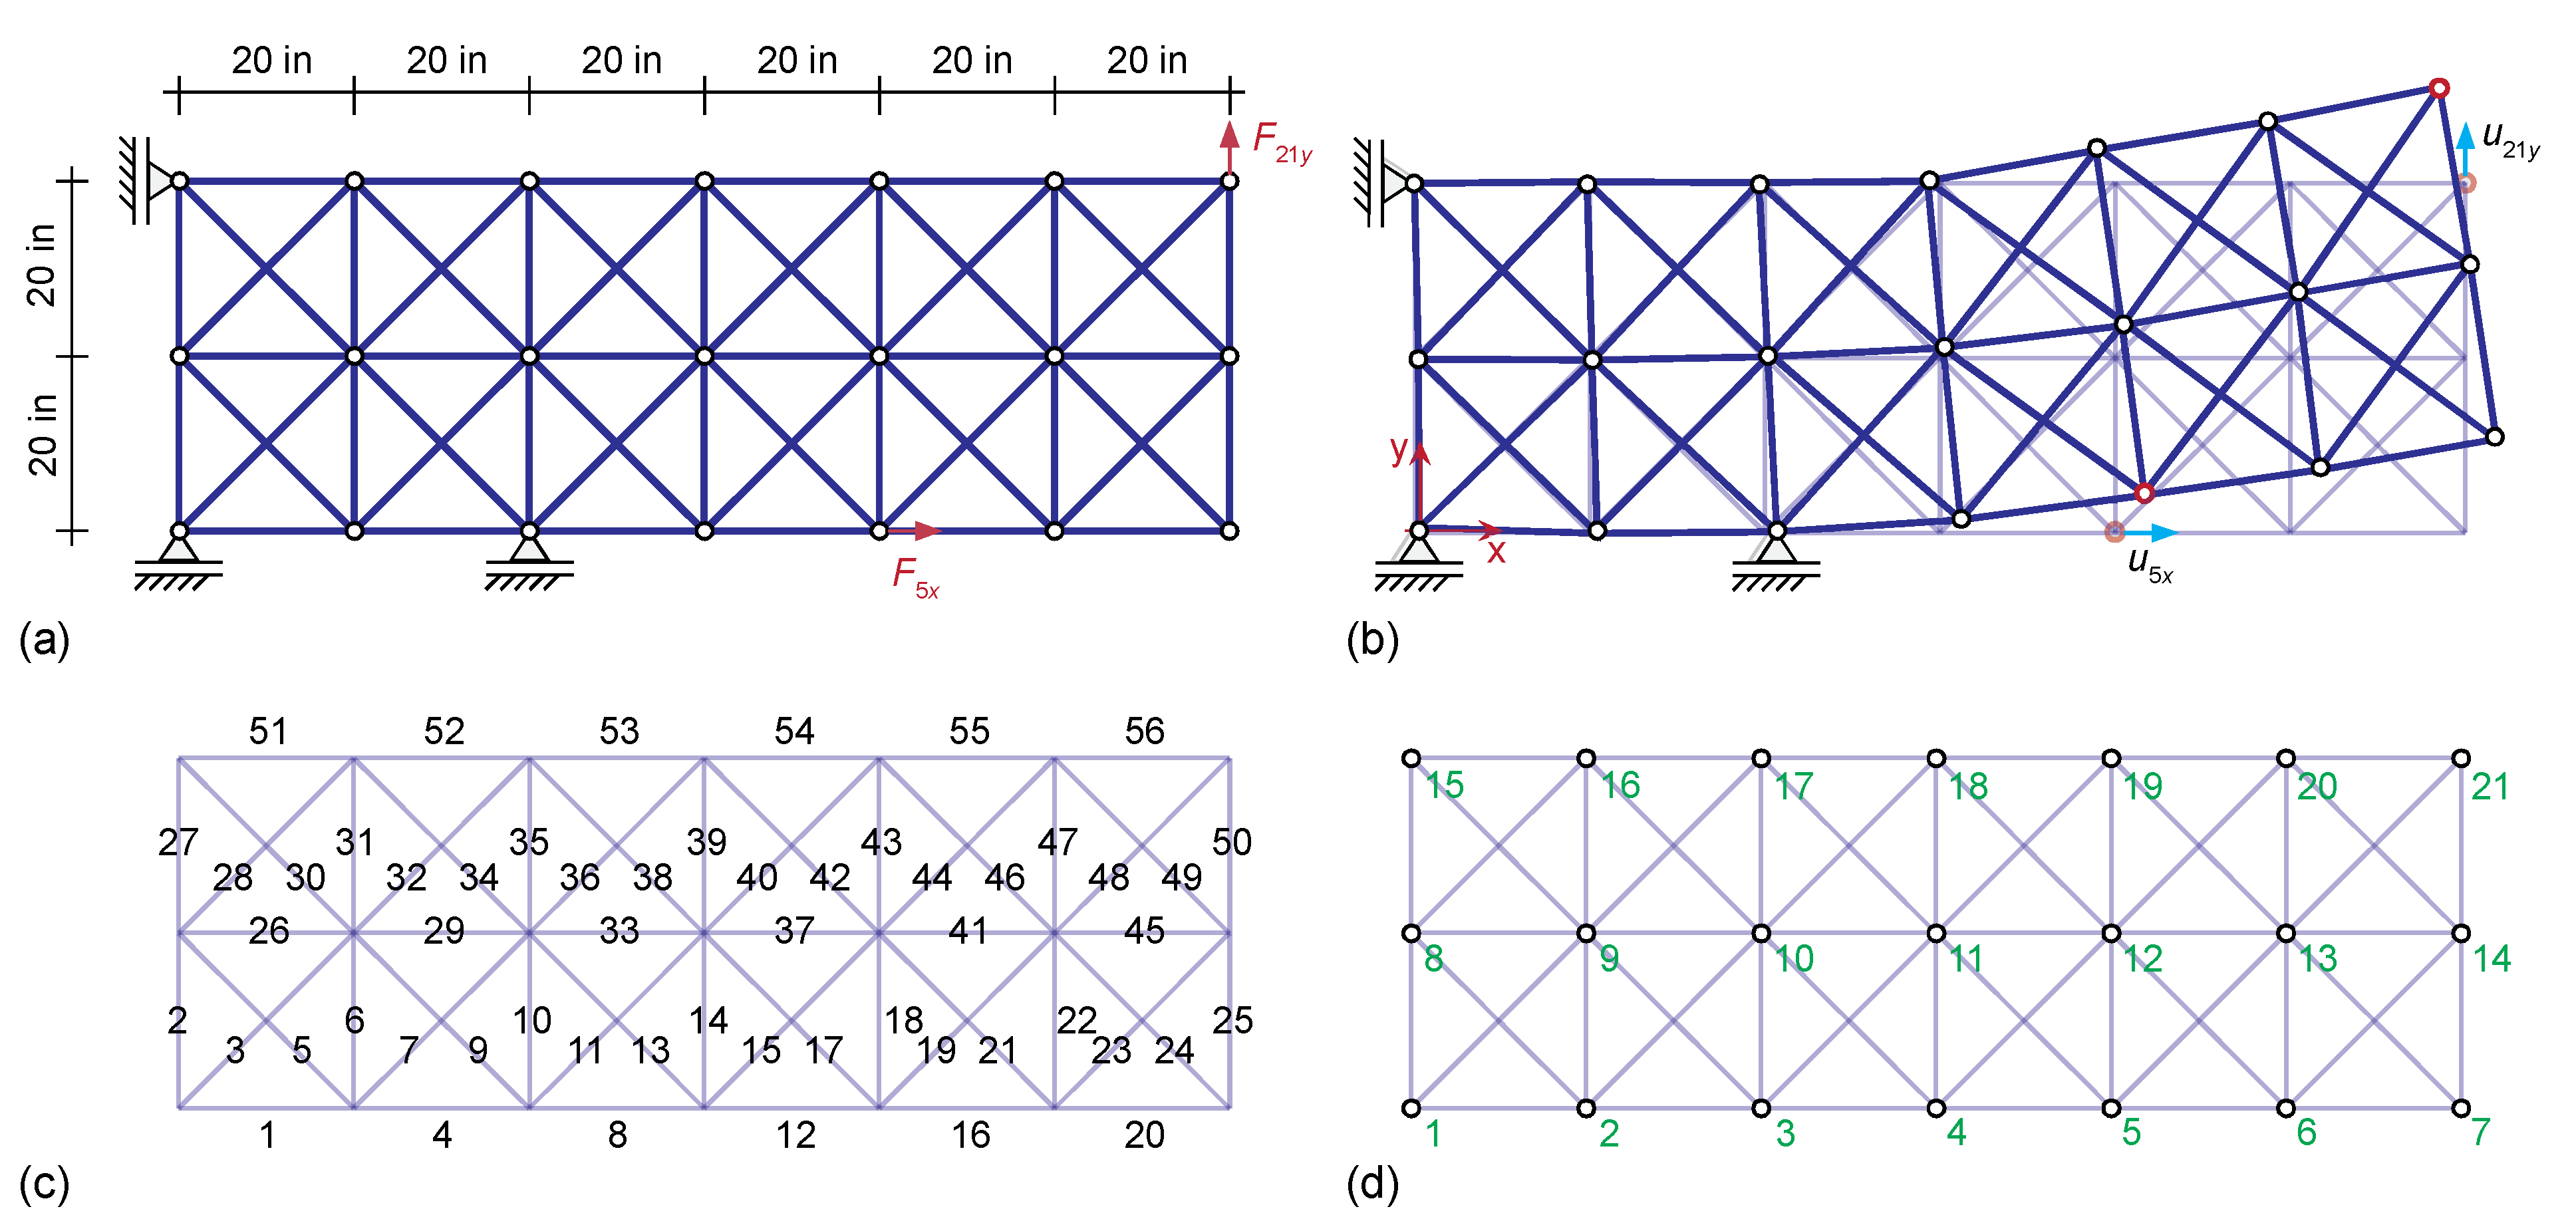
Figure 12.
Truss cantilever structure: (a) dimension, loading, and boundary conditions, (b) deformed shape and displacements of interest, (c) truss member numbers, and (d) node numbers.
Figure 12.
Truss cantilever structure: (a) dimension, loading, and boundary conditions, (b) deformed shape and displacements of interest, (c) truss member numbers, and (d) node numbers.
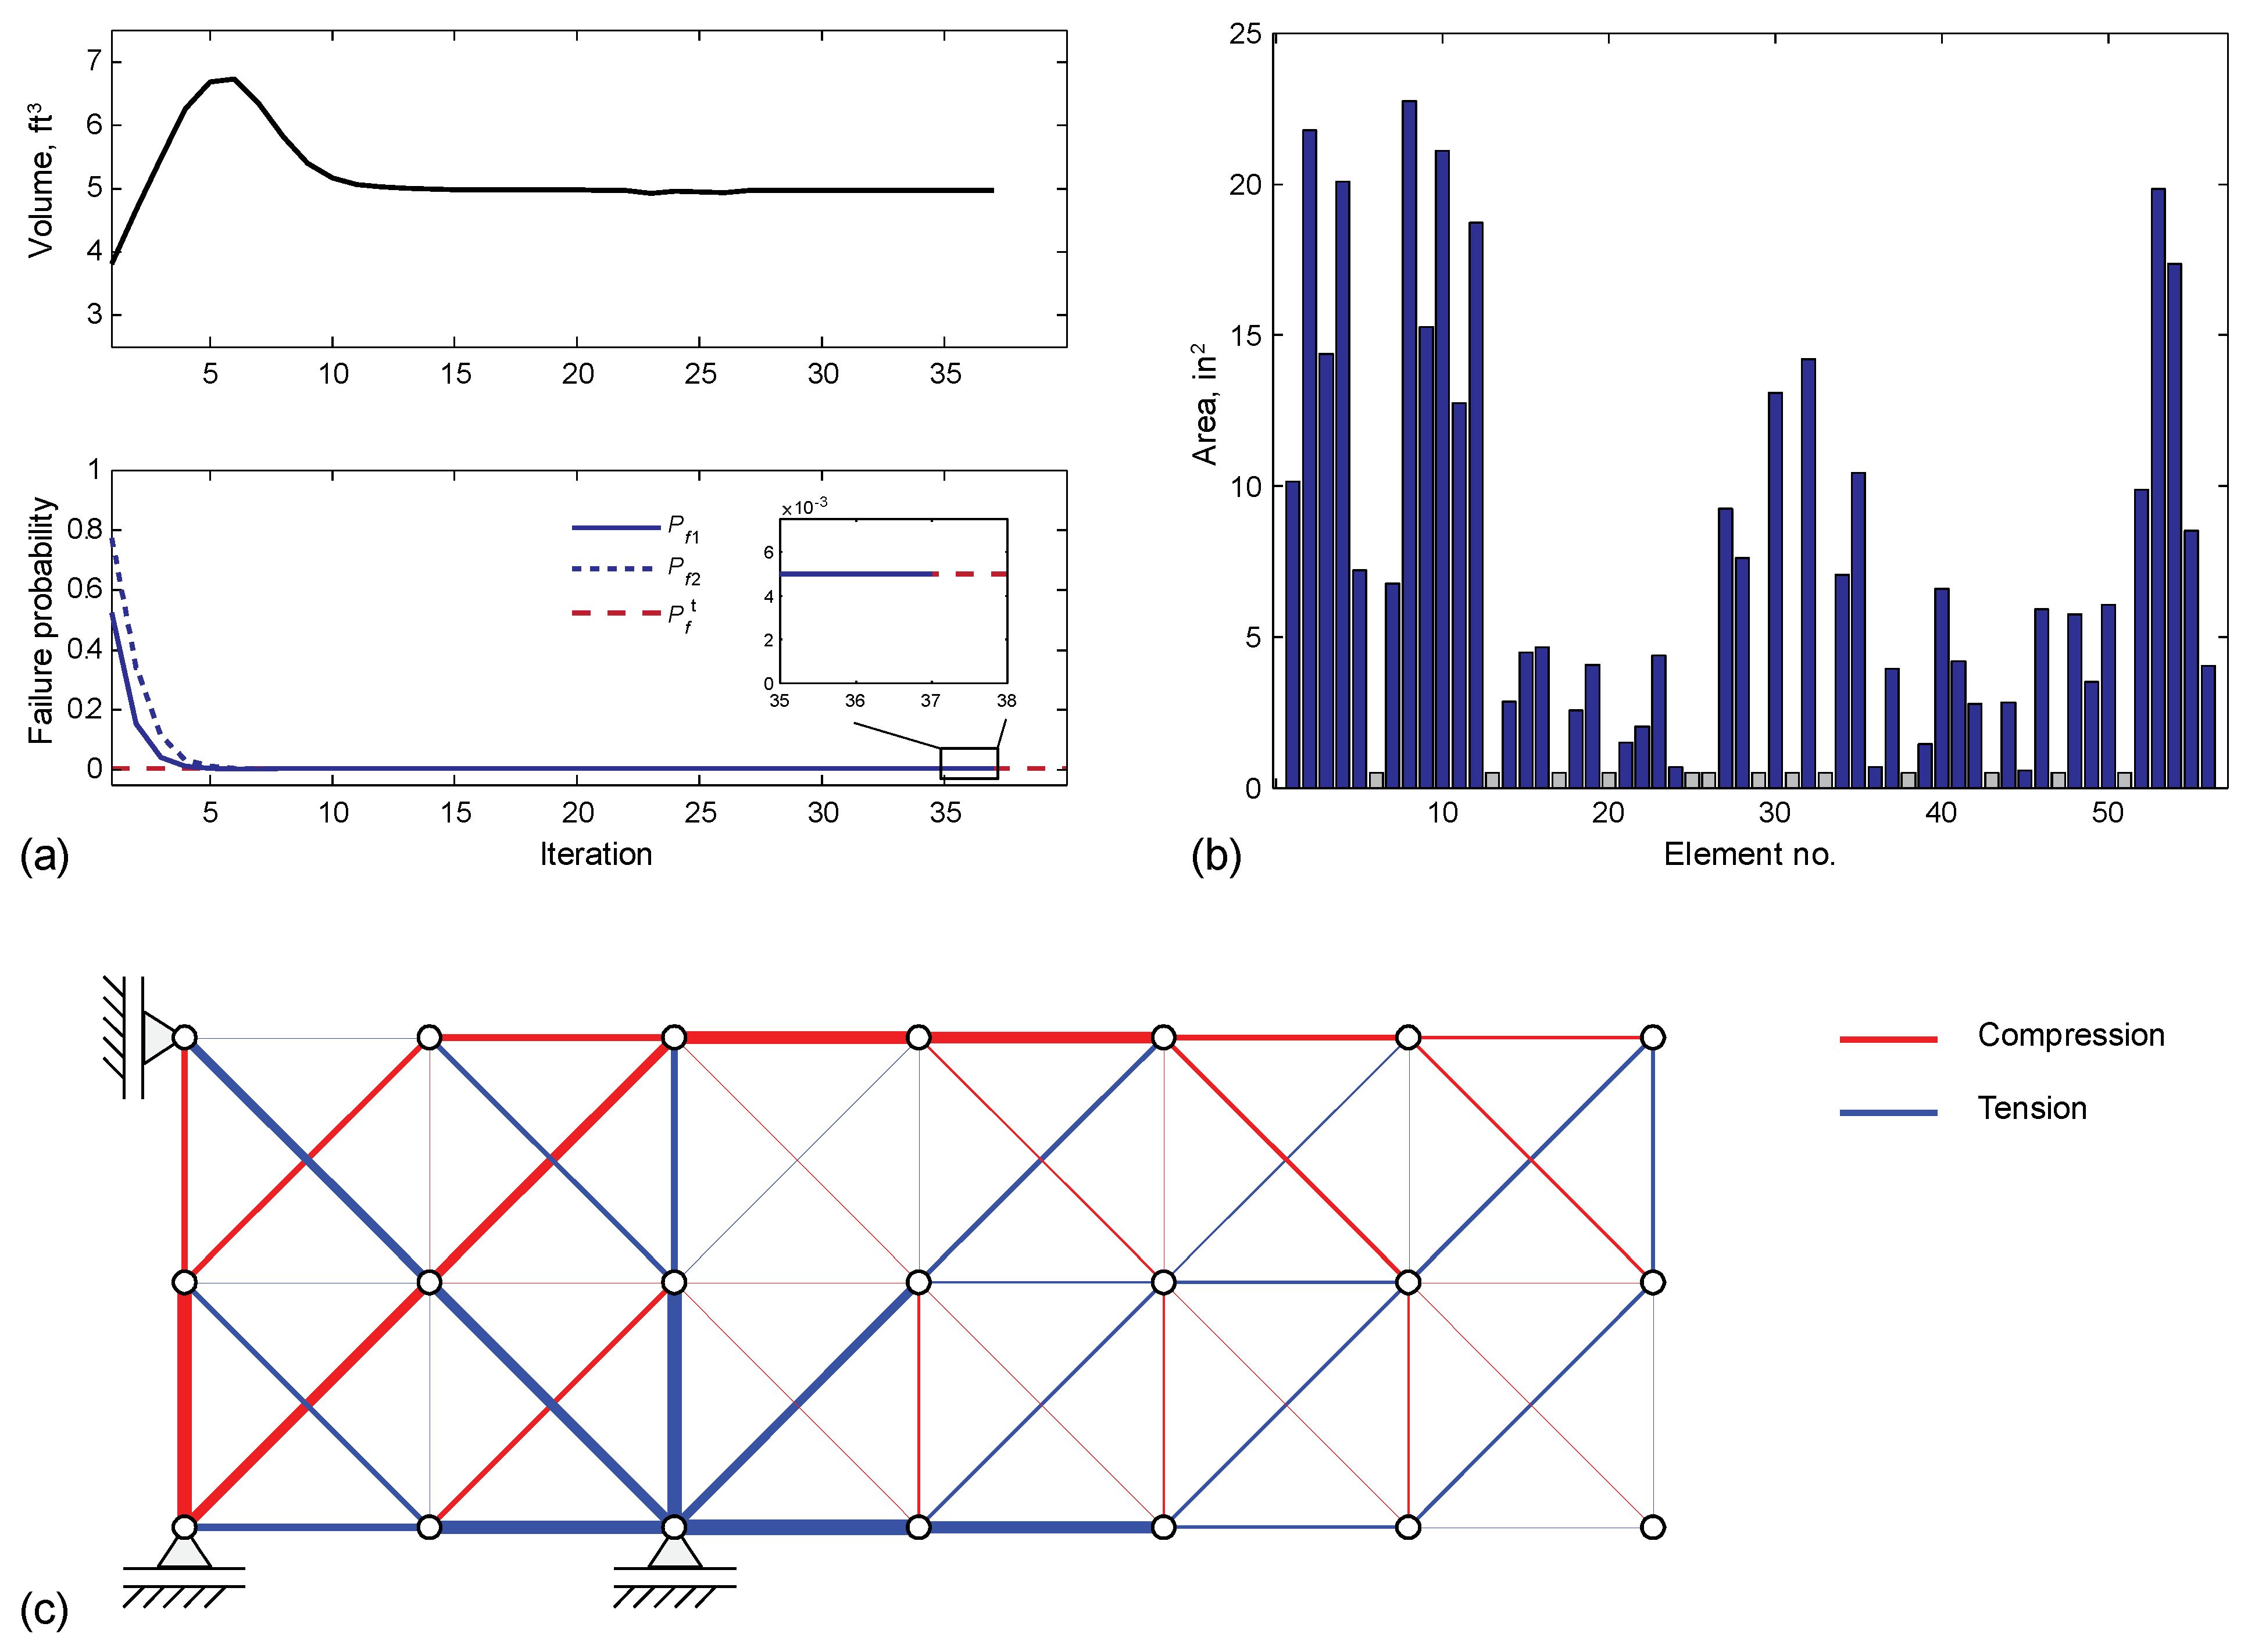
Figure 13.
Results of the proposed RBDO/CS–SORM-i: (a) Convergence histories of volume and failure probability, (b) cross-sectional areas (elements having the minimum area of 0.5 in2 are in grey), and (c) illustration of normalized cross-sectional areas of elements (elements in blue are in tension and those in red are in compression).
Table 1.
Description of the random variables for the comparative study.
Table 1.
Description of the random variables for the comparative study.
| Random Variables | Marginal Distribution | Mean | c.o.v | Correlation Coefficient |
|---|
| x1 | x2 | x3 |
|---|
| x1 | Normal | 2 | 0.25 | 1 | 0.3 | 0.3 |
| x2 | Normal | 2.5 | 0.25 | 0.3 | 1 | 0.3 |
| x3 | Normal | 1.5 | 0.25 | 0.3 | 0.3 | 1 |
Table 2.
Results of the assessment of the failure probability and sensitivity analysis by the FORM, CS–SORM, CS–SORM-i, and MCS at a point d = (0.7,0.8).
Table 2.
Results of the assessment of the failure probability and sensitivity analysis by the FORM, CS–SORM, CS–SORM-i, and MCS at a point d = (0.7,0.8).
| Failure Probability | FORM | SORM | SORM-i | MCS |
| Pf | 0.1427 | 0.1332 | 0.1291 | 0.1287 |
| Sensitivity | CS–SORM | FDM–SORM | CS–SORM-i | FDM–SORM-i | MCS |
| 0.6818 | 0.6775 | 0.6553 | 0.6493 | 0.6511 |
| −1.1932 | −1.1859 | −1.1468 | −1.1366 | −1.1362 |
Table 3.
Description of the random variables for the truss problem.
Table 3.
Description of the random variables for the truss problem.
Random
Variables | Marginal
Distribution | Mean | c.o.v | Correlation |
|---|
| FX, kips | lognormal | 100 | 0.2 | |
| FY, kips | lognormal | 150 | 0.2 |
| E, ksi | lognormal | 29,000 | 0.2 | Independent |
Table 4.
Parameters for the objective and constraint functions as well as the RBDO.
Table 4.
Parameters for the objective and constraint functions as well as the RBDO.
| , in | L, in | d0, in2 | dl, in2 | du, in2 | Convergence Criterion |
|---|
| 100 | (5, 5, 5) | (1, 1, 1) | (50, 50, 50) | 10−5 |
|
|
Table 5.
Results of the RBDO/CS–SORM-i framework and DDO for the three-bar truss.
Table 5.
Results of the RBDO/CS–SORM-i framework and DDO for the three-bar truss.
| | RBDO/CS–SORM-i | DDO | MCS |
|---|
| Optimal f*, in3 | 3229.9 | 1609.2 | – |
| Optimal d* | | | |
| A1, in2 | 7.094 | 3.448 | – |
| A2, in2 | 11.183 | 5.747 | – |
| A3, in2 | 9.916 | 4.877 | – |
| Failure probability of the optimal design | | | |
| Pf1 | 0.005 | – | 0.00501 |
| Pf2 | 0.005 | – | 0.00502 |
| Pf3 | 0.005 | – | 0.00499 |
Table 6.
Description of the random variables for the cantilever beam problem.
Table 6.
Description of the random variables for the cantilever beam problem.
| Random Variables | Marginal Distribution | Mean | c.o.v | Correlation |
|---|
| E, ksi | Weibull | 29,000 | 0.2 | Independent |
| F, kips | Gamma | 2000 | 0.2 | Independent |
| t, in | Normal | 0.5 | 0.2 | Independent |
Table 7.
Target failure probability and parameters for the reliability analysis and optimization.
Table 7.
Target failure probability and parameters for the reliability analysis and optimization.
| L, in | Δ0, in | d0, in | dl, in | du, in | Convergence Criterion |
|---|
| 0.005 | 50 | 3 | (50, 50, 50) | (1, 1, 1) | (100, 100, 100) | 10−3 |
Table 8.
Results obtained using the RBDO/CS–SORM/SORM-i for the cantilever beam.
Table 8.
Results obtained using the RBDO/CS–SORM/SORM-i for the cantilever beam.
| RBDO Method | Optimal d*, in | f (d*, μx), in3 | Pf |
|---|
| RBDO/CS−SORM | (34.5, 56.2, 72.1) | 16,128 | 0.005 |
| RBDO/CS−SORM-i | (34.6, 56.4, 72.3) | 16,185 | 0.005 |
Table 9.
Description of the random variables for the ductile frame optimization problem.
Table 9.
Description of the random variables for the ductile frame optimization problem.
Random
Variables | Marginal
Distribution | Mean | c.o.v | Correlation |
|---|
| m1, kNm | Joint lognormal | 150 | 0.2 | |
| m2, kNm |
| m3, kNm |
| m4, kNm |
| m5, kNm |
| h, kN | Gumbel | 50 | 0.4 | Independent |
| v, kN | Gamma | 60 | 0.2 | Independent |
Table 10.
Target failure probability and parameters for the reliability analysis and optimization.
Table 10.
Target failure probability and parameters for the reliability analysis and optimization.
| d0, m | dl, m | du, m | Convergence Criterion |
|---|
| 0.003 | (7.0, 7.0) | (1.0, 1.0) | (10.0, 10.0) | 10−4 |
Table 11.
Failure probabilities and reliability indices of initial limit-state functions estimated using the FORM, SORM, and SORM-i.
Table 11.
Failure probabilities and reliability indices of initial limit-state functions estimated using the FORM, SORM, and SORM-i.
| Limit-State Function | FORM | SORM | SORM-i |
|---|
| β | Pf | β | Pf | β | Pf |
|---|
| 1.452 | 0.0732 | 1.468 | 0.0711 | 1.472 | 0.0705 |
| 1.435 | 0.0757 | 1.468 | 0.0710 | 1.479 | 0.0696 |
| 0.701 | 0.2415 | 0.688 | 0.2457 | 0.674 | 0.2503 |
Table 12.
Results of the RBDO/CS–SORM/SORM-i and RBDO–FORM for the ductile frame structure.
Table 12.
Results of the RBDO/CS–SORM/SORM-i and RBDO–FORM for the ductile frame structure.
| | i | Pfi | βi | Optimal d*, m | Optimal f*, m |
|---|
| RBDO–FORM | 1 | 0.0005 | 3.310 | (3.362, 5.148) | 13.658 |
| 2 | 0.0030 | 2.748 |
| 3 | 0.0030 | 2.748 |
| RBDO/CS–SORM | 1 | 0.0003 | 3.417 | (3.277, 5.196) | 13.669 |
| 2 | 0.0030 | 2.748 |
| 3 | 0.0030 | 2.748 |
| RBDO/CS–SORM-i | 1 | 0.0004 | 3.349 | (3.264, 5.201) | 13.666 |
| 2 | 0.0030 | 2.748 |
| 3 | 0.0030 | 2.748 |
Table 13.
Description of the random variables for the cantilever truss optimization problem.
Table 13.
Description of the random variables for the cantilever truss optimization problem.
Random
Variables | Marginal
Distribution | Mean | c.o.v | Correlation |
|---|
| F5x, kips | Joint lognormal | 300 | 0.2 | |
| F21y, kips | Joint lognormal | 100 | 0.2 |
| E, ksi | Normal | 29,000 | 0.2 | Independent |
Table 14.
Target failure probability and parameters for the reliability analysis and optimization.
Table 14.
Target failure probability and parameters for the reliability analysis and optimization.
| | | d0, in2 | dl, in2 | du, in2 | Convergence Criterion |
|---|
| 0.005 | 0.3 | 0.6 | 5.0 | 0.5 | 50.0 | 10−3 |
Table 15.
Results of the RBDO/CS–SORM and SORM-i, RBDO–FORM, and SL–KKT for the truss cantilever structure.
Table 15.
Results of the RBDO/CS–SORM and SORM-i, RBDO–FORM, and SL–KKT for the truss cantilever structure.
| RBDO Method | Optimal f *, ft3 | Pfi × 10−3 of the Optimized Design |
|---|
| i | FORM | SORM | SORM-i | MCS |
|---|
| SL–KKT | 4.806 | 1 | 5.00 | 5.57 | 5.67 | 5.67 |
| 2 | 5.00 | 5.59 | 5.67 | 5.72 |
| RBDO–FORM | 4.885 | 1 | 5.00 | 5.58 | 5.66 | 5.61 |
| 2 | 5.00 | 5.60 | 5.68 | 5.70 |
| RBDO/CS–SORM | 4.963 | 1 | 4.47 | 5.00 | 5.07 | 4.98 |
| 2 | 4.46 | 5.00 | 5.07 | 5.04 |
| RBDO/CS–SORM-i | 4.974 | 1 | 4.41 | 4.94 | 5.00 | 4.99 |
| 2 | 4.40 | 4.94 | 5.00 | 5.01 |


