Article

Reliability-Based Design Optimization of Structures Using the Second-Order Reliability Method and Complex-Step Derivative Approximation

School of Architecture, Syracuse University, Syracuse, NY 13210, USA
Appl. Sci. 2021, 11(11), 5312; https://doi.org/10.3390/app11115312
Submission received: 12 April 2021 / Revised: 31 May 2021 / Accepted: 31 May 2021 / Published: 7 June 2021
(This article belongs to the Section Civil Engineering)

Abstract

:
This paper proposes a reliability-based design optimization (RBDO) approach that adopts the second-order reliability method (SORM) and complex-step (CS) derivative approximation. The failure probabilities are estimated using the SORM, with Breitung’s formula and the technique established by Hohenbichler and Rackwitz, and their sensitivities are analytically derived. The CS derivative approximation is used to perform the sensitivity analysis based on derivations. Given that an imaginary number is used as a step size to compute the first derivative in the CS derivative method, the calculation stability and accuracy are enhanced with elimination of the subtractive cancellation error, which is commonly encountered when using the traditional finite difference method. The proposed approach unifies the CS approximation and SORM to enhance the estimation of the probability and its sensitivity. The sensitivity analysis facilitates the use of gradient-based optimization algorithms in the RBDO framework. The proposed RBDO/CS–SORM method is tested on structural optimization problems with a range of statistical variations. The results demonstrate that the performance can be enhanced while satisfying precisely probabilistic constraints, thereby increasing the efficiency and efficacy of the optimal design identification. The numerical optimization results obtained using different optimization approaches are compared to validate this enhancement.

1. Introduction

Structural design is primarily aimed at maximizing the strength, serviceability, and safety of a structure considering the load effects. The dimensions, compositions, and orientations of the structural members are carefully determined to ensure a sufficient safety margin between the structural demand and its capacity. However, uncertainties inevitably arise in the planning and execution of processes in structural analyses, modeling, design parameters, and strength evaluations. In particular, the environmental conditions, geometric characteristics, and nature of material compositions, along with discrepancies between the predicted and actual loads, responses, and strength, add many layers of complexity and uncertainty. Consequently, in structural design and optimization, the uncertainties in predicting the load effects and structural modeling must be considered to ensure a sufficient level of structural reliability. Nevertheless, this consideration is challenging because in addition to the increasing number of natural and artificial uncertainties, the nature of their interaction also becomes unpredictable and is difficult to anticipate. To address the ongoing challenges associated with increasing uncertainties, theoretical and numerical probabilistic analysis and design methods are being developed in academia and industry.
The reliability-based design optimization (RBDO) strategy incorporates the reliability analysis to account for uncertainties in structural design optimization. The RBDO framework includes the evaluation of the probabilistic constraints, implemented through the reliability analysis during optimization. The reliability analysis is aimed at determining the probability that a component or a system will fail in operation, considering the impacts of random inputs. However, the estimation of the failure probability of a structure is generally not straightforward and is therefore computationally expensive. Many algorithms and methods have been proposed to address these challenges and increase the efficacy of the reliability analysis, including simulation-based [1,2], surrogate model [3,4], matrix-based [5], first-order linearization [6,7], and quadratic approximation approaches [8,9,10]. Among these techniques, the first-order reliability method (FORM) linearizes the limit-state equations to approximate the probability, whereas the second-order reliability method (SORM) uses a quadratic approximation to perform the reliability analysis [11,12]. The estimation accuracy depends on the characteristics of the limit-state function. When the limit-state function has a high nonlinearity, the SORM achieves more accurate evaluations compared to the FORM that may not identify accurate failure points or encounter a convergence issue while searching for them. Various factors, such as the nonlinear relationship between random variables and the transformation of random variables from the original space to standard normal space, may cause the nonlinearity of the limit-state function. In contrast, when the limit-state function is linear (or close to linear) in the standard normal space, the FORM and SORM may generate equivalent calculation results for the probability.
The FORM and SORM are being increasingly used owing to their high computational efficiency, accuracy, and wide applicability. Shin and Lee [13] proposed an RBDO technique to minimize the radius of roadway horizontal curves by performing the first-order reliability analysis. Analytical models integrated with the vehicle behaviors and characteristics were used to establish the probabilistic constraints, and novel recommendations of the minimum radii were provided to satisfy the target reliability levels. Meng et al. [14] proposed an RBDO technique using the SORM with an improved stability transformation approach to increase the accuracy and efficiency of the reliability analysis. The stability transformation approach calculated the chaos control factor during the optimization process, thereby enhancing the efficiency of the most probable point search. Tu et al. [15] developed a performance measure approach (PMA) employing the FORM to perform the reliability analysis. In the PMA, the probabilistic constraint was expressed in terms of a performance function, a quantile of the limit-state function. Enevoldsen and Sørensen [16] developed the reliability index approach (RIA), in which the reliability index of the probabilistic constraint was obtained by the FORM. The optimization was performed by updating the design variables to ensure that the obtained reliability index was greater than a predetermined reliability index. Youn et al. [17] proposed an enhanced PMA approach with a hybrid analysis method that adaptively selected the numerical algorithms, average mean value, and conjugate mean value to efficiently obtain the design point that is the most likely failure point. Eldred and Bichon [18] explored the second-order RIA and PMA formulations with various reliability analysis methods, including the FORM, SORM, mean-value first-order second-moment method, and advanced mean value method. Furthermore, Haldar and Mahadevan [19] provided a detailed review of the RIA, Lee et al. [20] conducted a comparative study on the RIA and PMA, and Lopez and Beck [21] provided a comprehensive review of the RBDO using the FORM.
The sensitivity analysis is an integral part of structural design optimization because the information of the sensitivity analysis indicates the effects of the changes in the design or modeling parameters on the structure. The key variables can be identified through the sensitivity analysis to enable the effective design of different types of structures. Furthermore, the sensitivity information can be used in gradient-based optimization algorithms to search for directions to update the design variables at each iteration. In the context of the RBDO, diverse methods of sensitivity analysis have been developed. Chun et al. [22] proposed a method to compute the sensitivity of the parallel, series, and general system using the sequential compounding method [23], where component events coupled by a union or intersection operation were sequentially compounded. The sensitivity analysis was performed with a single compound representing the system failure to improve the computational efficiency. Au [24] proposed a simulation approach to perform reliability-based design sensitivity analysis. Specifically, an augmented reliability problem was formulated using design variables that were artificially considered as uncertain with a specified probability density function. The reliability sensitivity was obtained by performing the failure analysis of the augmented problem. Karamchandani and Cornell [25] utilized a finite difference method for sensitivity estimation within the FORM and SORM. Frangopol [26] proposed a feasible direction concept to obtain the sensitivity. By changing a selected parameter while keeping other variables fixed, the rate of change in the optimum design was measured. The variation in the optimum solutions was quantified in the sensitivity analysis. Generally, finite difference approaches or simulation-based methods such as Monte Carlo simulations (MCS) may cause the instability of the numerical implementation and require high computational power, and these aspects hinder the application of these techniques. Moreover, the difficulty of sensitivity analysis may increase when the underlying functions and the governing equations of the system are complex, or the analytical derivation of gradients is not feasible. Therefore, to identify the optimal structure that satisfies a certain level of reliability, it is crucial to perform the sensitivity analysis of the failure probability estimated using the SORM, which is generally more accurate than that obtained using the FORM.
To overcome the abovementioned challenges, this paper proposes an RBDO technique that incorporates the complex-step (CS) derivative approximation into the SORM for the sensitivity analysis. An overview of the structural reliability, FORM/SORM, and RBDO is presented, followed by an explanation of the proposed RBDO/CS procedure. The performance and applicability of the proposed method are demonstrated by numerical examples.

2. Structural Reliability

The theory of structural reliability pertains to the estimation of the failure probability of structural design-related limit-state functions by considering the uncertainties in both the load effects and strength.

2.1. Mathematical Basis

Evaluating the structural reliability involves determining the likelihood that a given structure will perform as designed, including the calculation of the failure probabilities that correspond to the limit-state functions associated with structural design. Consider a time-invariant reliability problem characterized by a vector X of n basic random variables, X = (X1,X2,X3,…,Xn)T Assuming that the random variables have the joint probability density function, k ( x ) , the probability failure, Pf, of the limit-state function, g(x), can be defined by an n-fold integral:
P f = P ( x Ω F ) = Ω F k ( x ) d x
where x is the realization of the random vector X, and Ω F is the failure domain described in terms of the continuous and differentiable limit-state function, g(x), that indicates a violation of a design constraint. g(x) divides the n-dimensional probability space into the safe domain Ω S = { x : g ( x ) > 0 } and failure domain Ω F = { x : g ( x ) 0 } . In general, it is challenging to calculate the n-fold integral in Equation (1) when the number of random variables, n, is greater than 3 or 4 because no closed-form solution is available. Many methods have been developed to compute the probability integral [27], among which, the FORM and SORM [6,12] are widely utilized to efficiently evaluate the probability integral defined in Equation (1).

2.2. First-Order Reliability Method

The FORM is an analytical approximation of the probability integral, obtained by linearizing a limit-state function transformed into the standard normal space at an optimal point. In the theory of structural reliability, the optimal point, also known as the design point or most probable point, is computed via mathematical programming. By transforming the random variables from the original space into the standard normal space ( u = T ( x ) ) , the failure probability integral can be written as:
P f = G ( u ) 0 φ n ( u ) d u
where G(u) is the limit-state function transformed into the standard normal space, and φ n ( · ) is the n-variate standard normal density function for the random vector. The FORM linearizes the limit-state function G(u) at a point u* that is obtained by solving a constraint optimization problem, defined as:
arg   min u * { u | G ( u ) = 0 }
The design point, u*, indicates a location on the linearized limit-state function that is at the least distance from the origin in the standard normal space. The linearized limit-state function at u* can be expressed as:
G ( u ) = G ( u * ) ( u u * ) = G ( u * ) ( β α u )
where G ( u * ) = u * G ( u * ) = ( G / u 1 * , G / u 2 * , , G / u n * ) denotes the gradient row vector. The linearization represents the failure domain G(u) ≤ 0, which is the half-space defined by β α u 0 . The reliability index β = α u * is interpreted as the minimum distance from the origin to the limit-state surface in the standard normal space, and α = G ( u * ) / G ( u * ) denotes the normalized negative vector at the design point (see Figure 1).
Considering the half-space defined by the reliability index, an approximate value for the failure probability can be defined as:
P f FORM Φ ( β )
where Φ(·) denotes the cumulative distribution function of the standard normal distribution. Since the limit-state function is approximated by a linearized function in the standard normal space at the design point, accuracy problems arise when the limit-state function is strongly nonlinear. The SORM that includes a curvature correction has been developed to enhance the accuracy of the FORM.

2.3. Second-Order Reliability Method

The SORM [6] transforms a reliability problem into the independent standard normal random variable space as the FORM, approximates a limit-state function through a second-order surface, and computes the probability of failure using the approximate surface. Consider a Taylor series expansion of the limit-state function in the standard normal space at u*:
G ( u ) = G ( u * ) ( u u * ) + 1 2 ( u u * ) T H ( u u * ) + O G ( u * ) [ ( β α u ) + 1 2 G ( u * ) ( u u * ) T H ( u u * ) ]
where H is the second-derivative matrix of G(u) at u*, known as the Hessian matrix having elements H i j = 2 G ( u * ) / ( u i u j ) , i , j = 1 , , n , and O is the higher-order error term. Consider an orthonormal matrix P with α that leads to a rotation of axes u = P u and positions the design point on the u n axis ( u * ) . The limit-state function can be expressed as:
G ( u ) = β u n + 1 2 ( u u * ) T D ( u u * )
where u n = α P T u and D = P H P T / G ( u * ) . Expanding the matrix product in Equation (7) and considering the tangent plane at the design point while neglecting the smaller order terms [6] yield:
G ( u ) = β u n + 1 2 u 1 T D 11 u 1
where D11 is the (n − 1) × (n − 1) matrix formed by the first (n − 1) rows and columns of D. After a set of linear transformations [6,10,28], such as rotation of the axes with u 1 = Q u 1 ( Q is an (n − 1) × (n − 1) orthonormal matrix) and orthogonal diagonalization, the limit-state function in Equation (8) can be simplified as follows:
G ( u ) = β u n + 1 2 i = 1 n 1 κ i u i 2
where κi represents the eigenvalues of D11 that define the principal curvatures of the limit-state function. Based on the asymptotic approximations derived by Breitung [8], the failure probability can be computed as:
P f SORM Φ ( β ) · i = 1 n 1 1 1 + β κ i
Note that the term 1 / 1 + β κ i acts as a correction for the FORM approximation. Hohenbichler and Rackwitz [9] proposed an alternate correction to improve the calculation results, as:
P f SORM     i Φ ( β ) · i = 1 n 1 1 1 + ( φ ( β ) / Φ ( β ) ) κ i
The approximation of the limit-state function in the SORM is better than that of the FORM and results in a more accurate assessment of the failure probability. However, the SORM requires additional effort in terms of the function evaluation and construction of the Hessian matrix.

3. Reliability-Based Design Optimization

RBDO methods are used to perform design optimization while accounting for uncertainties in the design matrix through simulations and probability analyses. The RBDO for structures incorporates structural reliability analysis in the structural optimization process to achieve the optimal design under the given probabilistic constraints pertaining to the uncertainties in structural integrity-related parameters, such as the material property, magnitude and direction of forces, and modeling. The RBDO formulated such that the optimal structure satisfies each failure mode with predetermined probabilities is referred to as component-RBDO (CRBDO). A CRBDO problem can be defined as:
min d , μ x f o b j ( d , μ x ) s . t . P f i = P [ g i ( d , x ) 0 ] P f i t ,   i = 1 , , n c d l d d u
where fobj is the objective function, d is a vector of deterministic design variables, μx is the vector of the means of random variable x, P [ g i ( d , x ) 0 ] is the failure probability of the i-th limit-state function gi(·), Pfit represents the target failure probability, nc is the number of probabilistic constraints, and dl and du are the lower and upper bounds of the design variables, respectively. Gradient-based optimization algorithms such as sequential linear programming, sequential quadratic programming [29], convex linearization [30], optimality criteria [31], and method of moving asymptotes (MMA) [32] are often used to solve Equation (12). Many strategies are available to implement the reliability analysis in the RBDO. For instance, in the double-loop approach [15,33], each step of the iterations for the design optimization involves another subloop of iterations for the reliability analysis. Single-loop (SL) approaches [34,35,36] approximate the equivalent deterministic constraint by using the Karush–Kuhn–Tucker (KKT) optimality condition to convert the double-loop problem into a single-loop problem. Decoupling approaches [37,38] decouple the outer-loop optimization from the reliability analysis by constructing an equivalent deterministic optimization problem. A comprehensive review of the structural reliability analysis and RBDO has been presented by Song et al. [27].

4. Proposed Method for Sensitivity Analysis of SORM-Based Estimates

4.1. SORM-Based Determination of the Sensitivity of the Failure Probability

Sensitivity analysis has been a key domain in engineering practice and research, particularly in the design optimization area. The dependence of the reliability on the design parameters or random variables can be evaluated by performing a sensitivity analysis. Furthermore, the sensitivity analysis is integral to utilize an efficient gradient-based optimization algorithm in the RBDO. The sensitivity analysis in the RBDO framework using the SORM is the focus of this study. The sensitivity of Breitung’s failure probability with respect to a design parameter d can be derived by applying a chain rule to Equation (10):
d P f SORM = d ( Φ ( β ) i = 1 n 1 1 1 + β κ i ) = φ ( β ) · d β ( d , x * ) · ( i = 1 n 1 1 1 + β κ i ) + Φ ( β ) · ( j = 1 n 1 ( 1 2 ( 1 1 + β κ j 3 ) κ j · m { 1 , , n 1 } \ { j } 1 1 + β κ m ) ) · d β ( d , x * )
where the gradient of reliability index is:
d β ( d , x * ) = d g ( d , x * ) G ( d , x * )
Similarly, the sensitivity of the failure probability based on Hohenbichler and Rackwitz’s formula, as defined in Equation (11), can be derived as:
d P f SORM   -   i = d ( Φ ( β ) i = 1 n 1 1 1 + ψ ( β ) κ i ) = φ ( β ) · d β ( d , x * ) · ( i = 1 n 1 1 1 + ψ ( β ) κ i ) + Φ ( β ) · ( j = 1 n 1 ( 1 2 ( 1 1 + ψ ( β ) κ j 3 ) ( β + ψ ( β ) ) · ψ ( β ) κ j · m { 1 , , n 1 } \ { j } 1 1 + ψ ( β ) κ m ) ) · d β ( d , x * )
where ψ ( β ) = φ ( β ) / Φ ( β ) . Note that Equations (14) and (15) are derived assuming that curvatures κ i are nearly independent of the design variable. To realize the sensitivity analysis, the gradients of the reliability index at x* need to be computed. The CS derivative approximation is applied to compute the gradients.

4.2. Complex-Step Derivative Approximation

The proposed method adopts the CS method [39] to perform the sensitivity analysis of SORM-based estimates associated with probabilistic constraints in the RBDO. Squire and Trapp [40] proposed a method to compute the first derivative of a function by using the CS derivative approximation and demonstrated its higher efficiency and accuracy compared to those of the traditional finite difference methods [41]. Commonly, the first derivative in the finite difference method is estimated using a forward difference formula:
f ( a ) f ( a + h ) f ( a ) h + O ( h )
where h is the step size, and O(h) is the truncation error. A small step size, h, is commonly selected to minimize the truncation error. However, an extremely small step size may cause a significant error due to dominant subtractive cancellation. The level of accuracy in the first derivative using the conventional finite difference method may vary with changes in the step size. The appropriate step size is generally unknown before actual calculations. Although higher-order finite difference methods can be adopted to minimize truncation errors, subtractive cancellation errors remain and may become significant in the calculations.
In the CS derivative approximation, an imaginary number is used to develop an estimate of derivatives. Consider a differentiable function f(z) = u + iv of the complex variable z = a + i b ( a , b , i 2 = 1 ) . Assume u and v are the real and imaginary parts f(z) respectively. Based on the Cauchy–Riemann equations that indicate the relationship between u and v,
u a = v b u b = v a
The first Cauchy–Riemann equation yields:
u a = lim h 0 v ( a + i ( b + h ) ) v ( a + i b ) h , ( h )
By setting b = 0, z becomes a real number, such that f ( a ) = u ( a ) and v ( a ) = 0 ; then, the first-derivative expression in Equation (18) can be written as:
f ( a ) a = lim h 0 [ f ( a + i h ) ] h , ( h )
For a small step size, h, Equation (19) can be approximated as:
f ( a ) a [ f ( a + i h ) ] h
where [ · ] denotes the imaginary part of the function f. Evaluating f at the imaginary argument a + ih and dividing it by h yields an approximation to the first derivative. Note that a truncation error, O(h2), that can be confirmed by the use of a Taylor series expansion at a + ih, exists in Equation (20). However, the CS derivative approximation does not include a subtraction operation, and thus, the calculation results are not affected by the subtractive cancellation and its associated round-off errors. Multiplying the real part of Equation (20) with h yields a value of function f(a). In other words, the first derivative and function value can be computed simultaneously during the implementation. It should be noted that sensitivity analysis using the CS derivative approximation simply requires the evaluation of the function with a complex variable, without analytical derivations of gradients. Therefore, the CS derivative approximation allows for sensitive analysis, even when the analytic derivation of gradients cannot be explicitly expressed, or each analysis becomes computationally expensive.

4.3. Sensitivity Analysis of the Failure Probability Obtained Using the SORM via the CS Derivative Approximation

Consider a vector of realization of n random variables x = (x1,x2,x3,…,xn)T and a vector of z design variables d = (d1,d2,d3,…,dz)T. Incorporating the CS approximation approach in the sensitivity analysis yields the gradients of the reliability index, such that:
d β ( d , x * ) = d g ( d , x * ) G ( d , x * ) = 1 G ( d , x * ) [ g ( d , x * ) d 1 , , g ( d , x * ) d l , , g ( d , x * ) d z ] T = [ g ( d + i h e 1 , x * ) , , g ( d + i h e l , x * ) , , g ( d + i h e z , x * ) ] T h · G ( d , x * )
where el denotes the l-th column of an identity matrix (Iz) of size z. Considering the transformation of the random variables from the original space into the standard normal space (u = T(x)) in the SORM, the gradient vector G ( d , u * ) in Equation (21) can be rewritten as:
G ( d , u * ) = g ( d , x * ) J u , x 1 ( x * ) ( u * G ( d , u * ) = x * g ( d , x * ) J u , x 1 ( x * ) )
where J u , x 1 is the inverse of the Jacobian of the x to u transformation. Note that the Jacobian is dependent on the distribution types of the random variables [6]. Applying the CS derivative approximation to Equation (22) yields:
g ( d , u * ) = [ g ( d , x * + i h e 1 ) , , g ( d , x * + i h e k ) , , g ( d , x * + i h e n ) ] T h
where ek denotes the k-th column of an identity matrix (In) of size n. Substituting Equations (21) and (23) into Equations (13) and (15) provides the sensitivity of the second-order probability approximation with respect to a vector of d as:
d P f SORM = A ¯ ( β , κ i ) + B ¯ ( β , κ i ) · [ g ( d + i h e 1 , x * ) , , g ( d + i h e z , x * ) ] T h · g ( d , x * ) J u , x 1 ( x * )
d P f SORM   -   i = C ¯ ( β , κ i ) + D ¯ ( β , κ i ) · [ g ( d + i h e 1 , x * ) , , g ( d + i h e z , x * ) ] T h · g ( d , x * ) J u , x 1 ( x * )
where,
A ¯ ( β , κ i ) = φ ( β ) · [ g ( d + i h e 1 , x * ) , , g ( d + i h e z , x * ) ] T h · g ( d , x * ) J u , x 1 ( x * ) · ( i = 1 n 1 1 1 + β κ i ) B ¯ ( β , κ i ) = Φ ( β ) · ( j = 1 n 1 ( 1 2 ( 1 1 + β κ j 3 ) κ j · m { 1 , , n 1 } \ { j } 1 1 + β κ m ) ) C ¯ ( β , κ i ) = φ ( β ) · [ g ( d + i h e 1 , x * ) , , g ( d + i h e z , x * ) ] T h · g ( d , x * ) J u , x 1 ( x * ) · ( i = 1 n 1 1 1 + ψ ( β ) κ i ) D ¯ ( β , κ i ) = Φ ( β ) · ( j = 1 n 1 ( 1 2 ( 1 1 + ψ ( β ) κ j 3 ) ( β + ψ ( β ) ) · ψ ( β ) κ j · m { 1 , , n 1 } \ { j } 1 1 + ψ ( β ) κ m ) )
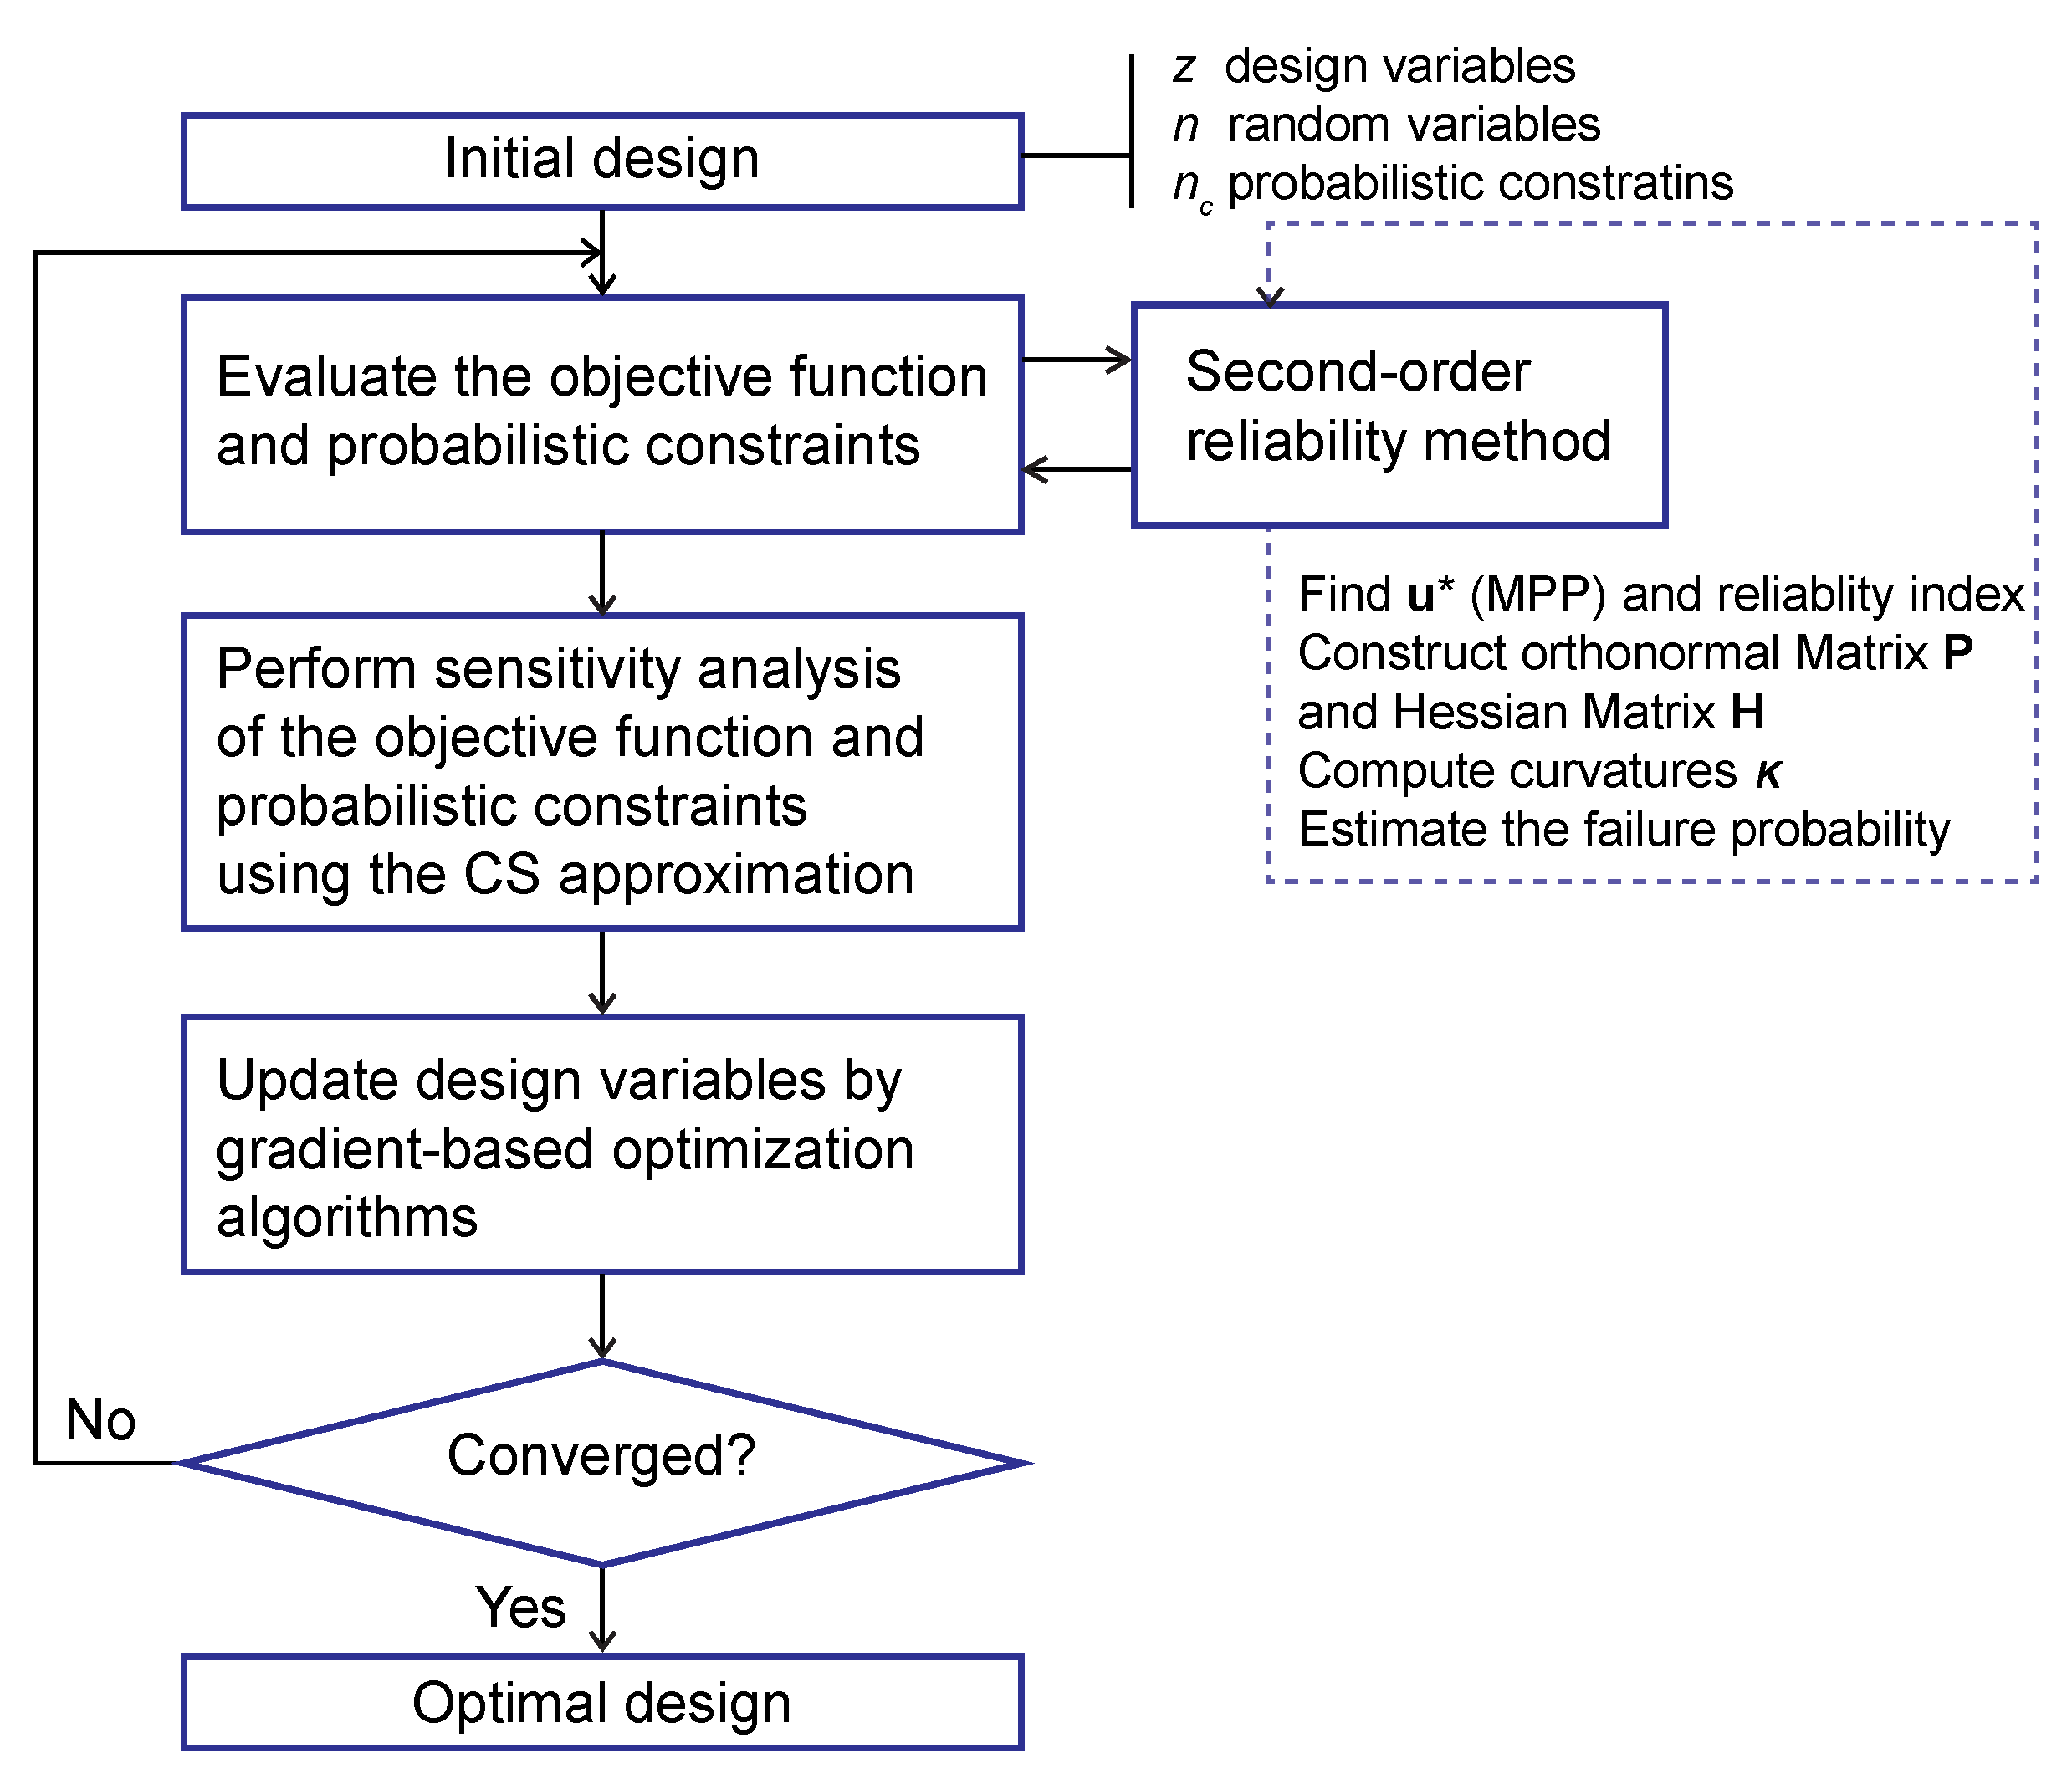
The proposed method integrates the RBDO with the CS derivative approximation (RBDO/CS) to perform the sensitivity analysis of the failure probabilities estimated using Breitung’s asymptotic approximation (SORM), and Hohenbichler and Rackwitz’s improved correction approach (SORM-i). Figure 2 illustrates the process flow of the proposed RBDO/CS−SORM/SORM-i algorithms.

5. Numerical Applications

The proposed RBDO/CS−SORM/SORM-i approaches are tested on structural optimization problems considering the uncertainty and the statistical correlation between random variables. A gradient-based optimization algorithm, specifically, the MMA [32], is employed to solve all the considered RBDO problems.

5.1. Comparative Study on the Accuracy in the Reliability Assessment and Sensitivity Analysis

The accuracy in the assessment of the failure probability and sensitivity analysis by the FORM/SORM is studied and compared to that pertaining to the results obtained using the finite difference method and MCS. Consider a nonlinear function of random variables x = ( x 1 , x 2 , x 3 ) T and deterministic variables d = ( d 1 , d 2 ) T :
f ( d , x ) = 7 x 1 x 2 x 3 ( d 1 2 d 2 2 )
Assume that the random variables follow the normal distribution with the means and standard deviations listed in Table 1. The correlation coefficients are assumed to be uniform,   ρ x i x j = 0.3   ( i , j = 1 , 2 , 3 ,   i j ) . The failure probability of the nonlinear function P f = P [ f ( d = ( 0.7 , 0.8 ) , x ) 0 ] is computed using the FORM, SORM, and SORM-i. The sensitivity analysis of the function at d = (0.7,0.8) is performed using the proposed method with the SORM and SORM-i techniques, as described in Equations (24) and (25), and the FDM with a step size of h = 10−5. The results are verified through the MCS involving 107 samples (coefficient of variance, c.o.v = 0.001). The results of the failure probability and sensitivity calculations are summarized in Table 2. The SORM estimate of the failure probability according to Breitung’s formula is Pf = 0.1332, whereas the result based on Hohenbichler and Rackwitz’s formula is Pf = 0.1291. These values closely match the “exact” result obtained through the MCS. However, the failure probability obtained using the FORM exhibits significant (more than 10%) differences. Since the failure surface has a high nonlinearity, the failure probability estimated using the FORM is less accurate than the quadratic approximation obtained through the SORM. The results of the sensitivity analysis implemented using the proposed method exhibit a satisfactory agreement with the results of the FDM, as validated through the MCS.
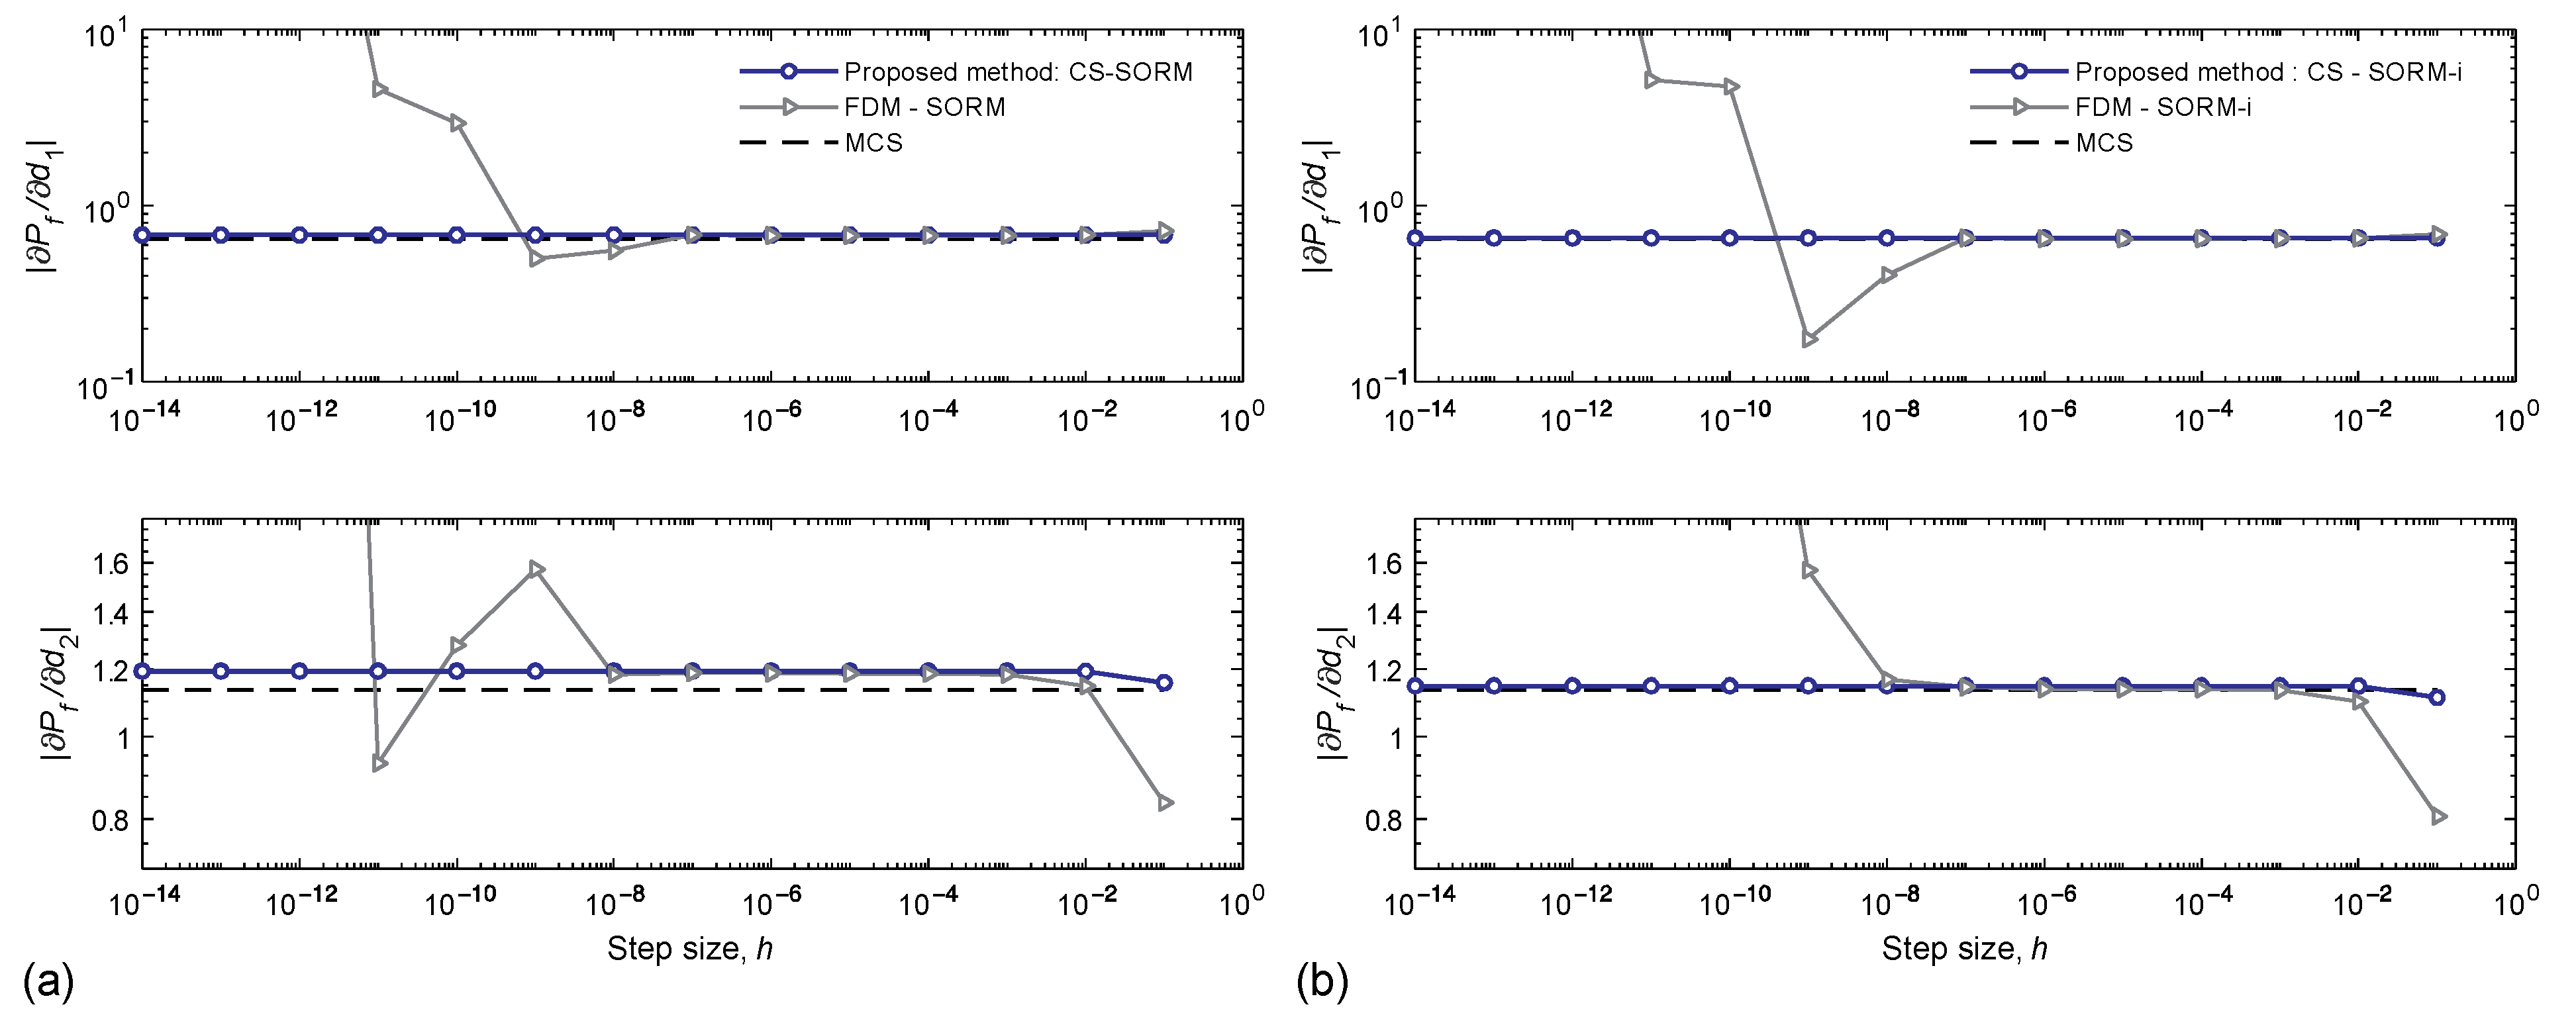
Furthermore, the impact of the step size on the sensitivity of the second-order failure probability is investigated by varying h from 10−14 to 10−1. The sensitivity analysis is performed using the proposed method integrated with Breitung’s approximation and Hohenbichler and Rackwitz’s approach, FDM, and MCS, with 107 samples. The numerical results, presented in Figure 3, show that the sensitivities obtained using the proposed methods are consistent for different step sizes. This finding indicates that a section of the step size does not affect the calculation accuracy. In contrast, the FDM breaks down as the step size becomes smaller than 10−6 or larger than 10−3. Therefore, the proposed method using the CS derivative approximation is more stable and accurate for small step sizes at which the finite difference approach cannot ensure reasonable accuracy.

5.2. RBDO of the Three-Bar Truss under the Displacement Constraints

The proposed RBDO/CS approach is applied to identify the optimal member sizes of a three-bar truss subjected to two forces, F X   and   F Y , as illustrated in Figure 4a. All the truss bars have a modulus of elasticity, E. Assume that the forces and modulus of elasticity are random variables, x = ( F X , F Y , E ) T , following the lognormal distribution. The mean values and coefficients of variance of the random variables are summarized in Table 3. The design variables are the cross-sectional areas of the bars d = ( A 1 , A 2 , A 3 ) T . The objective is to minimize the volume of the truss. The limit-state functions are defined in terms of the displacements at nodes 2 and 3, specifically, u = ( u 2 x , u 2 y , u 3 y ) T (see Figure 4b), which should not exceed the values of u ¯ = ( u ¯ 2 x , u ¯ 2 y , u ¯ 3 y ) T , as follows:
g 1 ( d , x ) = u ¯ 2 x u 2 x ( d , x ) g 2 ( d , x ) = u ¯ 2 y u 2 y ( d , x ) g 3 ( d , x ) = u ¯ 3 y u 3 y ( d , x )
where the nodal displacements, u , are obtained by solving the global equilibrium equations for the truss as:
u 2 x ( d , x ) = L E ( F X A 2 + F Y A 2 ) u 2 y ( d , x ) = L E ( F X A 2 + ( 1 A 1 + 1 A 2 + 2 2 A 3 ) F Y ) u 3 y ( d , x ) = L E · F Y A 1
The constraints are assigned on the probability that the design violates the limit-state function. The target failure probability and initial design variable, d0, are set as 0.005 for all three constraints, and 5 in2 for all members, respectively. This RBDO problem can be formulated as:
min d f ( d ) = ( A 1 + A 2 + 2 A 3 ) L s . t . P [ g i ( d , x ) 0 ] 0.005 , i = 1 , 2 , 3 d l d d u
The proposed RBDO/CS using SORM-i and deterministic design optimization (DDO) based on the mean values of the forces and modulus of elasticity with deterministic constraints are applied to this problem. The parameters used for the structural analyses and optimization process are listed in Table 4. The results of the two approaches and verification by the MCS (107 samples; c.o.v = 0.005) are presented in Table 5. The optimal volume f* of the DDO is lower than that obtained using the RBDO/CS–SORM-i because the risk of high displacements caused by the forces and modulus of elasticity is ignored. The higher volume obtained using the RBDO/CS highlights the importance of considering the uncertainties in the forces and modulus of elasticity for structures. Figure 5 shows the convergence history obtained using the DDO and RBDO/CS with SORM-i. The proposed method can find a converged solution that satisfies the probabilistic constraints.
To investigate the effect of the types of probabilistic distributions on the optimal design and to demonstrate the general applicability of the proposed method, all the random variables in the same problem are assumed to follow the normal and gamma distributions in two cases. All the other parameters such as the mean values and standard deviations of the random variables remain the same. The RBDO results shown in Figure 6 indicate that the minimum and maximum values of the objective function value are obtained when the lognormal and normal distributions are adopted, respectively. This finding highlights the importance of selecting suitable types of random variables to enable the structure design under uncertainties.

5.3. RBDO of the Cantilever Beam under the Displacement Constraint

The beam consists of three segments, each of length L. The cross-section of each segment has a hollow square form, as shown in Figure 7. The thickness of the section is t for all segments, and the length of the side of the square is di for segment i = 1,2,3. The objective of this RBDO problem is to minimize the volume of the beam under the constraint that the displacement, Δtip, at the tip is less than a prescribed value Δ0. The design variables are the cross-sectional sizes, d = (d1,d2, d3)T, and the random variables are the modulus of elasticity, magnitude of force, and thickness of the cross-section, as x = (E,F,t)T. The assumed distributions and second moments of the random variables are presented in Table 6. Based on the beam theory, the vertical displacement and its corresponding limit-state function are defined as:
g ( d , x ) = Δ 0 Δ tip ( d , x ) = Δ 0 3 F L 2 E t · i = 1 3 ( i 2 i + 1 3 ) 1 d i 3
The RBDO problem of the cantilever beam can be formulated as:
min d , μ x f ( d , μ x ) = 4 L · i = 1 3 ( d i t t 2 ) s . t . P [ g ( d , x ) 0 ] P f t d l d d u
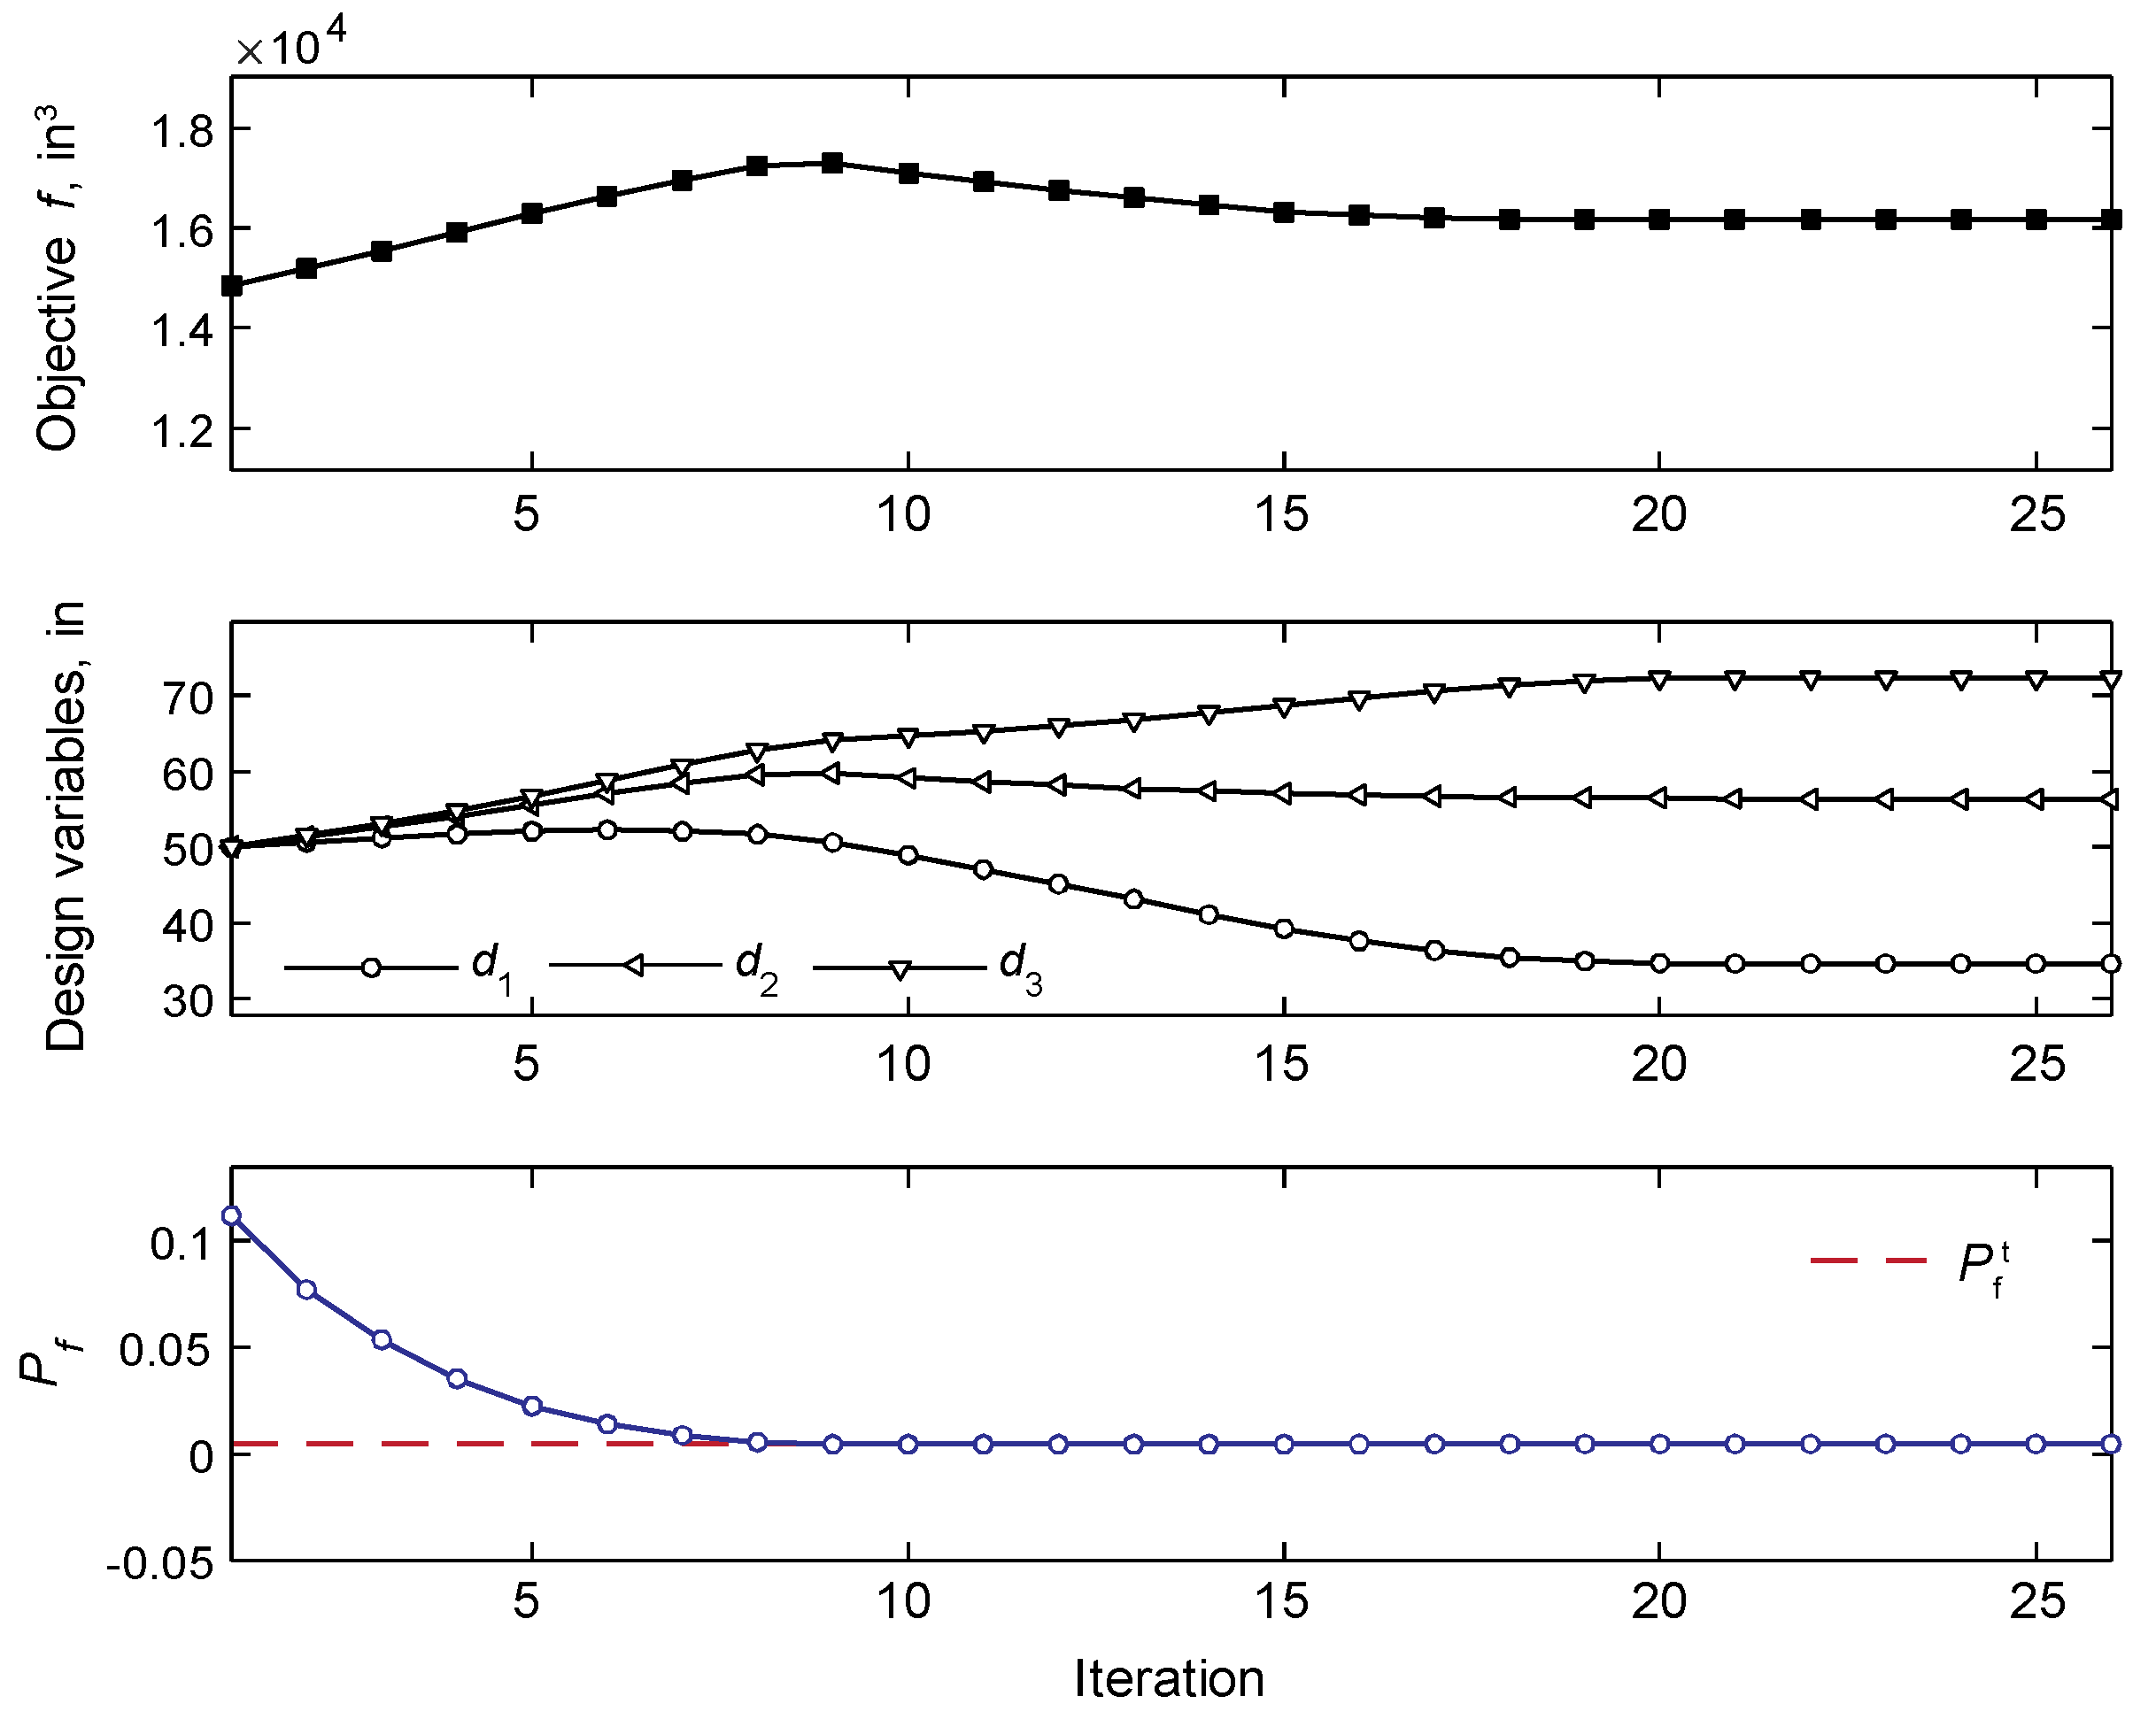
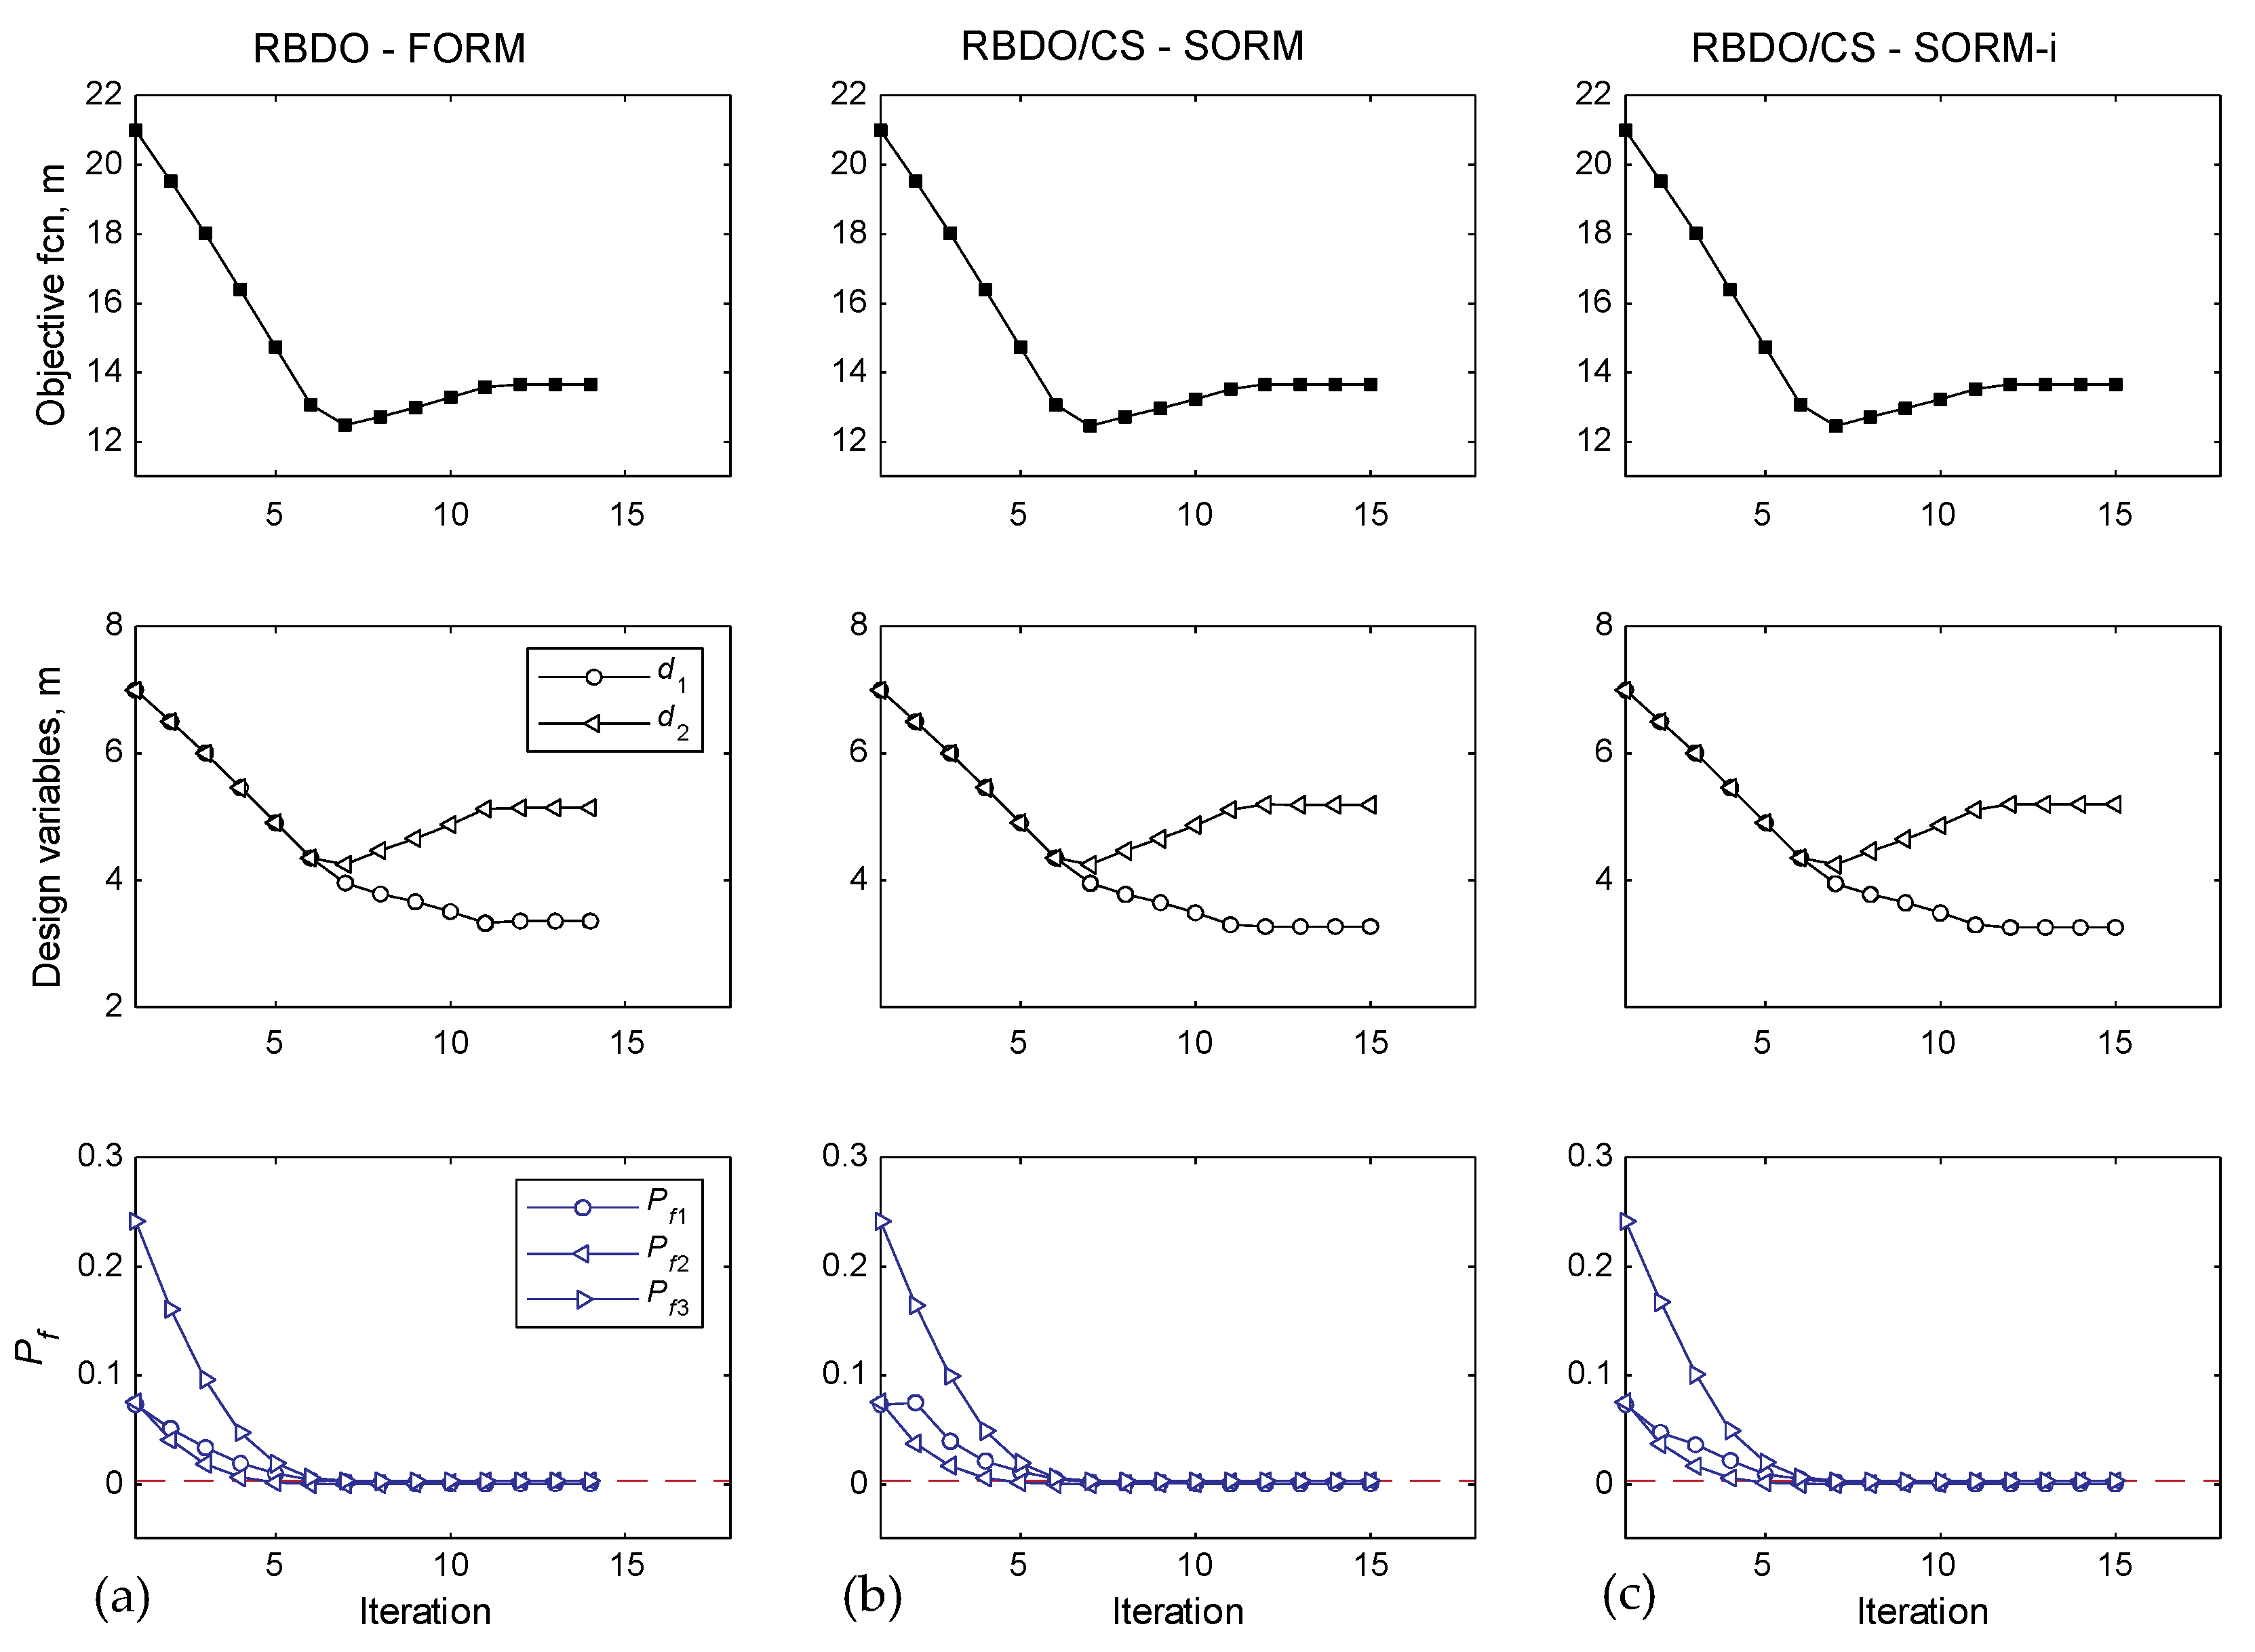
The target failure probability and parameters used in structural analysis and optimization are summarized in Table 7. Figure 8 shows the convergence history of the objective function, design variables, and failure probability obtained using the proposed RBDO/CS with the SORM-i approach. The proposed approach can promptly identify a feasible solution, satisfying the probabilistic constraint within eight iterations, and can continuously find the optimal design by minimizing the objective function until the convergence criteria are met. The results of the RBDO/CS using the SORM and SORM-i summarized in Table 8 demonstrate that the two approaches achieve similar results for the cantilever beam problem. Moreover, the optimization result indicates that strengthening the segment close to the fixed support is the most efficient approach to reduce the tip deflection.

5.4. RBDO of the Ductile Frame Structure under the Moment Strength Constraints

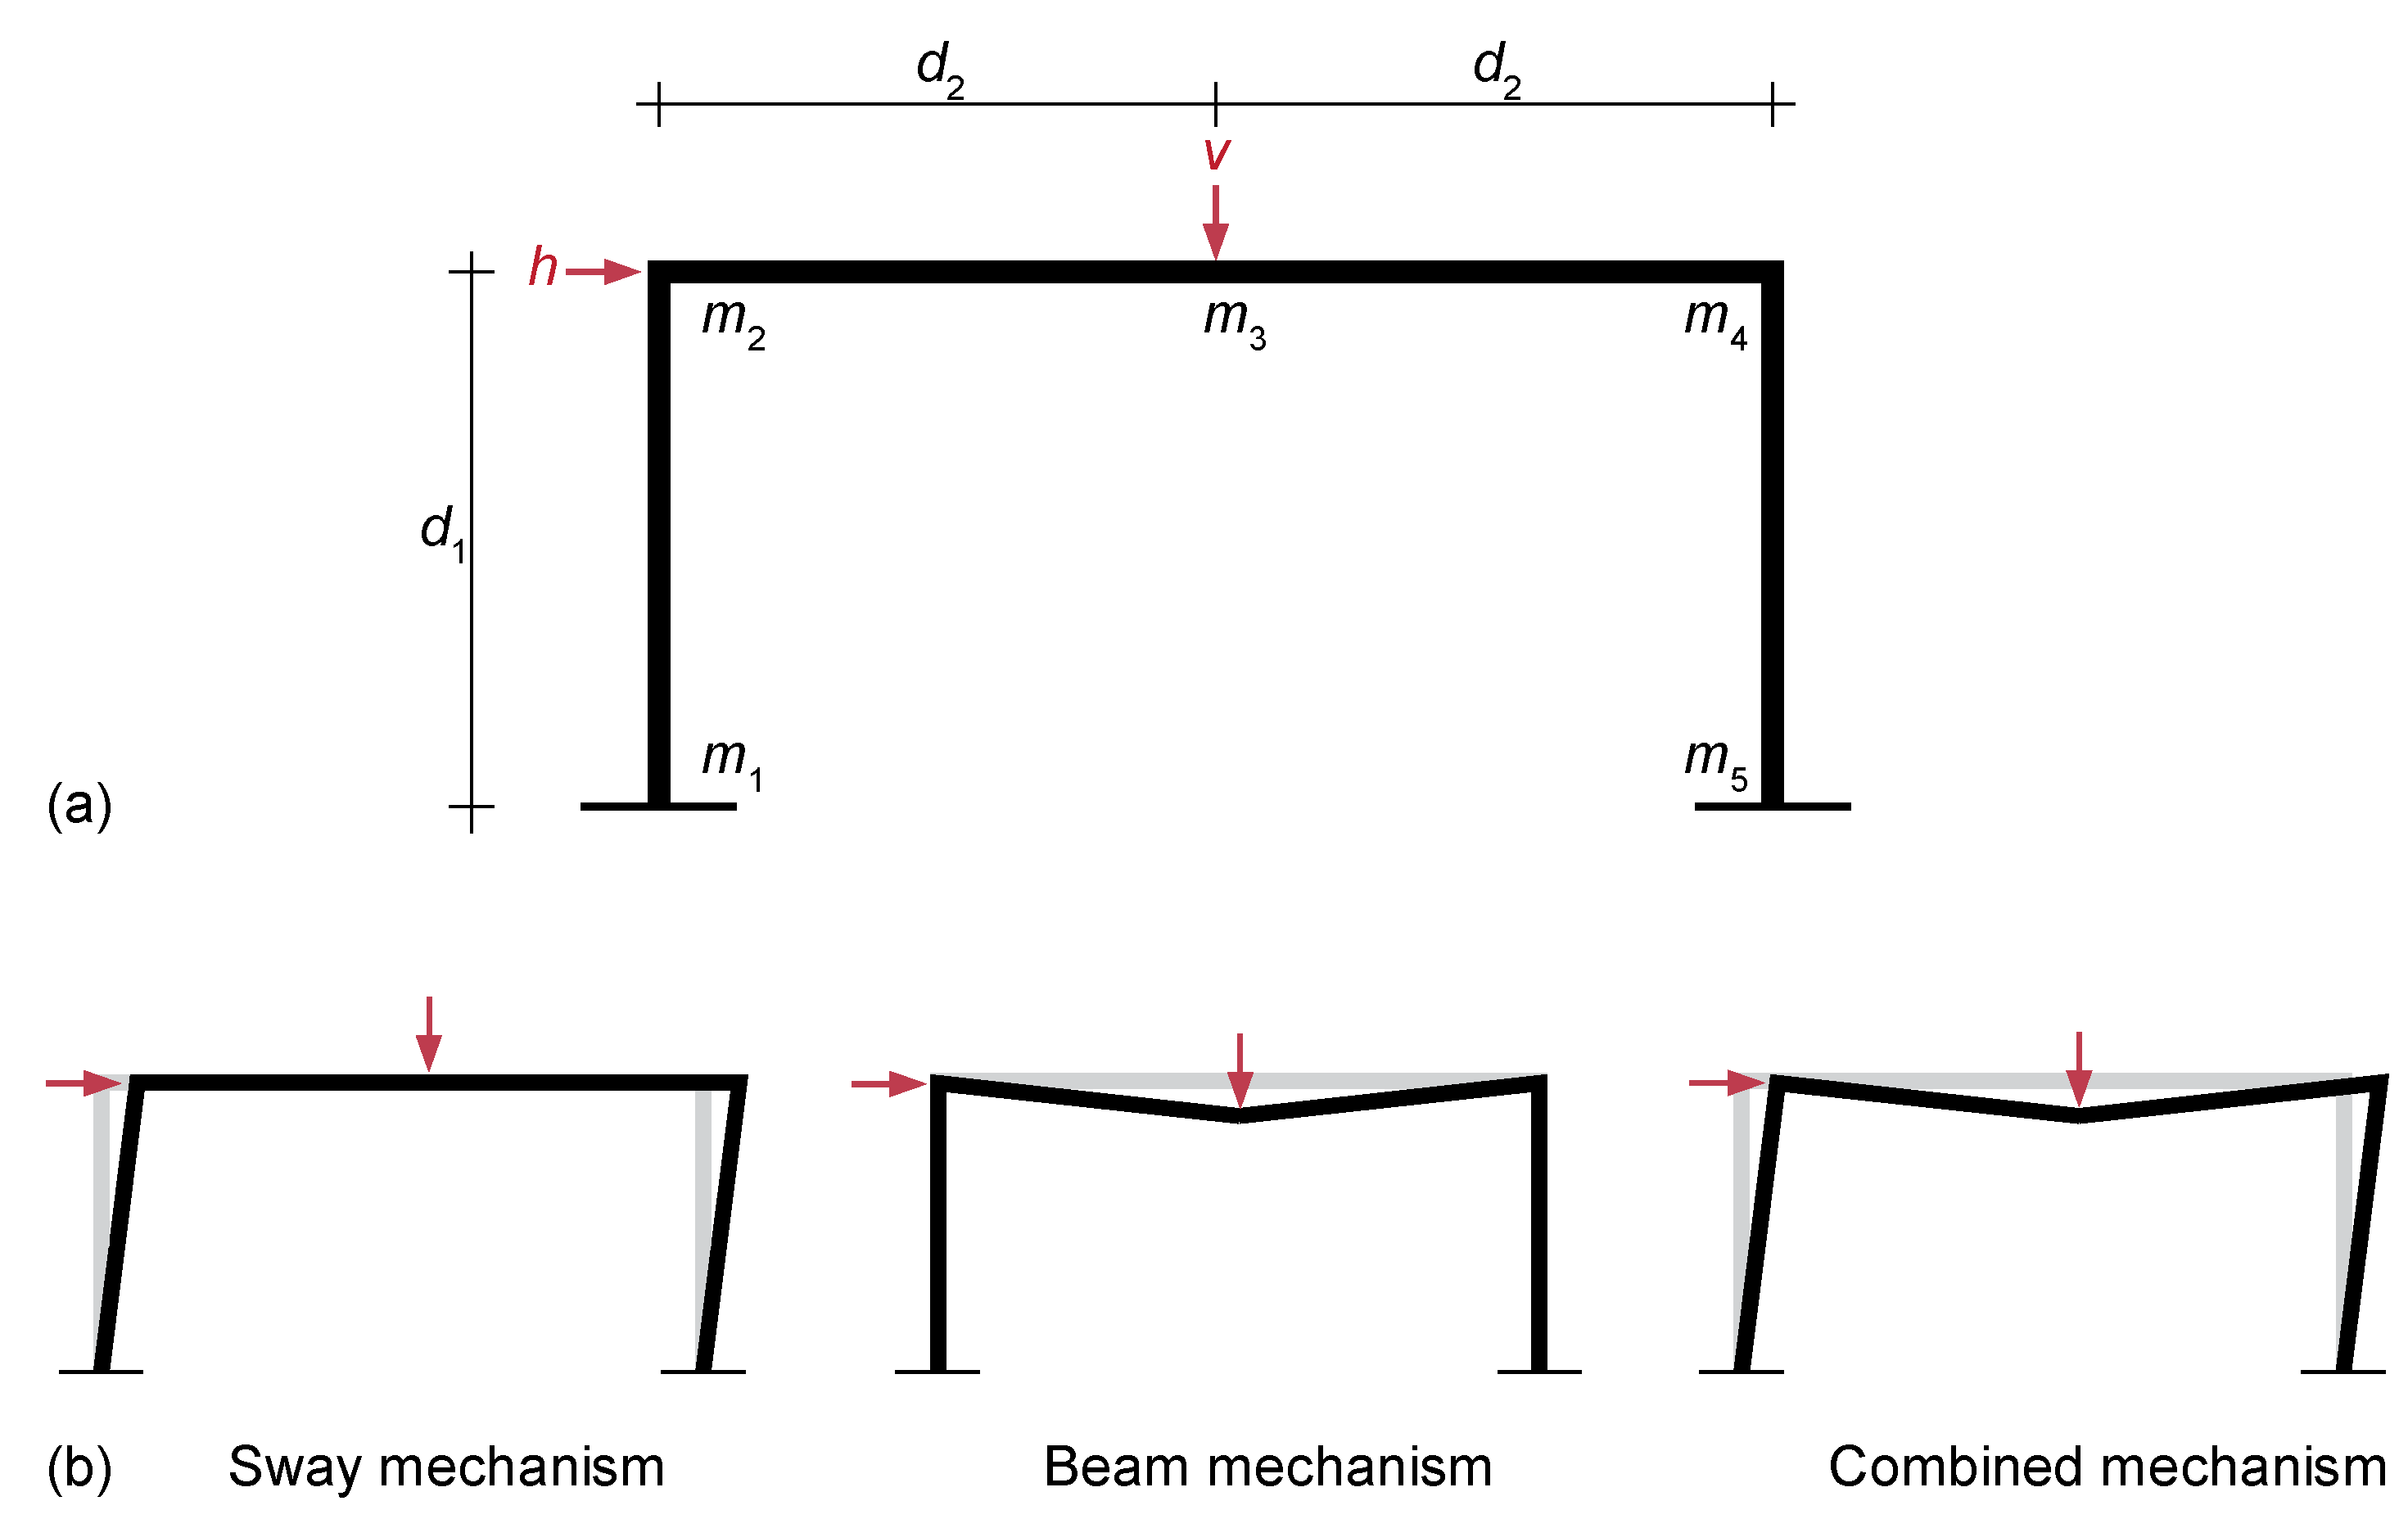
The frame structure subjected to external forces is illustrated in Figure 9a. Assume that the frame structure is constructed using ductile members having plastic moment capacities mi i = 1,…,5, at the joints. The three failure mechanisms under the externally applied forces,   h   and   v , are illustrated in Figure 9b. Assume that the external forces and moment capacities are random variables, and the height and width of the structure are the design variables. The limit-state functions related to these failure mechanisms can be defined using the principle of virtual work [6], as:
g 1 ( d , x ) = m 1 + m 2 + m 4 + m 5 h d 1 g 2 ( d , x ) = m 2 + 2 m 3 + m 4 v d 2 g 3 ( d , x ) = m 1 + 2 m 3 + 2 m 4 + m 5 h d 1 v d 2
where x = ( m 1 , m 2 , , m 5 , h , v ) T and d = ( d 1 , d 2 ) T represent the vectors of random variables and design variables (d1: height, d2: width), respectively. The considered distributions and second moments of the random variables are presented in Table 9. The objective is to determine the height and width of the structure that can maximize the span and space surrounded by the ductile frame. The constraints are assigned on the probability that the design leads to failure through the considered mechanisms. The RBDO problem of the ductile structure can be formulated as follows:
max d f ( d ) = d 1 + 2 d 2 s . t . P [ g i ( d , x ) 0 ] P f i t , i = 1 , 2 , 3 d l d d u
The initial design and parameters for the RBDO and structural analysis are summarized in Table 10. The failure probabilities of the three limit-state functions with the initial design variables, d0, are estimated using the FORM, SORM, and SORM-i. The results of the reliability analysis presented in Table 11 indicate that the limit-state function related to the combined failure mechanism has the highest failure probability compared to that of the beam and sway mechanisms. The first-order approximation of the failure probability obtained using the FORM is close to the second-order approximation provided by the SORM and SORM-i because the failure surface is linear or close to linear in the space of the random variables.
Figure 10 shows the convergence histories obtained using the proposed method RBDO/CS–SORM/SORM-i and the FORM-based RBDO approach. The three methods can promptly identify the feasible solutions satisfying the probabilistic constraints. Table 12 compares the results obtained using the proposed approaches and the RBDO using the FORM. The RBDO/CS–SORM/SORM-i approaches result in a less conservative design in terms of the width but more conservative designs in terms of the height compared to results pertaining to the FORM-based RBDO, while satisfying the same requirements pertaining to the component level reliability.
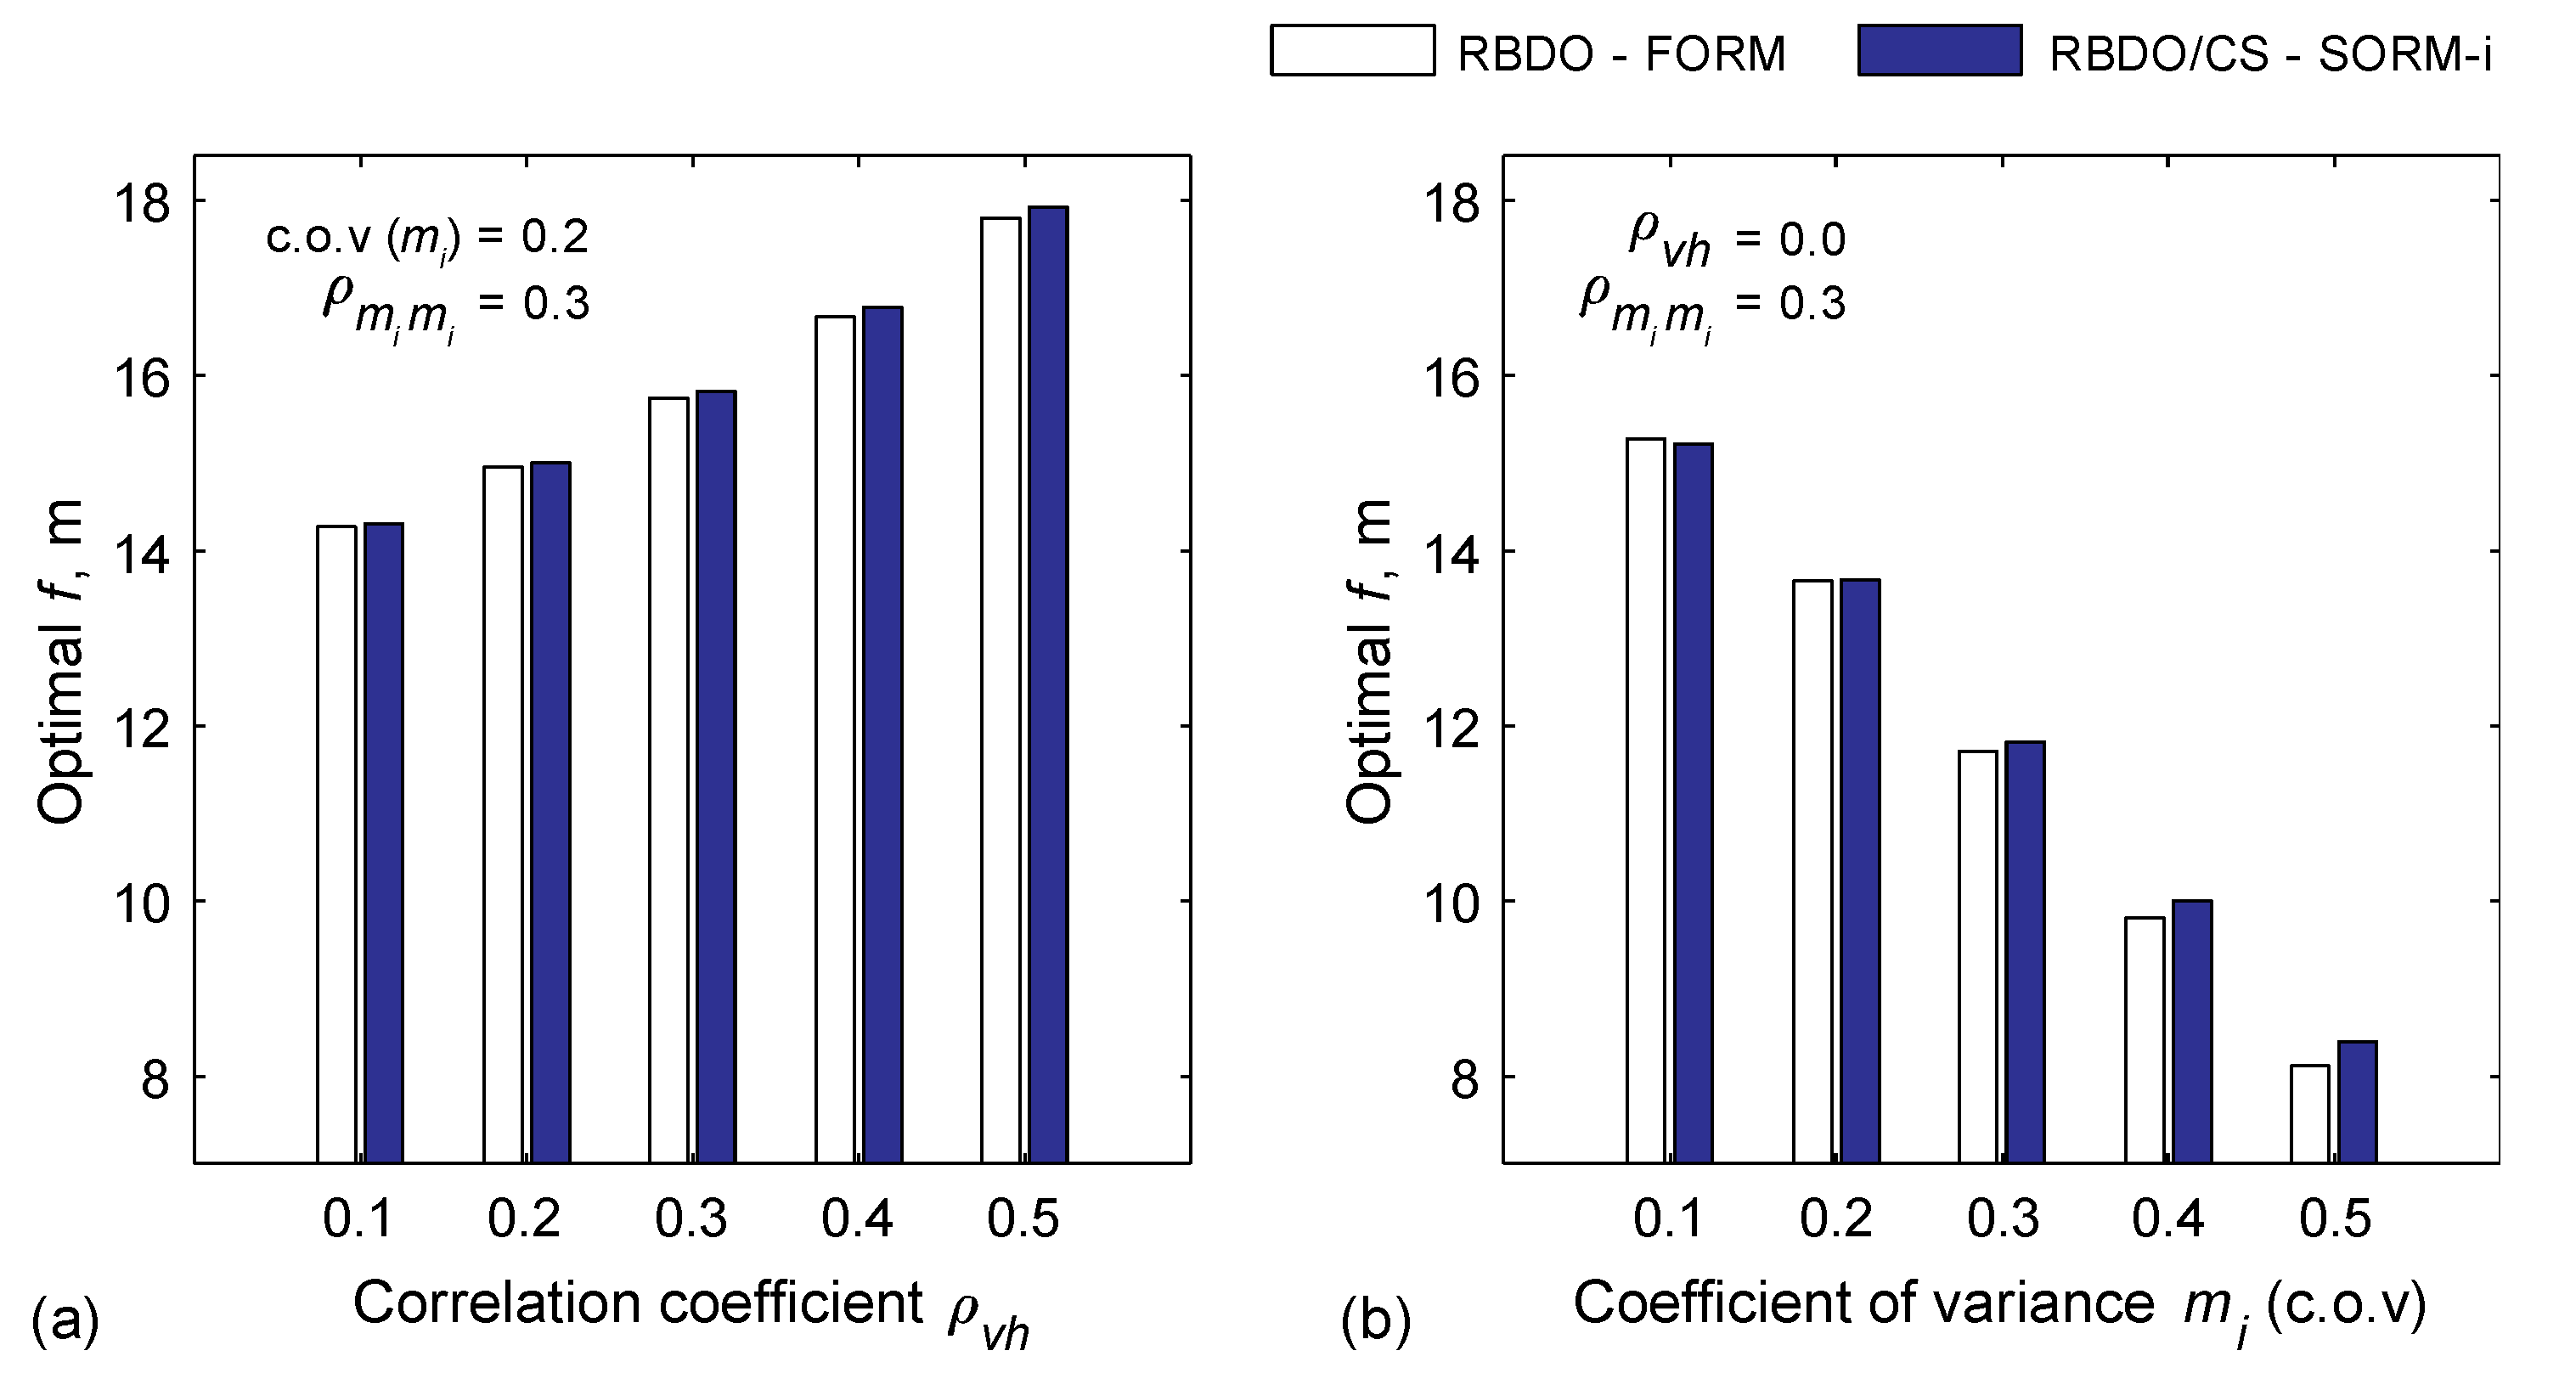
The effects of the coefficient of variations of mi i = 1, …, 5 and the correlations between the random variables v   and h on the optimal result are investigated. The RBDO problem is solved again considering the same target system probability of 0.003, while varying the coefficient of variations and correlation coefficients. For simplicity, the same types of distributions and mean values, coefficient of variations, and correlation coefficients listed in Table 9 are used, except for the varying parameters of interest. Figure 11a shows the influence of the increase in the correlation coefficients (from 0.1 to 0.5) on the optimal f. The influence of the changes in the coefficient of variations of the moment capacity random variables is illustrated in Figure 11b. A positive correlation among the random forces results in a larger height and width of the structures. When the coefficient of variance of the moment capacities increases, the optimal objective function decreases (more conservative design). This phenomenon occurs because a higher dispersion of the probability distribution of the moment capacity increases the failure probabilities of the limit-state functions.

5.5. RBDO of the Truss Cantilever Structure under the Displacement Constraints

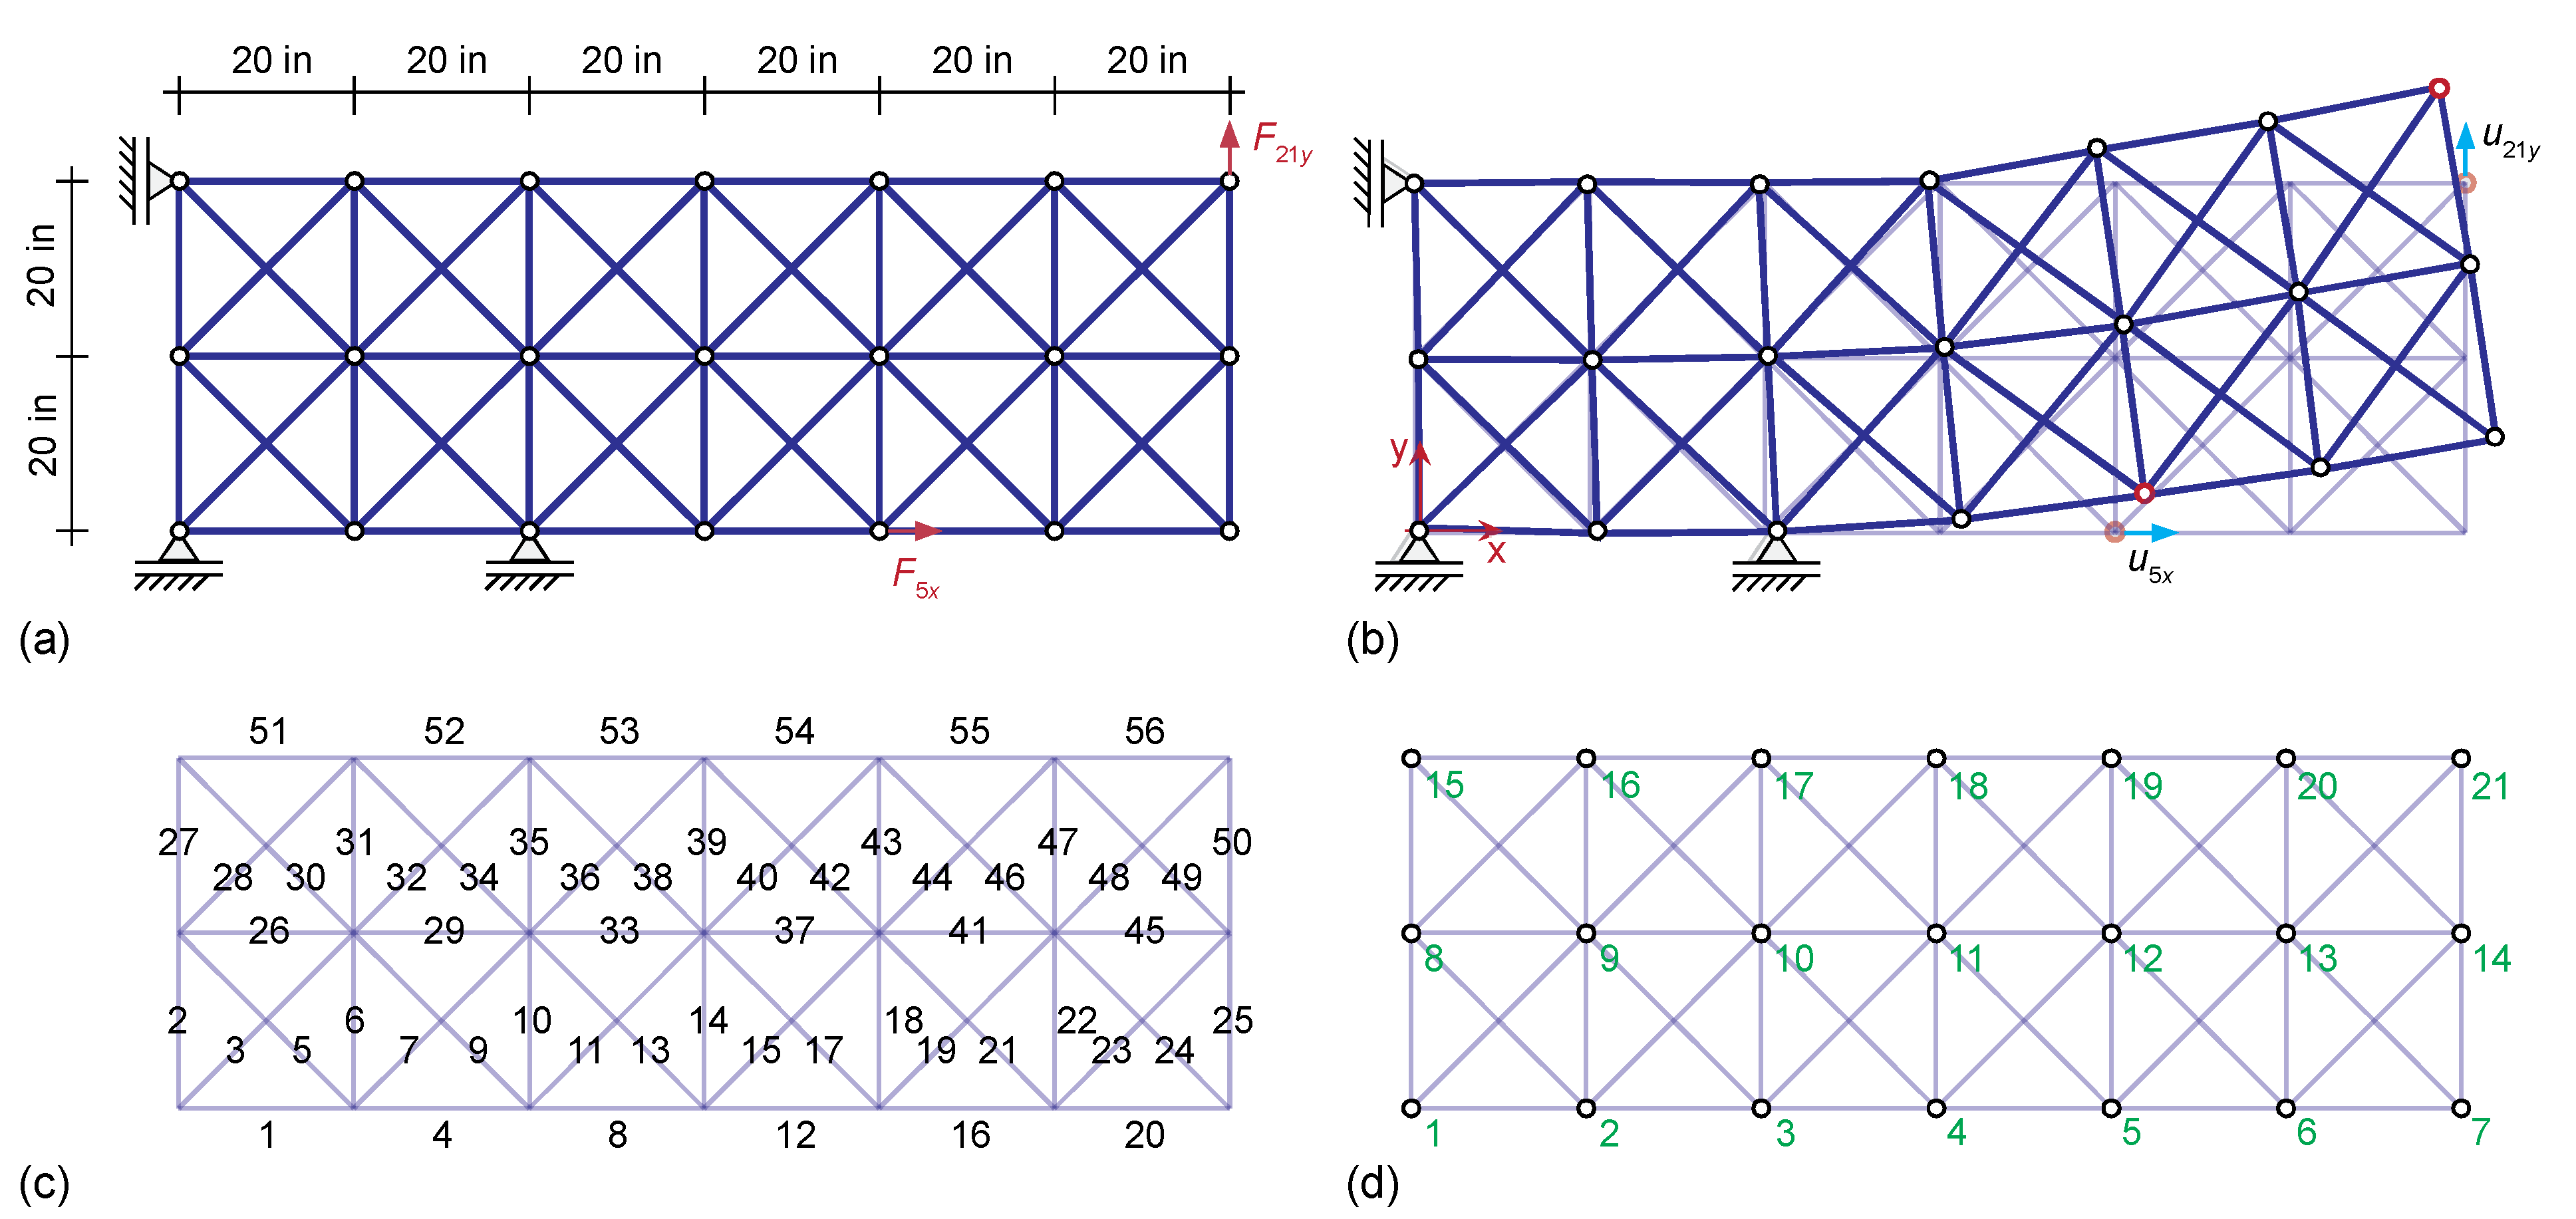
Consider a truss cantilever structure consisting of 56 bar members and 21 nodes (see Figure 12c,d). The truss cantilever structure subjected to two external forces at nodes 5 and 21 contains three-roller supports, as illustrated in Figure 12a. All of the truss members have the same modulus of elasticity, E. The objective of RBDO is to minimize the weight of the truss cantilever structure under the constraints on horizontal and vertical displacements (u5x, u21y) at nodes 5 and 21. Limit-state functions are defined as follows:
g 1 ( d , x ) = u ¯ 5 x u 5 x ( d , x ) g 2 ( d , x ) = u ¯ 21 y u 21 y ( d , x )
where u ¯ 5 x , u ¯ 21 y are the maximum allowable displacements in the horizontal and vertical direction at nodes 5 and 21 respectively, and x = (F5x,F21y,E)T and d = (A1,A2,…,A56)T represent the vectors of random variables and design variables. Table 13 provides marginal distributions, mean values, and second moments of the random variables. Parameters for reliability analysis and optimization are listed in Table 14. The RBDO problem can be written in a nested formulation as follows:
min d f ( d ) = i = 1 56 A i L i s . t . P [ g i ( d , x ) 0 ] P f i t , i = 1 , 2 with K ( d , x ) u ( d , x ) = f ( d , x ) d l d d u
where K is the global stiffness matrix of the truss cantilever structure, u is the global displacement vector, and f is the global external force vector. Note that u is an implicit function defined through the equilibrium equations K ( d , x ) u ( d , x ) = f ( d , x ) . The derivative of the displacement vector with respect to a parameter and sensitivity analysis using the CS approach is discussed in [42]. The initial displacements at nodes 5 and 21, u 5 x ( d 0 , μ x ) ,   u 21 y ( d 0 , μ x ) , with mean values of random variables as well as the uniform cross-sectional areas of 5 in2 for all members, are 0.306 in and 0.726 in, and their corresponding failure probabilities assessed using the SORM-i are 0.525 and 0.773, respectively.
Figure 13 illustrates the convergence histories of objective and probabilistic constraint functions, optimized member sizes using RBDO/CS–SORM-i, and optimized cantilever structure. The proposed method can promptly identify the solutions satisfying probabilistic constraints and then minimizes the volume. Furthermore, the single-loop approach using the Karush–Kuhn–Tucker conditions (SL–KKT) [36] with the same design and optimization parameters is utilized to compare results obtained using the proposed method. Table 15 provides the optimization results and failure probabilities of limit-state functions of the optimized design using the FORM, SORM, SORM-i, as well as MCS with 107 samples (c.o.v = 0.03). Note that the SL–KKT approach solves the system equation of KKT conditions to approximate the performance measure function [15]. Therefore, the SL–KKT and FORM-based RBDO approaches result in the optimal solution, satisfying a similar level of reliability. This study confirms that the proposed method using the SORM and SORM-i enables the efficient identification of optimal solutions, whereas the FORM-based RBDO and SL–KKT may result in the less conservative design. It is primarily due to the high nonlinearity of the limit-state functions in Equation (35).

6. Concluding Remarks

An efficient and accurate reliability-based design optimization approach was developed by integrating the second-order reliability method and CS derivative approximation. Sensitivity approaches for the failure probability computed using Breitung’s formula and Hohenbichler and Rackwitz’s formula were proposed using the CS derivative scheme. The use of the CS derivative approximation enhanced the efficiency, stability, and accuracy in computing the sensitivities of the failure probability in the RBDO approach. Additionally, the SORM enhanced the estimation of the failure probabilities. The accurate estimation of the probability and sensitivity facilitated the optimization process to more effectively identify feasible solutions by using gradient-based optimization algorithms. The first numerical example demonstrated the stability and accuracy of the proposed methods in implementing the sensitivity analysis, and the findings were validated through MCS. The rest of the numerical examples demonstrated the feasibility and efficacy of the applications of the proposed RBDO/CS–SORM/SORM-i frameworks. Future work can be aimed at realizing system reliability design optimization using the SORM, considering the statistical dependence among the component failure events, system reliability estimations, and sensitivity analysis of the probabilistic constraints at the system level against various parameters. Furthermore, the RBDO/CS–SORM/SORM-i frameworks can be applied to RBDO of structures under dynamic loads.

Funding

This research was funded by the Collaboration for Unprecedented Success and Excellence (CUSE) grant program of Syracuse University.

Institutional Review Board Statement

Not applicable.

Informed Consent Statement

Not applicable.

Conflicts of Interest

The author declares no conflict of interest.

References

  1. Ambartzumian, R.; Der Kiureghian, A.; Ohaniana, V.; Sukiasiana, H. Multinormal probability by sequential conditioned importance sampling: Theory and application. Probabilistic Eng. Mech. 1998, 13, 299–308. [Google Scholar] [CrossRef]
  2. Genz, A. Numerical Computation of Multivariate Normal Probabilities. J. Comput. Graph. Stat. 1992, 1, 141. [Google Scholar] [CrossRef]
  3. Hu, Z.; Nannapaneni, S.; Mahadevan, S. Efficient Kriging surrogate modeling approach for system reliability analysis. Artif. Intell. Eng. Des. Anal. Manuf. 2017, 31, 143–160. [Google Scholar] [CrossRef]
  4. Bichon, B.J.; McFarland, J.M.; Mahadevan, S. Efficient surrogate models for reliability analysis of systems with multiple failure modes. Reliab. Eng. Syst. Saf. 2011, 96, 1386–1395. [Google Scholar] [CrossRef]
  5. Kang, W.-H.; Song, J.; Gardoni, P. Matrix-based system reliability method and applications to bridge networks. Reliab. Eng. Syst. Saf. 2008, 93, 1584–1593. [Google Scholar] [CrossRef]
  6. Der Kiureghian, A. First- and Second-Order Reliability Methods. In Engineering Design Reliability Handbook; CRC Press: Boca Raton, FL, USA, 2005. [Google Scholar]
  7. Hohenbichler, M.; Rackwitz, R. First-order concepts in system reliability. Struct. Saf. 1982, 1, 177–188. [Google Scholar] [CrossRef]
  8. Breitung, K. Asymptotic Approximations for Multinormal Integrals. J. Eng. Mech. 1984, 110, 357–366. [Google Scholar] [CrossRef] [Green Version]
  9. Hohenbichler, M.; Rackwitz, R. Improvement Of Second Order Reliability Estimates by Importance Sampling. J. Eng. Mech. 1988, 114, 2195–2199. [Google Scholar] [CrossRef]
  10. Der Kiureghian, A.; De Stefano, M. Efficient Algorithm for Second-Order Reliability Analysis. J. Eng. Mech. 1991, 117, 2904–2923. [Google Scholar] [CrossRef]
  11. Hasofer, A.M.; Lind, N.C. Exact and Invariant Second-Moment Code Format. J. Eng. Mech. Div. 1974, 100, 111–121. [Google Scholar] [CrossRef]
  12. Zhao, Y.G.; Ono, T. A general procedure for first/second-order reliability method (FORM/SORM). Struct. Saf. 1999, 21, 95–112. [Google Scholar] [CrossRef]
  13. Shin, J.; Lee, I. Reliability analysis and reliability-based design optimization of roadway horizontal curves using a first-order reliability method. Eng. Optim. 2014, 47, 622–641. [Google Scholar] [CrossRef]
  14. Meng, Z.; Yang, D.; Zhou, H.; Yu, B. An accurate and efficient reliability-based design optimization using the second order reliability method and improved stability transformation method. Eng. Optim. 2017, 50, 749–765. [Google Scholar] [CrossRef]
  15. Tu, J.; Choi, K.; Park, Y.H. A New Study on Reliability-Based Design Optimization. J. Mech. Des. 1999, 121, 557–564. [Google Scholar] [CrossRef] [Green Version]
  16. Enevoldsen, I.; Sørensen, J. Reliability-based optimization in structural engineering. Struct. Saf. 1994, 15, 169–196. [Google Scholar] [CrossRef]
  17. Youn, B.D.; Choi, K.K.; Park, Y.H. Hybrid analysis method for reliability-based design optimization. J. Mech. Des. Trans. ASME 2003, 125, 221–232. [Google Scholar] [CrossRef]
  18. Eldred, M.; Bichon, B. Second-Order Reliability Formulations in DAKOTA/UQ. In Proceedings of the Collection of Technical Papers—AIAA/ASME/ASCE/AHS/ASC Structures, Structural Dynamics and Materials Conference, Newport, RI, USA, 1–4 May 2006; Volume 4, pp. 2897–2919. [Google Scholar]
  19. Haldar, A.; Mahadevan, S. Probability, Reliability, and Statistical Methods in Engineering Design; John Wiley & Sons, Ltd.: New York, NY, USA, 2000. [Google Scholar]
  20. Lee, J.-O.; Yang, Y.-S.; Ruy, W.-S. A comparative study on reliability-index and target-performance-based probabilistic structural design optimization. Comput. Struct. 2002, 80, 257–269. [Google Scholar] [CrossRef]
  21. Lopez, R.H.; Beck, A.T. Reliability-based design optimization strategies based on form: A review. J. Braz. Soc. Mech. Sci. 2012, 34, 506–514. [Google Scholar] [CrossRef] [Green Version]
  22. Chun, J.; Song, J.; Paulino, G.H. Parameter sensitivity of system reliability using sequential compounding method. Struct. Saf. 2015, 55, 26–36. [Google Scholar] [CrossRef]
  23. Kang, W.-H.; Song, J. Evaluation of multivariate normal integrals for general systems by sequential compounding. Struct. Saf. 2010, 32, 35–41. [Google Scholar] [CrossRef]
  24. Au, S. Reliability-based design sensitivity by efficient simulation. Comput. Struct. 2005, 83, 1048–1061. [Google Scholar] [CrossRef]
  25. Karamchandani, A.; Cornell, C. Sensitivity estimation within first and second order reliability methods. Struct. Saf. 1992, 11, 95–107. [Google Scholar] [CrossRef]
  26. Frangopol, D.M. Sensitivity of Reliability-Based Optimum Design. J. Struct. Eng. 1985, 111, 1703–1721. [Google Scholar] [CrossRef]
  27. Song, J.; Kang, W.-H.; Lee, Y.-J.; Chun, J. Structural System Reliability: Overview of Theories and Applications to Optimization. ASCE-ASME J. Risk Uncertain. Eng. Syst. Part A Civ. Eng. 2021, 7, 03121001. [Google Scholar] [CrossRef]
  28. Tvedt, L. Distribution of Quadratic Forms in Normal Space—Application to Structural Reliability. J. Eng. Mech. 1990, 116, 1183–1197. [Google Scholar] [CrossRef]
  29. Boggs, P.T.; Tolle, J.W. Sequential Quadratic Programming. Acta Numer. 1995, 4, 1–51. [Google Scholar] [CrossRef] [Green Version]
  30. Fleury, C.; Braibant, V. Structural optimization: A new dual method using mixed variables. Int. J. Numer. Methods Eng. 1986, 23, 409–428. [Google Scholar] [CrossRef]
  31. Fleury, C. Structural weight optimization by dual methods of convex programming. Int. J. Numer. Methods Eng. 1979, 14, 1761–1783. [Google Scholar] [CrossRef]
  32. Svanberg, K. The method of moving asymptotes—A new method for structural optimization. Int. J. Numer. Methods Eng. 1987, 24, 359–373. [Google Scholar] [CrossRef]
  33. Shan, S.; Wang, G.G. Reliable design space and complete single-loop reliability-based design optimization. Reliab. Eng. Syst. Saf. 2008, 93, 1218–1230. [Google Scholar] [CrossRef]
  34. Nguyen, T.H.; Song, J.; Paulino, G.H. Single-loop system reliability-based design optimization using matrix-based system reliability method: Theory and applications. J. Mech. Des. 2010, 132, 011005. [Google Scholar] [CrossRef]
  35. Chun, J.; Paulino, G.H.; Song, J. Reliability-based topology optimization by ground structure method employing a discrete filtering technique. Struct. Multidiscip. Optim. 2019, 60, 1035–1058. [Google Scholar] [CrossRef]
  36. Liang, J.; Mourelatos, Z.P.; Tu, J. A single-loop method for reliability-based design optimisation. Int. J. Prod. Dev. 2008, 5, 76. [Google Scholar] [CrossRef]
  37. Royset, J.; Der Kiureghian, A.; Polak, E. Reliability-based optimal structural design by the decoupling approach. Reliab. Eng. Syst. Saf. 2001, 73, 213–221. [Google Scholar] [CrossRef]
  38. Du, X.; Guo, J.; Beeram, H. Sequential optimization and reliability assessment for multidisciplinary systems design. Struct. Multidiscip. Optim. 2008, 35, 117–130. [Google Scholar] [CrossRef]
  39. Lyness, J.N.; Moler, C.B. Numerical Differentiation of Analytic Functions. SIAM J. Numer. Anal. 1967, 4, 202–210. [Google Scholar] [CrossRef]
  40. Squire, W.; Trapp, G. Using Complex Variables to Estimate Derivatives of Real Functions. SIAM Rev. 1998, 40, 110–112. [Google Scholar] [CrossRef] [Green Version]
  41. Martins, J.R.R.A.; Sturdza, P.; Alonso, J.J. The complex-step derivative approximation. ACM Trans. Math. Softw. 2003, 29, 245–262. [Google Scholar] [CrossRef] [Green Version]
  42. Chun, J. Reliability-Based Design Optimization of Structures Using Complex-Step Approximation with Sensitivity Analysis. Appl. Sci. 2021, 11, 4708. [Google Scholar] [CrossRef]
Figure 1. Illustration of the first-order reliability method (FORM) and second-order reliability method (SORM) for a reliability problem.
Applsci 11 05312 g001
Figure 2. Process flow of the reliability-based design optimization (RBDO) using the complex-step (CS) derivative approximation with SORM/SORM-i algorithms.
Applsci 11 05312 g002
Figure 3. Effect of the step size on the accuracy of the sensitivity analysis performed using the finite difference method (FDM), monte carlo simulation (MCS), and (a) CS–SORM and (b) CS–SORM-i.
Applsci 11 05312 g003
Figure 4. Three-bar truss: (a) Coordinate system and loading and boundary conditions, and (b) displacements at nodes 2 and 3.
Applsci 11 05312 g004
Figure 5. Convergence history of the objective function and design variables pertaining to the deterministic design optimization (DDO) and RBDO/CS–SORM-i, and failure probabilities obtained using the RBDO/CS–SORM-i framework.
Applsci 11 05312 g005
Figure 6. Results of the RBDO/CS–SORM-i framework for normal, lognormal, and gamma distribution cases. (a) Optimal volume, and (b) optimal areas.
Applsci 11 05312 g006
Figure 7. (a) Cantilever beam consisting of three segments, (b) hollow square cross-section, (c) deformation under a vertical force.
Applsci 11 05312 g007
Figure 8. Convergence history of the objective function, design variables, and probabilistic constraints (by RBDO/CS–SORM-i).
Applsci 11 05312 g008
Figure 9. (a) Ductile frame structure and (b) failure mechanisms.
Applsci 11 05312 g009
Figure 10. Convergence history of the objective function, design variables, and failure probability pertaining to the (a) RBDO–FORM, (b) RBDO/CS–SORM, and (c) RBDO/CS–SORM-i.
Applsci 11 05312 g010
Figure 11. Influence of the changes in the (a) correlation coefficients of the forces random variables, and (b) coefficients of variation of the moment capacity random variables on the FORM/SORM-i-based RBDO results.
Applsci 11 05312 g011
Figure 12. Truss cantilever structure: (a) dimension, loading, and boundary conditions, (b) deformed shape and displacements of interest, (c) truss member numbers, and (d) node numbers.
Applsci 11 05312 g012
Figure 13. Results of the proposed RBDO/CS–SORM-i: (a) Convergence histories of volume and failure probability, (b) cross-sectional areas (elements having the minimum area of 0.5 in2 are in grey), and (c) illustration of normalized cross-sectional areas of elements (elements in blue are in tension and those in red are in compression).
Applsci 11 05312 g013
Table 1. Description of the random variables for the comparative study.
Random VariablesMarginal DistributionMeanc.o.vCorrelation Coefficient
x1x2x3
x1Normal20.2510.30.3
x2Normal2.50.250.310.3
x3Normal1.50.250.30.31
Table 2. Results of the assessment of the failure probability and sensitivity analysis by the FORM, CS–SORM, CS–SORM-i, and MCS at a point d = (0.7,0.8).
Failure ProbabilityFORMSORMSORM-iMCS
Pf0.14270.13320.12910.1287
SensitivityCS–SORMFDM–SORMCS–SORM-iFDM–SORM-iMCS
P f / d 1 0.68180.67750.65530.64930.6511
P f / d 2 −1.1932−1.1859−1.1468−1.1366−1.1362
Table 3. Description of the random variables for the truss problem.
Random
Variables
Marginal
Distribution
Meanc.o.vCorrelation
FX, kipslognormal1000.2 ρ F x F y = 0.3
FY, kipslognormal1500.2
E, ksilognormal29,0000.2Independent
Table 4. Parameters for the objective and constraint functions as well as the RBDO.
u ¯ , inL, ind0, in2dl, in2du, in2Convergence Criterion
u ¯ 2 x = 0.15 100(5, 5, 5)(1, 1, 1)(50, 50, 50)10−5
u ¯ 2 y = 0.60
u ¯ 3 y = 0.15
Table 5. Results of the RBDO/CS–SORM-i framework and DDO for the three-bar truss.
RBDO/CS–SORM-iDDOMCS
Optimal f*, in33229.91609.2
Optimal d*
A1, in27.0943.448
A2, in211.1835.747
A3, in29.9164.877
Failure probability of the optimal design
Pf10.0050.00501
Pf20.0050.00502
Pf30.0050.00499
Table 6. Description of the random variables for the cantilever beam problem.
Random VariablesMarginal DistributionMeanc.o.vCorrelation
E, ksiWeibull29,0000.2Independent
F, kipsGamma20000.2Independent
t, inNormal0.50.2Independent
Table 7. Target failure probability and parameters for the reliability analysis and optimization.
P f t L, inΔ0, ind0, indl, indu, inConvergence Criterion
0.005503(50, 50, 50)(1, 1, 1)(100, 100, 100)10−3
Table 8. Results obtained using the RBDO/CS–SORM/SORM-i for the cantilever beam.
RBDO MethodOptimal d*, inf (d*, μx), in3Pf
RBDO/CS−SORM(34.5, 56.2, 72.1)16,1280.005
RBDO/CS−SORM-i(34.6, 56.4, 72.3)16,1850.005
Table 9. Description of the random variables for the ductile frame optimization problem.
Random
Variables
Marginal
Distribution
Meanc.o.vCorrelation
m1, kNmJoint lognormal1500.2 ρ m i m j = 0.3 i j
m2, kNm
m3, kNm
m4, kNm
m5, kNm
h, kNGumbel500.4Independent
v, kNGamma600.2Independent
Table 10. Target failure probability and parameters for the reliability analysis and optimization.
P f i t , i = 1 , 2 , 3 d0, mdl, mdu, mConvergence Criterion
0.003(7.0, 7.0)(1.0, 1.0)(10.0, 10.0)10−4
Table 11. Failure probabilities and reliability indices of initial limit-state functions estimated using the FORM, SORM, and SORM-i.
Limit-State FunctionFORMSORMSORM-i
βPfβPfβPf
g 1 ( d 0 , x ) 1.4520.07321.4680.07111.4720.0705
g 2 ( d 0 , x ) 1.4350.07571.4680.07101.4790.0696
g 3 ( d 0 , x ) 0.7010.24150.6880.24570.6740.2503
Table 12. Results of the RBDO/CS–SORM/SORM-i and RBDO–FORM for the ductile frame structure.
iPfiβiOptimal d*, mOptimal f*, m
RBDO–FORM10.00053.310(3.362, 5.148)13.658
20.00302.748
30.00302.748
RBDO/CS–SORM10.00033.417(3.277, 5.196)13.669
20.00302.748
30.00302.748
RBDO/CS–SORM-i10.00043.349(3.264, 5.201)13.666
20.00302.748
30.00302.748
Table 13. Description of the random variables for the cantilever truss optimization problem.
Random
Variables
Marginal
Distribution
Meanc.o.vCorrelation
F5x, kipsJoint lognormal3000.2 ρ F 5 x F 21 y = 0.3
F21y, kipsJoint lognormal1000.2
E, ksiNormal29,0000.2Independent
Table 14. Target failure probability and parameters for the reliability analysis and optimization.
P f i t u ¯ 5 x ,   in u ¯ 21 y ,   in d0, in2dl, in2du, in2Convergence Criterion
0.0050.30.65.00.550.010−3
Table 15. Results of the RBDO/CS–SORM and SORM-i, RBDO–FORM, and SL–KKT for the truss cantilever structure.
RBDO MethodOptimal f *, ft3Pfi × 10−3 of the Optimized Design
iFORMSORMSORM-iMCS
SL–KKT4.80615.005.575.675.67
25.005.595.675.72
RBDO–FORM4.88515.005.585.665.61
25.005.605.685.70
RBDO/CS–SORM4.96314.475.005.074.98
24.465.005.075.04
RBDO/CS–SORM-i4.97414.414.945.004.99
24.404.945.005.01
Publisher’s Note: MDPI stays neutral with regard to jurisdictional claims in published maps and institutional affiliations.