
Indoor Positioning Systems Can Revolutionise Digital Lean


1
MTA-PE ‘Lendulet’ Complex Systems Monitoring Research Group, Department of Process Engineering, University of Pannonia, Egyetem u. 10, POB 158, H-8200 Veszprem, Hungary
2
Department of Mechanical Engineering, School of Mechanical Engineering, Vietnam Maritime University, 484 Lach Tray St., Ngo Quyen Dist., Hai Phong City VN-18000, Vietnam
3
Sunstone-RTLS Ltd., Kevehaza u., 1-3, H-1115 Budapest, Hungary
*
Author to whom correspondence should be addressed.
Appl. Sci. 2021, 11(11), 5291; https://doi.org/10.3390/app11115291
Submission received: 12 April 2021
/
Revised: 29 May 2021
/
Accepted: 4 June 2021
/
Published: 7 June 2021
(This article belongs to the Special Issue Digital Transformation in Manufacturing Industry Ⅱ)
Abstract
:The powerful combination of lean principles and digital technologies accelerates waste identification and mitigation faster than traditional lean methods. The new digital lean (also referred to as Lean 4.0) solutions incorporate sensors and digital equipment, yielding innovative solutions that extend the reach of traditional lean tools. The tracking of flexible and configurable production systems is not as straightforward as in a simple conveyor. This paper examines how the information provided by indoor positioning systems (IPS) can be utilised in the digital transformation of flexible manufacturing. The proposed IPS-based method enriches the information sources of value stream mapping and transforms positional data into key-performance indicators used in Lean Manufacturing. The challenges of flexible and reconfigurable manufacturing require a dynamic value stream mapping. To handle this problem, a process mining-based solution has been proposed. A case study is provided to show how the proposed method can be employed for monitoring and improving manufacturing efficiency.
1. Introduction
Internal Positioning Systems provide the possibility of full traceability of manufacturing processes [1]. The main research innovation of this work is to highlight that data provided by IPS systems can be transformed into information that is valuable for Lean-based process improvement.
Lean management (LM) is a well-known concept that is widely accepted in manufacturing industries due to its effectiveness in cutting waste and improving operation performance [2,3,4,5]. The tools of Industry 4.0 that advance LM to the next level include simulation and optimization [6,7], process mining [8,9,10], data mining [11,12,13,14], data analytics [15,16], big data analysis [17,18], digital twins [19,20,21,22], machine learning [23,24], virtual reality [25,26,27,28] and cyber-physical systems (CPSs) [17,29,30,31]. An integrative model for LM and Industry 4.0 was studied in [32], which resulted in a flexible and reconfigurable manufacturing system. This brand-new generation was labelled Lean 4.0, with the promise of a different perspective of designing, operating, monitoring and optimizing manufacturing systems [33]. Lean 4.0 follows LM principles as it is built upon a strong foundation of communication and connectivity between equipment and personnel, which allows the key performance indicators (KPIs) to be automatically collected, analysed and modified according to LM measures. Recently, the Lean Industry 4.0 concept has been introduced to surpass the production context within enterprises and to cover the extended supply chain and the logistics network [34].
The tracking of flexible and configurable production systems is not as straightforward as in a simple conveyor, which provides difficulties in controlling internal inventories. The potential of digital lean is unlocked by the integration of operational technology (OT) and information technology (IT) as IT tools can improve the real-time visibility of the value stream. One of the most promising IT elements that can support Lean 4.0, is the Indoor Positioning System (IPS) [35]. This work aims to present how positional data can enrich the toolkit of Lean 4.0-based continuous development of flexible manufacturing systems.
The primary function of indoor positioning is similar to GPS, track on a map a tagged mobile unit that can be an asset or person [36]. A typical IPS is an indoor wireless positioning technology [37] that works with radio-frequency, optical, or acoustic tags and chips [38]. The IPS tags are always-active and continuously broadcast signals to beacons [37]. Tags and fixed reference points can be transmitters, receivers, or both, resulting in numerous possible technology combinations [39,40]. IPS can identify objects’ location in a closed structure, thus widely applied in an office building, hospitals, facilities, and warehouses [41].
Compared with other technology including RFID and bar-code scanner, IPS can exclude human error and systematic flexibility, and is robust to any layout change. Due to its intrinsic appropriateness for monitoring logistics units within a manufacturing facility—from items up to packages, transport units, and pallets—IPS has been widely applied in many aspects such as cycle time optimization [42], monitoring production line activities [43], logistics management [44], pallet management [45], safety management [46], and human resource monitoring [47].
This paper aims to develop a detailed guideline about how the information provided by IPS can be utilised in lean management. The proposed method is embedded into the concept of continuous development. The structured DMAIC (Define-Measure-Analyze-Improve-Control) approach utilised in Six Sigma methodology also follows the concept of the Plan–Do–Check–Act (PDCA) cycle [48], which has been proven effective in reducing non-value-added activities in the supply chains and assembly lines [49].
Value Stream Mapping (VSM) is the standard tool for recording processes and identifying waste. The challenges of flexible and reconfigurable manufacturing require a dynamic VSM (DVSM). Our key idea is to handle this problem based on process mining that has already been applied for VSM of a mixed-model assembly line [50], utilised in Six Sigma projects [51] and also used for the analysis of IPS-based data [37].
According to the structure of the paper, the main contributions are the following:
- We explored and categorized the possible situations in which the IPS can be applied in LM in Section 2. The novelty of this section is that it defines how positional data can be transformed into actionable information for LM.
- We developed a data-based framework to integrate and analyze positional and manufacturing data. As Section 3 presents, the novelty of the methodology lies in the process-mining-based identification of VSMs.
- We provided a detailed industrial case study with several KPIs to demonstrate the applicability of the proposed framework in Section 4. Our case study is based on a real manufacturing problem where the IPS monitors the day by day production, so the applicability of the developed framework is demonstrated.
2. Utilisation of Location-Information in Lean 4.0
LM is based on the continuous improvement of the processes based on the following concepts:
The proposed method is based on the assumption that the wastes, the processing and activity times, and the stocks can be automatically measured by IPS without labour- and time-consuming measurements. Table 1 shows the key performance indicators (KPIs) of the Lean concepts and their measurement possibilities. The listed measurement systems not only help organize and optimize the production procedure by easing monitoring activity with a real-time value stream but are also aligned with LM principles as well as supporting philosophies such as total quality management (TQM) and just-in-time (JIT) [61].
As Table 1 shows, RFID-based systems are particularly suitable for monitoring LM parameters [62,63]. Utilizing RFID tags within an IPS is a favourable approach in different industries, such as construction [64,65], fast-moving consumer goods production [66], automotive part manufacturing [67], automobile assembly manufacturing [68], agriculture equipment machine part manufacturing [69] and the job shop floor environment [70]. In the manufacturing shop floor environment, IPS can be beneficial as it can enrich data acquisition for LM [71] and it can be used to obtain dynamic spaghetti diagrams, which are used for the visualization of the value streams [72].
Locating sensors only may fail to comprehend the actual activities performed in the production. For example, locating sensors can signal that the product is in a workstation, but they cannot indicate whether the product is currently processed, especially in a manual processing step, while the operators were busy looking for tools or reading work instructions. Therefore, it is beneficial to use multiple sensory data for Lean 4.0, so IPS is mostly beneficial to enrich the existing information collected by other sensors and data stroded in an MES system.
3. IPS-Driven Development Framework for Lean 4.0
The previous section presented that the application of IPS in Lean 4.0 could open new possibilities if the positional data could be transformed into real-time contextualised and actionable information. This section proposes a framework that we developed for this purpose.
The proposed framework that also utilizes information sources of a typical Industry 4.0 manufacturing system is presented in Figure 1. In addition to location data, acquired data from existing technologies such as bar-code scanners, machines and event logs can be incorporated to provide a comprehensive view of the current system state. The facility information, such as the overall layout and designated area map, can provide supportive data to clarify the facility context. The information of the overall layout is added, as well as some designated areas for buffer inventory, waiting for queues, and maintenance preparation. After data processing and computation of LM KPIs, different system monitoring techniques can be applied, such as optimal material route, optimal labour assignment and JIT preparation. Process- and data mining are performed on the collected and contextualised data to explore frequent patterns of material flow and states of the production process.
We applied Gantt diagrams to analyze the periods of operations. As it will be presented in the application example there are many missing time periods in the Gantt diagram when the states of the material flow and the resources are not monitored in the MES. Based on the analysis of positional data, additional states of the manufacturing process can be defined and assigned to the product and material flows and states of the resources (e.g., temporal inventories can be defined). The explored states and additional time-stamps provided by the IPS process mining algorithms can be utilised to update VSMs. Thanks to the real-time position of the process flows, motion-based anomalies can be detected.
Figure 2 shows that proposed methodology follows the PDCA (Plan, Do, Check, Act) cycle of continuous improvement. The core element of the method is the process model (represented as a VSM in the figure) that contains all the essential information about the manufacturing process. The proposed improvement cycle continuously updates the model with the help of IPS data. The motivation is to continuously and automatically monitor the production. The developed framework can discover the real process model continuously based on the IPS data with the toolset of process mining. The resulted models are used to update the VSMs, evaluate the performance of the process by calculating the Lean KPIs. The most apparent benefit of Lean 4.0 KPIs are the readiness of decision making and optimisation based on real-time information about the manufacturing system.
4. Application to the Monitoring of a Flexible Manufacturing Process
In this section, a manufacturing use case is represented to prove the applicability of the proposed methodology. We introduce the studied production process and the purpose of the continuous improvement project and show the details of the application of IPS.
4.1. Purpose of the Project
The presented study focuses on the monitoring of CNC machines and assembly stations used to produce metal parts for an automotive company. There are five CNC machines, one assembly station, one assembly line and a packaging station. The orders (tasks) move along different paths during the production, depending on the production plan. The project aims to reduce transportation waste, identify the waiting and queueing times, and monitor the cycle times. Due to the changing number and variations of product families, this process is not a one-time activity. One small change in the product architecture can cause changes in the assembly sequence, which can lead to significant performance losses.
Traditionally, LM masters will detect these 3M (Muda—Mura—Muri) via eye observation, then conduct re-calculation and re-arrangement to find a new optimal point. By using the IPS, the manufacturing activities can be easily tracked and automatized. The positional data from the moving carts are analyzed to identify whether they are not in a pre-defined value-added area (like assembly stations). The extracted cycle times are used to find the potential wastes of human works (changing times, manual work) and focus on these areas, such as defining a standardized digital work instruction that depends on the current position information of the semi-finished product.
4.2. Description of the Applied IPS
The hardware architecture of the IPS is illustrated in Figure 3. The applied ultra-wide band (UWB)-based real-time locating system (RTLS) uses active tags and anchors for localization. There are 15 anchors installed on the shop floor, which is nearly 2000 m. The anchors are connected to two central units. The raw sensory data are transferred into the position calculation server. The calculation of the position is based on the TDoA (Time Difference Of Arrival) method and applies a Kalman filter to obtain more accurate information. The IPS is installed to track carts with the shop floor’s semi-finished products. These carts are moving (manually) between the workstation and the IPS sends information to the MES if the actual cart with the defined (paired) product has arrived at the actual station. There are 40 carts, every cart has a dedicated IPS tag. Each time a semi-finished product was put on a cart, the operator paired the order number with the tag ID with a timestamp. The positional data accuracy is around 0.5 m, which is sufficient to obtain an accurate spaghetti diagram (Figure 4a) from each produced order. The shop floor with a tracked motion of one product is shown in Figure 4a. As this figure illustrates, the analysis of the positional data allows the identification of the temporary stations and motion paths.
The proposed lean analysis was performed on the production data from MES and positional data (where the sample time is three seconds) from IPS. The process-flow was discovered with a process mining algorithm based on the MES data. We used the Disco software for process mining, and in the following subsection, the results are shown. The positional data are used to calculate the loss of process. We analyzed the transportation path, where we calculate the transportation periods for orders and the hidden temporary storage and queuing times are identified.
The collected positional data contain the tag IDs with the x–y position according to the predefined coordinate system (fitted for the shop floor layout). These data are updated every three seconds (the sample time can be set—maximum 1 kHz) to ensure most of the carts’ motion is covered in this production scenario. The factory layout with the zone (workstation) definitions is provided by the rectangles (Figure 4a) to match the activity order. This layout is elaborated based on the facility’s overall layout, and with the designated area represented where the production activities are performed. These areas are determined with the hardware’s capability, and the system can detect the corresponding processes that are occurring. The entering and exiting times define the time that a product spends on one process step. The information (resources, produced pieces, quality issues) for every Task ID, which includes the Start time when the tag entered the zone (Workplace), is stored in the MES.
4.3. Calculation of the IPS-Based Indicators
This section shows how the data from MES and IPS can be utilised based on the relevant KPIs.
The IPS sends signals to the MES when the actual cart arrives at the pre-defined station. The applied process mining algorithm determines the process model of the production flow. An illustrative result is presented in Figure 5. Due to the flexibility of the manufacturing process, the extracted model is not trivial and varies over time; therefore, the model is continuously updated based on the real-time positional data.
The discovered process flows serve as input for work standardisation projects. According to the most frequently conducted steps, a pattern of main material flow is recognized in Figure 5a, where the main workstations and machines are highlighted in blue. We note that there is no leading process flow. Along with the material flow map, the average cycle times are recorded, as illustrated in Figure 5b. The thickness of the arrows represent the time delay between the two stations. The result can be compared to the manufacturing processes standard times so that non-conformance stands out. The main process mining-based KPIs are summarized in Table 2.
A Gantt diagram has been developed to further study the reason for the long transition times of the semi-finished products (see Figure 6a). The rows of the Gantt chart show the orders (Tasks) and colours represent the workstations. We defined the Unknown station to show the period where we have no data (from MES). These periods are denoted in Figure 6a with red lanes and these periods could be the source of the long time period between two stations on the results of process mining and could be the hidden wastes of the manufacturing process. The Unknown period is the of the studied time period.
In the next step, we discovered the status of thee Unknown periods based on the positional data. We analysed 22 days of production data for this purpose. Based on the positional data from IPS, the velocity is calculated to determine the Waste of transportation periods. An example for that period is shown in Figure 4b with the blue stars. Temporary storage is the positions that are closely located out of the pre-defined zones (workstations). When the carts with the products are located in a pre-defined zone (but it is not logged to the MES, so it is not under production), we assumed these products are queueing before the actual workstation (see the orange points on Figure 4b). Figure 6b shows the new Gannt chart with three more defined stations related to queueing, temporary storage, and transportation.
4.4. Discussion, Utilisation of the Results
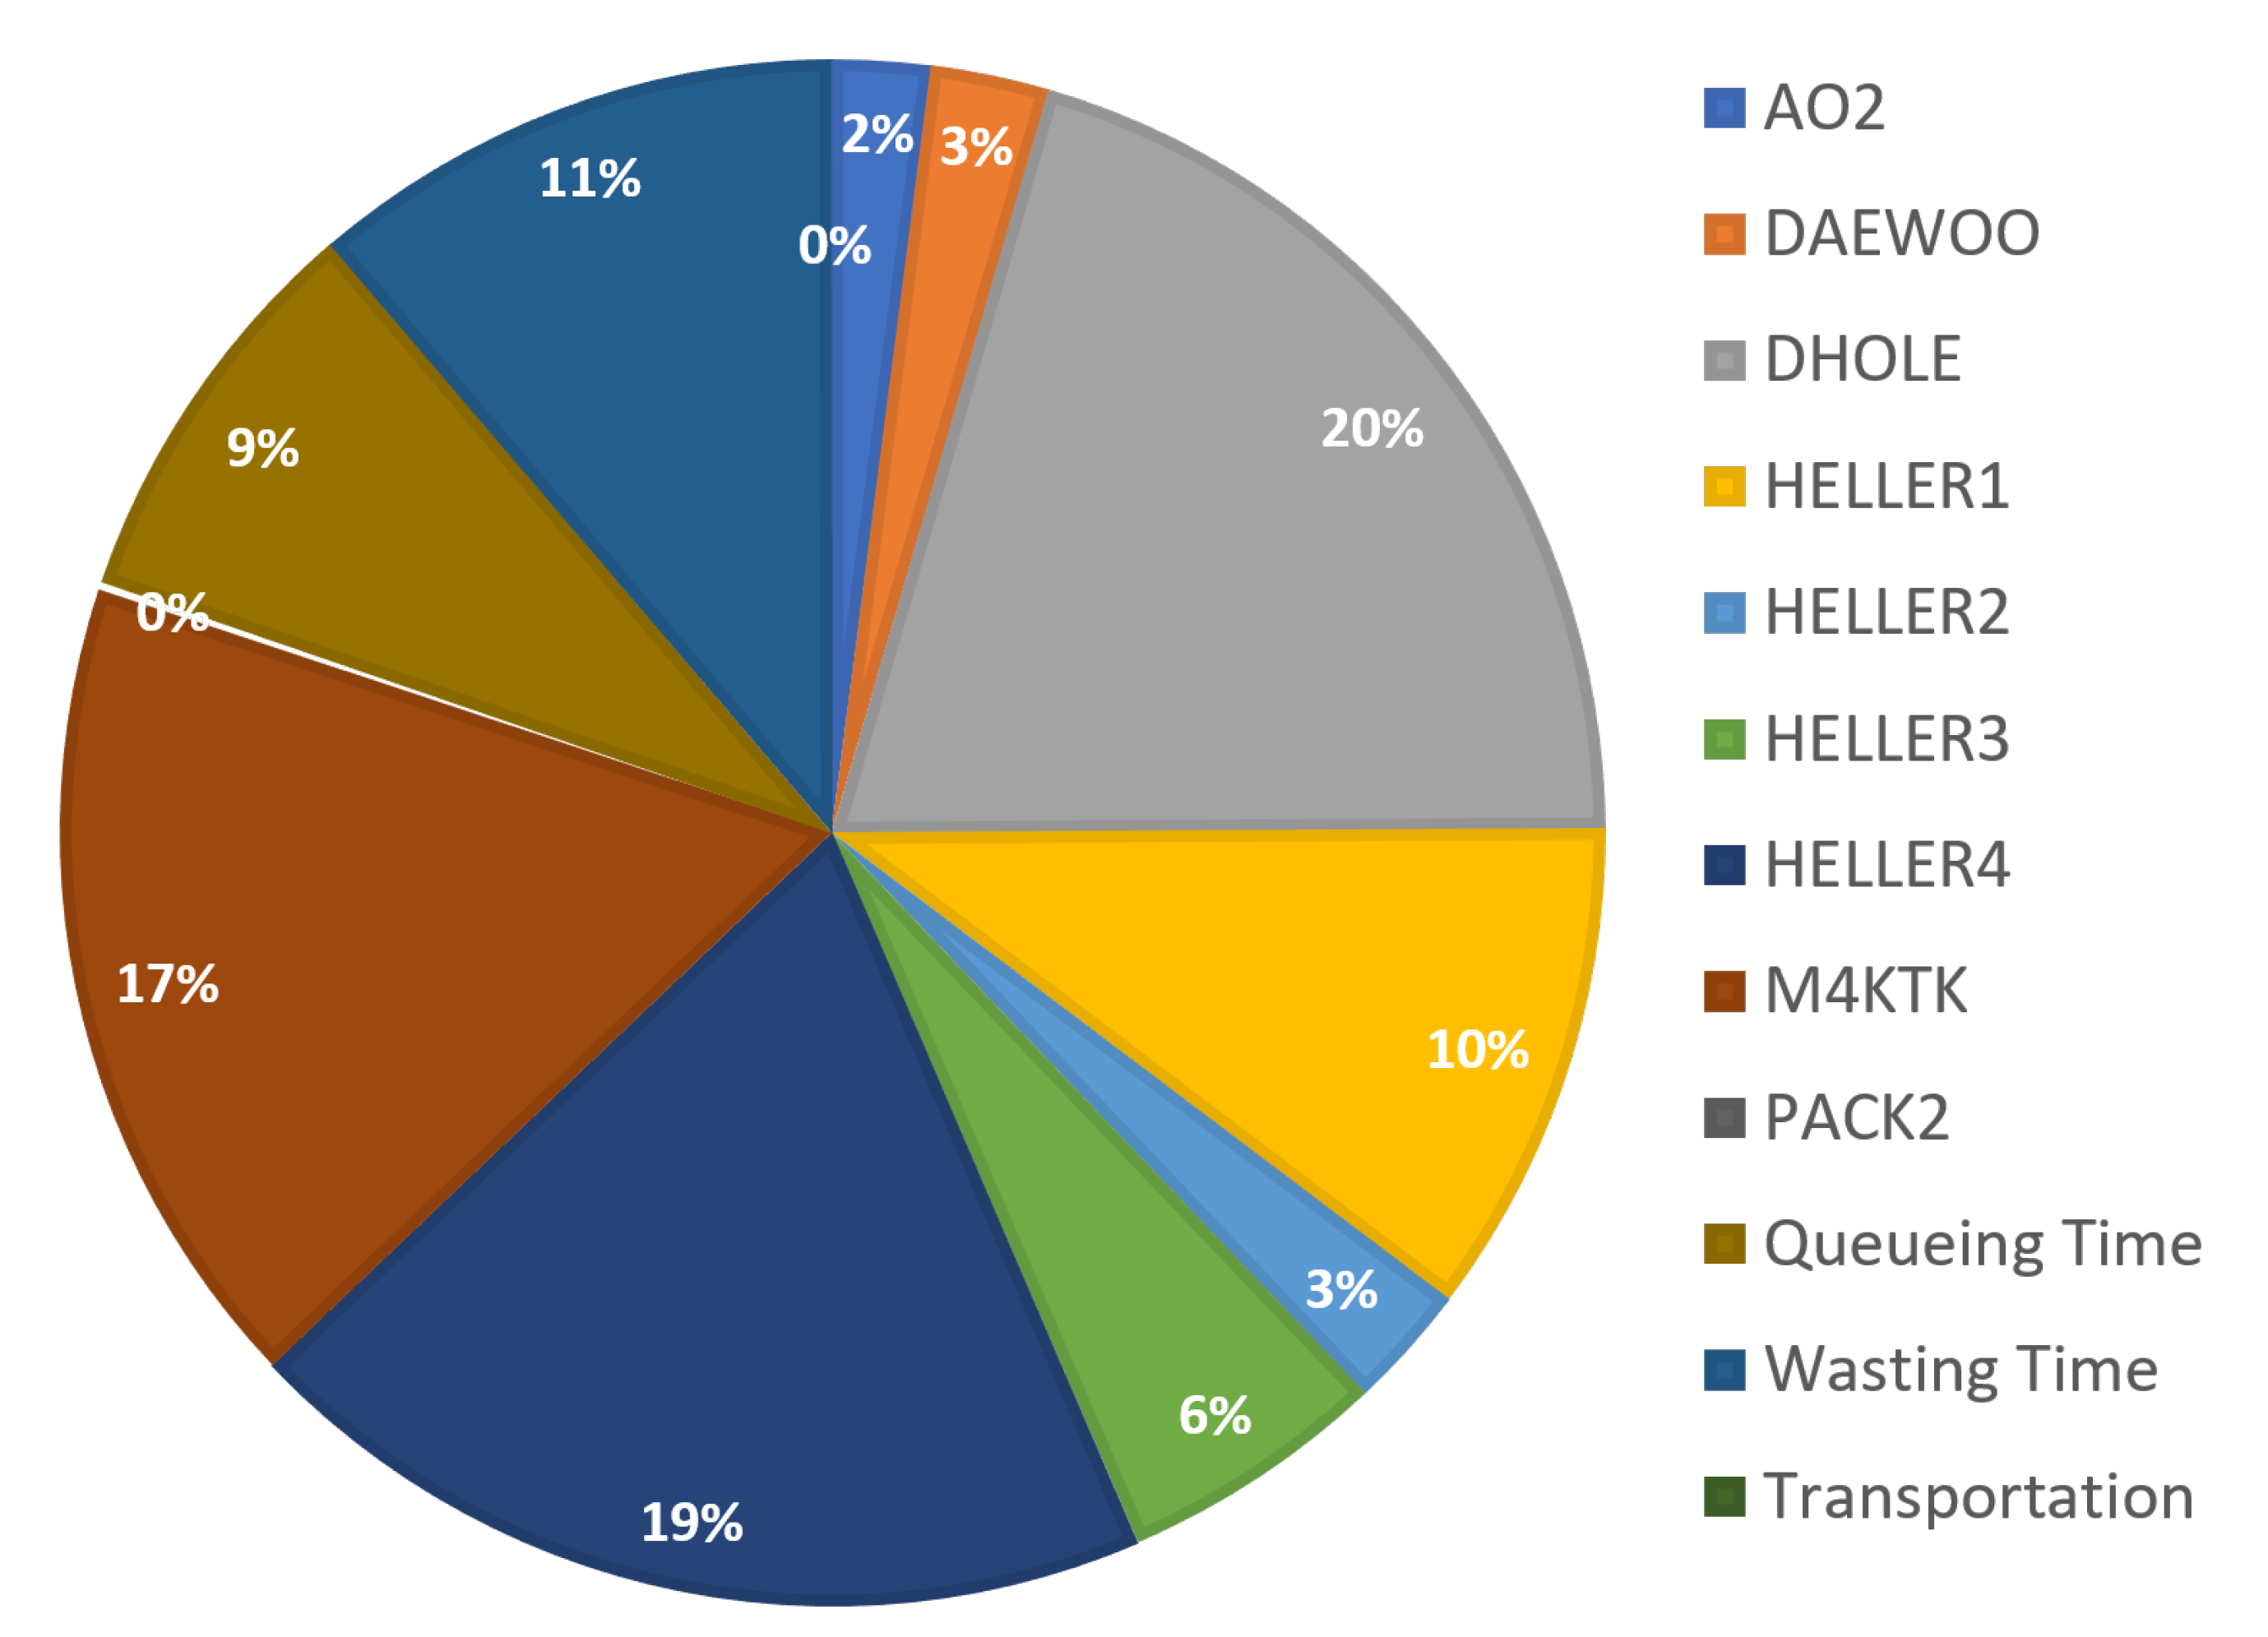
The results are shown in Figure 7, where we note that the Queueing time and Wasting time are almost of the analysed manufacturing time. Table 2 summarises these times according to the stations and shows that the AO2 workplace has the most significant queuing time, so the continuous improvement project should focus on that first.
The IPS serves as a non-stop monitoring system that contributes to the everyday work of Lean specialists. As a first step, an alarm system can be set up at each workstation to notify if the working or waiting times in that station exceed their predefined limits; so the line advisor can take required supportive action on time.
The integrated application IPS and process mining supports the redesign of the layout thanks to its ability to detect hidden stations and states of the process.
5. Conclusions
In this paper, the possible applications of indoor positioning systems in Lean 4.0 are explored. The proposed IPS incorporates different kinds of sensors to acquire not only positional data but also other data such as vibration, which enables them to recognize motion and transportation activities. Along with this IPS architecture, the traditional set of Lean KPIs are redefined and redesigned to be derived automatically from IPS-based data. The process mining-based analysis of the collected data can provide insight into the key factors that determine the productivity and efficiency of production systems.
The proposed method of data acquisition enables further system optimization, which assists managers in monitoring their system effortlessly and in a stress-free manner. In the trend of Lean 4.0, the use of such a system is expected to soon be dominant due to its hardware maturity, as well as the readiness of data and the need from the manufacturer. The framework for process analysis can provide the basis for further optimization and enhancement of human–machine activity cooperation, which will constitute our future research. A case study is conducted in a mechanical manufacturing firm to show the possible output of Lean 4.0 KPIs, and improvements can be made based on activity data.
The accuracy of the result from the system is much dependent on the hardware characteristics. The most frequent error occurs when the location sensor cannot recognize which area is between two adjacent ones. Due to the current technology limitation, the defined space of workstations needs to be separated with a distinct distance. Fortunately, with process mining tools, meaningless noise and error can be excluded. However, the authors believe that this problem can be mitigated soon, with advancements in the new hardware system.
According to the intensive use of data in monitoring a smart factory, one particular concern is personal privacy. When a tag is attached to an operator, then every movement can be tracked. To ensure personal privacy, the tag is only active in the production zones.
Besides, with a large amount of operation data and production monitoring parameters from the system, the management dashboard needs to be discussed and adjusted at a managers’ meeting, not by any single person. As the system can improve the facility operation—through line speed changes, human assignment and dynamic line balancing—it is unwise to teach it in the wrong way. The consultation of an LM expert in setting the KPIs and allowable adjustment is necessary.
We believe that the proposed framework and the presented results provide a practical starting point for lean management practitioners and can initiate further research projects.
Author Contributions
Conceptualization, T.-A.T., Supervision, J.A.; Code development: T.R.; Writing—original draft preparation, T.-A.T. and T.R.; funding acquisition, J.A. All authors have read and agreed to the published version of the manuscript.
Funding
This work was supported by the TKP2020-NKA-10 project financed under the 2020-4.1.1-TKP2020 Thematic Excellence Programme by the National Research and by the 2019-1.1.1-PIACI-KFI-2019-00312 project (Mobilized collaborative robot-based development of a modular Industry 4.0 production system with quality management functions).
Institutional Review Board Statement
Not applicable.
Informed Consent Statement
Not applicable.
Conflicts of Interest
The authors declare no conflict of interest.
References
- Rácz-Szabó, A.; Ruppert, T.; Bántay, L.; Löcklin, A.; Jakab, L.; Abonyi, J. Real-Time Locating System in Production Management. Sensors 2020, 20, 6766. [Google Scholar] [CrossRef] [PubMed]
- Liker, J.K. The Toyota Way: 14 Management Principles from the World’s Greatest Manufacturer, 1st ed.; Mc Graw Hill: New York, NY, USA, 2004. [Google Scholar]
- Womack, J.P.; Jones, D.T.; Roos, D. The Machine that Changed the World; 2007. Available online: https://en.wikipedia.org/wiki/The_Machine_That_Changed_the_World_(book) (accessed on 4 June 2021).
- Holweg, M. The genealogy of lean production. J. Oper. Manag. 2007, 25, 420–437. [Google Scholar] [CrossRef]
- Katayama, H. Legend and Future Horizon of Lean Concept and Technology. Procedia Manuf. 2017, 11, 1093–1101. [Google Scholar] [CrossRef]
- Uriarte, A.G.; Ng, A.H.; Moris, M.U. Supporting the lean journey with simulation and optimization in the context of Industry 4.0. Procedia Manuf. 2018, 25, 586–593. [Google Scholar] [CrossRef]
- Beregi, R.; Szaller, Á.; Kádár, B. Synergy of multi-modelling for process control. IFAC-PapersOnLine 2018, 51, 1023–1028. [Google Scholar] [CrossRef]
- Choueiri, A.C.; Sato, D.M.V.; Scalabrin, E.E.; Santos, E.A.P. An extended model for remaining time prediction in manufacturing systems using process mining. J. Manuf. Syst. 2020, 56, 188–201. [Google Scholar] [CrossRef]
- Jimenez, J.F.; Zambrano-Rey, G.; Aguirre, S.; Trentesaux, D. Using process-mining for understating the emergence of self-organizing manufacturing systems. IFAC-PapersOnLine 2018, 51, 1618–1623. [Google Scholar] [CrossRef]
- Lee, S.K.; Kim, B.; Huh, M.; Cho, S.; Park, S.; Lee, D. Mining transportation logs for understanding the after-assembly block manufacturing process in the shipbuilding industry. Expert Syst. Appl. 2013, 40, 83–95. [Google Scholar] [CrossRef]
- Kwak, D.S.; Kim, K.J. A data mining approach considering missing values for the optimization of semiconductor-manufacturing processes. Expert Syst. Appl. 2012, 39, 2590–2596. [Google Scholar] [CrossRef]
- Guo, Y.; Wang, N.; Xu, Z.Y.; Wu, K. The internet of things-based decision support system for information processing in intelligent manufacturing using data mining technology. Mech. Syst. Signal Process. 2020, 142, 106630. [Google Scholar] [CrossRef]
- Vazan, P.; Janikova, D.; Tanuska, P.; Kebisek, M.; Cervenanska, Z. Using data mining methods for manufacturing process control. IFAC-PapersOnLine 2017, 50, 6178–6183. [Google Scholar] [CrossRef]
- Charaniya, S.; Le, H.; Rangwala, H.; Mills, K.; Johnson, K.; Karypis, G.; Hu, W.S. Mining manufacturing data for discovery of high productivity process characteristics. J. Biotechnol. 2010, 147, 186–197. [Google Scholar] [CrossRef]
- Buer, S.V.; Fragapane, G.I.; Strandhagen, J.O. The Data-Driven Process Improvement Cycle: Using Digitalization for Continuous Improvement. IFAC-PapersOnLine 2018, 51, 1035–1040. [Google Scholar] [CrossRef]
- Buer, S.V.; Strandhagen, J.O.; Chan, F.T.S. The link between Industry 4.0 and lean manufacturing: Mapping current research and establishing a research agenda. Int. J. Prod. Res. 2018, 56, 2924–2940. [Google Scholar] [CrossRef] [Green Version]
- Dombrowski, U.; Richter, T.; Krenkel, P. Interdependencies of Industrie 4.0 & Lean Production Systems: A Use Cases Analysis. Procedia Manuf. 2017, 11, 1061–1068. [Google Scholar]
- Majeed, A.; Zhang, Y.; Ren, S.; Lv, J.; Peng, T.; Waqar, S.; Yin, E. A big data-driven framework for sustainable and smart additive manufacturing. Robot. Comput. Integr. Manuf. 2021, 67, 102026. [Google Scholar] [CrossRef]
- Negri, E.; Fumagalli, L.; Macchi, M. A Review of the Roles of Digital Twin in CPS-based Production Systems. Procedia Manuf. 2017, 11, 939–948. [Google Scholar] [CrossRef]
- Cai, Y.; Starly, B.; Cohen, P.; Lee, Y.S. Sensor Data and Information Fusion to Construct Digital-twins Virtual Machine Tools for Cyber-physical Manufacturing. Procedia Manuf. 2017, 10, 1031–1042. [Google Scholar] [CrossRef]
- Uhlemann, T.H.; Lehmann, C.; Steinhilper, R. The Digital Twin: Realizing the Cyber-Physical Production System for Industry 4.0. Procedia CIRP 2017, 61, 335–340. [Google Scholar] [CrossRef]
- Lu, Y.; Liu, C.; Kevin, I.; Wang, K.; Huang, H.; Xu, X. Digital Twin-driven smart manufacturing: Connotation, reference model, applications and research issues. Robot. Comput. Integr. Manuf. 2020, 61, 101837. [Google Scholar] [CrossRef]
- Leong, W.D.; Teng, S.Y.; How, B.S.; Ngan, S.L.; Rahman, A.A.; Tan, C.P.; Ponnambalam, S.G.; Lam, H.L. Enhancing the adaptability: Lean and green strategy towards the Industry Revolution 4.0. J. Clean. Prod. 2020, 273, 122870. [Google Scholar] [CrossRef]
- Gyulai, D.; Pfeiffer, A.; Nick, G.; Gallina, V.; Sihn, W.; Monostori, L. Lead time prediction in a flow-shop environment with analytical and machine learning approaches. IFAC-PapersOnLine 2018, 51, 1029–1034. [Google Scholar] [CrossRef]
- Robert, O.; Iztok, P.; Borut, B. Real-Time manufacturing optimization with a simulation model and virtual reality. Procedia Manuf. 2019, 38, 1103–1110. [Google Scholar] [CrossRef]
- Hofmann, C.; Staehr, T.; Cohen, S.; Stricker, N.; Haefner, B.; Lanza, G. Augmented Go & See: An approach for improved bottleneck identification in production lines. Procedia Manuf. 2019, 31, 148–154. [Google Scholar]
- Blaga, A.; Militaru, C.; Mezei, A.D.; Tamas, L. Augmented reality integration into MES for connected workers. Robot. Comput. Integr. Manuf. 2021, 68, 102057. [Google Scholar] [CrossRef]
- Masood, T.; Egger, J. Augmented reality in support of Industry 4.0—Implementation challenges and success factors. Robot. Comput. Integr. Manuf. 2019, 58, 181–195. [Google Scholar] [CrossRef]
- Yeen Gavin Lai, N.; Hoong Wong, K.; Halim, D.; Lu, J.; Siang Kang, H. Industry 4.0 Enhanced Lean Manufacturing. In Proceedings of the 2019 8th International Conference on Industrial Technology and Management (ICITM), Cambridge, UK, 2–4 March 2019; pp. 206–211. [Google Scholar]
- Kolberg, D.; Zühlke, D. Lean Automation enabled by Industry 4.0 Technologies. IFAC-PapersOnLine 2015, 48, 1870–1875, In Proceedings of the 15th IFAC Symposium onInformation Control Problems in Manufacturing, Ottawa, ON, Canada, 1–13 May 2015. [Google Scholar] [CrossRef]
- Ahmed, F.; Jannat, N.E.; Schmidt, D.; Kim, K.Y. Data-driven cyber-physical system framework for connected resistance spot welding weldability certification. Robot. Comput. Integr. Manuf. 2021, 67, 102036. [Google Scholar] [CrossRef]
- Sony, M. Industry 4.0 and lean management: A proposed integration model and research propositions. Prod. Manuf. Res. 2018, 6, 416–432. [Google Scholar] [CrossRef] [Green Version]
- Mayr, A.; Weigelt, M.; Kühl, A.; Grimm, S.; Erll, A.; Potzel, M.; Franke, J. Lean 4.0—A conceptual conjunction of lean management and Industry 4.0. Procedia CIRP 2018, 72, 622–628. [Google Scholar] [CrossRef]
- Ejsmont, K.; Gladysz, B.; Corti, D.; Castaño, F.; Mohammed, W.M.; Martinez Lastra, J.L. Towards ’Lean Industry 4.0’-Current trends and future perspectives. Cogent Bus. Manag. 2020, 7, 1–32. [Google Scholar] [CrossRef]
- Curran, K.; Furey, E.; Lunney, T.; Santos, J.; Woods, D.; McCaughey, A. An evaluation of indoor location determination technologies. J. Locat. Based Serv. 2011, 5, 61–78. [Google Scholar] [CrossRef]
- Iliffe, J. Hofmann-Wellenhof, B., Lichtenegger, H. & Collins, J. 1994. Global Positioning System. Theory and Practice, xxiii+ 355 pp. Wien, New York: Springer-Verlag. Price DM 79.00, Ös 550.00 (soft covers). ISBN 3 211 82591 6. Geol. Mag. 1998, 135, 143–158. [Google Scholar]
- Miclo, R.; Fontanili, F.; Marquès, G.; Bomert, P.; Lauras, M. RTLS-based Process Mining: Towards an automatic process diagnosis in healthcare. In Proceedings of the 2015 IEEE International Conference on Automation Science and Engineering (CASE), IEEE, Gothenburg, Sweden, 24–28 August 2015; pp. 1397–1402. [Google Scholar]
- Simões, W.C.; Machado, G.S.; Sales, A.; de Lucena, M.M.; Jazdi, N.; de Lucena, V.F. A Review of Technologies and Techniques for Indoor Navigation Systems for the Visually Impaired. Sensors 2020, 20, 3935. [Google Scholar] [CrossRef]
- Vieira, M.A.; Vieira, M.; Louro, P.; Mateus, L.; Vieira, P. Indoor positioning system using a WDM device based on a-SiC:H technology. J. Lumin. 2017, 191, 135–138. [Google Scholar] [CrossRef]
- Zheng, L.; Zhou, W.; Tang, W.; Zheng, X.; Peng, A.; Zheng, H. A 3D indoor positioning system based on low-cost MEMS sensors. Simul. Model. Pract. Theory 2016, 65, 45–56. [Google Scholar] [CrossRef]
- Saab, S.S.; Nakad, Z.S. A Standalone RFID Indoor Positioning System Using Passive Tags. IEEE Trans. Ind. Electron. 2011, 58, 1961–1970. [Google Scholar] [CrossRef]
- Ruppert, T.; Abonyi, J. Industrial internet of things based cycle time control of assembly lines. In Proceedings of the 2018 IEEE International Conference on Future IoT Technologies (Future IoT), Eger, Hungary, 18–19 January 2018; pp. 1–4. [Google Scholar]
- Ruppert, T.; Abonyi, J. Software sensor for activity-time monitoring and fault detection in production lines. Sensors 2018, 18, 2346. [Google Scholar] [CrossRef] [PubMed] [Green Version]
- Zang, Y.; Wu, L. Application of RFID and RTLS Technology in Supply Chain Enterprise. In Proceedings of the 2010 6th International Conference on Wireless Communications Networking and Mobile Computing (WiCOM), Chengdu, China, 23–25 September 2010; pp. 1–4. [Google Scholar] [CrossRef]
- Kirch, M.; Poenicke, O.; Richter, K. RFID in Logistics and Production –Applications, Research and Visions for Smart Logistics Zones. Procedia Eng. 2017, 178, 526–533. [Google Scholar] [CrossRef]
- Lee, K.P.; Lee, H.S.; Park, M.S.; Kim, H.; Baek, Y.J. RFID-Based Real-Time Locating System for Construction Safety Management. Korean J. Constr. Eng. Manag. 2010, 11. [Google Scholar] [CrossRef]
- Awolusi, A.; Akinyokun, O.; Iwasokun, G. RFID and RTLS-Based Human Resource Monitoring System. Br. J. Math. Comput. Sci. 2016, 14, 1–14. [Google Scholar] [CrossRef]
- Byrne, B.; McDermott, O.; Noonan, J. Applying Lean Six Sigma Methodology to a Pharmaceutical Manufacturing Facility: A Case Study. Processes 2021, 9, 550. [Google Scholar] [CrossRef]
- Navalgund, A.B.; Kulkarni, S. Implementation of Six Sigma Principles to Improve Supply Chain and Assembly Process. Management 2020, 2, 100. [Google Scholar]
- Knoll, D.; Reinhart, G.; Prüglmeier, M. Enabling value stream mapping for internal logistics using multidimensional process mining. Expert Syst. Appl. 2019, 124, 130–142. [Google Scholar] [CrossRef]
- Graafmans, T.; Turetken, O.; Poppelaars, H.; Fahland, D. Process Mining for Six Sigma. Bus. Inf. Syst. Eng. 2020, 1–24. [Google Scholar] [CrossRef]
- Womack, J.P.; Jones, D.T. Lean thinking-banish waste and create wealth in your corporation. J. Oper. Res. Soc. 1997, 48, 1148. [Google Scholar] [CrossRef]
- Abdulmalek, F.A.; Rajgopal, J. Analyzing the benefits of lean manufacturing and value stream mapping via simulation: A process sector case study. Int. J. Prod. Econ. 2007, 107, 223–236. [Google Scholar] [CrossRef]
- Estrada, F.; Villalobos, J.R.; Roderick, L. Evaluation of Just-In-Time alternatives in the electric wire-harness industry. Int. J. Prod. Res. 1997, 35, 1993–2008. [Google Scholar] [CrossRef]
- Le, Q.L.N.; Do, N.H.; Nam, K.C. Modeling and simulation of a Lean system. Case study of a paint line in a furniture company. Manag. Res. Pract. 2010, 2, 284–298. [Google Scholar]
- Rahman, H.; Roy, P.K.; Karim, R.; Biswas, P.K. Effective Way To Estimate the Standard Minute Value ( Smv ) of a T-Shirt By Work Study. Eur. Sci. J. 2014, 10, 196–203. [Google Scholar]
- Rahani, A.R.; Al-Ashraf, M. Production flow analysis through Value Stream Mapping: A lean manufacturing process case study. Procedia Eng. 2012, 41, 1727–1734. [Google Scholar] [CrossRef] [Green Version]
- Nguyen Thi, L.; Le Minh, T.; Vu Thi Thanh, T.; Do, N.H. Lean Line Balancing for an Electronics Assembly Line. Procedia CIRP 2016, 40, 437–442. [Google Scholar]
- McCarthy, D.; Rich, N. Lean TPM: A Blueprint for Change; Elsevier: Amsterdam, The Netherlands, 2004. [Google Scholar]
- Baluch, N.; Abdullah, C.S.; Mohtar, S. TPM and Lean Maintenance—A Critical Review. Interdiscip. J. Contemp. Res. Bus. 2012, 4, 850–857. [Google Scholar]
- Zelbst, P.; Green, J.; Sower, V.; Abshire, R. Impact of RFID and information sharing on JIT, TQM and operational performance. Manag. Res. Rev. 2014, 37, 970–989. [Google Scholar] [CrossRef]
- Aydos, T.F.; Ferreira, J.C. RFID-based system for Lean Manufacturing in the context of Internet of Things. IEEE Int. Conf. Autom. Sci. Eng. 2016, 2016, 1140–1145. [Google Scholar]
- Chongwatpol, J.; Sharda, R. Achieving Lean Objectives through RFID: A Simulation-Based Assessment*. Decis. Sci. 2013, 44, 239–266. [Google Scholar] [CrossRef]
- Teizer, J.; Neve, H.; Li, H.; Wandahl, S.; König, J.; Ochner, B.; König, M.; Lerche, J. Construction resource efficiency improvement by Long Range Wide Area Network tracking and monitoring. Autom. Constr. 2020, 116, 103245. [Google Scholar] [CrossRef]
- Reinbold, A.; Seppänen, O.; Peltokorpi, A.; Singh, V.; Dror, E. Integrating indoor positioning systems and BIM to improve situational awareness. In Proceedings of the 27th Annual Conference of the International Group for Lean Construction, IGLC 2019, Dublin, Ireland, 1–7 July 2019; pp. 1141–1150. [Google Scholar]
- Brintrup, A.; Ranasinghe, D.; Mcfarlane, D. RFID Opportunity Analysis for Leaner Manufacturing. Int. J. Prod. Res. 2010, 48, 2745–2764. [Google Scholar] [CrossRef]
- Huang, G.; Qu, T.; Zhang, Y.; Yang, H. RFID-enabled real-time manufacturing for automotive part and accessory suppliers. In Proceedings of the 40th International Conference on Computers & Indutrial Engineering, Awaji City, Japan, 25–28 July 2010; pp. 1–6. [Google Scholar]
- Qu, T.; Zhang, L.; Huang, Z.; Dai, Q.; Chen, X.; Huang, G.; Luo, H. RFID-enabled smart assembly workshop management system. In Proceedings of the 2013 10th Ieee International Conference on Networking, Sensing and Control (ICNSC), Paris-Evry, France, 10–12 April 2013; pp. 895–900. [Google Scholar]
- Chen, J.; Chen, K.M. Application of ORFPM system for lean implementation: An industrial case study. Int. J. Adv. Manuf. Technol. 2014, 72, 839–852. [Google Scholar] [CrossRef]
- Chen, K.M.; Chen, J.; Cox, R. Real time facility performance monitoring system using RFID technology. Assem. Autom. 2012, 32, 185–196. [Google Scholar] [CrossRef]
- Nowotarski, P.; Paslawski, J.; Skrzypczak, M.; Krygier, R. RTLS Systems as a Lean Management Tool for Productivity Improvement. ISARC. In Proceedings of the International Symposium on Automation and Robotics in Construction, Taipei, Taiwan, 28 June–1 July 2017. [Google Scholar]
- Gladysz, B.; Santarek, K.; Lysiak, C. Dynamic Spaghetti Diagrams. A Case Study of Pilot RTLS Implementation. In Intelligent Systems in Production Engineering and Maintenance—ISPEM 2017; Burduk, A., Mazurkiewicz, D., Eds.; Springer International Publishing: Cham, Swizerland, 2018; pp. 238–248. [Google Scholar]
- Bauer, H.; Brandl, F.; Lock, C.; Reinhart, G. Integration of Industrie 4.0 in Lean Manufacturing Learning Factories. Procedia Manuf. 2018, 23, 147–152, Advanced Engineering Education & Training for Manufacturing Innovation. In Proceedings of the 8th CIRP Sponsored Conference on Learning Factories (CLF 2018), Patras, Greece, 12–13 April 2018. [Google Scholar] [CrossRef]
- Cury, P.H.A.; Saraiva, J. Time and motion study applied to a production line of organic lenses in Manaus Industrial Hub. Gestão Produção 2018, 25, 901–915. [Google Scholar] [CrossRef] [Green Version]
- Astromskis, S.; Janes, A.; Sillitti, A.; Succi, G. Implementing organization-wide gemba using noninvasive process mining. Cutter IT J. 2013, 26, 32–39. [Google Scholar]
- Antonelli, D.; Bruno, G. Application of Process Mining and Semantic Structuring Towards a Lean Healthcare Network. In Proceedings of the Working Conference on Virtual Enterprises, Albi, France, 23–25 September 2015; pp. 497–508. [Google Scholar]
- Macoir, N.; Bauwens, J.; Jooris, B.; Van Herbruggen, B.; Rossey, J.; Hoebeke, J.; De Poorter, E. Uwb localization with battery-powered wireless backbone for drone-based inventory management. Sensors 2019, 19, 467. [Google Scholar] [CrossRef] [PubMed] [Green Version]
- Ma, X.; Liu, T. The application of Wi-Fi RTLS in automatic warehouse management system. In Proceedings of the 2011 IEEE International conference on automation and logistics (ICAL), Chongqing, China, 15–16 August 2011; pp. 64–69. [Google Scholar]
- Priya, S.K.; Jayakumar, V.; Kumar, S.S. Defect analysis and lean six sigma implementation experience in an automotive assembly line. Mater. Today Proc. 2020, 22, 948–958. [Google Scholar] [CrossRef]
- Zhang, Y.; You, D.; Gao, X.; Zhang, N.; Gao, P.P. Welding defects detection based on deep learning with multiple optical sensors during disk laser welding of thick plates. J. Manuf. Syst. 2019, 51, 87–94. [Google Scholar] [CrossRef]
- Zhao, A.; Tian, G.Y.; Zhang, J. IQ signal based RFID sensors for defect detection and characterisation. Sens. Actuators A Phys. 2018, 269, 14–21. [Google Scholar] [CrossRef] [Green Version]
- Rahman, M.A.; Khadem, M.M.; Sarder, M. Application of RFID in Supply Chain System. In Proceedings of the 2010 International Conference on Industrial Engineering and Operations Management, Dhaka, Bangladesh, 9–10 January 2010. [Google Scholar]
- Ruppert, T.; Jaskó, S.; Holczinger, T.; Abonyi, J. Enabling technologies for operator 4.0: A survey. Appl. Sci. 2018, 8, 1650. [Google Scholar] [CrossRef] [Green Version]
- Karam, A.A.; Liviu, M.; Cristina, V.; Radu, H. The contribution of lean manufacturing tools to changeover time decrease in the pharmaceutical industry. A SMED project. Procedia Manuf. 2018, 22, 886–892. [Google Scholar] [CrossRef]
- Ferradás, P.G.; Salonitis, K. Improving Changeover Time: A Tailored SMED Approach for Welding Cells. Procedia CIRP 2013, 7, 598–603. [Google Scholar] [CrossRef] [Green Version]
- Ruppert, T.; Csalodi, R.; Abonyi, J. Estimation of machine setup and changeover times by survival analysis. Comput. Ind. Eng. 2021, 153, 107026. [Google Scholar] [CrossRef]
Figure 1.
The proposed framework of Lean 4.0 data-driven development.
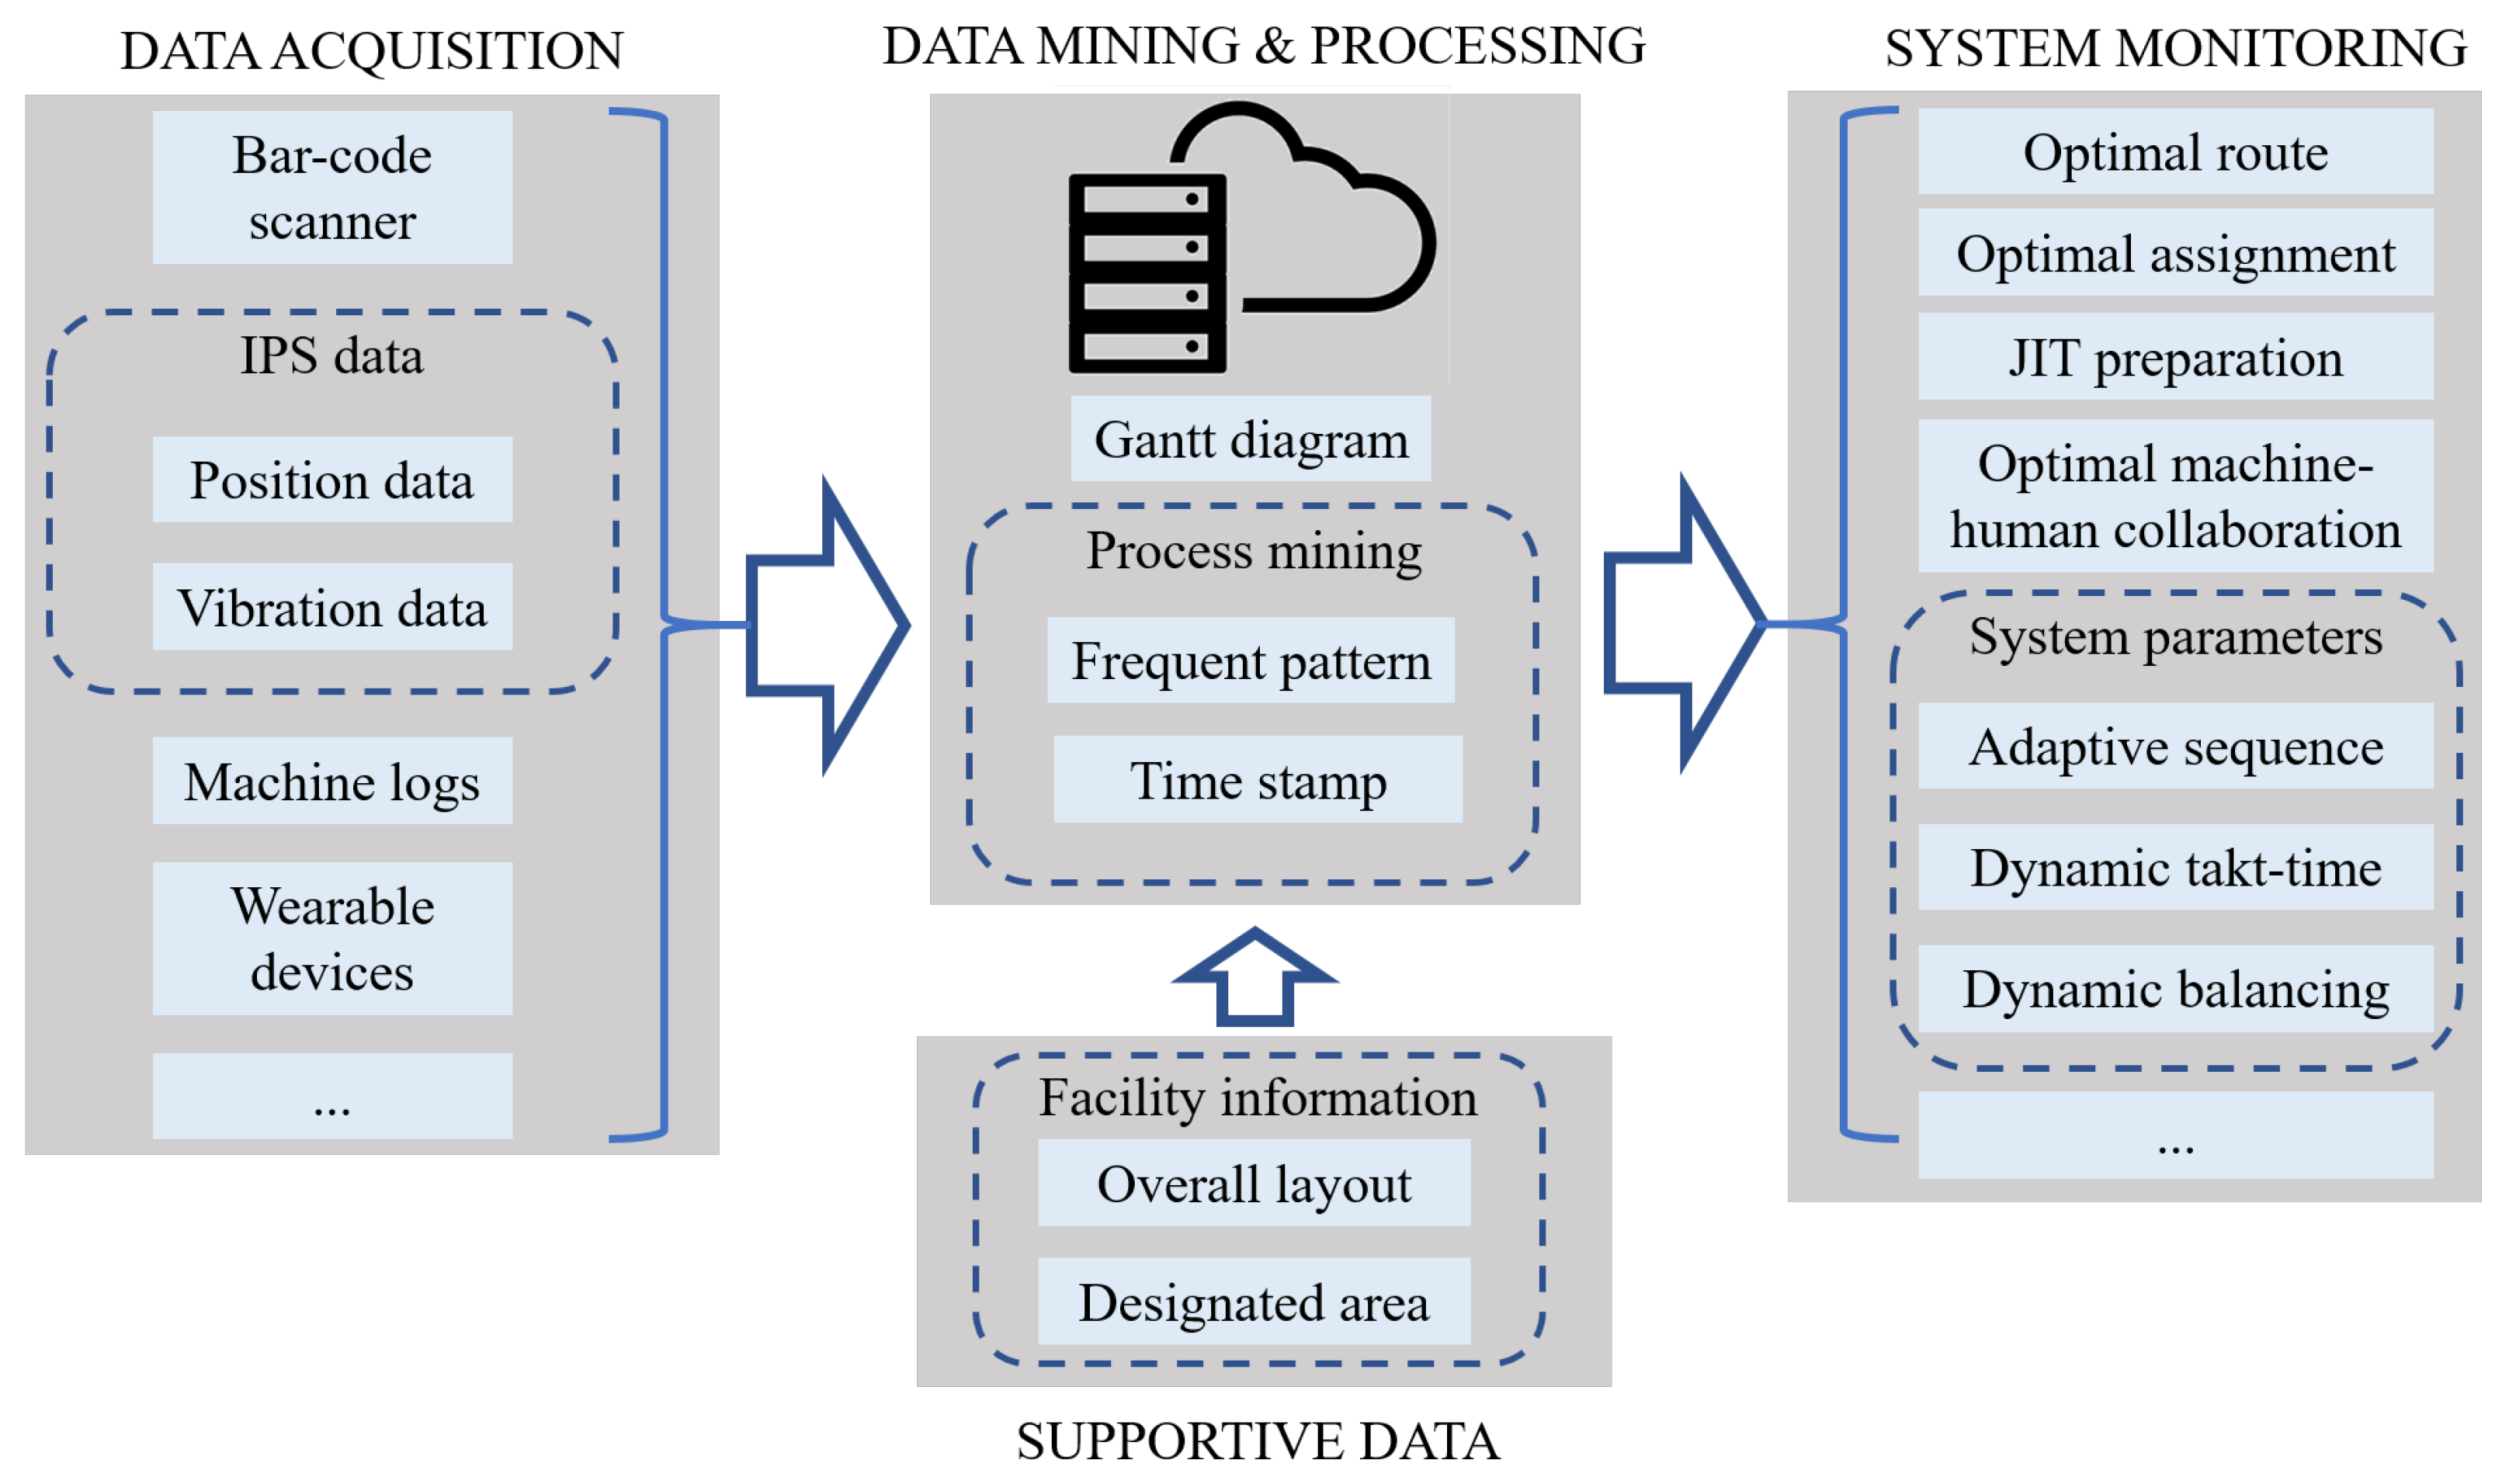
Figure 2.
IPS data is the key element of the proposed PDCA-cycle-based methodology.

Figure 3.
The hardware architecture of the applied IPS (based on Sunstone-RTLS Ltd.—Hungary).
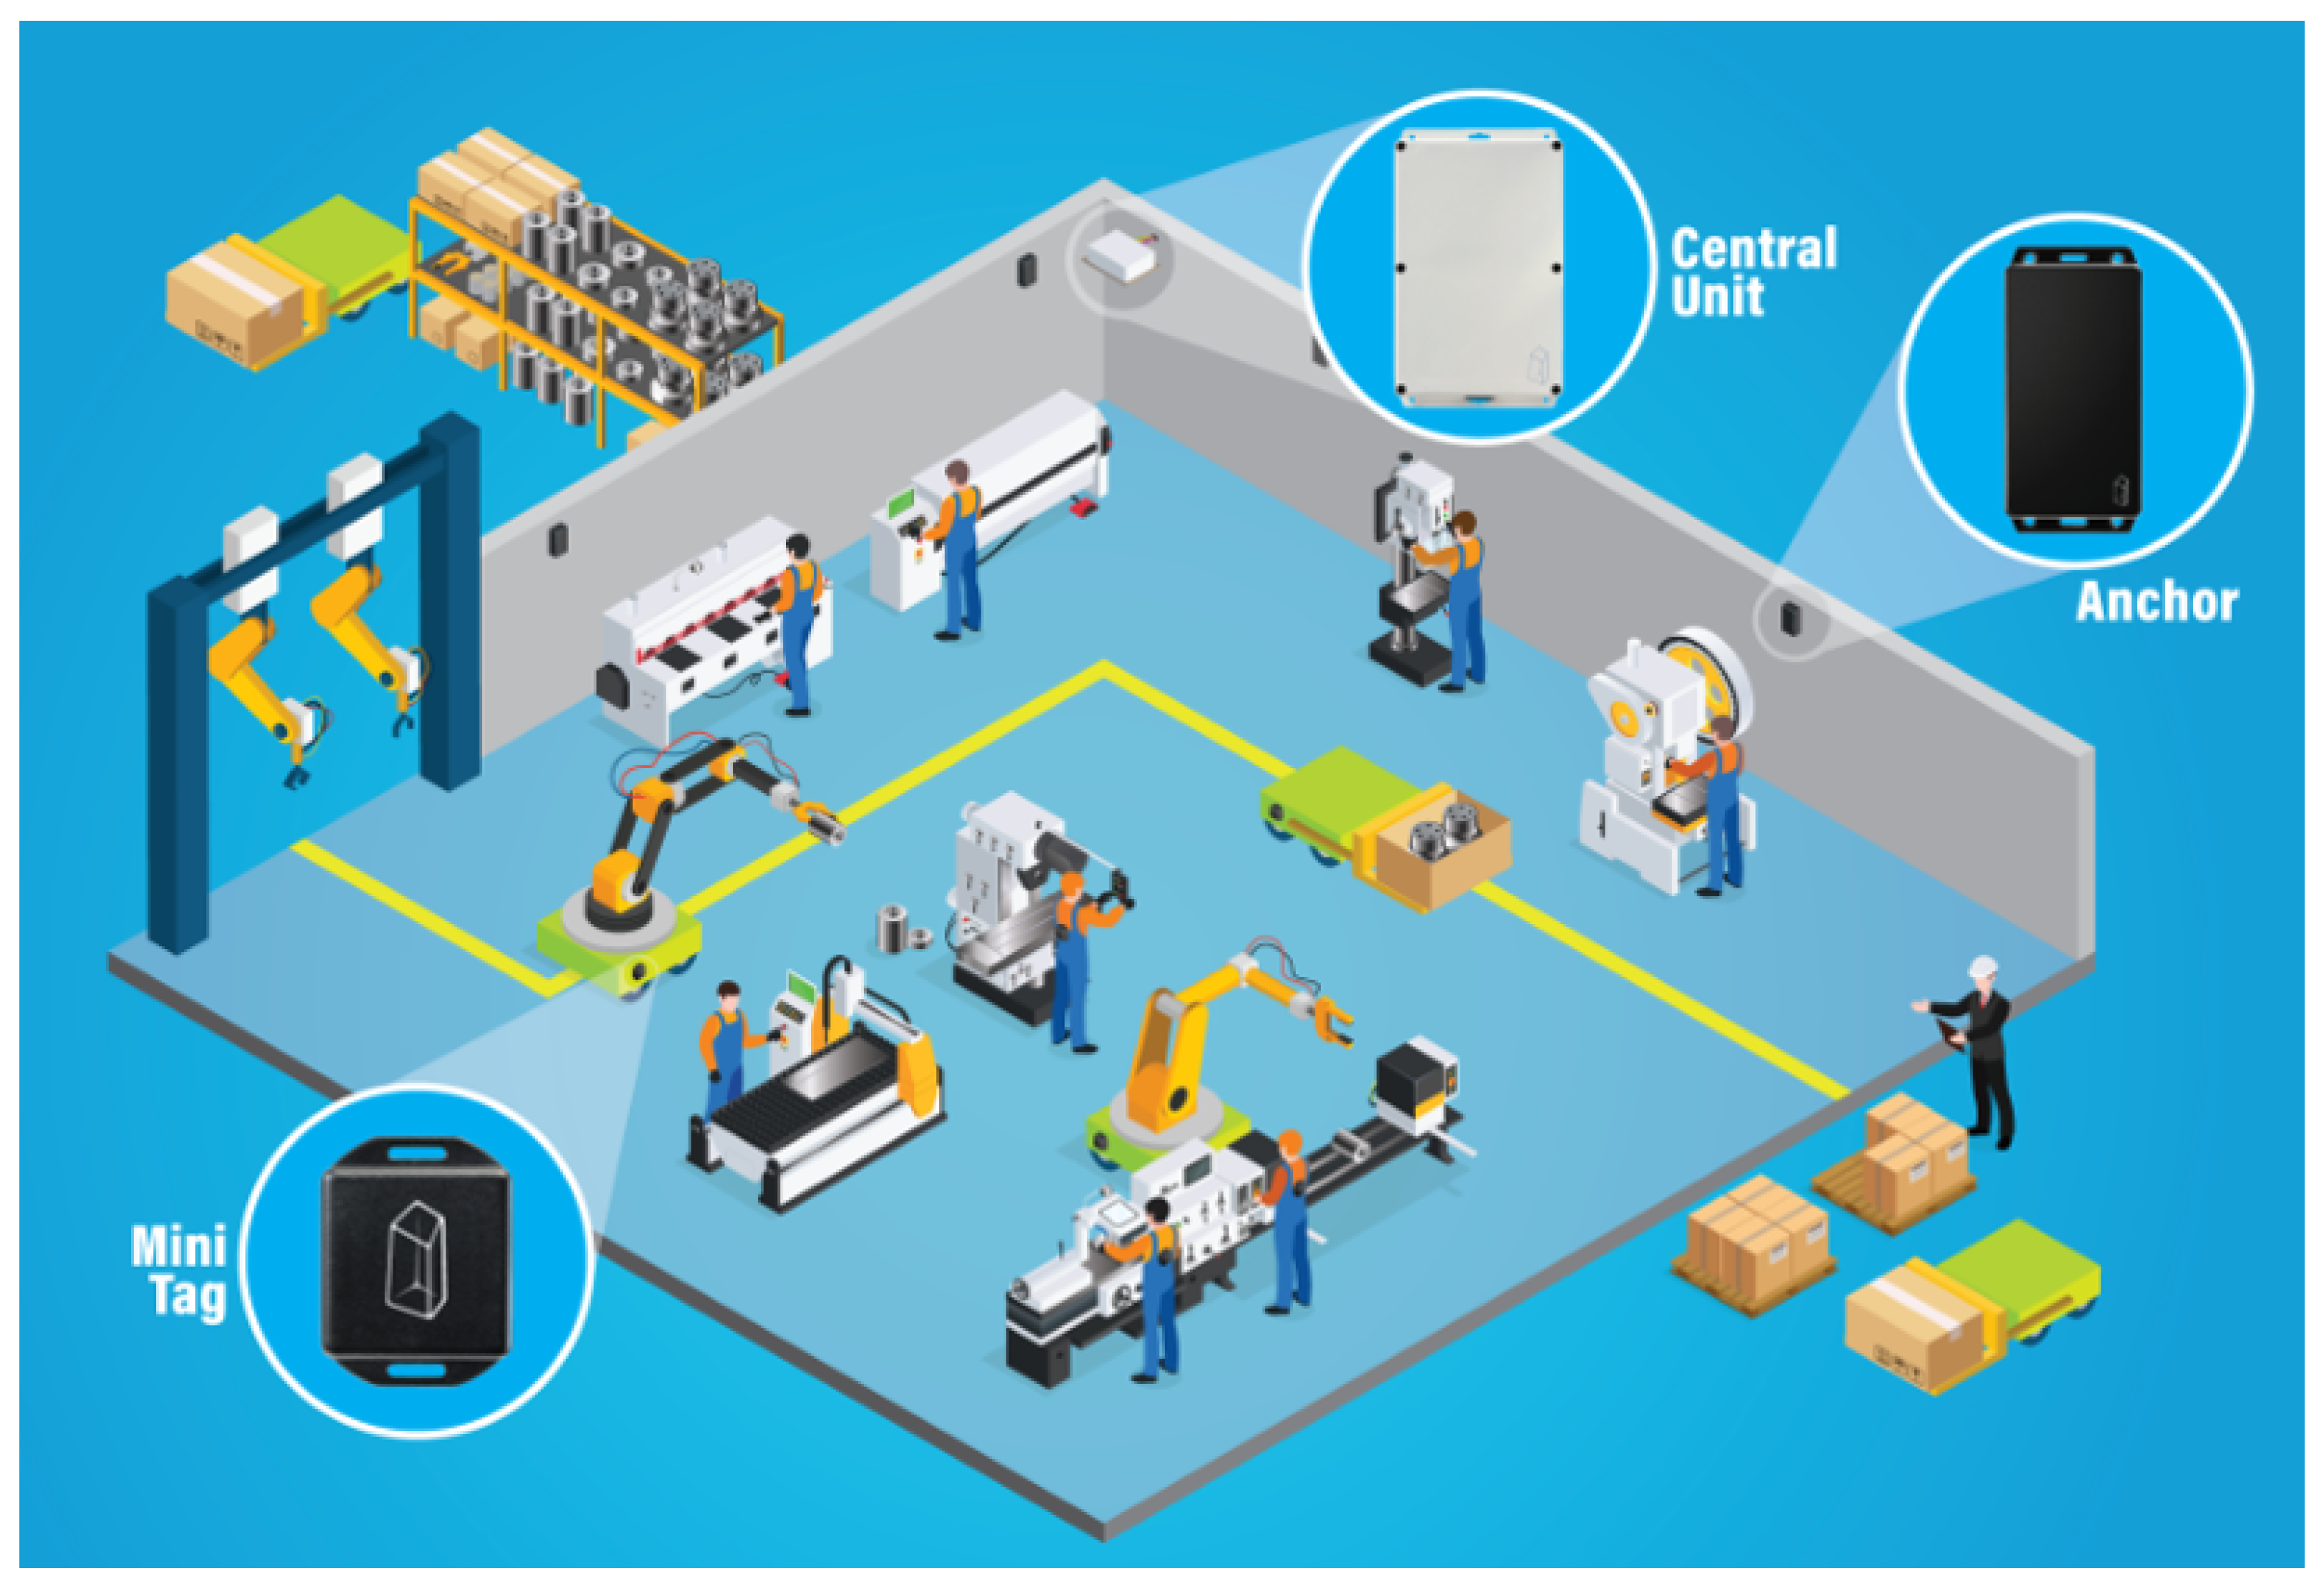
Figure 4.
The distribution analysis of the positional data supports the identification of the states of the internal inventories, and the waiting and cycle times. (a) Tracked path of one product on the shop-floor. The rectangles define the workstations and the dots represent the positional data. The timeline is presented by the colours of the dots. (b) The discovered status is based on positional data. The blue stars are the transportation, while the orange markers are the queueing positions.
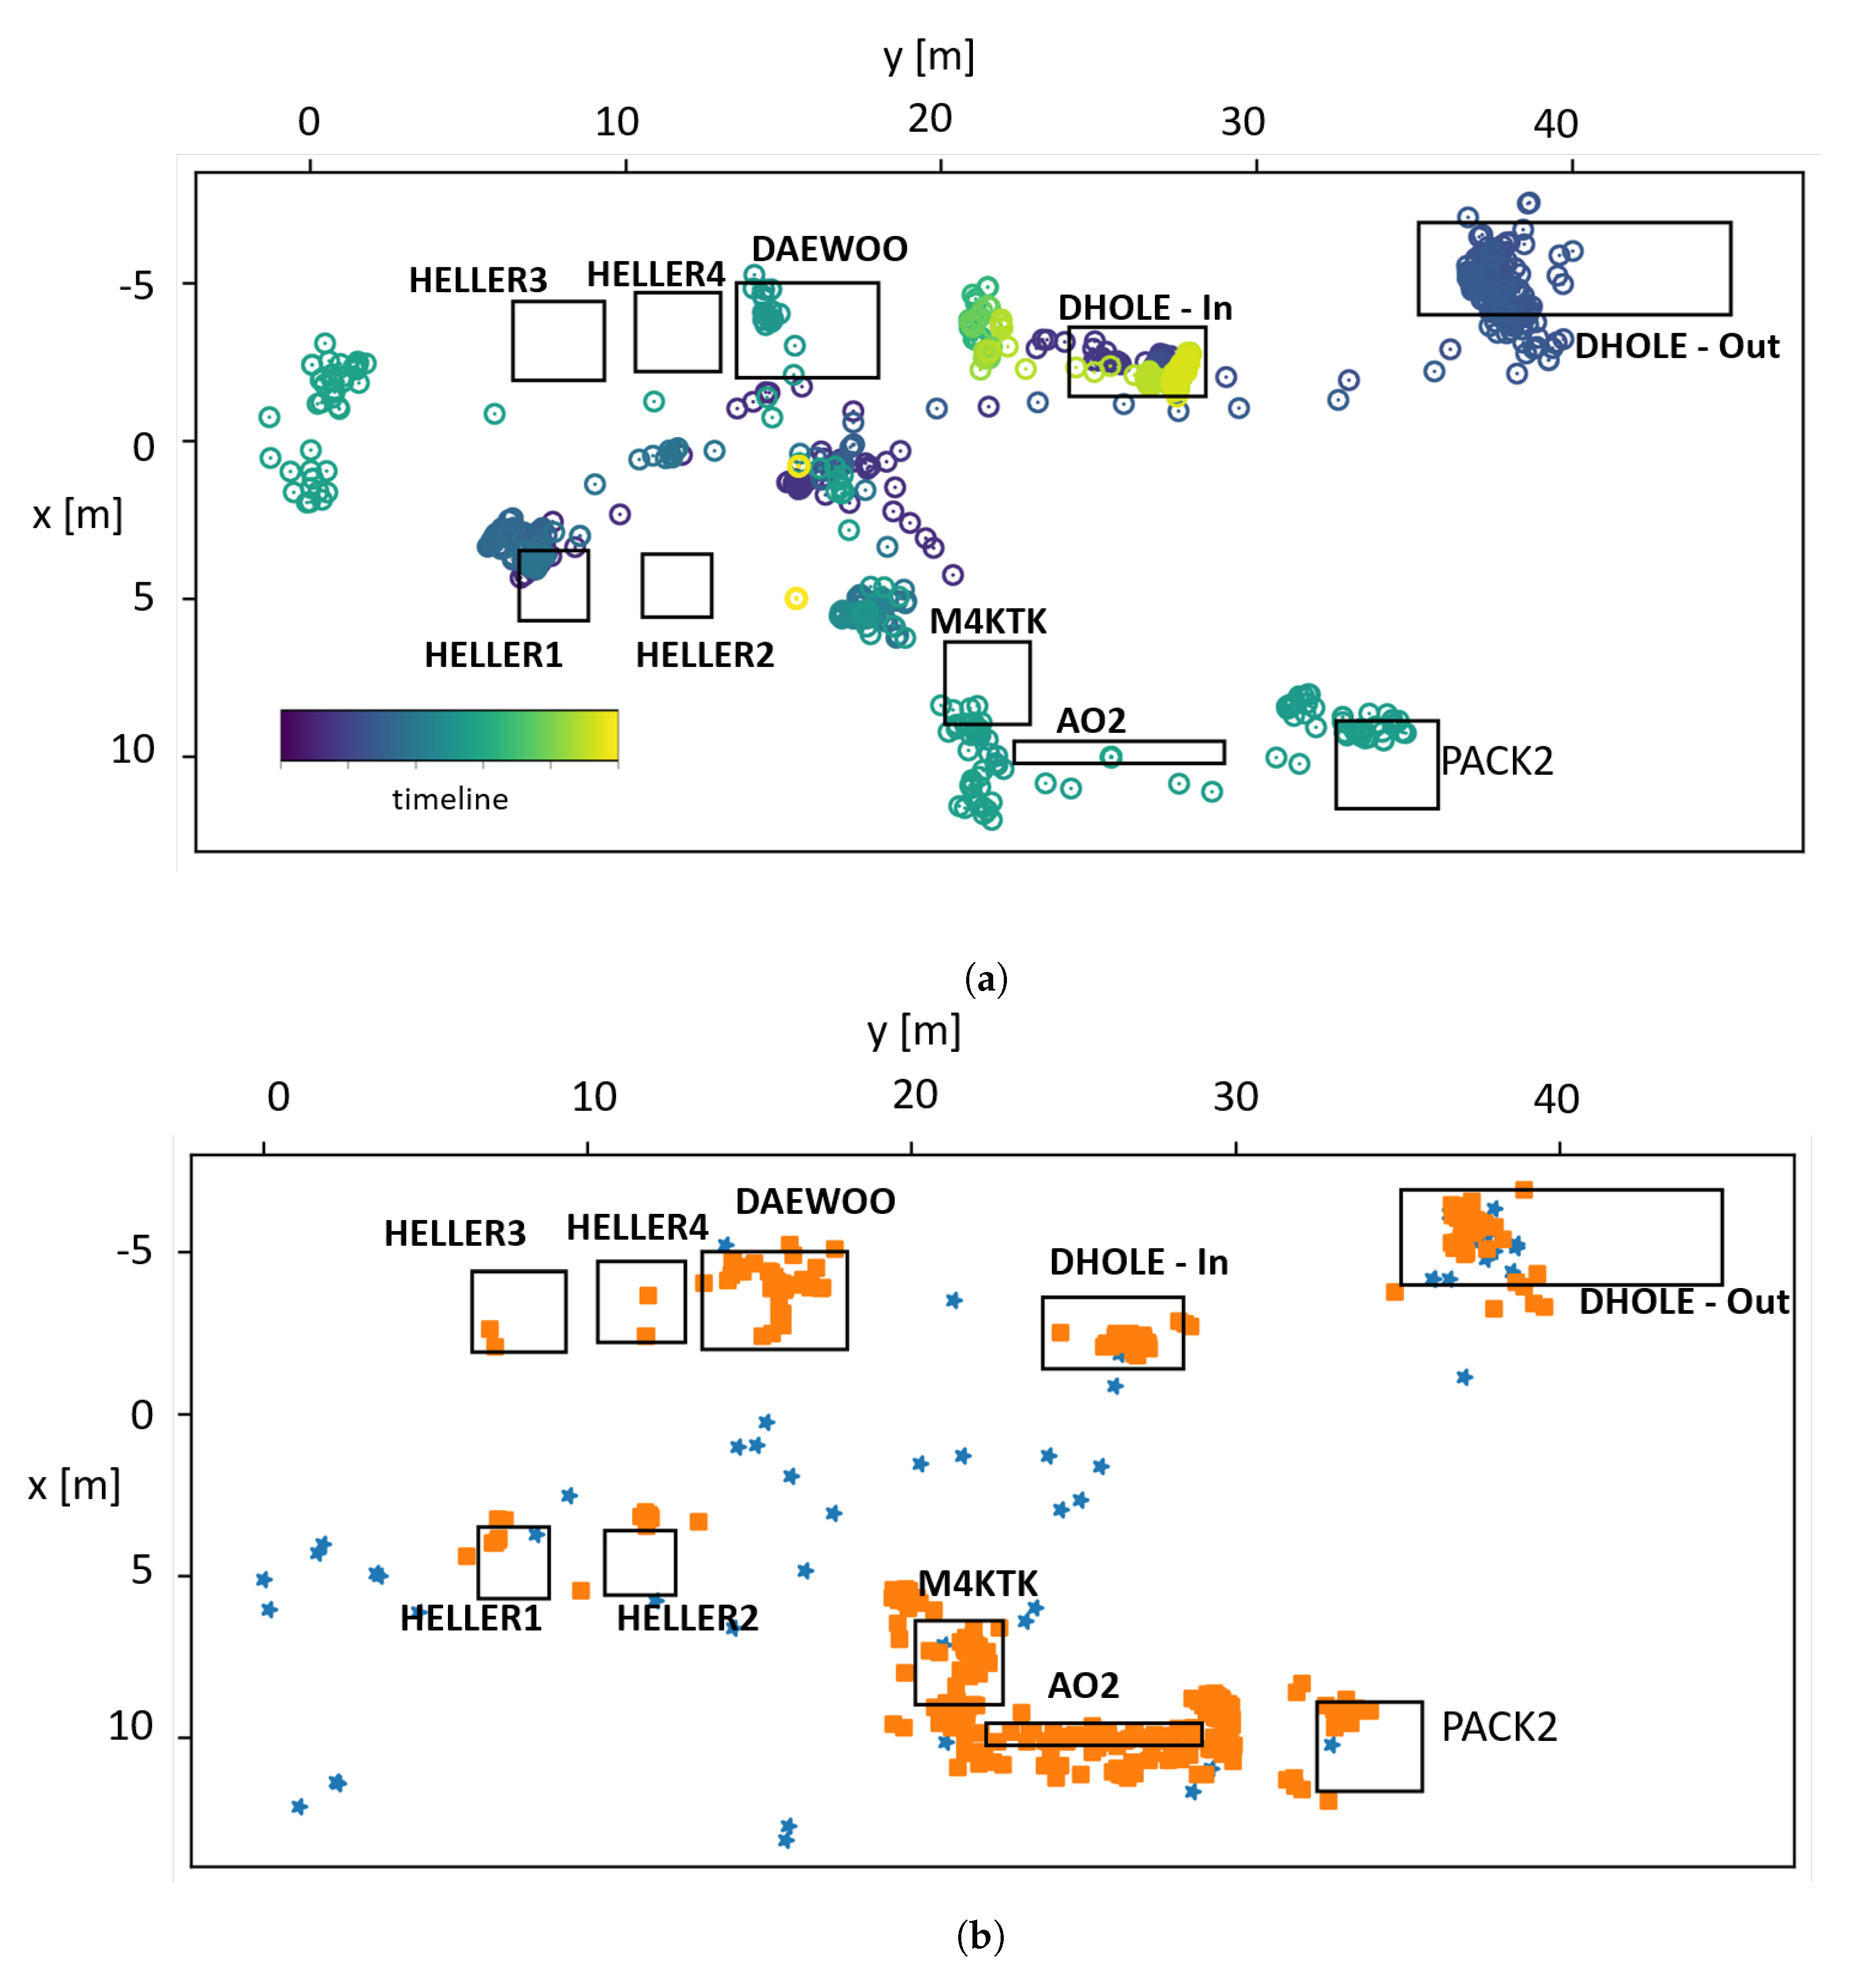
Figure 5.
A production flow model discovered by process mining based on IPS and MES data. (a) The frequency of the material flows. The colours of stations represent utilisation of the workstations. (b) The discovered average cycle and transition times. The colours of stations represent the cycle times. We can notice that the HELLER stations are the bottlenecks of the process. The transition times are represented by the arrows, which highlight the possible hidden wastes.
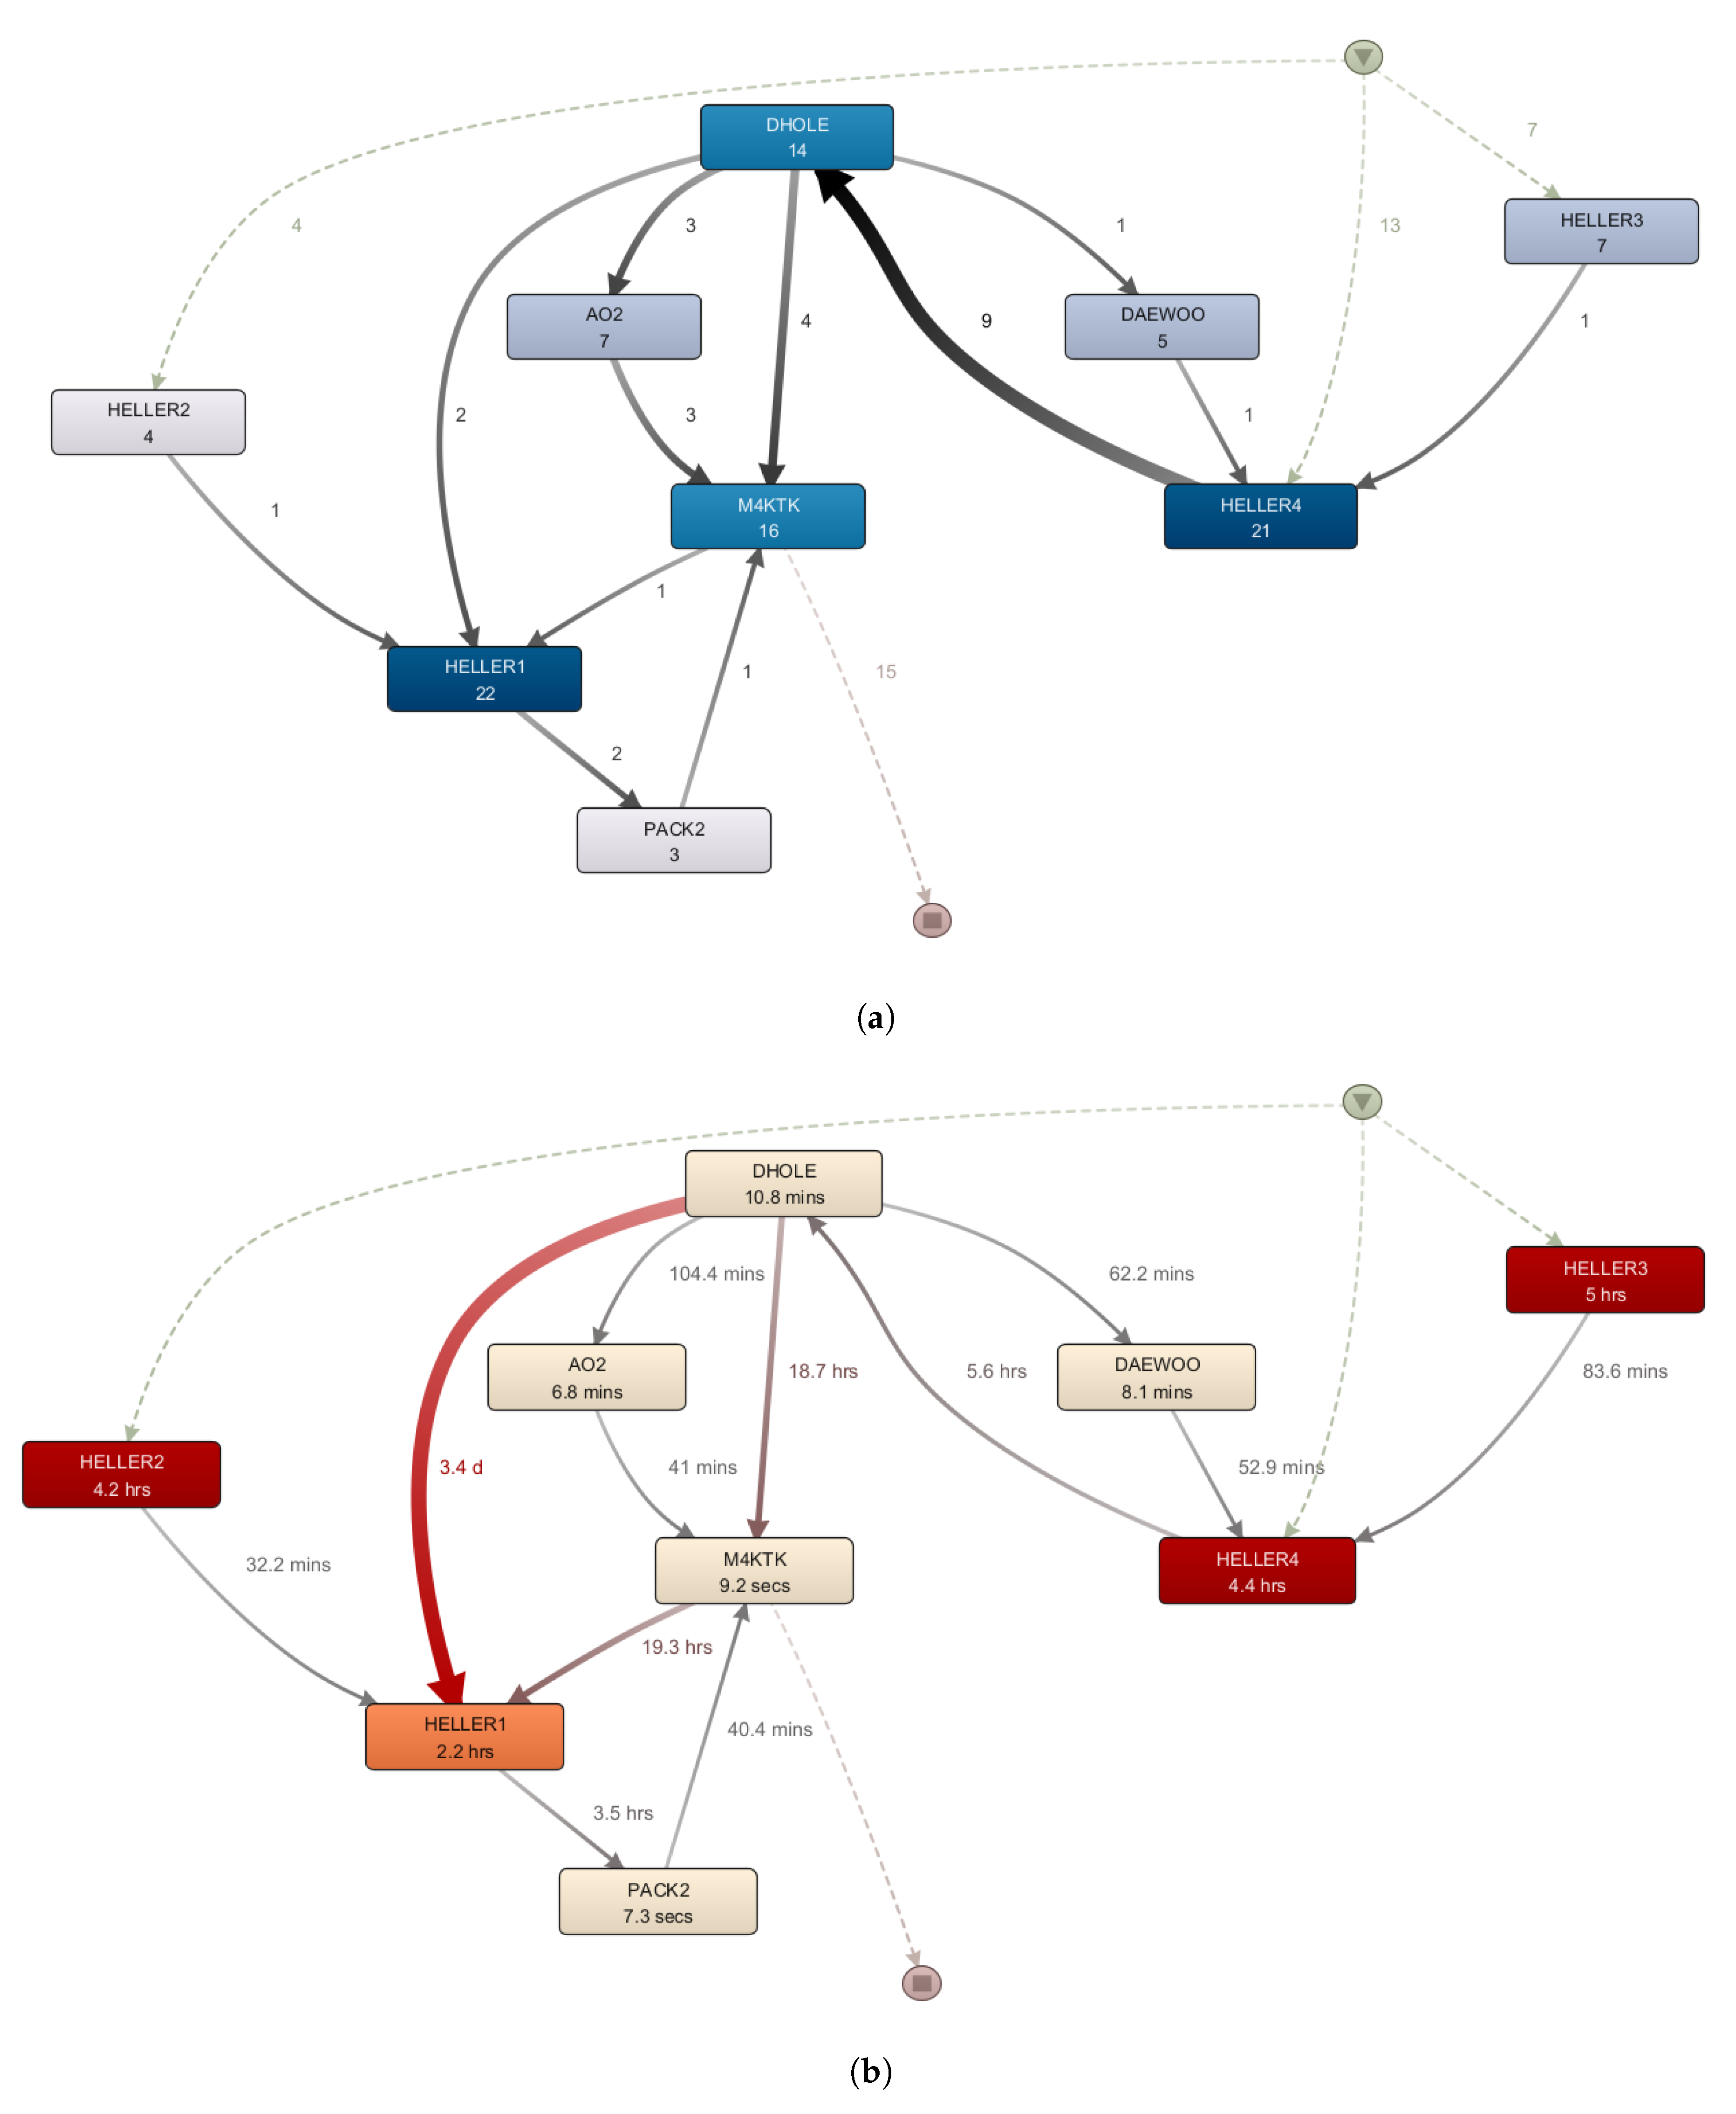
Figure 6.
The Gantt diagrams show the states of the production of a given product. The comparison of the two diagrams shows the benefit of the additional information of the IPS. (a) Gantt diagram based on MES data. (b) Gantt diagram based on IPS and MES data.
Figure 6.
The Gantt diagrams show the states of the production of a given product. The comparison of the two diagrams shows the benefit of the additional information of the IPS. (a) Gantt diagram based on MES data. (b) Gantt diagram based on IPS and MES data.
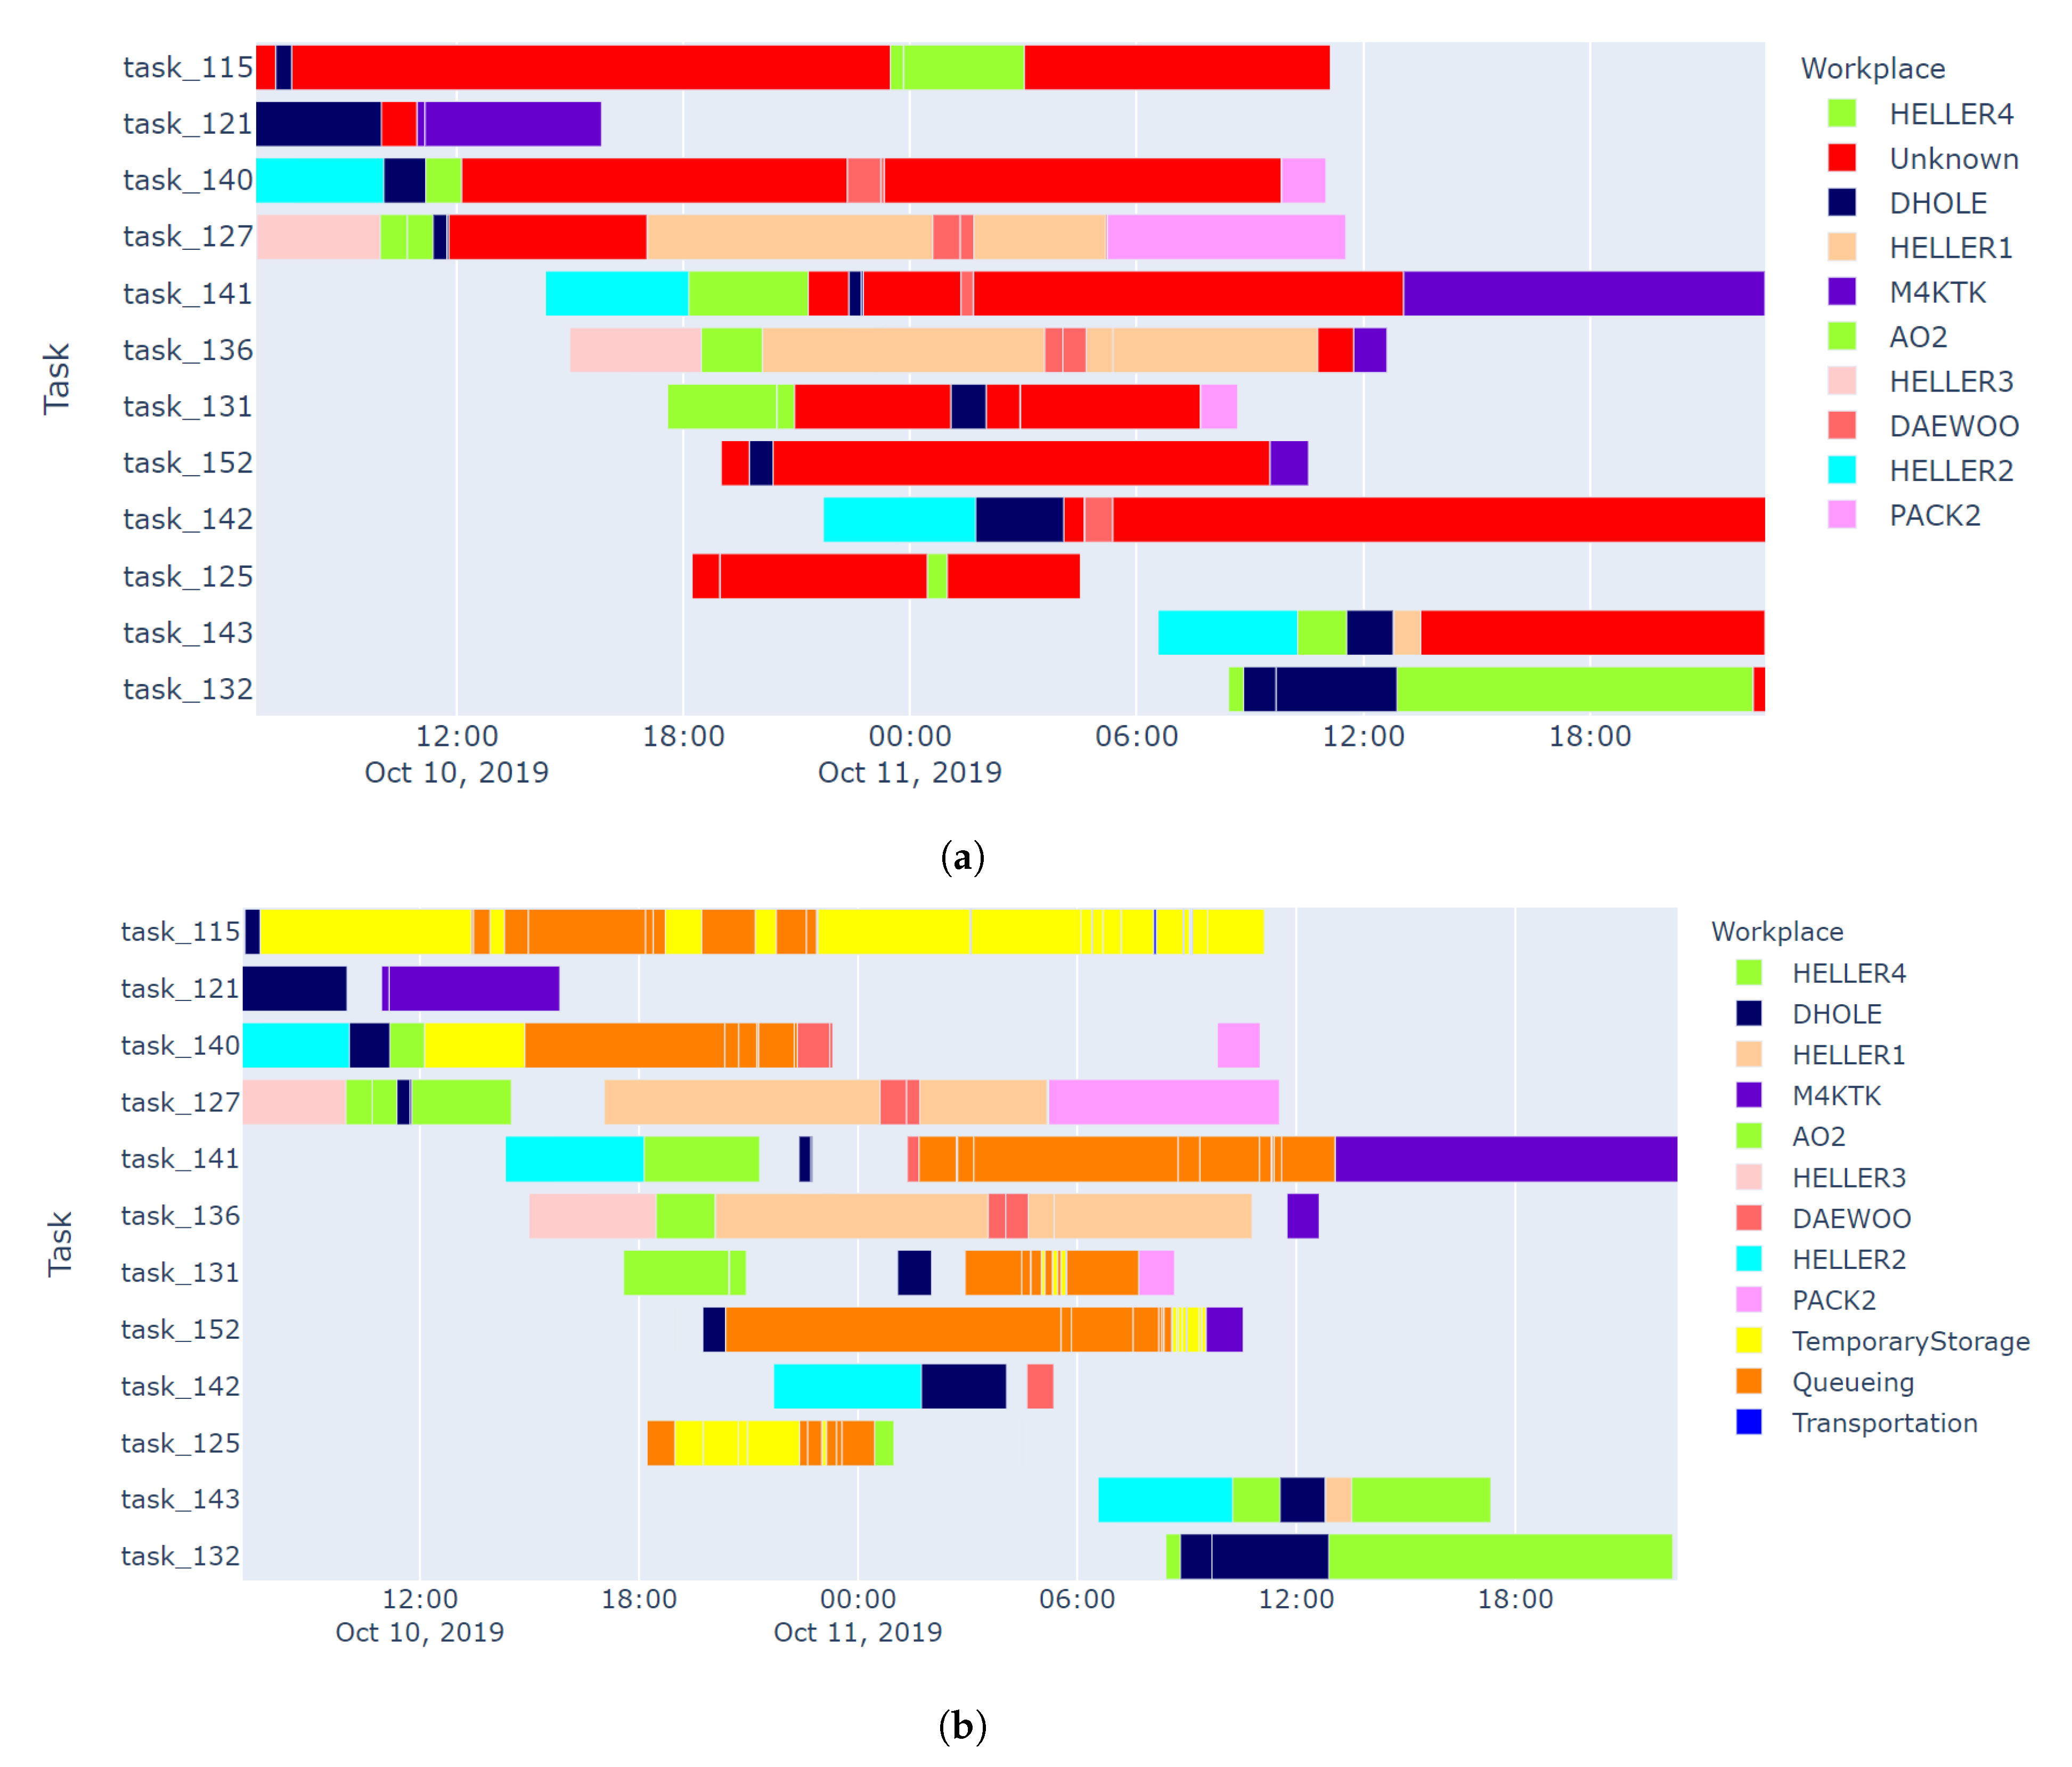
Figure 7.
The distribution of the average times calculated based on the IPS and MES data.

Table 1.
The traditional concepts of LM with the potential of IPS.
| Lean Concept | KPIs | Measurement Tools | Potential of IPS | Relevant Application of IPS |
|---|---|---|---|---|
| Shortest lead time | Average lead and cycle time | Camera [73,74]; Bar-code scanner [73]; RFID [62,75]; Machine/Event logs [76]; IPS [37] | high | Real-time monitoring of the position of semi-finished products and resources, calculation of the lead and cycle times [42,43]. |
| 7 wastes elimination | Waste of Transportation | RFID [66]; Machine/Event logs [76]; IPS [72] | high | Real-time spaghetti diagram [72]. |
| Waste of Inventory | Camera [30]; RFID [62,66]; IPS [72] | high | Tracked items in inventory areas [77,78]. | |
| Waste of Motion | Camera [74] | low | - | |
| Waste of Waiting | Camera [73,74]; Bar-code scanner [73]; RFID [62,75]; Machine logs [76]; IPS [37] | high | Tracked semi-finished products, waiting times, internal stock levels [71]. | |
| Waste of Over-processing | Manual audit [79] | low | - | |
| Waste of Over-production | RFID [66]; IPS [37,72] | high | Discovered overproduction based on the tracked semi-finished products [71]. | |
| Waste of Defect | Optical sensors [80]; RFID [81]; [72] | medium | Reduced defect based on IPS-based poke-yoke solutions and better monitored rework flows. | |
| Less inventory | inventory value | RFID [66]; IPS [72] | high | Improved control of the inventory level [78] and e-kanban solutions reduce internal inventories [82]. |
| Standardized work | Deviation from standardized work | Camera [74]; RFID [62]; IPS [37] | high | IPS based dynamic work instructions improve operator work (Smart operator) [83] |
| Continuous flow | Queueing time | RFID [62]; IPS [37,72] | high | Discovered queueing areas near the workstations [1]. |
| Line balancing | Line balance factor | Camera [74]; RFID [62]; IPS [37] | high | Improved activity time analyses thanks to sensor fusion [43]. |
| Quick changeover | Set-up and changeover time | Machine logs [84]; Manual audit [85] | high | Supported SMED projects [86] |
Table 2.
The cycle and queueing times calculated with the help of the positional data.
| Workplace | Average Cycle Time [min] | Queueing Time [min] | Produced Tasks |
|---|---|---|---|
| Waiting time | 119.47 | - | 54 |
| Waste of transportation | 2.73 | - | 27 |
| AO2 | 77.73 | 102.86 | 56 |
| DAEWOO | 84.71 | 84.05 | 49 |
| DHOLE | 88.69 | 5.09 | 163 |
| HELLER1 | 99.36 | 91.80 | 72 |
| HELLER2 | 228.53 | 46.74 | 34 |
| HELLER3 | 197.16 | 59.56 | 32 |
| HELLER4 | 124.82 | 42.18 | 146 |
| M4KTK | 61.91 | 84.61 | 145 |
| PACK2 | 30.30 | 47.72 | 31 |
Publisher’s Note: MDPI stays neutral with regard to jurisdictional claims in published maps and institutional affiliations. |
© 2021 by the authors. Licensee MDPI, Basel, Switzerland. This article is an open access article distributed under the terms and conditions of the Creative Commons Attribution (CC BY) license (https://creativecommons.org/licenses/by/4.0/).
Share and Cite
MDPI and ACS Style
Tran, T.-A.; Ruppert, T.; Abonyi, J. Indoor Positioning Systems Can Revolutionise Digital Lean. Appl. Sci. 2021, 11, 5291. https://doi.org/10.3390/app11115291
AMA Style
Tran T-A, Ruppert T, Abonyi J. Indoor Positioning Systems Can Revolutionise Digital Lean. Applied Sciences. 2021; 11(11):5291. https://doi.org/10.3390/app11115291
Chicago/Turabian StyleTran, Tuan-Anh, Tamás Ruppert, and János Abonyi. 2021. "Indoor Positioning Systems Can Revolutionise Digital Lean" Applied Sciences 11, no. 11: 5291. https://doi.org/10.3390/app11115291
Note that from the first issue of 2016, this journal uses article numbers instead of page numbers. See further details here.