1. Introduction
A tunnel boring machine (TBM) can be classified by its use of a shield, method of securing reaction force, face support, cutterhead type, and excavation method [
1]. As a closed-type TBM, the earth-pressure-balanced (EPB)-shield TBM is widely used in urban tunnels, where rapid excavation is required with high safety standards.
An earth pressure balanced (EPB) shield is generally used on TBMs excavating soft ground. Ideally, the support pressure of the EPB shield can be controlled by the screw-conveyor rotation speed and the TBM advance rate. However, most natural ground conditions are not ideally suited to EPB drives, and soils are often conditioned by the injection of water, polymers, and foams, to allow EPB shields to perform well. In addition, the pressure of the tunnel face is balanced with minimal surface settlement, as the chamber of the machine is filled with conditioned excavated materials (soil pastes) that act as a support medium at the tunnel face.
Successful excavation relies on the machine being optimized for the project conditions, which requires prediction of its excavation performance. Typical prediction methods include laboratory testing [
2], analysis of field data [
3,
4,
5,
6], theoretical approach [
7,
8], and numerical analysis [
9,
10,
11,
12,
13,
14,
15,
16,
17,
18,
19,
20,
21,
22,
23]. Among them, numerical analysis using the discrete-element method (DEM) is increasingly used in this field [
9,
10,
11,
12,
13,
14,
15,
16,
17,
18,
19,
20,
21,
22,
23], owing to rapid advances in computing power.
Rock-cutting tests of a TBM disc cutter can predict its excavation performance [
2]. Gong et al. [
9] used the UDEC software based on the DEM, to evaluate the impact of joint orientation on rock fragmentation using a TBM disc cutter; they demonstrated the applicability of DEM to the simulation of rock cutting tests. Gong et al. [
11] used the same method to evaluate the effect of joint spacing on rock fragmentation by TBM cutters. Bejari et al. [
13] used discrete-element analysis to concurrently evaluate the effects of both joint spacing and joint orientation on rock indentation and fragmentation. Recently, Fang et al. [
23] used a rigid body dynamics coupling program with DEM to evaluate disc cutter performance in soft strata. They analyzed the effect of penetration depth, linear velocity, and existing wear on disc cutter performance, based on the mutual interaction between the disc cutter and a weathered granite model.
Most studies have used DEM to comprehensively evaluate TBM excavation performance, including modeling both TBM excavation and the ground. Maynar and Rodríguez [
10] conducted the first discrete-element analysis evaluation of an EPB shield TBM. They then modeled a mixed-face ground composed of six different layers, and simulated its excavation by a 9.4 m-diameter TBM. They assessed the required torque, thrust force, and muck discharge rate. However, their method’s limitations included a large particle size in the ground model (diameter, 600 mm) and an oversimplified TBM model. Wu and Qu [
12] simulated the flow and strength characteristics of conditioned sands by DEM as preprocessing for the EPB-drive simulation, and determined sand calibration DEM parameters by slump and direct-shear tests. Based on the parameters obtained from Wu and Qu [
12], Wu et al. [
14] created the ground model and a detailed TBM model, based on a real EPB shield TBM (diameter, 6.14 m) used for line 4 of the Beijing metro. They evaluated the chamber pressure and cutter force of each disc cutter as well as the required thrust, torque, and muck discharge rate. Furthermore, they verified the results via comparison with field data to evaluate the reliability of the simulation. However, the simulation was conducted using only one speed of the cutterhead rotation (revolutions per minute, RPM). It, therefore, did not allow comparison of the torque, thrust, or cutter force (which depend on the cutterhead RPM).
Lee et al. [
16,
17] used discrete-element analysis to evaluate excavation by both spoke-type and face-plate EPB shield TBMs (diameter, 6–7 m). Unlike the previous studies [
10,
12,
14] that used the PFC3D commercial software, they used EDEM commercial software because of its advantage of being able to couple other analysis methods, such as multi-body dynamics and the finite element method. Although coupled analysis is attractive as both the ground and the TBM should be considered concurrently for an accurate simulation of excavation, Lee et al. [
16,
17] evaluated the TBM excavation performance using only EDEM, without other coupled workings. However, their simulations were conducted at an introductory level.
This study aimed to evaluate the overall excavation performance of a 7.73-m-diameter EPB-shield TBM under various operating conditions, without consideration of soil conditioning or additional support pressure in the chamber. The TBM model comprises six parts—cutterhead, disc cutters, cutter bits, chamber, shield, and screw conveyor. A ground model of size 1.5 m (width) × 15.6 m (length) × 14.6 m (height) is created from 400,000 spherical particles (diameter, 100 mm) that are introduced once the TBM geometry is in place. The operation conditions are optimized based on these two models, simulating excavation for 360 s at four cutterhead RPMs and three screw conveyor RPMs.
3. Analysis of Numerical Simulation Result
The TBM performance indicators of compressive force, pressure, torque, wear, and mass flow rate were evaluated from the simulation.
The compressive force was determined from the sum of the normal contact force magnitudes (
Figure 5a). This sum was calculated from the product of the average normal contact force and the contact frequency at data write-out points. The normal contact force was obtained from two bodies in direct contact and acted perpendicular to each body. The pressure was determined from the compressive force and the geometry’s surface area, which was composed of structured meshes [
31].
The torque on the geometry was the product of the tangential contact force between two bodies and the distance from the center of mass to the contact point (
Figure 5b). The tangential force was the force from the tangential overlap. The total torque was calculated from the torque and moment around each geometry element. The sum of the torque from each element was converted to the total torque on the entire geometry about the center of mass, and was plotted along the selected axis [
31].
Wear is defined as the gradual loss of mass from the movement of a body’s surface, arising from its relative motion [
32]. Relative wear of the cutterhead, cutting tools, and screw conveyor was analyzed using a relative wear model based on energy. Although there are various kinds of wear, impact wear (defined as the normal force on each element of the geometry) was selected for wear evaluation. Based on the energetic approach, the total normal contact energy was derived as follows:
where
En is the normal cumulative contact energy,
Fn is the normal contact force,
Vn is the normal relative velocity, and
δt represents each time interval.
The energy approach shows that the disc cutter’s impact damage could accumulate as energy and gradually increase over time [
33]. The variation of the normal cumulative contact energy of the geometry (from the beginning of excavation) was used to indicate the impact wear.
The muck discharge rate was defined as the mass flow (kg/s), owing to the rotation of the screw conveyor—it was the total mass of particles per unit time measured and recorded by a mass-flow sensor (
Figure 6). The sensor’s domain in the x-direction was set at 770 mm and fixed relative to the TBM shield geometry.
3.1. Analysis of Ground Model
3.1.1. Pressure Acting on Plates of the Ground Model
Figure 7 shows the results for the lateral pressure, depending on the simulation time and depth. Pressure was estimated from the frictionless plate type geometry with size 17 m (length) × 1 m (height) composing the ground, located in front of the cutterhead face. The vertical pressure, defined as the overburden load, was maintained almost continuously at 265 kPa during the simulation. The estimation of lateral pressure appeared to vary with the plate’s depth. Unlike the overburden load, lateral pressure was not continuously controlled during the simulation. Rather, the lateral pressure caused by gravity and the overburden load was measured in the virtual plate geometry as a reaction force, with the measured lateral pressure fluctuating more than the overburden load.
Figure 8 plots the average lateral pressure acting on the plate with respect to the depth. The average pressure tends to increase as the depth increases, although that acting on plate No. 7 was estimated to be lower than that on plate No. 8. The pressure acting on the lowest plate (No. 8) was 1.5 times that on the uppermost plate (No. 1). Until the depth of 6.0 m, the pressure acting on each plate increased 1.1 times for every 1 m increase in the depth of the plate from the top of the TBM cutterhead. Based on the earth pressure theory, depth and lateral pressure are directly related, but as lateral pressure was not controlled by the servo system, in this study they were not related. However, it is quite clear that they exhibit an almost linear proportional relationship.
3.1.2. Stability of the Ground Model
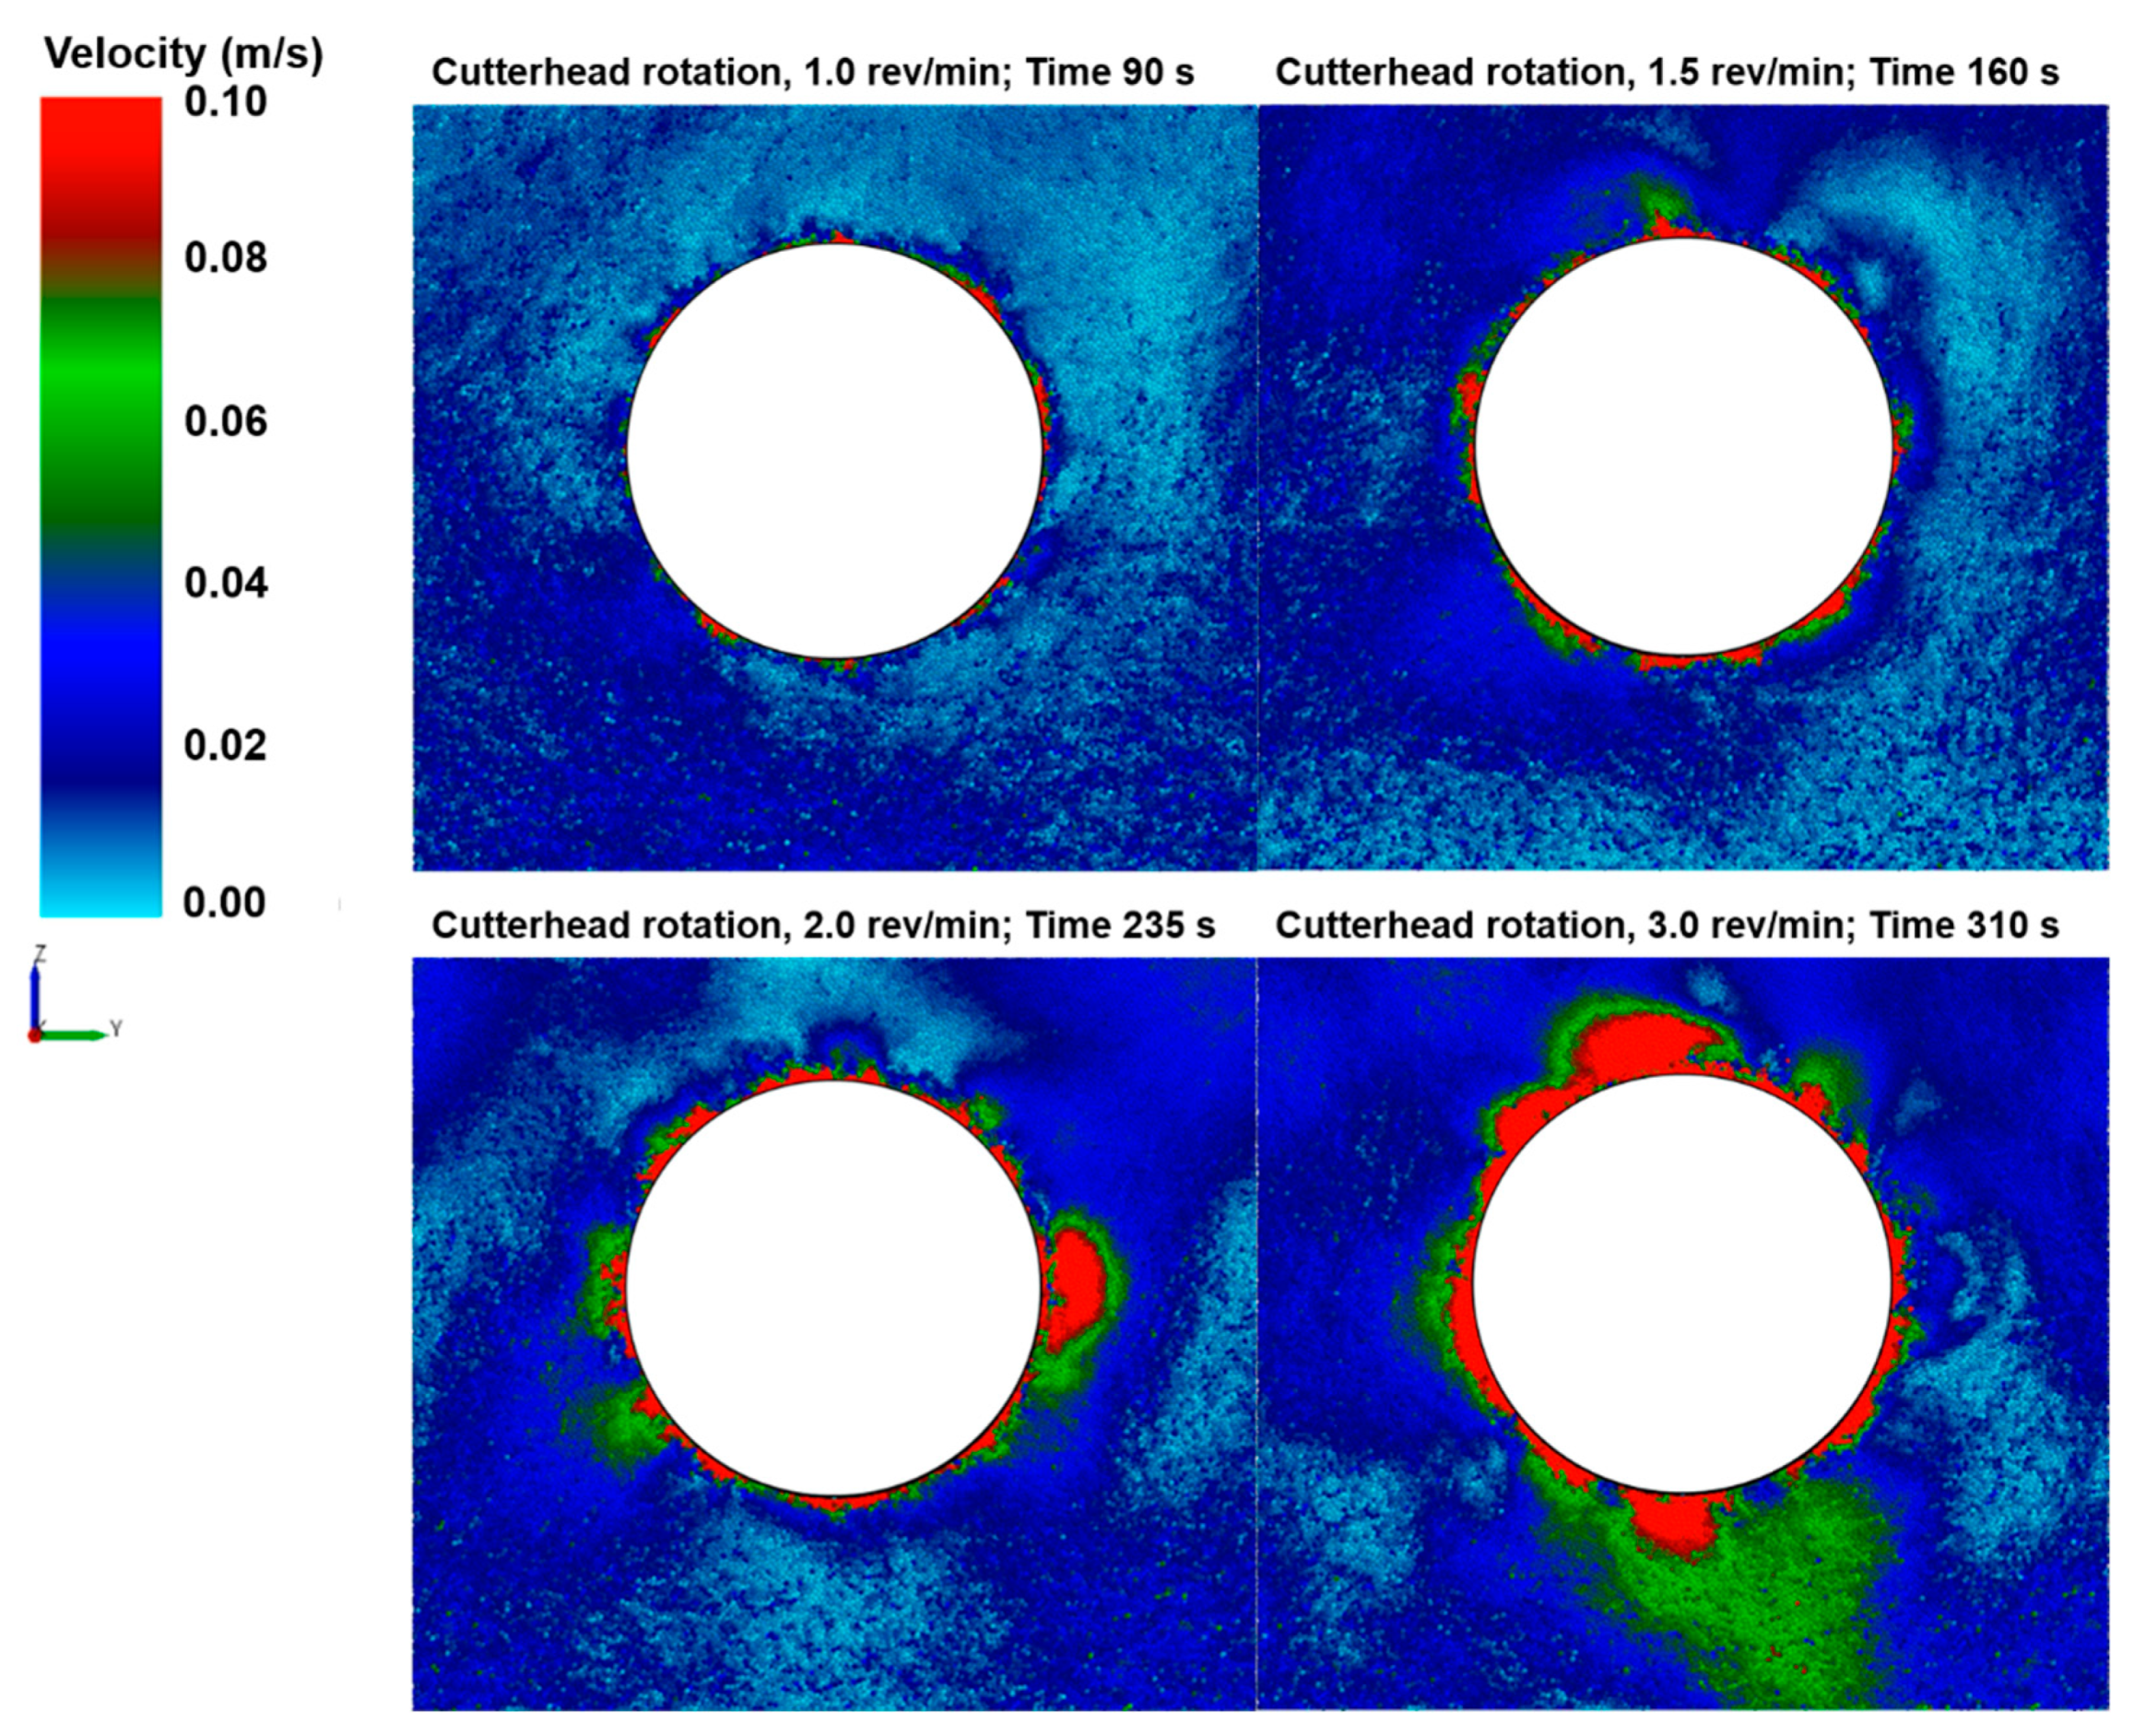
Figure 9 shows the variation of the soil particles’ velocity with respect to cutterhead rotation speed from the rear view of the TBM advance at a specific simulation time. At 1.0 rev/min, only particles around the TBM have a relatively high velocity as compared to those elsewhere in the ground. In contrast, increasing the cutterhead rotation to 3.0 rev/min greatly increased the velocity of particles around the TBM. The propagation of the disturbance zone around the tunnel face appeared to increase throughout the ground model, as the areas colored green and red were larger.
3.2. Analysis of TBM Chamber Model
3.2.1. Velocity of Particles in the Chamber
Figure 10 shows the soil particles’ velocity in the chamber with respect to the cutterhead’s rotational speed at a specific simulation time. Their overall velocity increased as the cutterhead rotated more quickly. A particle further from the chamber’s center will tend to move more quickly than one centrally located. Therefore, particles at the chamber’s center showed lower fluidity than those further from the center. A lack of opening in the central area of this TBM’s cutterhead appeared to be the cause of the low flow of particles in the center of the chamber. This tendency is frequently observed in the field—the center of a TBM’s cutterhead is generally the first area to become blocked or clogged, rather than the face or gauge area [
34].
3.2.2. Number of Particles in the Chamber
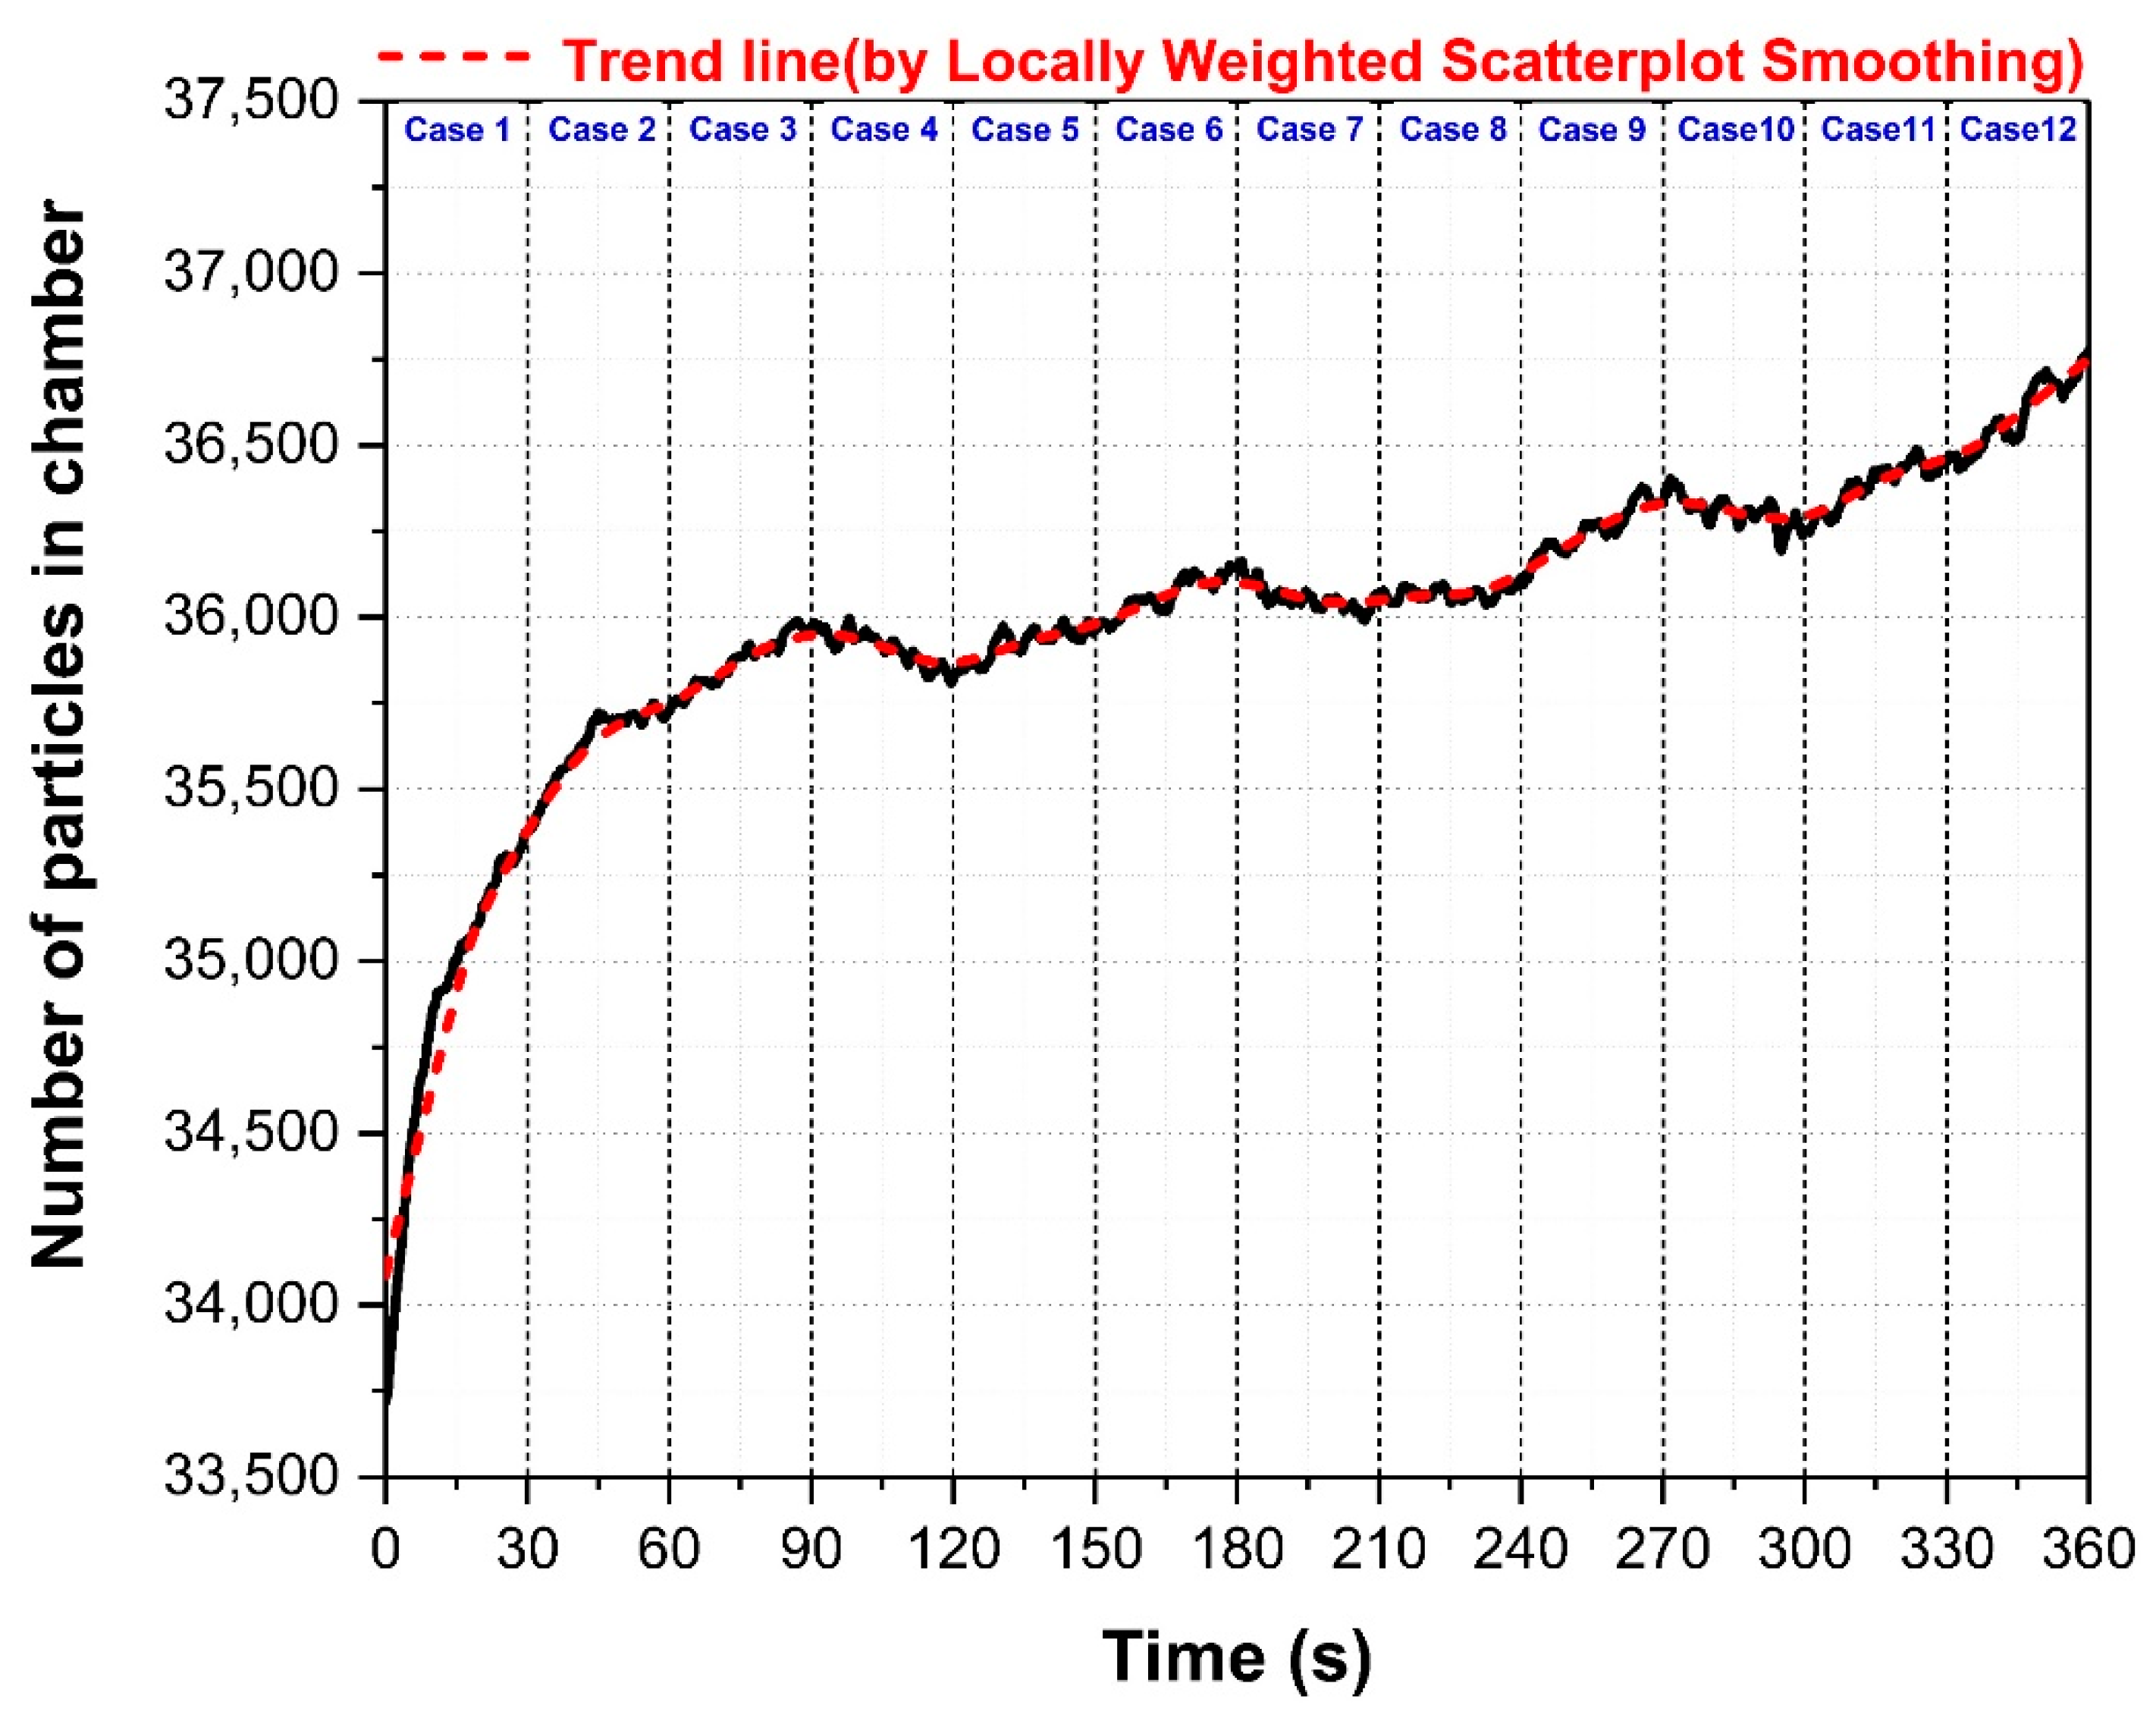
Figure 11 shows the variation of the total number of particles in the chamber during the simulation. As the cutterhead’s rotational speed increased, there were overall more particles in the chamber. The number of particles in the chamber greatly increased in the first 90 s. The rate of increase tended to decrease as the screw’s rotational speed increased. The simulation started with some particles already in the chamber and screw conveyor. A sudden inflow of particles from the cutterhead to the opening area was expected to occur immediately upon starting the simulation. This inflow affected the chamber system regardless of the chosen screw rotational speed.
Table 5 summarizes the standard deviation (SD) of the number of particles in the chamber with respect to simulation time under different operating conditions. Case 8 had the lowest value (SD = 18) with 2.0 rev/min cutterhead speed and 9.0 rev/min screw-conveyor speed, followed by Cases 7 and 10. Apart from the initial 90 s of simulation, the SD of the number of particles was highest at 6.0 rev/min screw-conveyor speed.
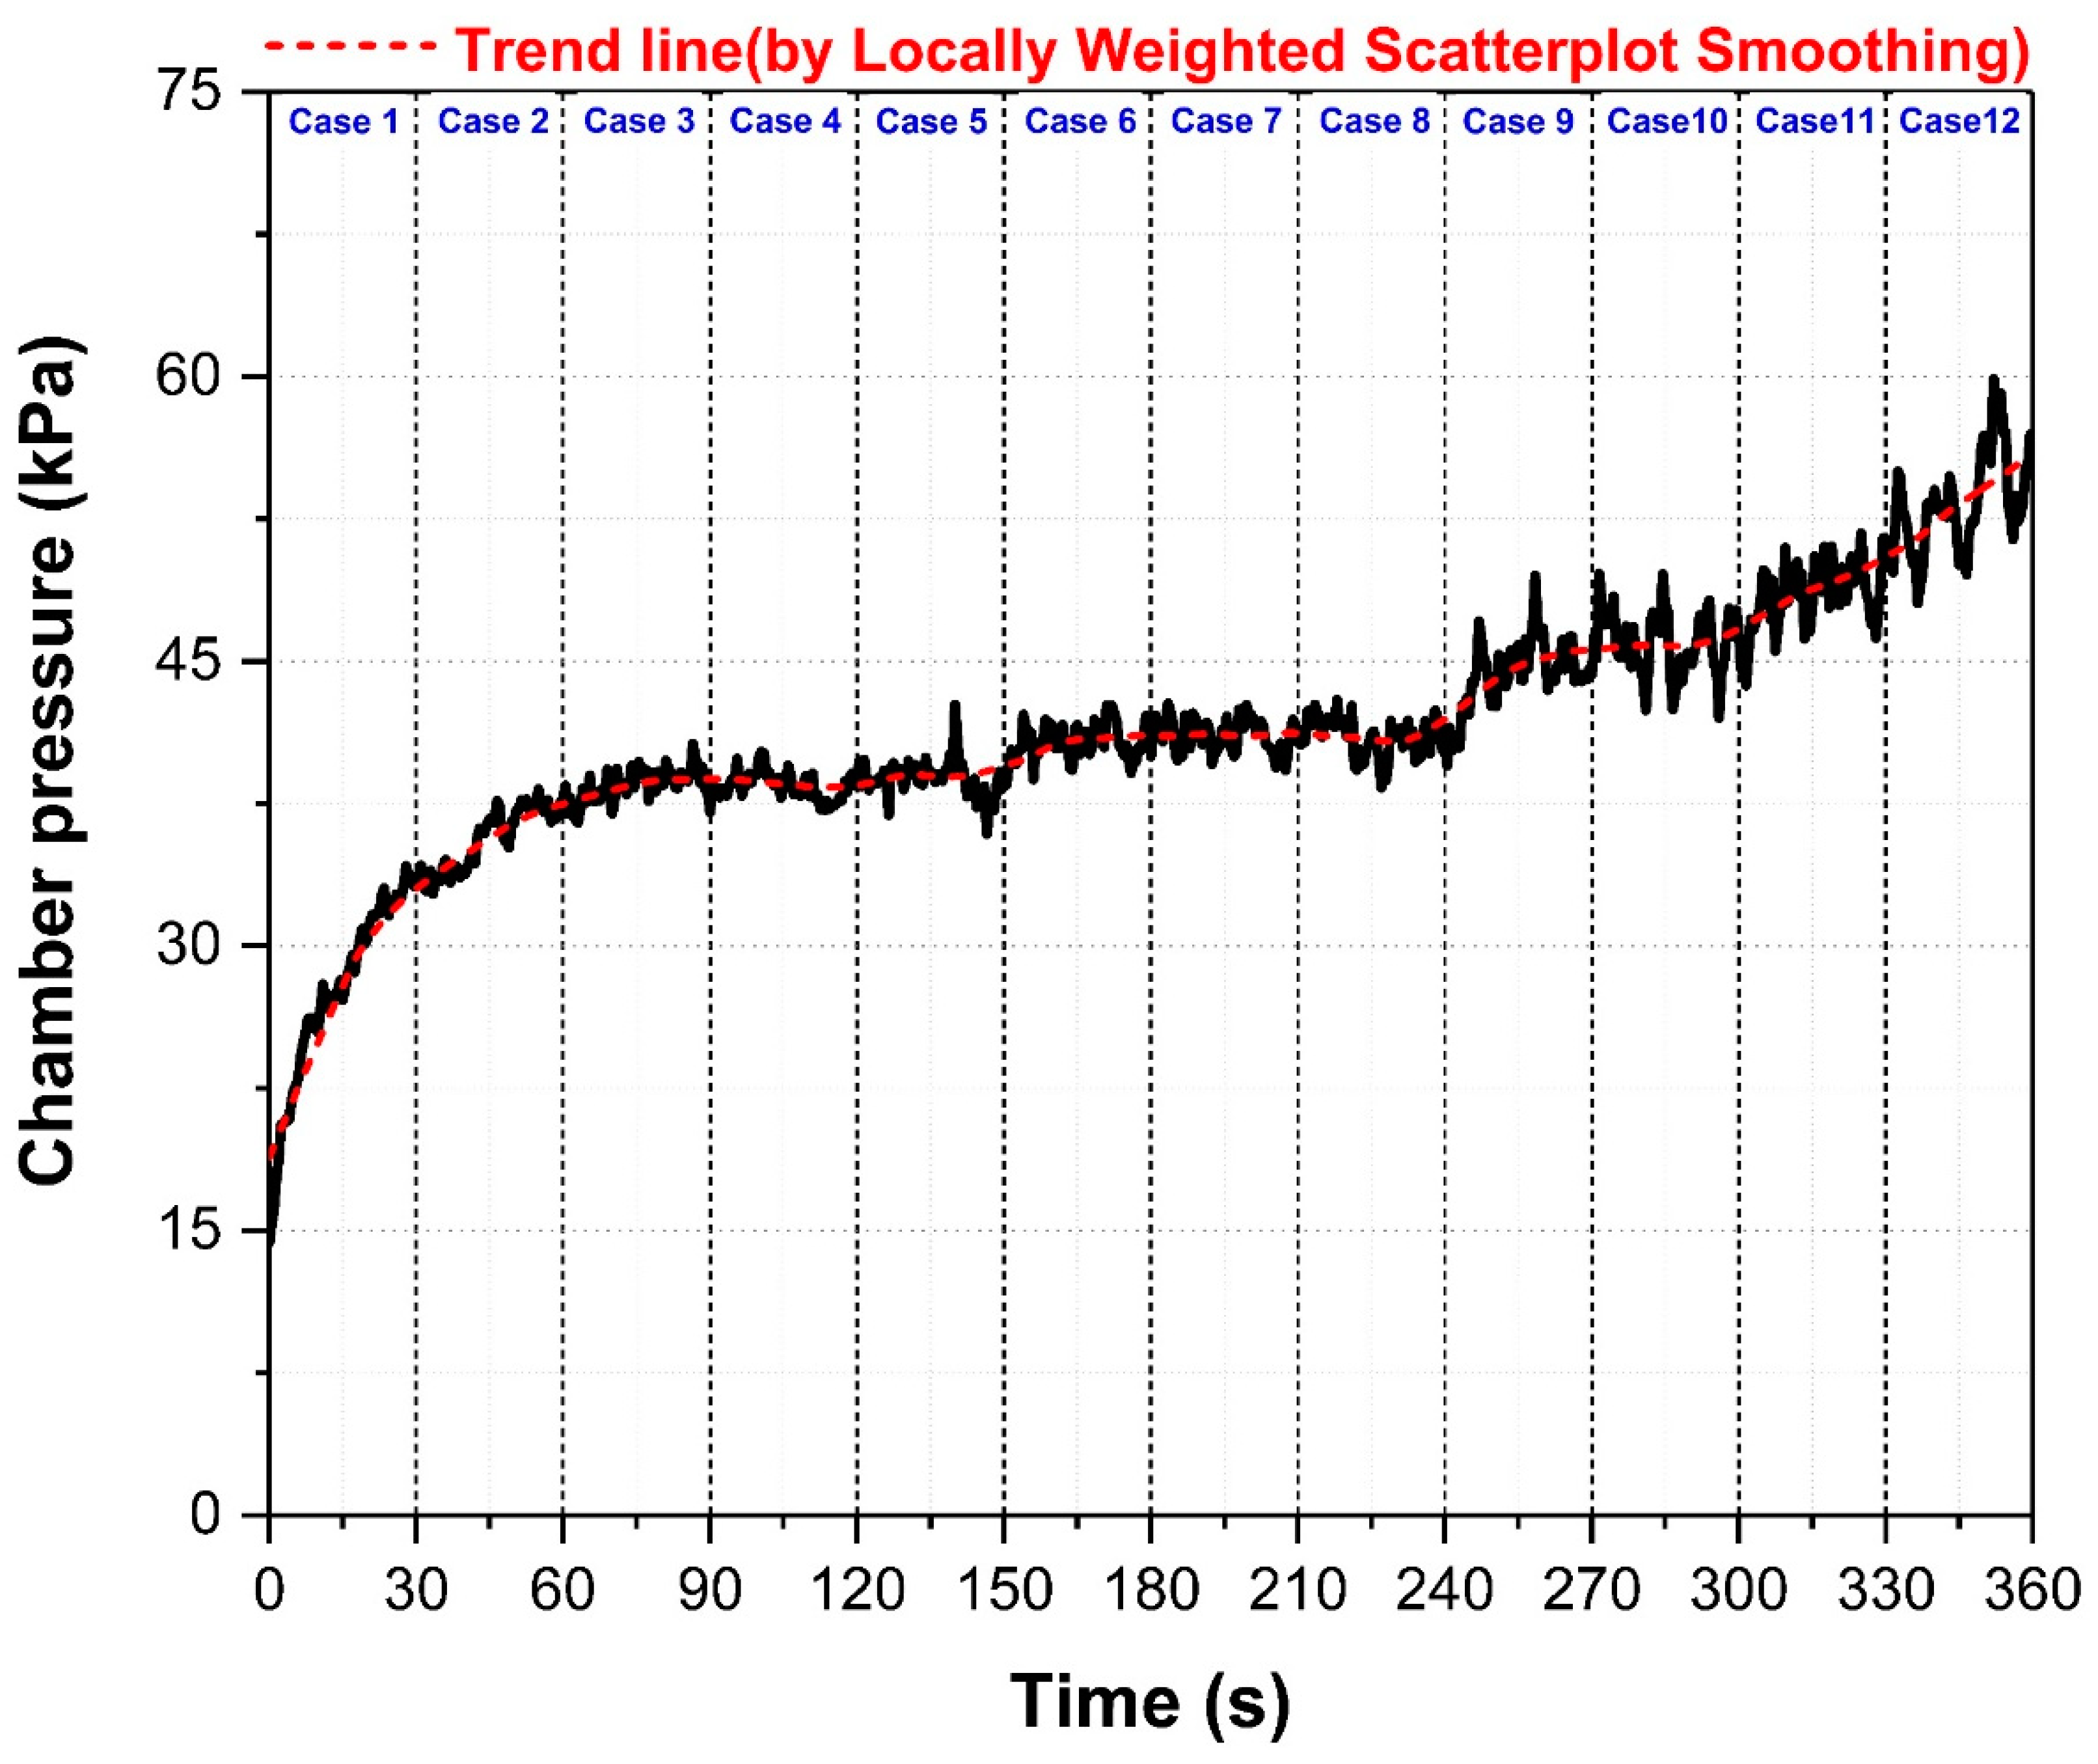
3.2.3. Pressure Acting on the Surface of the Chamber
Figure 12 shows the pressure acting on the chamber surface during simulation. As explained in
Figure 11, the expected sudden inflow of particles from the cutterhead to the opening area would affect the chamber system regardless of the conditions of screw rotation speed in the first 90 s.
Table 6 summarizes the average chamber pressures and the SD of chamber pressures, with respect to operating conditions. As the cutterhead speed increased, the chamber pressure increased at the same screw-conveyor speed. The chamber pressure increased as the screw-conveyor speed decreased to 6.0 rev/min at the same cutterhead speed. Furthermore, the chamber pressure increased by 6.0% to 16.0%, as the screw-conveyor speed decreased to 6.0 rev/min and the cutterhead speed increased to 3.0 rev/min. For Case 4 to Case 6, the pressure increased by ~6.0%; for Case 10 to Case 12, it increased by ~16.0%. Comparing cases 3 and 4, the average chamber pressures were almost constant with the cutterhead speed increasing from 1.0 to 1.5 rev/min and screw-conveyor speed from 6.0 to 12.0 rev/min. In cases 9 and 10, the average chamber pressure increased by ~3.8%, implying that the screw-conveyor rotation speed should be >12.0 rev/min to balance chamber pressure.
Case 4 shows the lowest value of the SD of chamber pressure (0.72) under the conditions of 1.5 rev/min cutterhead rotation and 12.0 rev/min screw conveyor rotation, followed by Cases 3 and 7. The pressure acting on the chamber surface could be estimated differently, depending on the total mass of particles in the chamber and each particle’s mechanical energy contacting with the chamber surface. Therefore, it was expected that the trends of the two plots in
Figure 11 and
Figure 12 would be slightly different.
3.3. Analysis of TBM Cutterhead Model
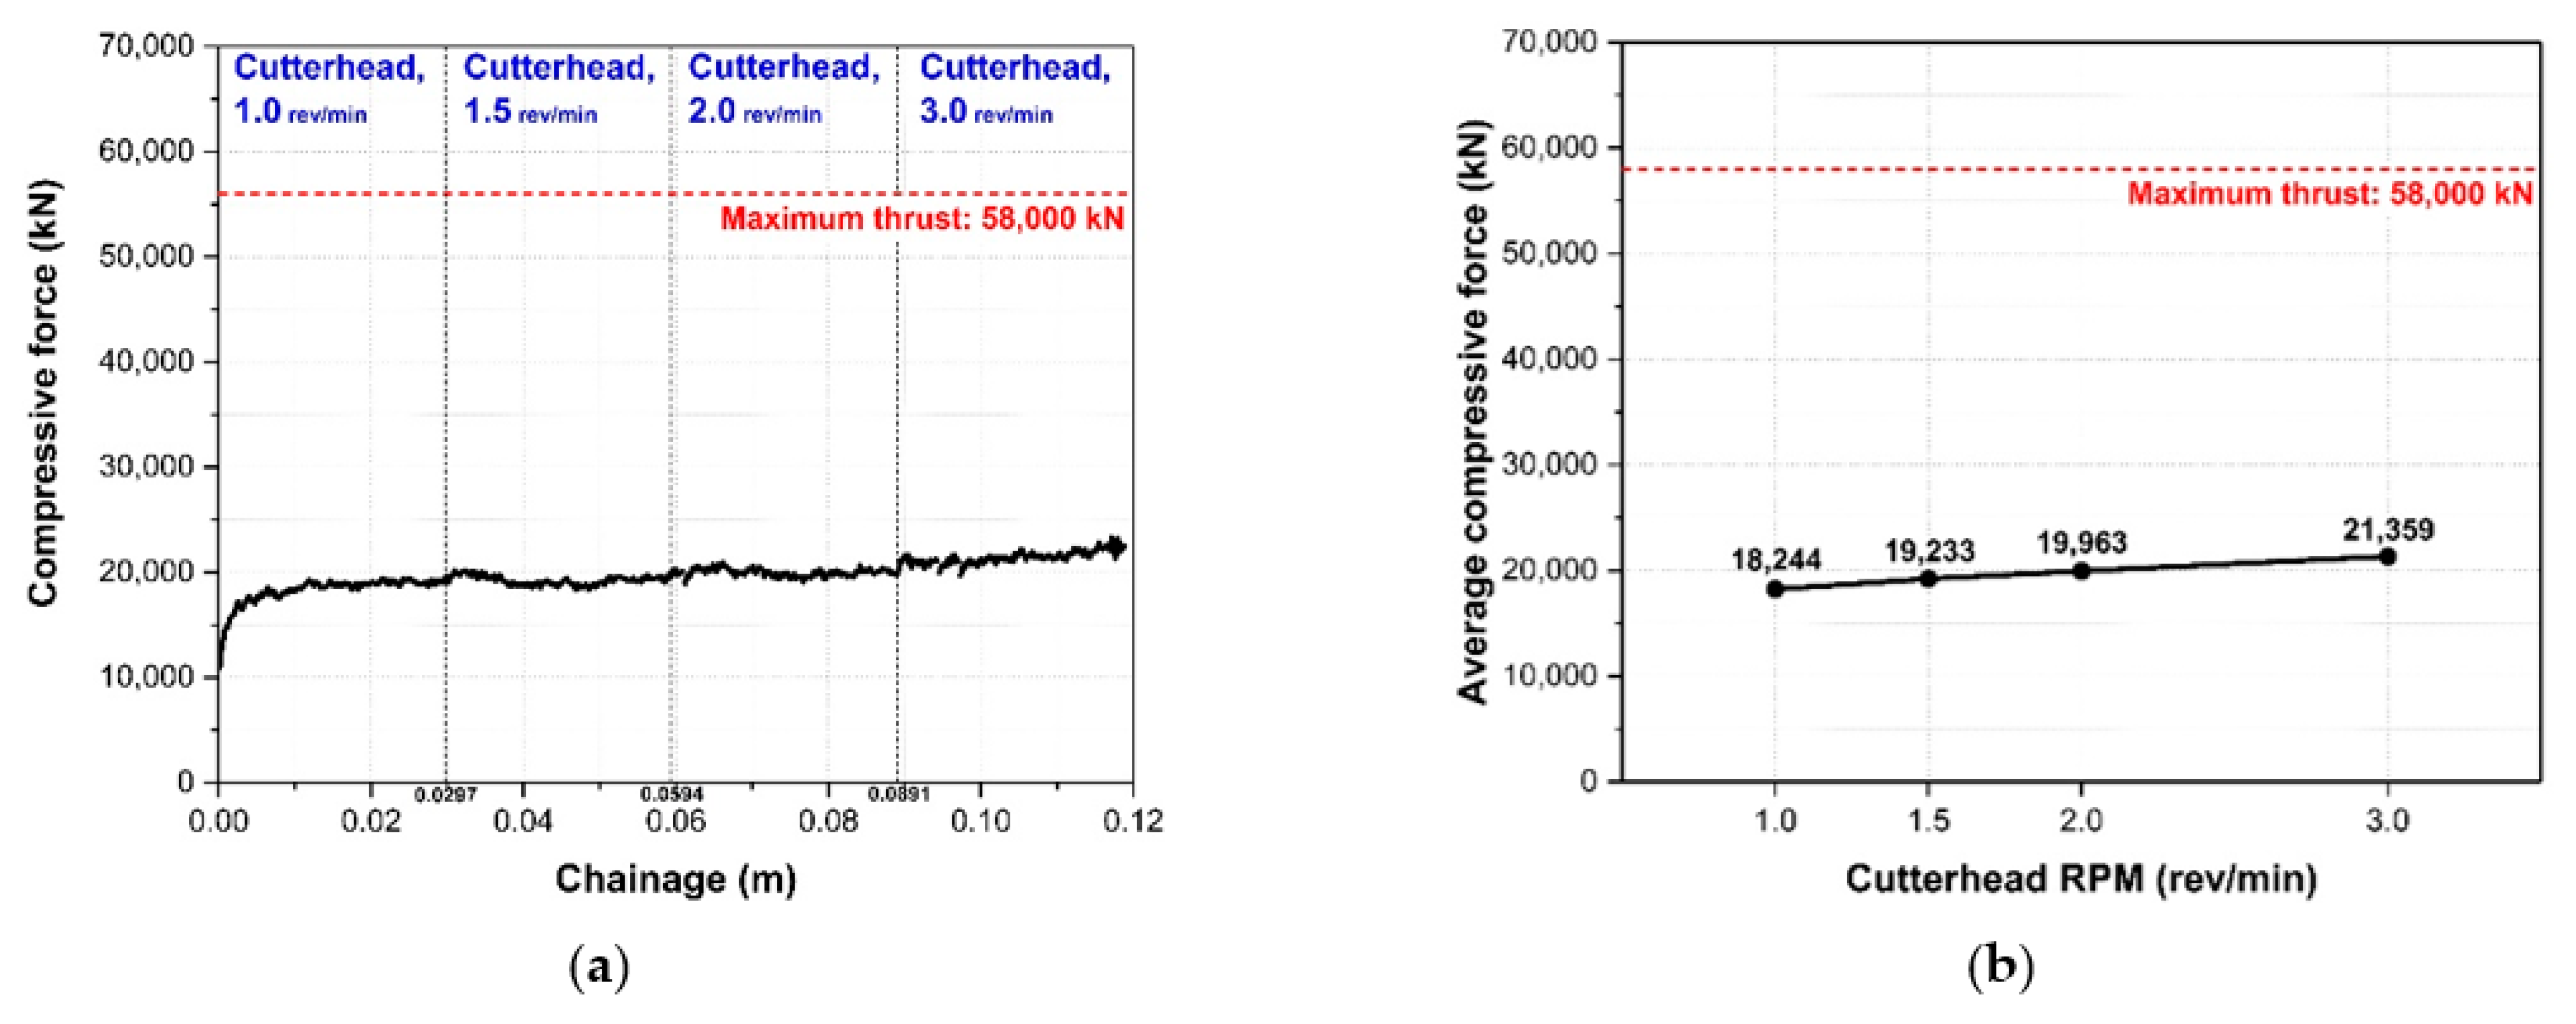
3.3.1. Compressive Force Acting at the Cutterhead’s Face
Here, the TBM compressive force was calculated from the sum of normal forces between the particle and TBM cutterhead, and it was, therefore, parallel to the advance-direction axis.
Figure 13a plots the compressive force acting on the TBM cutterhead as the TBM advanced. The plot of the average compressive force in
Figure 13b clearly shows that as the cutterhead RPM increased, the overall compressive force also increased. The DEM simulation showed that the calculated compressive force on the cutterhead and disc cutter could be considered to be a component of the required thrust force. Based on this consideration, the average compressive force on the cutterhead was estimated to be 31–37% of the actual TBM’s maximum thrust.
3.3.2. Torque and Driving Power of the TBM Cutterhead
Figure 14a presents the torque on the TBM cutterhead as the TBM advanced. The torque increased as the cutterhead RPM increased.
Figure 14b clearly shows that the overall torque increased to ~7000 kN∙m as the cutterhead’s rotation increased to 3.0 rev/min. The average torque on the cutterhead was estimated to be 50–70% of its actual maximum, under different conditions of the cutterhead RPM.
Power (kW) could be calculated as follows from the torque (kN∙m) and RPM:
Figure 15a presents the driving power required to drive the cutterhead as the TBM advanced.
Figure 15b shows that the calculated power increased dramatically as the cutterhead rotation increased to 3.0 rev/min; however, at 3.0 rev/min, the required power exceeded the actual maximum capacity of TBM.
3.3.3. Correlation between Compressive Force and Cutterhead Torque
The calculated compressive force on the cutterhead could be evaluated as part of the TBM’s total thrust.
Figure 16a shows that the compressive force and torque on the cutterhead were related by a regression equation with an exponential function. The cutterhead torque and TBM thrust would thus be closely related as the TBM advanced.
Figure 16b shows the ratio of compressive force and torque as the TBM advanced. The ratio gradually decreased as the cutterhead’s rotation increased from 1.0 to 3.0 rev/min.
Table 7 shows the calculated average and the SD of the ratio for different operating conditions. Case 2 shows the highest average ratio of about 3.72, and Case 11 shows the lowest SD of the ratio. Overall, the average and SD of the ratio decreased as the cutterhead RPM increased. The ratio of thrust and torque was a critical indicator for evaluating a TBM’s excavation performance. If the TBM met adverse geological conditions, the ratio increased abruptly. As successful excavation generally showed low fluctuation in the ratio as the TBM advanced, Case 11 had the most appropriate conditions in terms of operational management.
3.4. Analysis of TBM Disc Cutter Model
3.4.1. Compressive Force Acting on the Disc Cutter
The cutterhead face could be divided into three zones—center, face, and gauge area. The compressive force acting on a disc cutter depended on its position on the cutterhead.
Figure 17 shows the estimated compressive forces acting on all disc cutters to be <311 kN, the amount allowable on a 19-inch disc cutter.
Table 8 shows that the higher compressive forces acted on a few disc cutters (19, 30, 43, 50, and 51) close to the center of the cutterhead, while the lower compressive forces acted on certain other cutters (7, 24, 31, 32, and 49). The five central disc cutters, thus, appeared vulnerable to impact damage during excavation, a trend confirmed by analysis of TBM wear during excavation in the field [
3]. To protect the disc cutters from impact damage, those at the center were generally twin- or double- types, with a higher maximum load capacity instead of single disc cutter types.
Similar to the results for the cutterhead (
Figure 13b), the average compressive force on all disc cutters increased as the cutterhead RPM increased, and was estimated to be 16–17% of the compressive force acting on the cutterhead. Furthermore, the total compressive force acting on the disc cutters and cutterhead were estimated to be 37–43% of the actual TBM’s maximum thrust (
Figure 18).
Figure 19 shows the dependence of the average compressive force acting on each disc cutter on the cutter’s distance from the cutterhead center. The force tended to decrease as the distance increased to ~1750 mm. Moving farther outward from 1750 mm to the gauge area, it increased, remained constant, and then decreased. As there was no opening at the center of the cutterhead, a localized high pressure could emerge that decreased the fluidity of the surrounding soil particles [
34]. The high pressure could also greatly affect any centrally placed disc cutter. As the radius from the center increased, the radial opening ratio and the fluidity of the soil particle also increased. The pressure on the disc cutter therefore decreased. However, as the radius from the center increased to 2240 mm, close to the connection between the main spoke and two auxiliary spokes, this connection acted as a barrier to decrease the flow rate. Hence, the compressive force acting on the disc cutter increased abruptly, and the fitted trend line of force with respect to the radius from the center also changed.
3.4.2. Impact Wear Estimated from Disc Cutter
Here, the impact wear was calculated from the sum of normal contact forces between particles and each TBM disc cutter.
Figure 20a presents the gradual accumulation of average total normal contact energy in all disc cutters, as the TBM advanced during the simulation.
Figure 20b presents the variation of the average total normal accumulative contact energy in all disc cutters. It clearly increased as the cutterhead RPM rose.
Figure 21 and
Table 9 show the normal cumulative contact energy in each disc cutter after excavation. The gauge disc cutters (shown in red) at the transition zone of the cutterhead have higher energy, while those centrally placed (shown in blue) have lower energy compared with the rest. Overall, the figure shows that a disc cutter’s wear depended significantly on its position on the cutterhead and the layout pattern. Therefore, a gauge disc cutter in the transition zone of the cutterhead was expected to be replaced frequently during the excavation [
3,
4,
5,
6,
7,
8].
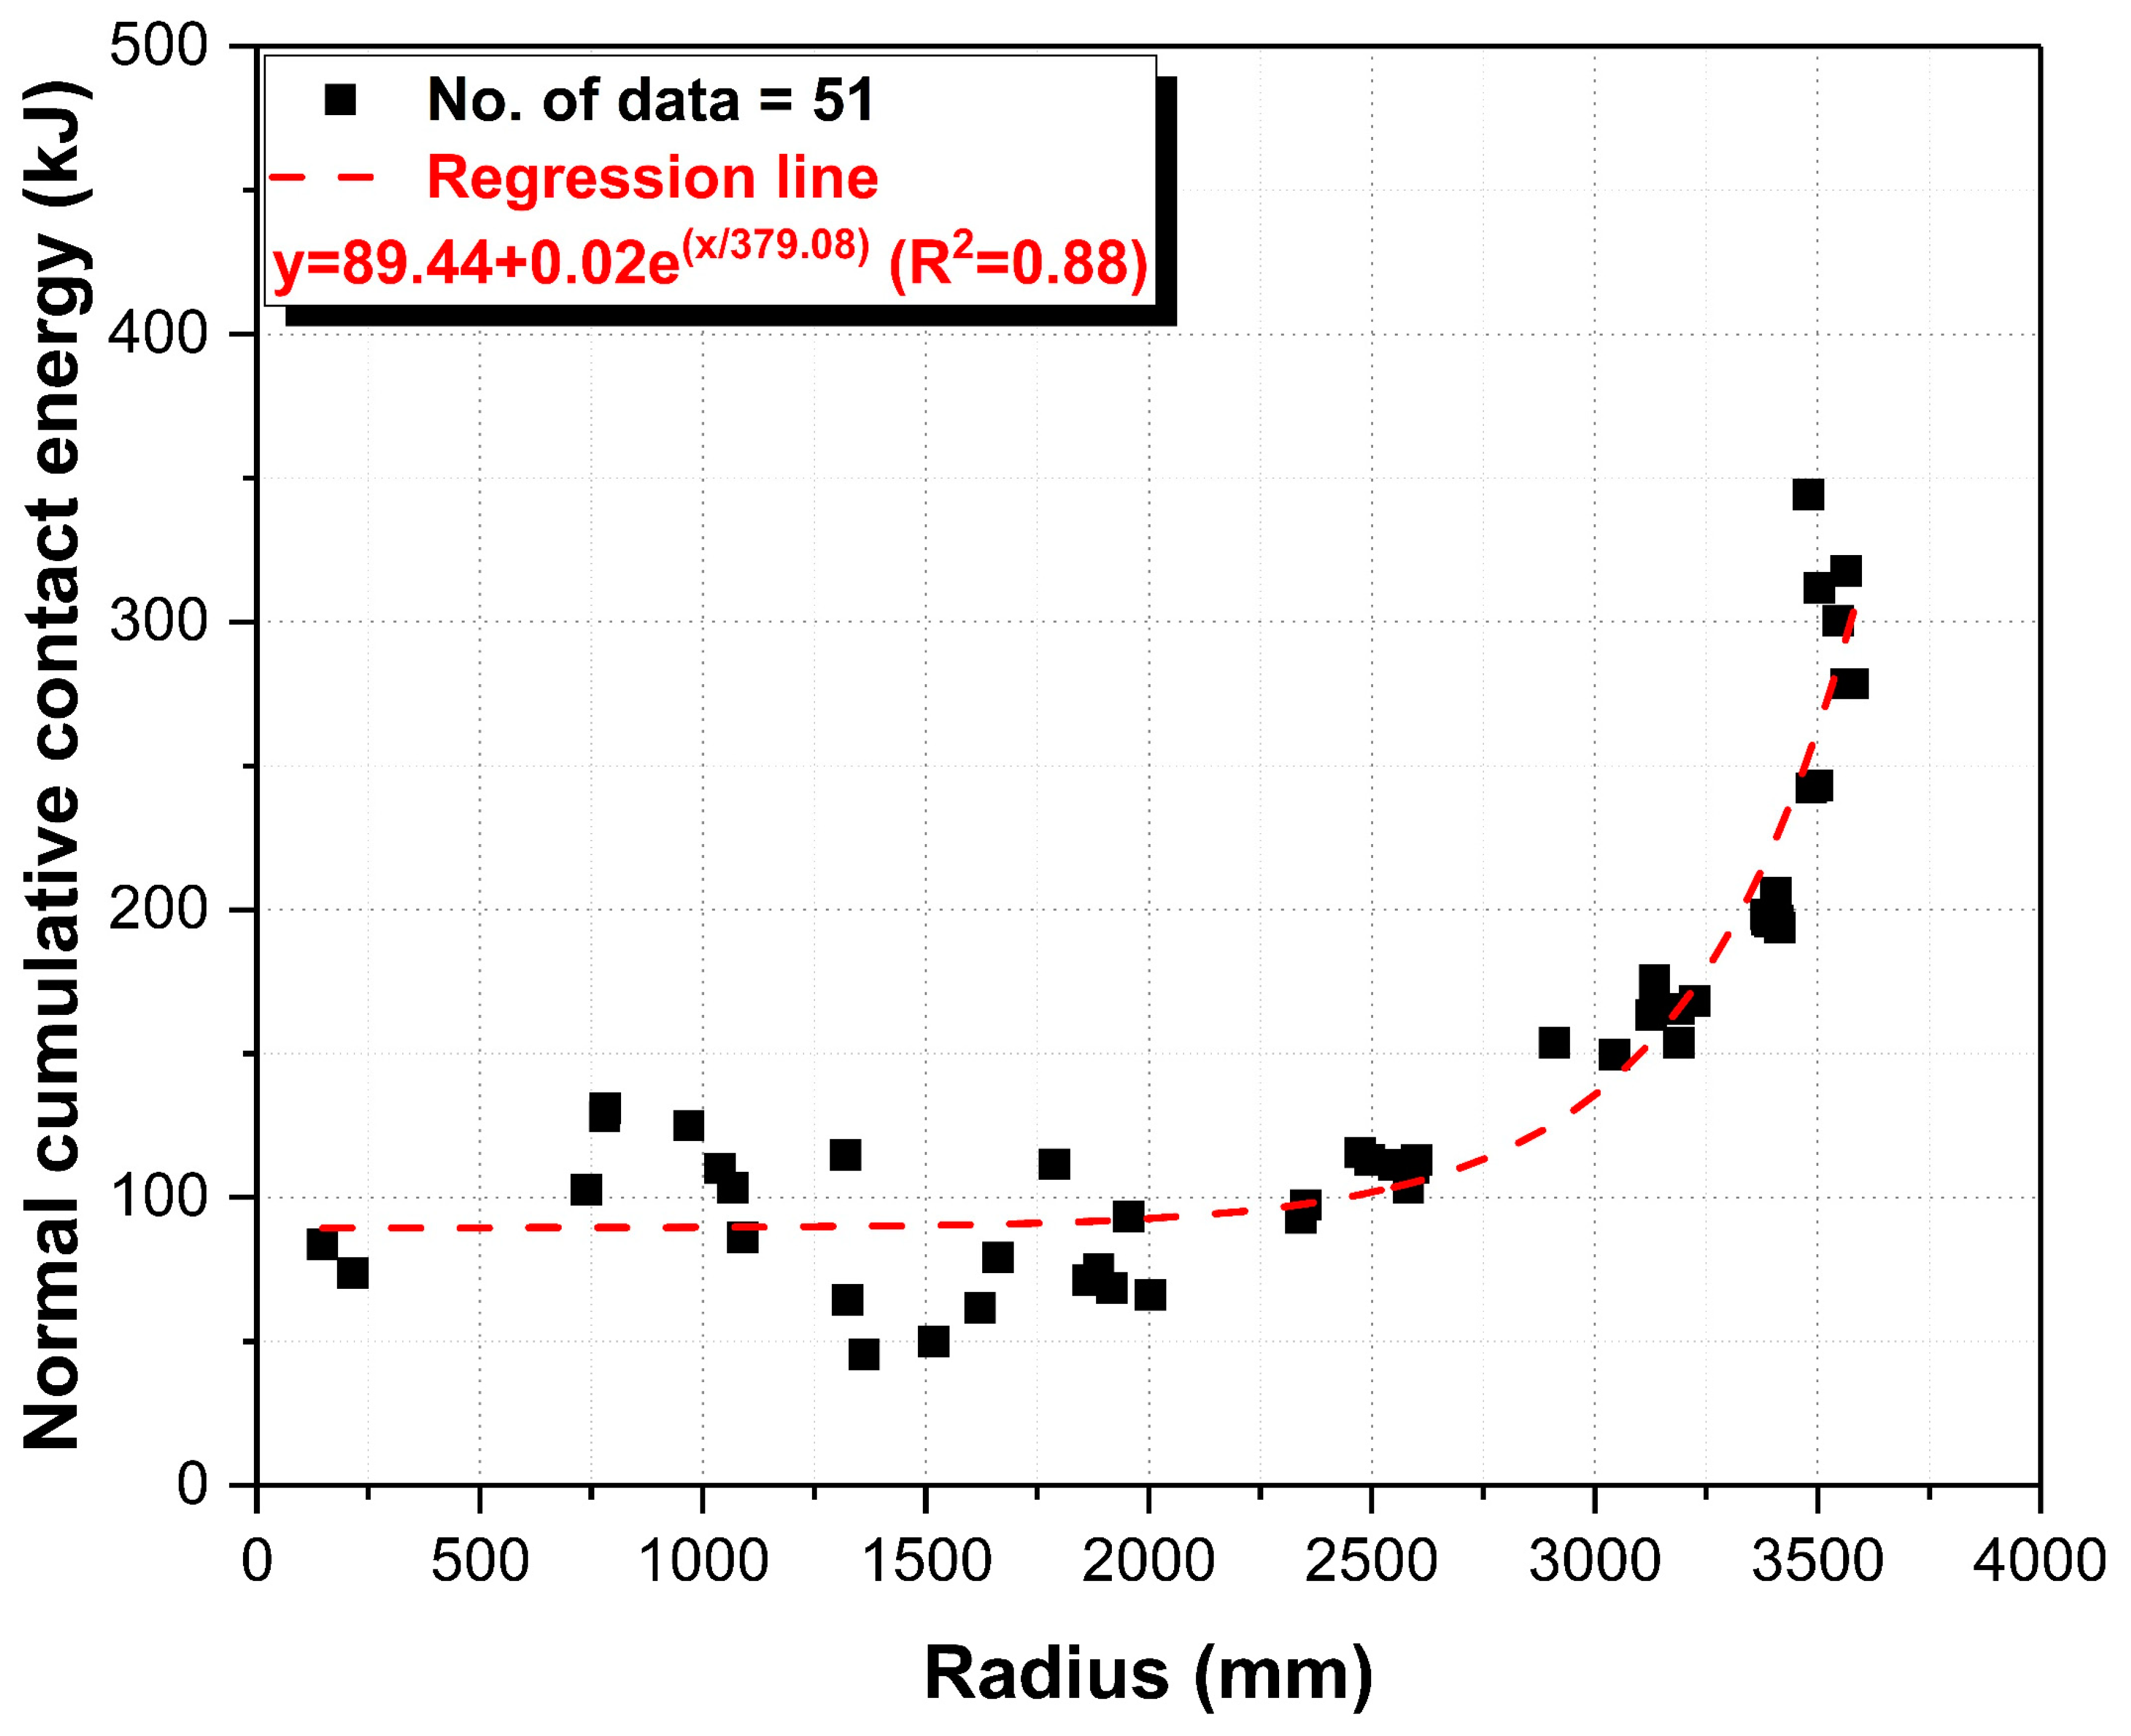
Figure 22 shows the results of each disc cutter’s normal cumulative contact energy with respect to its radial area on the cutterhead. There was no clear correlation between radial distance and normal cumulative contact energy until the radial distance increased to 2000 mm. Above this distance, the disc cutter’s normal cumulative contact energy increased significantly as its radial distance increased.
3.5. Analysis of Screw Conveyor Model
3.5.1. Particle Mass Flow Rate Measured from Screw Conveyor
The muck discharge rate was evaluated from the specific domain’s particle mass flow rate, as presented in
Figure 6.
Figure 23a shows the decreasing trend of the particle mass flow rate with the screw conveyor’s decreasing RPM as the TBM advanced.
Figure 23b clearly indicates that the average mass flow rate increased linearly as the screw conveyor RPM increased. For a given screw conveyor RPM, the mass flow rate increased 1.2–1.4 times, as the cutterhead RPM changed from 1.0 to 3.0. Overall, the cutterhead’s operating condition affected the performance of the screw conveyor.
3.5.2. Driving Power of the Screw Conveyor
The driving power was calculated from the estimated torque and rotation speed.
Figure 24a plots the driving power of the screw conveyor as the TBM advanced. During excavation, the calculated driving power was mostly lower than the maximum power of an actual screw conveyor, except for very few points at a rotation speed of 12 rev/min.
Figure 24b shows that the average driving power of the screw conveyor increased as its RPM rose. For a given screw conveyor operating condition, the driving power of the screw conveyor increased by 1.5–1.9 times as the cutterhead rotation increased from 1.0 to 3.0 rev/min. This gives further evidence of the cutterhead’s operating conditions affecting the performance of the screw conveyor.
3.6. Determination of Optimal Operating Condition
The simulation results could then be comprehensively evaluated to determine the TBM’s optimal operating conditions at the fixed advance rate with 20 mm/min. As the EPB shield TBM must balance the pressure conditions at the tunnel face during excavation, the number of particles in the chamber and the surface pressure in the chamber were selected as evaluation indices. The SD of the ratio of compressive force and torque was also chosen as an evaluation index to reflect the basic operational management of TBM. Based on these three indices,
Table 10 ranks the top five operating conditions.
In terms of pressure balance in the chamber, Case 7 with cutterhead rotation at 2.0 rev/min and screw conveyor rotation at 12.0 rev/min was best (average, 2.5). However, the driving power of the screw conveyor exceeded its maximum capacity of 75 kW at very few points when the screw conveyor rotated at 12.0 rev/min. The screw conveyor was thus likely to break as it exceeded its maximum capacity. Therefore, it was necessary to slow the screw below 12.0 rev/min under the given simulation conditions. Without rotating the screw conveyor at 12.0 rev/min, Case 5 (1.5 rpm cutterhead rotation and 9.0 rev/min screw conveyor rotation) was best in terms of pressure balance in the chamber.
Regarding fluctuation of the ratio of the compressive force to torque, Case 11 was best. However, the driving power of the cutterhead exceeded the maximum capacity (1440 kW) at 3.0 rev/min cutterhead rotation. Considering operational management of the TBM, Case 5 (1.5 rev/min cutterhead rotation and 9.0 rev/min screw conveyor rotation) was also best at the fixed advance rate with 20 mm/min.
As a result, it was concluded that the operating condition with 1.5 rev/min cutterhead rotation and 9.0 rev/min screw conveyor rotation was the most optimal for TBM operation at the fixed advance rate with 20 mm/min in this TBM simulation.
4. Conclusions
This study used discrete-element analysis to predict the excavation performance of a 7.73 m diameter EPB shield TBM under different operating conditions. The model of the machine comprises six parts—cutterhead, disc cutters, cutter bits, chamber, shield, and screw conveyor. It was simulated to advance through a ground model of size 1.5 m (width) × 15.6 m (length) × 14.6 m (height), comprising 400,000 spherical particles of diameter 100 mm, randomly generated and stacked by gravity, after placement of the TBM geometry. Together, the two models simulated excavation for 360 s at four cutterhead RPMs and three screw conveyor RPMs to determine the best operation conditions.
The simulation showed that the lateral pressure acting on the side plate of the ground model increased almost linearly with the increasing depth of the plate. The ground also became less stable as the cutterhead RPM increased during excavation. The propagation of ground disturbance on the periphery of the cutterhead steadily increased as the cutterhead RPM increased.
The particles’ overall velocity in the chamber increased as the cutterhead RPM increased, with particles further from the chamber’s center tending to move more quickly. The low flow of particles was expected in the center of the chamber. The number of particles in the chamber and the surface pressure on the chamber varied with the cutterhead RPM and screw conveyor RPM during the simulation.
The ratio of compressive force and torque and the fluctuation of this ratio decreased as the cutterhead RPM rose. The overall compressive force acting on all disc cutters also increased linearly with the cutterhead RPM. The position of a disc cutter on the TBM cutterhead had a strong influence, with higher compressive forces experienced by the cutters closer to the center. The impact wear on a disc cutter determined from the variation of normal accumulative contact energy depended on the cutterhead RPM and the cutter’s position on the TBM. It clearly increased as the cutterhead RPM rose. Particularly, gauge disc cutters at the transition zone of the cutterhead showed more wear than those elsewhere, because of the large turning radius.
The muck discharge rate was measured by a mass flow rate sensor. The average mass flow rate gradually increased as the cutterhead RPM increased. Additionally, the average driving power of the screw conveyor gradually increased as the cutterhead RPM increased. Overall, the cutterhead operating conditions affected the performance of the screw conveyor.
Finally, comprehensive evaluation of TBM excavation under different simulation conditions led to the determination of the optimal operation conditions based on pressure balance and operational management of the TBM.
Further work should focus on two aspects—soil conditioning and load (pressure) control; the excavated material properties generally change with soil conditioning. If the ground is modeled by considering the soil conditioning work and calibration work with relevant soil samples, it might improve the prediction of the excavation before the TBM starts tunneling. This study simulated excavation using only DEM, except for the overburden load control system. Therefore, it is impossible to apply a high-class control system for real-time control of the rate of advance and cutterhead RPM, depending on the estimated torque, compressive force, and the chamber pressure. As additional pressure is determined by how full the chamber is, an effective control system should be considered in future studies. It is also difficult to consider the rotation of disc cutters during excavation. To overcome this limitation, coupling analysis will be attempted based on multi-body dynamics and DEM. Further studies should also compare simulation results with field data.


