Article

Estimation of Dose Enhancement for Inhomogeneous Distribution of Nanoparticles: A Monte Carlo Study

1
Department of Nuclear Engineering, Faculty of Engineering, King Abdulaziz University, P.O. Box 80204, Jeddah 21589, Saudi Arabia
2
Center for Training & Radiation Prevention, King Abdulaziz University, P.O. Box 80204, Jeddah 21589, Saudi Arabia
3
Department of Medical Physics & Biomedical Engineering, University College London, Malet Place Engineering Building, London WC1E 6BT, UK
*
Author to whom correspondence should be addressed.
Appl. Sci. 2021, 11(11), 4900; https://doi.org/10.3390/app11114900
Submission received: 30 April 2021 / Revised: 24 May 2021 / Accepted: 24 May 2021 / Published: 26 May 2021
(This article belongs to the Section Applied Biosciences and Bioengineering)

Abstract

:
High atomic number nanoparticles are of increasing interest in radiotherapy due to their significant positive impact on the local dose applied to the treatment site. In this work, three types of metal nanoparticles were utilized to investigate their dose enhancement based on the GATE Monte Carlo simulation tool. Gold, gadolinium, and silver were implanted at three different concentrations to a 1 cm radius sphere to mimic a cancerous tumor inside a 10 × 10 × 30 cm3 water phantom. The innermost layer of the tumor represents a necrotic region, where the metal nanoparticles uptake is assumed to be zero, arising from hypoxic conditions. The nanoparticles were defined using the mixture technique, where nanoparticles are added to the chemical composition of the tumor. A directional 2 × 2 cm2 monoenergetic photon beam was used with several energies ranging from 50 keV to 4000 keV. The dose enhancement factor (DEF) was measured for all three metal nanoparticles under all beam energies. The maximum DEF was ~7 for silver nanoparticles with the 50 keV beam energy at the highest nanoparticle concentration of 30 mg/g of water. Gold followed the same trend as it registered the highest DEF at the 50 keV beam energy with the highest concentration of nanoparticles at 30 mg/g, while gadolinium registered the highest at 100 keV.

1. Introduction

Rapidly growing solid tumor cancer cells are commonly subject to hypoxia and nutrient deficiency due to limited blood supply near the tumor center [1]. This may result in necrosis or passive cell death within the tumor core [2]. A solid tumor may, therefore, consist of a vascularized region in the outer region, while the necrotic region encompasses the tumor core. In cancer treatment, radiotherapy is considered a critical component in any national cancer-control plan. More than half of cancer patients receive this modality during their treatment, contributing to an overall cure rate of over 40% [3]. Depending on the localization, size, and type of cancer, external Radiation Therapy (RT) with megavoltage photon beams generated by linear accelerators is most frequently used [4,5], with the beam shape and energy chosen to conform the radiation dose distribution to the tumor. Accurate targeting of the tumor is especially important for tumors that are contiguous to critical body organs [6]. The main aim of RT is to maximize the damage to the cancer tumor and minimize the effect of radiation injury to the surrounding healthy tissues [7].
In the last few decades, nanoparticles (NPs) have been increasingly investigated as radio-sensitizers that enhance radiation damage to cancer cells. In this perspective, NPs with a high atomic number Z—gold [8], gadolinium, [9] bismuth, [10] and silver [11]—implanted inside a tumor can increase the production of secondary electrons and Auger electrons by the photoelectric effect when irradiated with photons of low energy E, as the cross-section of this interaction varies as Z n E 3 with 4 < n < 5 [12]. This local dose intensification, in turn, may enhance the radiation therapy effects [13].
Several studies have reported dose enhancement arising by the use of nanoparticles for both in vitro [14,15] and in vivo animal studies [16,17,18,19]. The majority of such studies have involved the study of gold nanoparticles in the kilovoltage X-ray energy range. However, it has become clear that the increased radiosensitivity reported in the literature results from a combination of the physical dose enhancement and additional chemical and biological effects associated with the type of nanoparticle in use [20]. Despite this body of work and commercial nanoparticles’ availability, the clinical translation of nanoparticles has been limited [21], although reports from clinical trials are beginning to emerge [22]. Gold has been the predominant nanoparticle studied to date due to its high X-ray absorption coefficient at kilovoltage energies and the ability to manufacture the nanoparticle size, shape and surface properties to optimize particle stability, solubility and biological properties. However, other nanoparticles have also been studied to varying degrees, including gadolinium and titanium oxide nanotubes [23,24,25].
Nanoparticles are delivered to the tumor cells via the bloodstream. Cellular uptake of the NPs is a complex process controlled mainly by the tumor vasculature [26]. In numerous studies on dose enhancement, it was assumed that the distribution of NPs within the tumor is homogeneous [27,28,29,30,31]. However, this assumption might be unrealistic since the neo-vascularization is higher in the outer regions of the tumor than in its inner parts. The heterogeneous vascularization of the interstitial medium affects greatly the concentration distribution of the NP uptake [32]. It is expected that the concentration of NPs would be higher in the peripheral regions of the tumor. This may lead to an increase in viable tumor cell killing in real conditions of cancer radiotherapy, although this assumption is complicated by the potentially increased radio resistance of a hypoxic core [32,33,34,35].
In this work, we computed, using the GATE 9.0 Monte Carlo simulation toolkit [36], the dose enhancement factor (DEF) in a virtual tumor implanted with silver, gadolinium, and gold, sited in a solid water phantom typically used to represent near tissue equivalence. The distribution of the NPs inside the tumor follows an exponentially decreasing function of the distance to the center of the tumor, which is considered non-vascularized, where the NPs concentration is assumed to be zero.

2. Materials and Methods

2.1. Simulation Toolkit
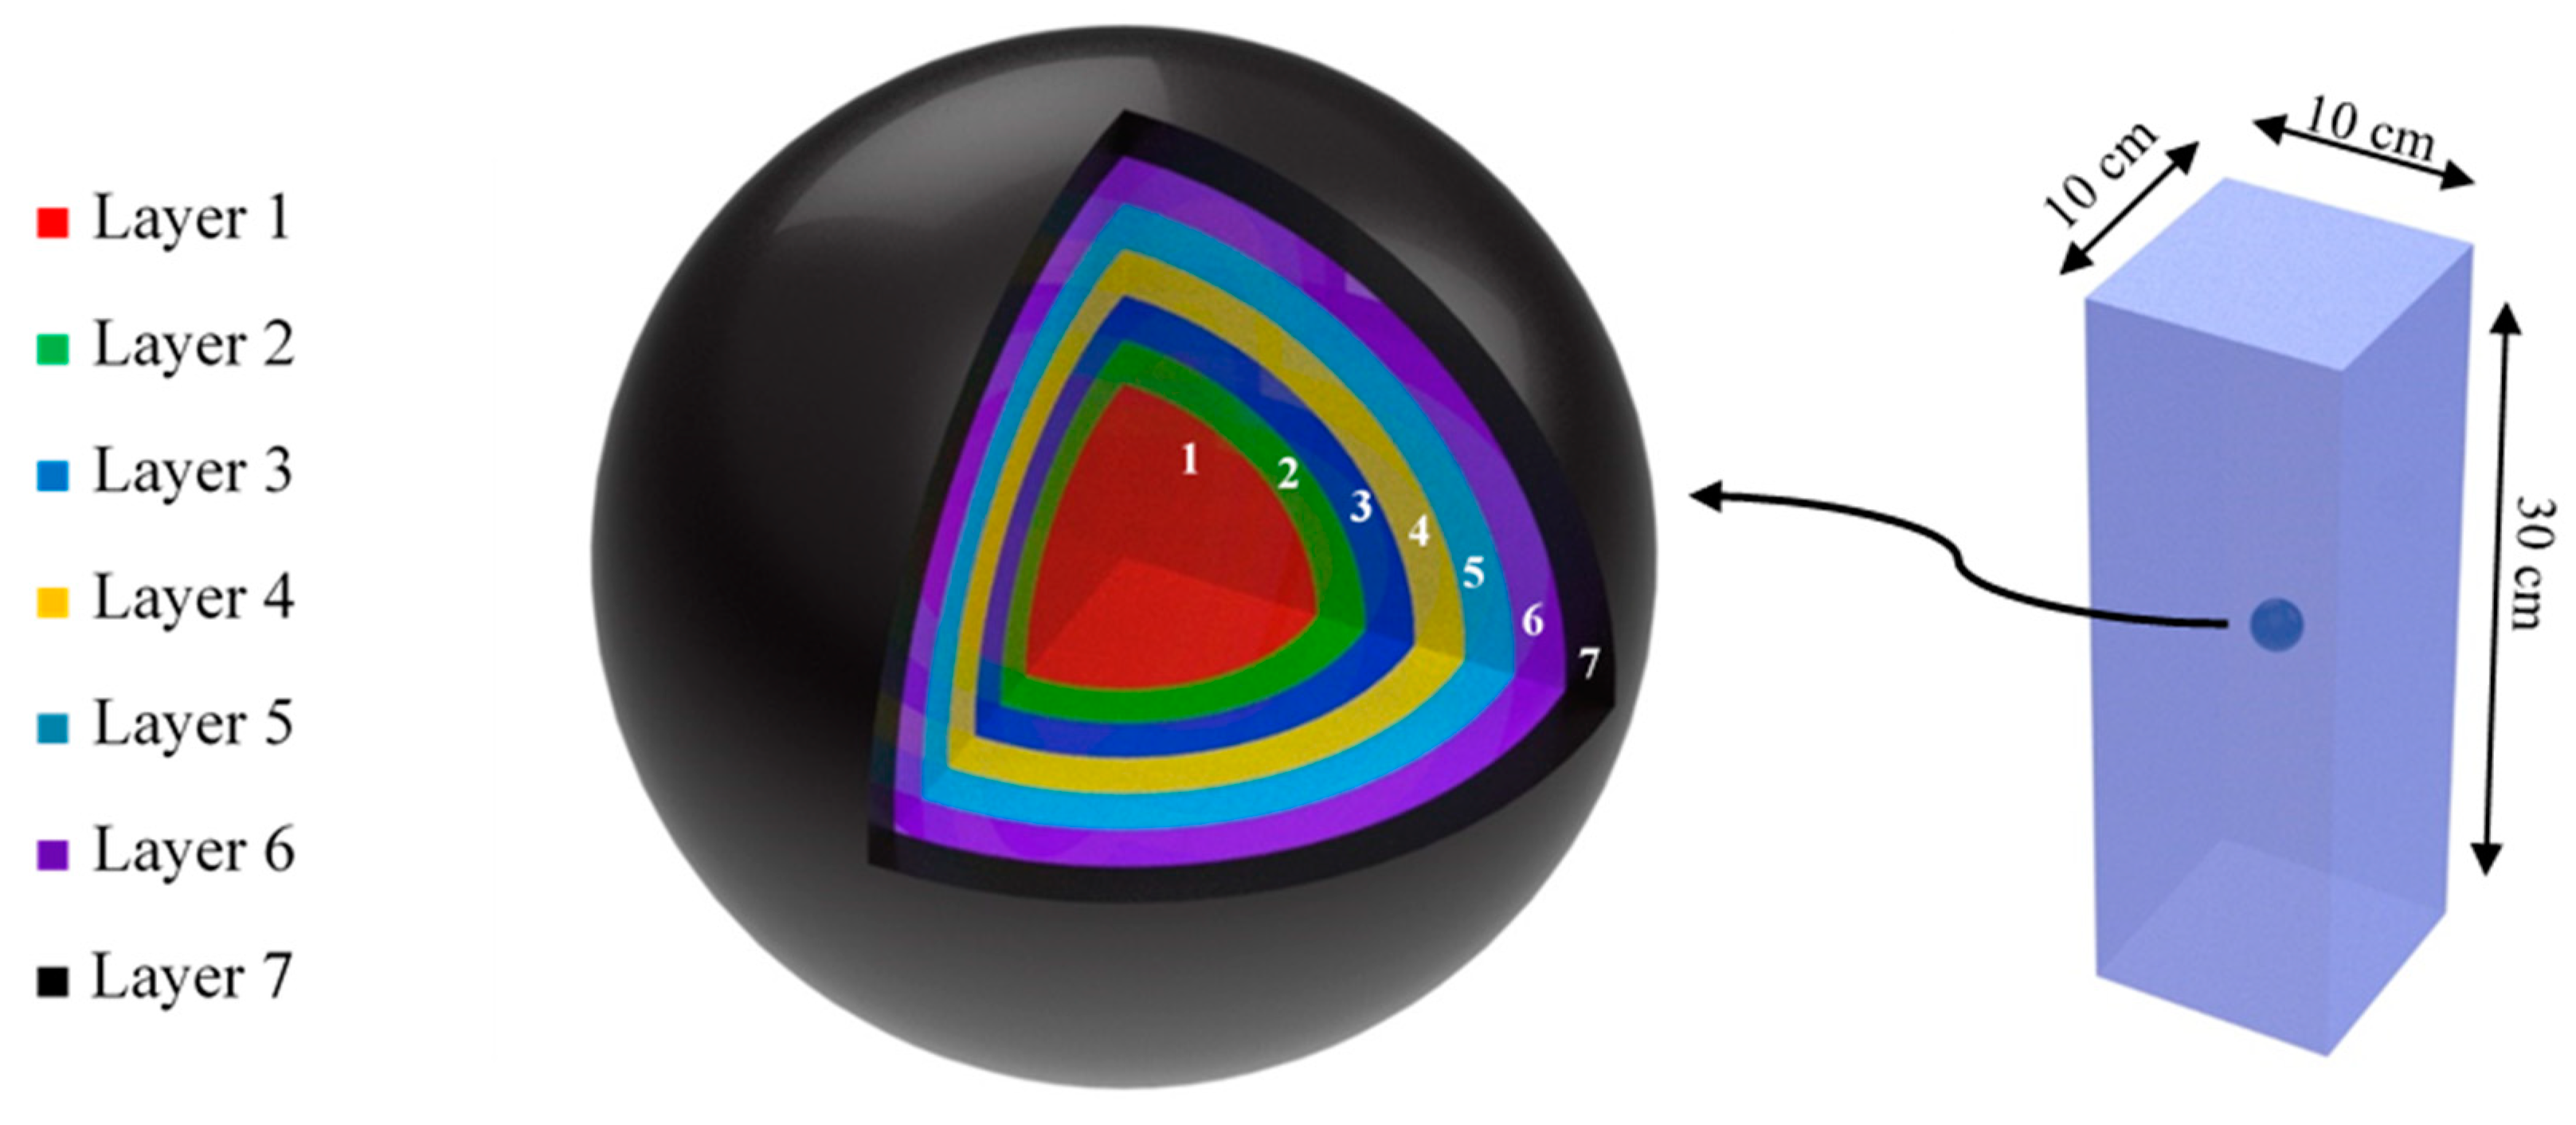
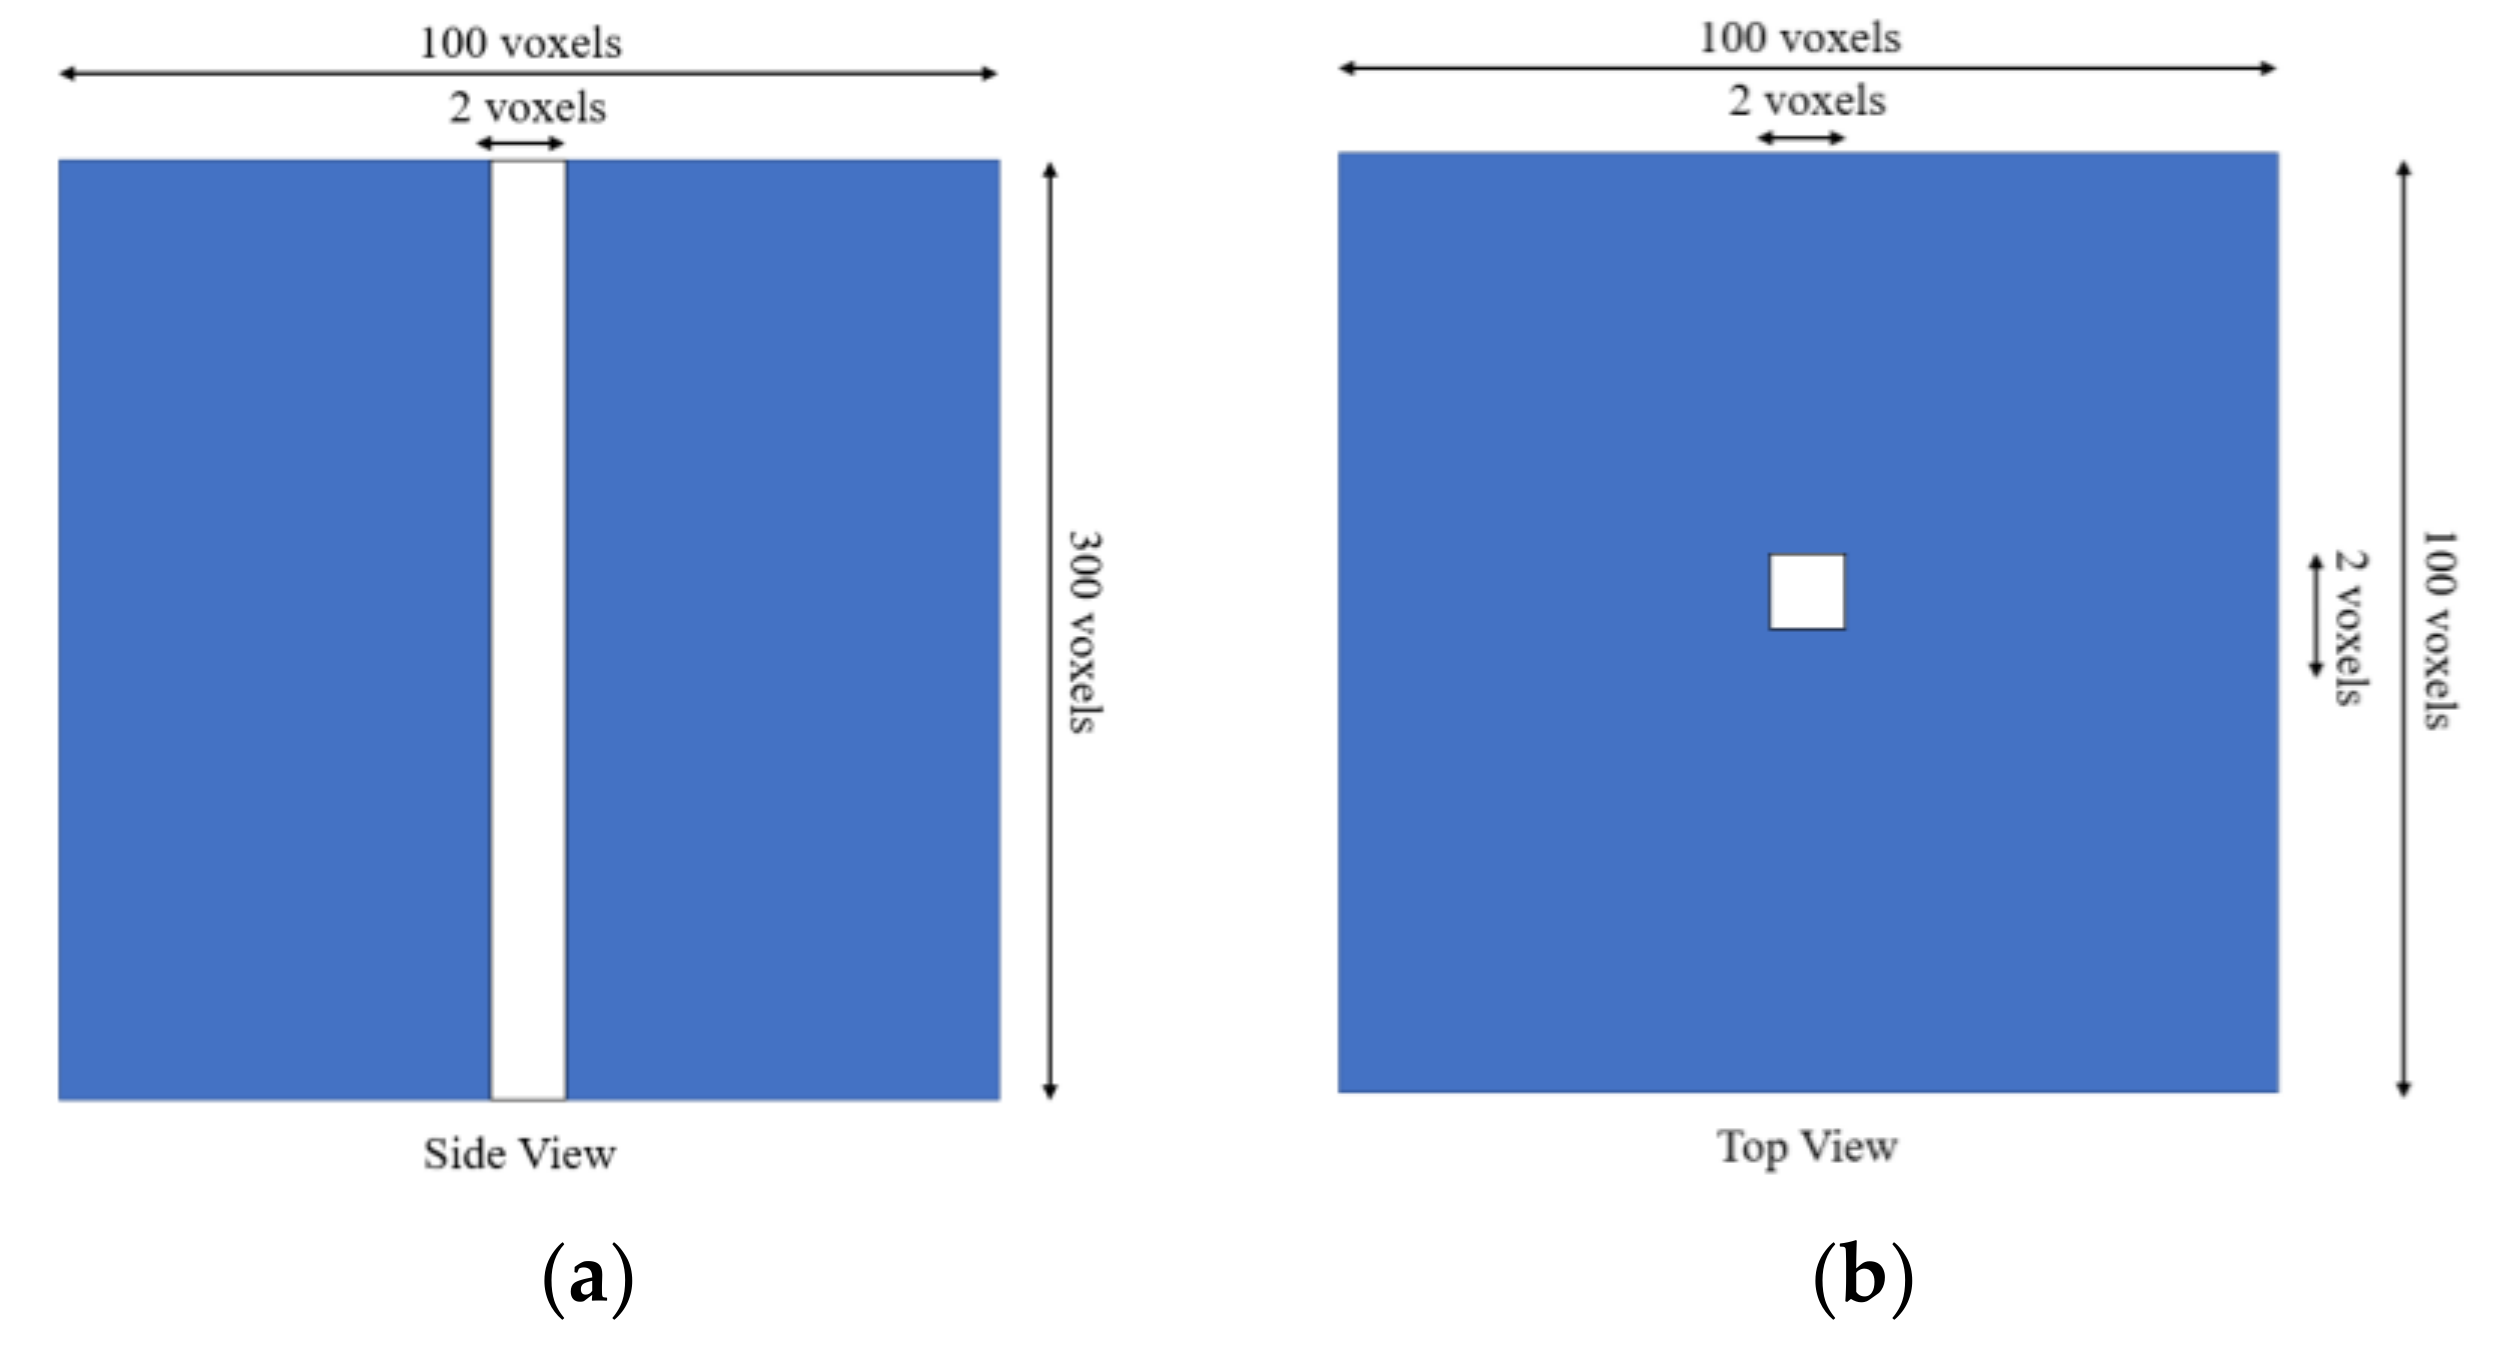
GATE is an open-source, freely available Monte Carlo simulation toolkit [37]. Although it was initially intended for emission tomography applications, the toolkit was extended to cover a broader range of dosimetry and radiotherapy applications [38,39,40,41].

2.2. Phantom

The phantom consisted of 10 × 10 × 30 cm3 of water. A 1 cm radius sphere representing the tumor was placed at the phantom center. The tumor, Figure 1, consisted of 7 concentric layers. The innermost layer (layer 1) represents the necrotic region where the NPs uptake is assumed to be zero. This layer occupied 6.4% of the tumor volume with a 0.4 cm radius. The remaining layers were 1 mm thick each.

2.3. Nanoparticles Modeling

Nanoparticles can be modeled in the simulation either as physical volumes embedded in the phantom or by defining them as a mixture material. In this study, the physical volumes model was initially considered, as it has been reported to be a more accurate model [29]. Initial runs showed the difficulties of using this model, as it would require approximately 1012 volumes to be created, which would require an impractical amount of memory. Shrinking the phantom size (≤1 mm3) to reduce the number of NPs to a memory of a manageable amount resolves that issue but causes a limitation on the tumor size. The size of the tumor is essential in this study, as it affects some of the dosimetric quantities to be evaluated. Another noticeable issue with this technique is the significantly longer simulation time, especially when used with the DNA physics models, and the difficulty in distributing the NPs inhomogeneously.
The mixture technique used in this study relies on defining the NPs as a mixture with its parent volume (the volume that the NPs are embedded within). This technique was reported to overestimate the dose in some cases [29]. When photons interact with NPs, ejecting secondary electrons in the process, these electrons might be absorbed before leaving the NP volume. As a result, these secondary electrons do not contribute to dose the tissue. This effect, known as self-absorption, is not considered in the mixture technique, as all secondary electrons emitted and absorbed in the mixture contribute to the dose. However, the mixture technique is faster to compute, easier to implement, and is useful when the objective is to compare different types of NPs and provide a general understanding of their effect on dosimetric quantities. The major drawback of this technique is that it does not allow studying the effect of size or shape of the NPs on the dose enhancement, which is out of this study’s scope.
A mathematical model to mimic the spatial distribution of the NP within the tumor was constructed. The distribution was homogeneous within each of the layers and followed an inhomogeneous, outwardly radial exponential growth, reaching a plateau at the edge of the tumor, C × 1.64 5.724 × 10 0.294 x , where C is the total concentration in the tumor and x is the maximum radial distance from the center of the tumor. For instance, for 30 mg/g, the distribution would be 9.7, 19.8, 27.2, 32.8, 37.04 and 40 mg/g for layers 2 to 7 respectively. The concentration in the necrotic region is constrained to 0. This model, similar to others used by several authors [42,43,44], was based on the fact that the vascularization of the tumor tissue follows an exponential decrease from the periphery to the necrotic center [45,46].
A wide choice of nanomaterial platforms, such as inorganic nanomaterials, are used for dose enhancement because they can accumulate in the tumor tissue via extravasation from leaky vasculature [47]. This phenomenon, known as enhanced permeability and retention (EPR) [48,49], depends on the specific pathophysiological difference between tumor tissues and healthy tissues. EPR is present in angiogenic tumor vessels, having gaps larger than 100 nm between adjacent vascular endothelial cells, unlike the blood vessels found in healthy tissues [50]. As a result, these nanoparticles exhibit improved accumulation in the tumors than in normal tissues, thus, selectively enhancing cancer cell killing.
Three types of NPs were considered in this work: gold (Z = 79), gadolinium (Z = 64), and silver (Z = 47). The tumor NPs concentrations used in this study are 10, 20, and 30 mg/g of water. The biotoxicity and biocompatibility of the NPs are limiting factors in the choice of NP concentrations [51,52].
NPs induce human cytotoxicity via mechanisms such as apoptosis, ROS generation, inhibition of mitochondria function, membrane leakage, and membrane lipid peroxidation. Renal clearance is the primary pathway of excretion for inorganic nanoparticles, such as gadolinium, gold and silver NPs, to avoid any long-term toxicity [53]. Gold NPs are relatively biologically non-reactive, non-toxic and biocompatible. Jain and colleagues reported that 10 mg/g of gold NPs showed no cytotoxic effects [50]. Kruszewski et al. observed a significant oxidative stress in a human epithelial cell line when in vitro inoculated with 25 mg/g of silver NPs [54]. The maximum tolerable dose for the clinically used gadolinium MRI contrast agent in humans is unknown, although in a clinical experience, patients often received greater than 0.23 mg/g of gadodiamide without known adverse effects [55].
The high NP concentration used in this work (30 mg/g) was only dictated for the sake of comparison of DEF values. The densities of the NPs mixtures are the sum of water density and added concentration. For example, when a 10 mg/g of AuNps is added, the density becomes 1.01 g/cm3. It is important to note that this is the overall concentration of the NPs within the tumor and not in a single layer.

2.4. Beam and Physics Modeling

A directional 2 × 2 cm2 monoenergetic photon beam was used with the following energies: 50, 100, 150, 200, 300, 400, 600, 800, 1000, 1500, 2000 and 4000 keV. The source to skin distance “SSD” was set to 100 cm. The wide range of photon beam energies was intended to study the approximate energy range where NPs could be considered most useful due to the higher interaction probabilities at these energies.
The emstandard_opt4 physics package was used, as it provides a well-validated physics model for medical applications and covers the energy range considered in this study [56,57]. Both fluorescence and Auger electrons processes were enabled. To achieve low statistical uncertainty, 109 particles were used. The secondary production threshold is defined in GATE as a range cut-off. GATE uses the provided range cut-offs for each region to determine the energy production thresholds. In this study, the cut-off was set to 0.2 mm for gamma, electrons, and positrons.

2.5. Simulation Output
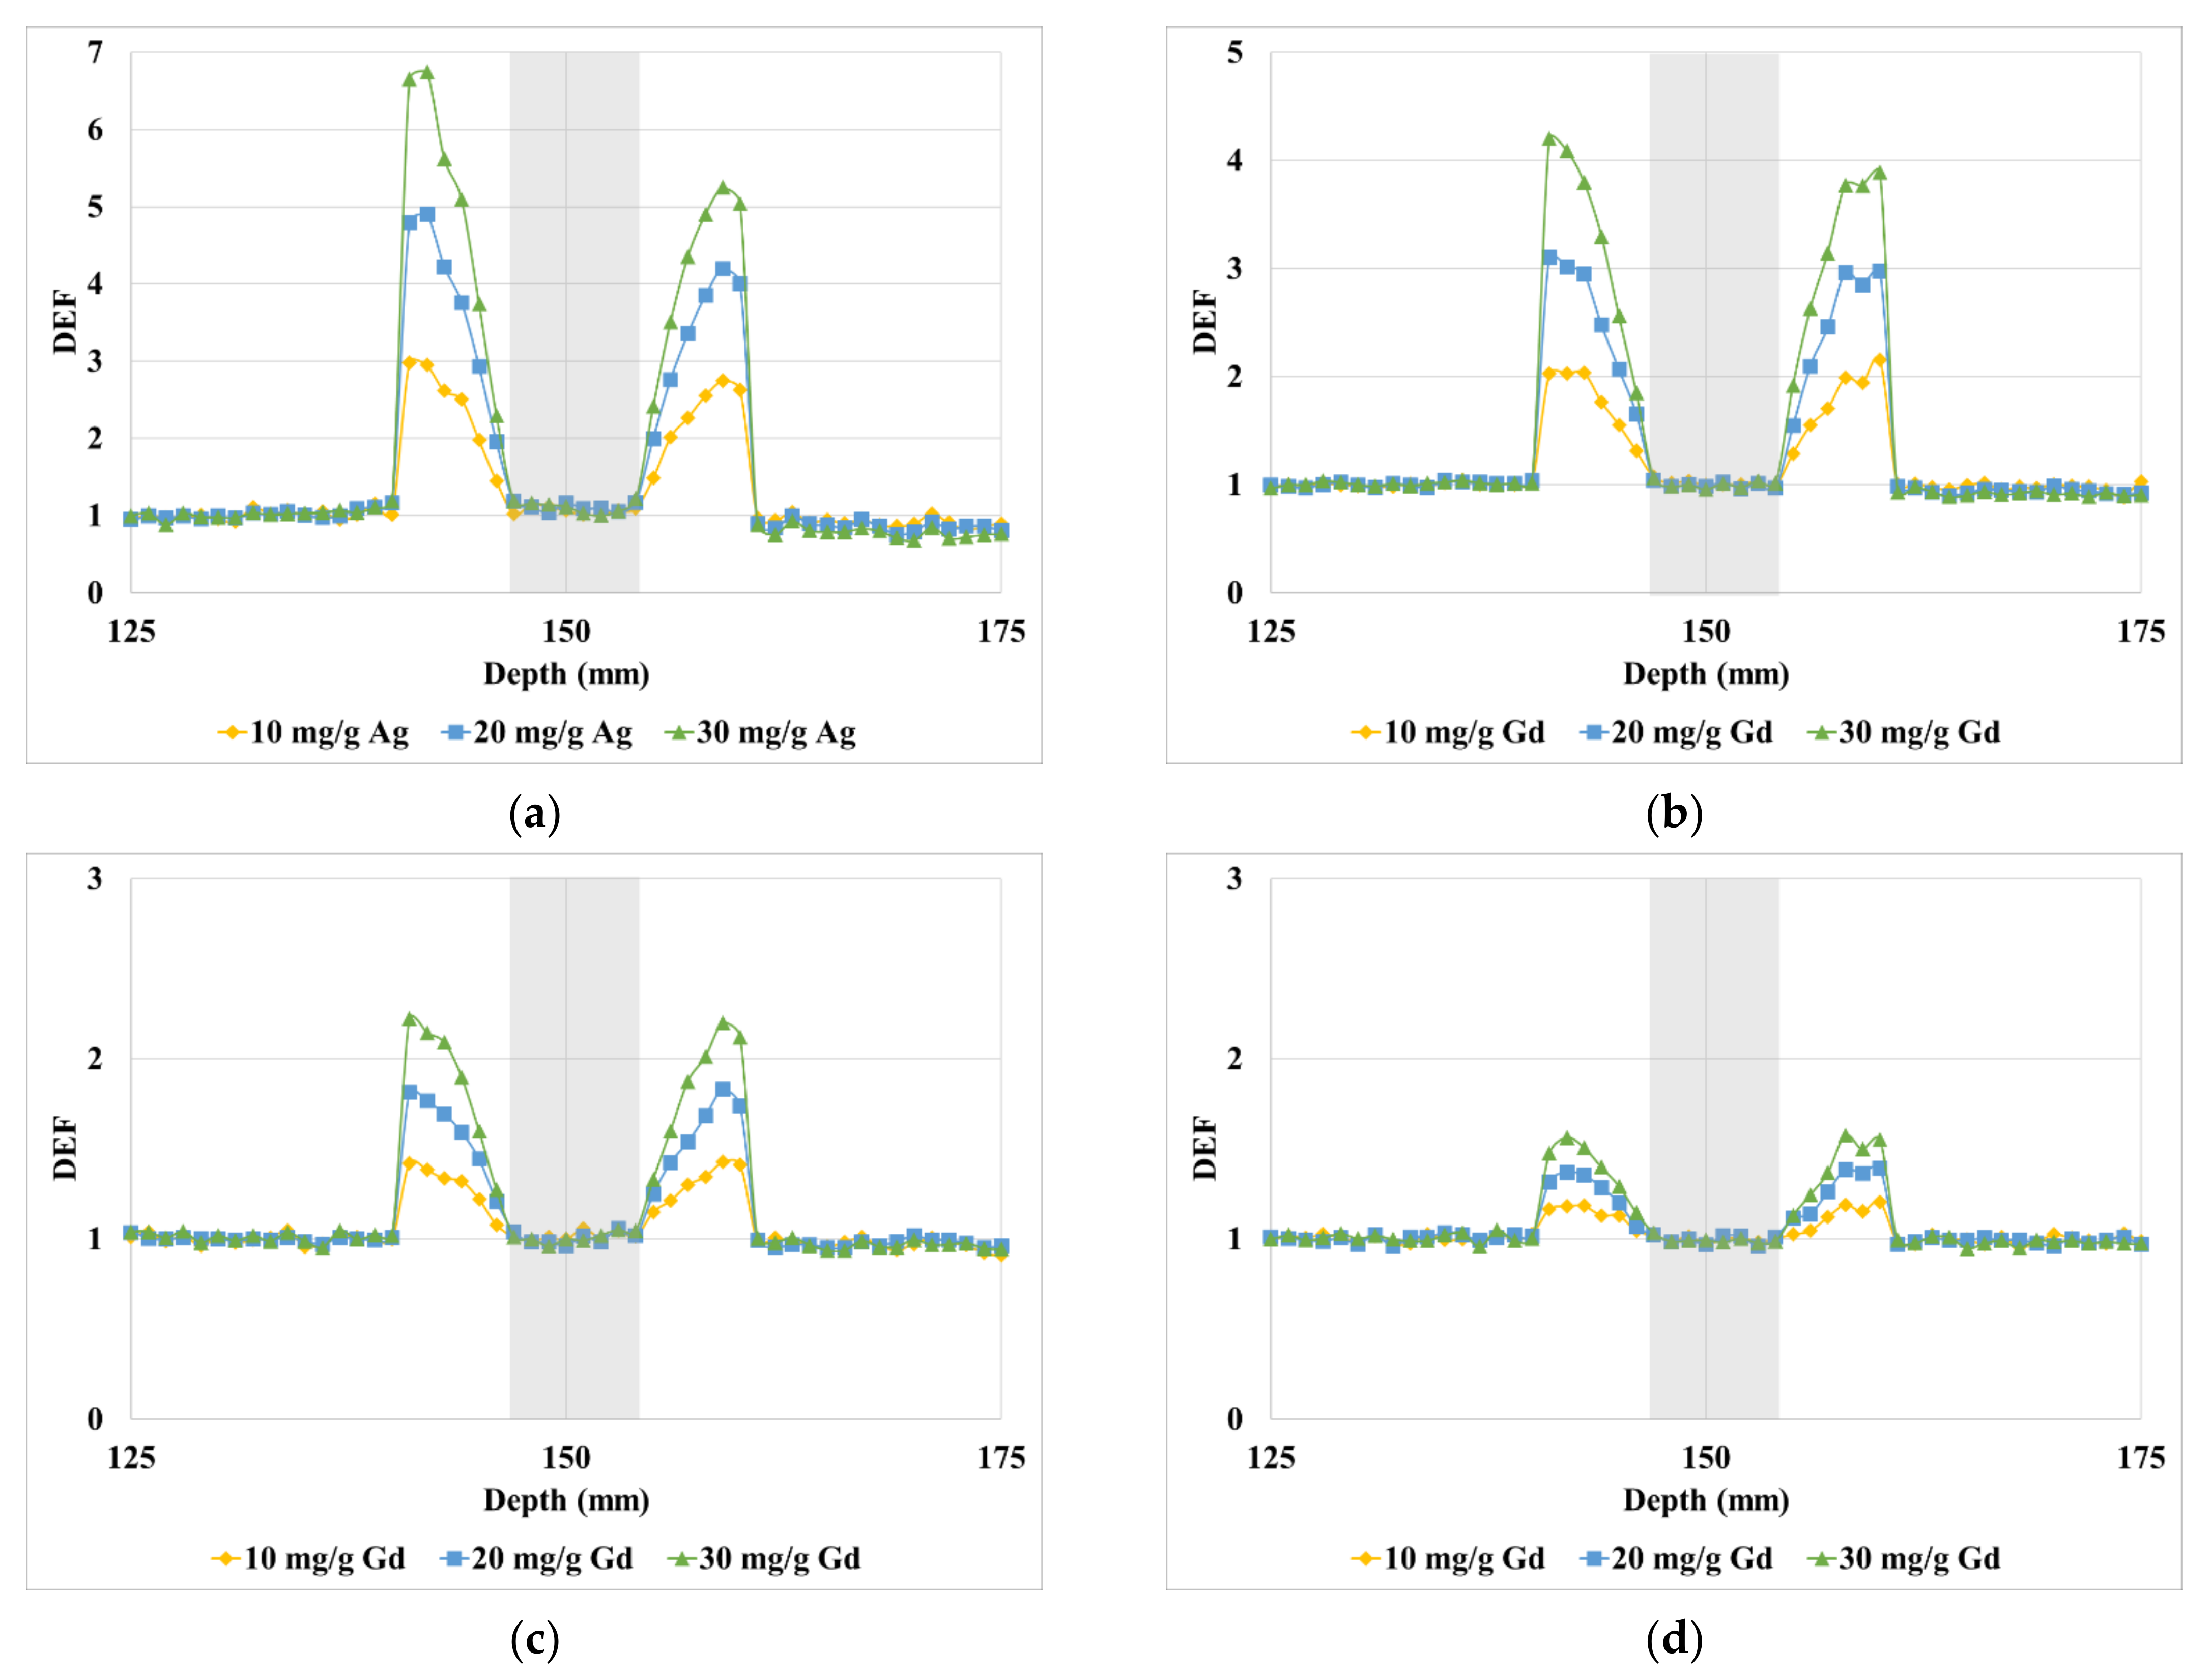
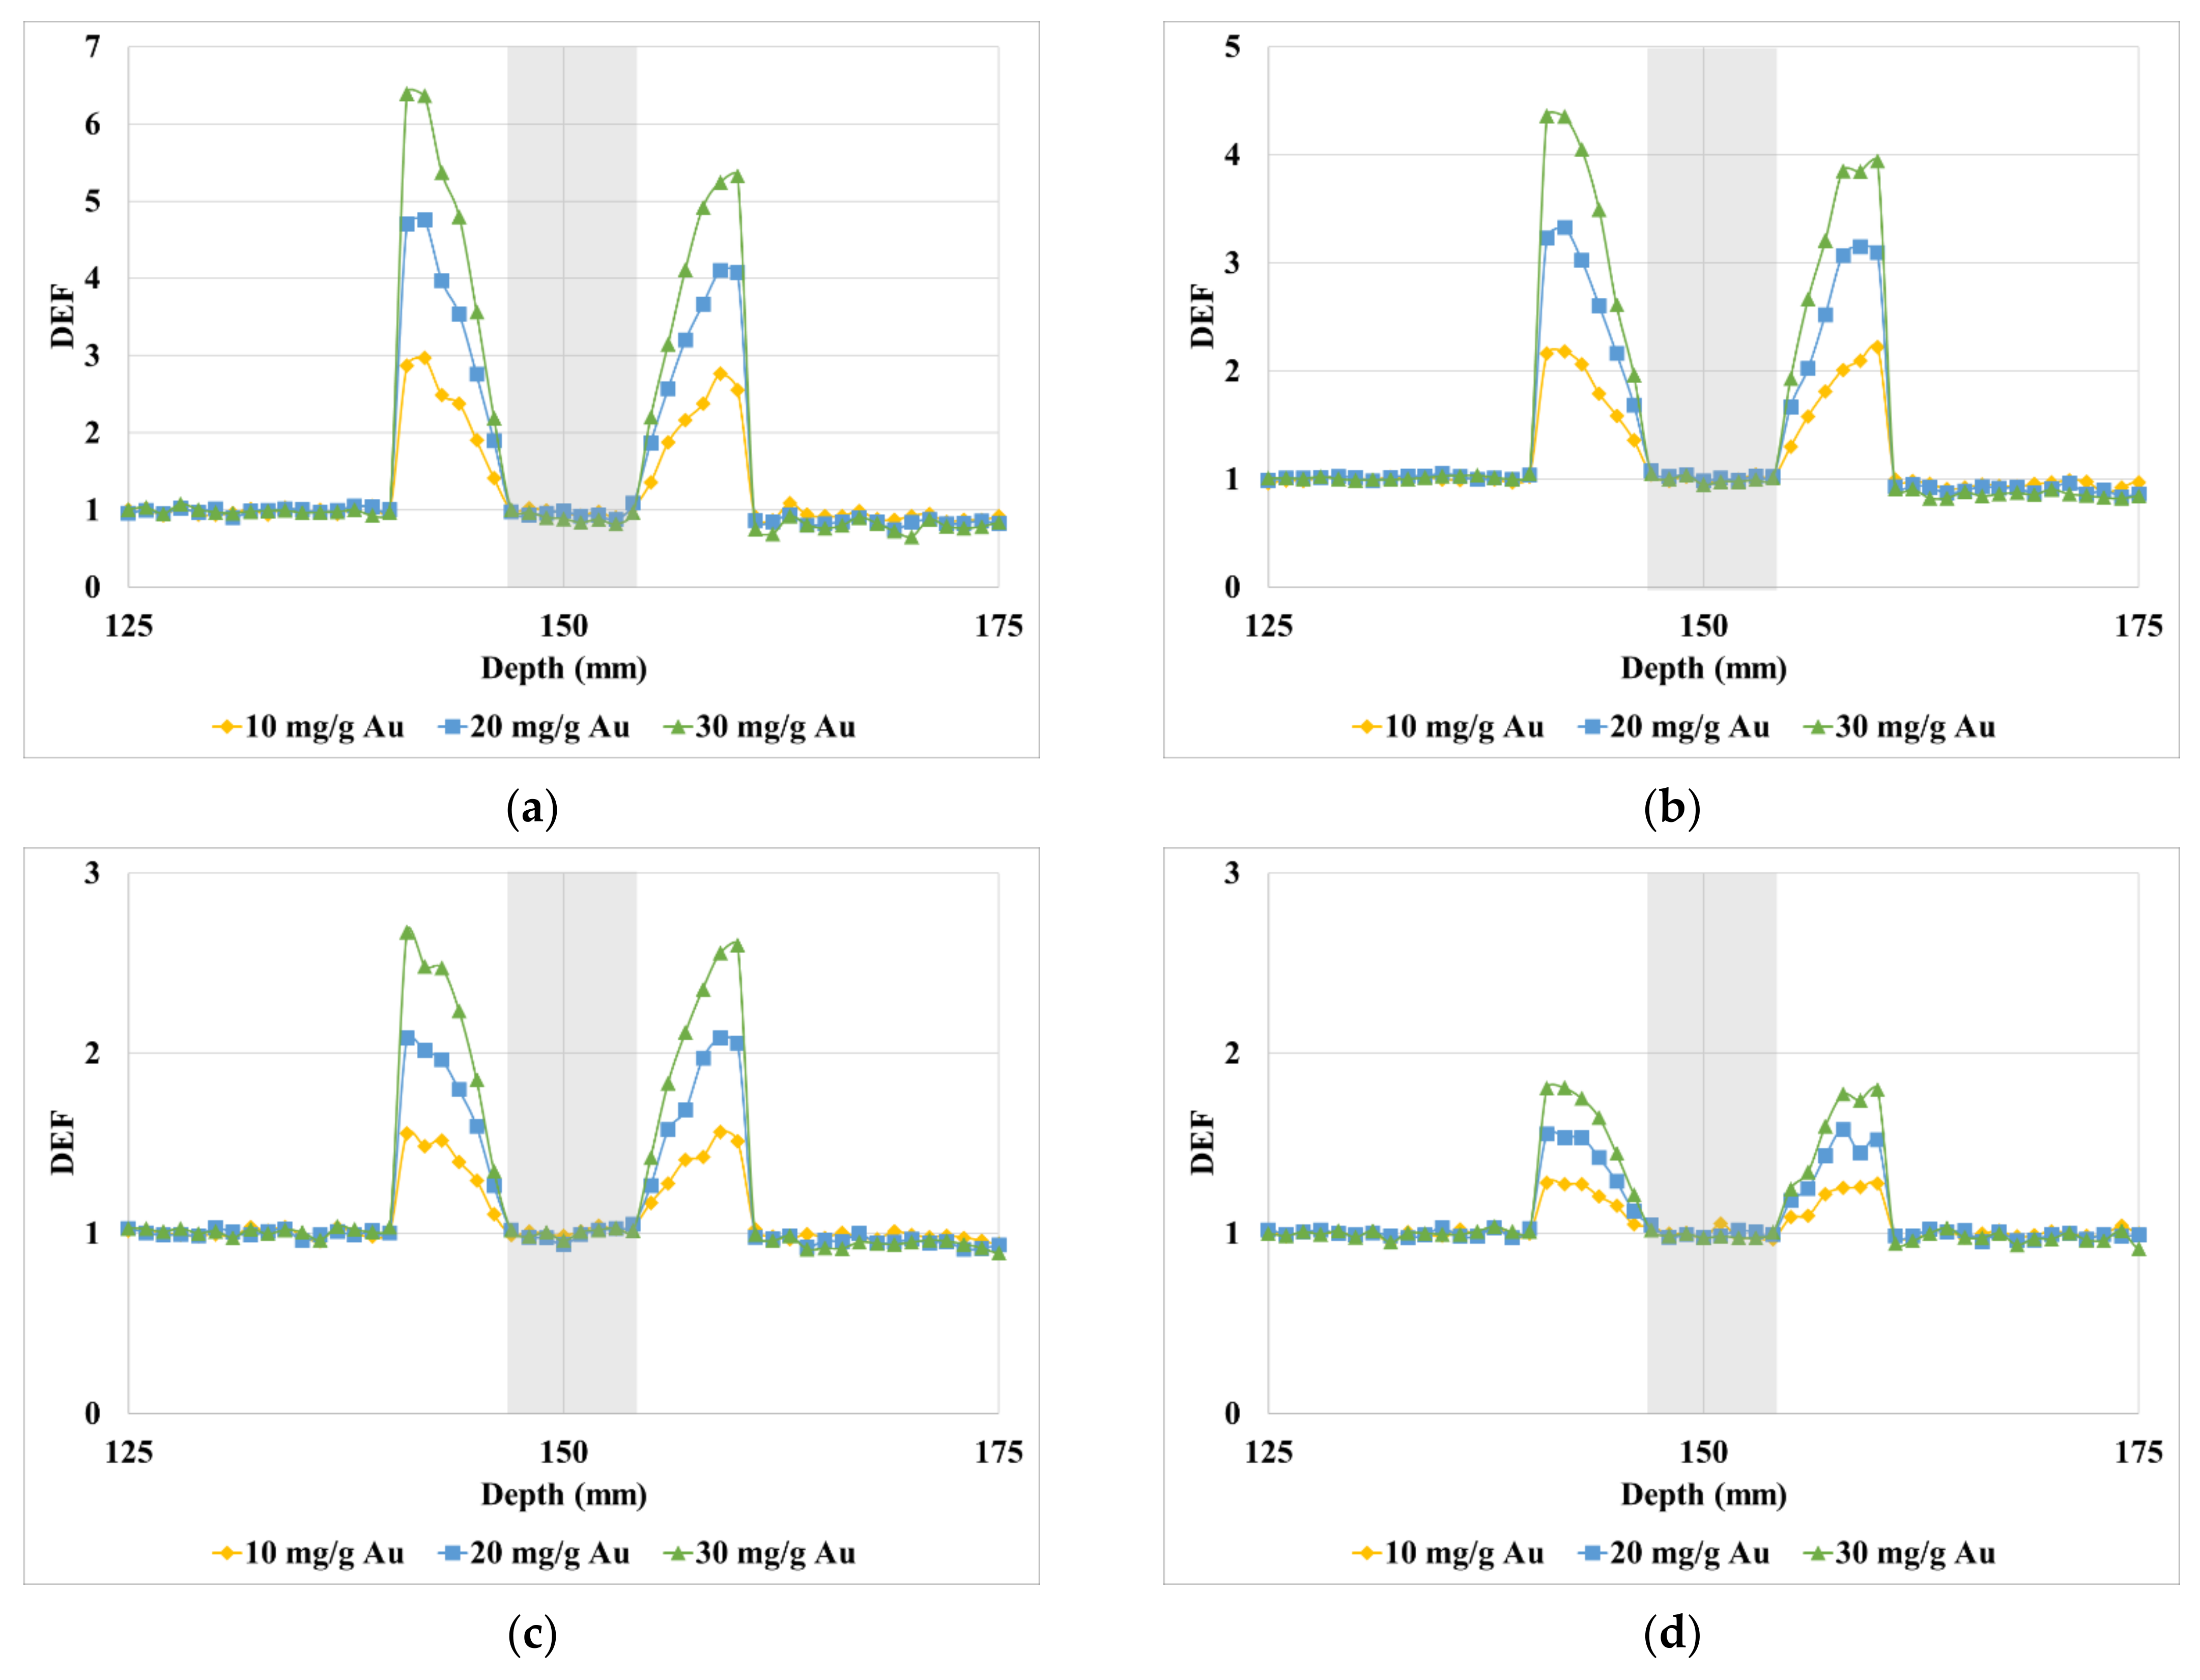
GATE provides tools termed as “actors” to collect various types of information from the simulation. The dose distribution in the phantom was calculated with the use of the dose actor. This actor produced 3-dimensional images representing the dose and dose uncertainty distributions. The resolution of each image was set to 100 × 100 × 300 voxels (the size of each voxel is 1 × 1 × 1 mm3). The use of 109 particles ensured the uncertainty in dose calculations to be less than 2% within the beam field of view for all simulations.
The dose enhancement factor (DEF) was calculated by dividing the dose distribution images obtained with the presence of NPs by those obtained with no added NPs. The resulting image represents a 3D distribution of the DEF. The depth DEF is determined at each depth by averaging the 4 central voxels located at the horizontal plane center at that given depth. In this study, as shown in Figure 2, the maximum voxel depth will be used to represent the location of the measurement along depth.
The energy spectrum actor was used to collect the primary and secondary particle flux, energy deposition, and energy spectrum. The output of this actor was essential in calculating the characteristic X-ray production in the tumor. The percentage of characteristic X-rays produced in the tumor, escaping without interaction, is denoted by ε.

3. Results

The DEF along depth for AgNPs is illustrated in Figure 3. The highlighted area in the figure represents the necrotic region. For 50 keV, a significant dose enhancement is observed for each concentration: up to a factor of nearly seven for 30 mg/g concentration, five for 20 mg/g concentration and three for 10 mg/g concentration. Overall, the DEF decreases with increasing the beam energy and decreasing the NPs’ concentrations.
The enhancement difference between the first tumor measurement point in the beam path and the last point before the necrotic region is higher for higher concentrations and lower energies. For instance, the DEF for the last measurement point is approximately 48% of the DEF of the first point for 10 mg/g Ag. Increasing the concentration reduces the percentage to 41% and 35% for 20 and 30 mg/g Ag, respectively. Increasing the energy for 10 mg/g Ag increases the percentage to 77%, 85% and 92% for 100, 150 and 200 keV, respectively.
Furthermore, given that the concentration is constant within each layer, the DEF values for the same layer should be similar. However, by examining the first and last DEF tumor measurements (both represent layer 7) in Figure 3a, it can be noted that the first measurement shows distinctively higher DEF. At low concentrations and higher energies, the beam has higher penetration power. As a result, the reduction in flux along the depth becomes less affected by the presence of NPs. Therefore, the ratio between the flux in the presence of NPs to flux in the absence of NPs becomes approximately constant and independent of depth. In other words, under these conditions, any two measurement points that are located at different depths but have the same NPs concentrations should show a similar DEF. For example, the differences between the DEF of the first and last measurement points at the tumor (both have the same concentration) are 0.35, 0.79 and 1.61 for 10, 20 and 30 mg/g Ag, respectively. Increasing the energy for 30 mg/g Ag reduces the difference to 0.05, 0.01 and 0.01 for 100, 150 and 200 keV, respectively.
As the concentration increases or the photon energy decreases, more photons are attenuated as the beam enters the tumor. As a result, flux decreases more rapidly with higher concentrations and lower energy. The decrease in flux means that, under these conditions, any two measurement points exhibiting the same concentration but located at different depths might show different DEFs. This leads to the conclusion that the DEF for a given concentration and energy is affected by depth. However, the effect of tumor depth on DEF is negligible at higher energies and lower concentrations.
The GdNPs DEF over the depth of the tumor is illustrated in Figure 4. A significant dose enhancement in the layers containing NPs for each concentration up to a factor of four for 30 mg/g concentration for both 50 keV and 100 keV is observed. For 20 mg/g concentration, the DEF is approximately three and for 10 mg/g, the DEF is approximately two for both 50 and 100 keV. After that, the DEF decreases with increasing beam energy and decreasing NPs concentration.
Figure 5 illustrates the DEF variation over the diameter of the tumor for AuNPs. The 50 keV energy beam shows a significant dose enhancement in the layers containing NPs for each concentration up to a factor of 6.4 for 30 mg/g concentration, just under 5 for 20 mg/g concentration and 3 for 10 mg/g. The DEF decreases with increasing the beam energy and decreasing the NPs’ concentrations. Table 1 summarizes the maximum DEF for all energies considered in this study. It is evident that at 400 keV and below, the maximum enhancement ranges from 5% to 574%, while beyond 400 keV, it becomes less than 10% for all types and concentrations.
The maximum dose enhancement factors for both the tumor and non-tumor (healthy tissue) are shown in Figure 6. The maximum enhancement provides a more generalized understanding of different NPs behavior among different energies. For AgNPs, the maximum enhancement occurs at 50 keV and 30 mg/g concentration. GdNPs maximum enhancement occurs at 100 keV and 30 mg/g. At 50 keV, Ag has a slightly lower absorption probability than Au, as shown in Table 2.
Nevertheless, 50 keV exceeds the K-edge energy for silver but not for gold, leading to the emission of 25 keV characteristic X-ray photons that are likely to be reabsorbed within the tumor, enhancing the dose further. As a result, AgNPs produce a higher DEF than AuNPs at 50 keV. As for GdNPs, the absorption probability is lower than AgNPs and AuNPs and no K-shell characteristic X-rays are emitted.
At 100 keV, Au has the highest absorption probability and therefore produces the highest DEF, followed by Gd, which possesses a higher absorption probability than Ag. As energy increases further, the absorption probability difference between different NPs types and concentrations gradually decreases. Therefore, DEF becomes less affected by Z.
The maximum number of scattering events within the tumor occurs when no NPs are present. This is due to water having the highest electronic density than any of the NP mixtures used in this study. Particle tracking showed that while adding NPs to the tumor reduces the scattering events within the tumor up to 21%, the scattering events occurring outside remained almost constant. This fact shows that scatter radiation does not have a significant impact on enhancing the dose to healthy tissue. Most X-rays are produced at the outer layer, which holds the highest concentration. Therefore, it is very likely for those photons to escape, as will be discussed later. This will increase the healthy tissue dose, especially for those tissues that are very close to the tumor. The enhancement to healthy tissues in the primary beam path ranged from 5% to 19% for beams below 40 keV energy and from 1% to 3% for above 400 keV beams. In all cases, the maximum DEF in healthy tissues occurred within a 3 mm distance from the tumor boundaries.
The average enhancement was not considered in this study, as it is highly dependent on the tumor size [11]. Changing the tumor size will affect the dose enhancement distribution and, consequently, the average DEF. On the other hand, the maximum DEF depends on the source location relative to the tumor. For external photon beam therapy, the maximum usually occurs at the first layer of the tumor that interacts with the beam, as it holds the highest concentration in the case of inhomogeneous NPs distribution. As for homogenous NPs distribution, the maximum occurs in the first layer as long as the tumor is located at depths within or higher than the maximum dose depth. In that case, the photon fluence will be the highest at the tumor first layer. As photons are attenuated along the depth, less of the dose is deposited, resulting in lower DEF along the depth. For a tumor located at a depth less than the maximum dose depth, the maximum DEF might be affected by the shift in the maximum dose depth caused by the introduction of NPs.
To emphasize more on the characteristic X-ray emission, Figure 7 depicts the number of characteristic X-rays produced in the tumor and the percentage of X-rays that escape the tumor for AgNPs, GdNPs, and AuNPs respectively. It can be seen that for AuNPs and GdNPs, the maximum number of characteristic X-rays produced occurs at the first incident energy that exceeds the K-edge energy. Increasing the effective atomic number by using a higher Z NP or a higher concentration increases the number of characteristic X-rays produced, given that the incident energy exceeds the K-edge. This also leads to more characteristic X-rays absorption within the tumor, as will be discussed later. Since lower concentrations have a lower effective Z and produce fewer X-rays, ε is higher for lower concentrations. Considering that most X-rays are produced at the outermost tumor layer and that AuNPs and GdNPs K-shell X-rays are more energetic than AgNPs X-rays, AuNPs and GdNPs X-rays have a higher probability of escaping the tumor and thus have higher ε. The average differences between ε at 10 and 30 mg/g for AuNPs, GdNPs and AgNPs are 4%, 5% and 8% respectively. The larger difference with AgNPs is probably caused by the larger increase in the probability of absorbing the 25.5 keV X-rays with higher concentrations in comparison with the 80 keV and 50.2 keV emitted by AuNPs and GdNPs, respectively.
The maximum X-ray energy produced in this study is 80 keV. It would be difficult, even for 80 keV photons, to escape both the tumor and healthy tissue without interaction. Thus, most X-rays escaping the tumor will most likely end up depositing their energy in the healthy tissue.
Characteristic X-rays showed to play a significant role in enhancing the dose. Figure 8 shows the total absorbed dose in the tumor and the contribution of X-rays to that dose. Generally, the dose increases with energy and becomes independent of the NPs type and concentration beyond 400 keV. The highest contribution of X-rays results from AgNPs and 50 keV photons. At 50 keV, the probability of absorption is the highest and with the incident photon energy exceeding the K-edge energy, more X-rays are produced. Two factors contribute to the decrease in the characteristic X-ray dose contribution as energy increases. Firstly, the increase in energy decreases the occurrence of photoelectric absorption and consequently, fewer characteristic X-rays are produced. Secondly, even if the characteristic X-ray quantity remains constant and independent from the incident photon energy, the increase in the total dose with energy will reduce the characteristic X-rays’ contribution to the total dose.

4. Discussion

In this study, the GATE toolkit was used to determine the DEF resulting from inhomogeneous nanoparticle uptake for various energies. Although simplistic in the arrangement, this setup was considered appropriate to demonstrate the dose enhancements that may be expected for external beam radiation therapy for nanoparticles of different elemental compositions and concentrations. Ag, Gd, and Au were modeled in concentrations varying from 10 mg/g tissue to 30 mg/g tissue in a layered, non-homogeneous pattern with a necrotic core. The presented model focused on demonstrating the DEF in an inhomogeneous distribution of NPs. However, the model did not incorporate many factors that might affect the clinical application of NPs. These factors include the healthy tissue uptake of NPs, uptake and elimination rates, tumor stage, size, vascularization and depth.
Tumor vascularization and formation of necrosis is dependent on the tumor stage. Tumor necrosis is believed to form at the center of solid tumors as tumors progress into advanced stages [59,60]. Therefore, not all tumors, at the time of therapy, have necessarily developed a necrotic region. Additionally, the vascular distribution dependency on tumor stage would affect the distribution of NPs within the tumor.
Very few DEF studies considered an inhomogeneous distribution of NPs. Zabihzadeh et al., evaluated the dose enhancement in an inhomogeneous, gold NP distribution for different tumor depths. The study used low-energy monoenergetic photon beams, including 55 and 95 keV photons. The maximum DEF obtained with 55 and 95 keV photons for 10 and 30 mg/g Au is somewhat higher than those obtained in this study for 50 and 100 keV [43].
The results of the two studies are following the same trend and the enhancement is increasing with concentration and decreasing with energy. However, the disagreement in the DEF values is most likely caused by two factors. First, the tumor in their study is located closer to the surface. The maximum tumor depth considered in their study is 6.5 cm, while a fixed tumor depth of 14 cm was used in this study. This difference in depth, as discussed earlier, could affect the DEF. Second, the NPs inhomogeneous distribution is different. For instance, the maximum concentration in any layer in this study is approximately 40 mg/g when the AuNps overall concentration in the tumor is 30 mg/g. In their study, for a 30 mg/g overall concentration, the maximum is 54 mg/g, resulting in higher enhancement than reported in our study.
This study showed NPs to be advantageous at low energies and of limited benefit around the megavoltage range. This is consistent with several studies that reported relatively small macroscopic enhancement factors with very high energy photons [61,62]. Compton is known to be dominant over photoelectric interaction in the megavoltage range. Compton scattering is dependent on electronic density rather than the atomic number. Therefore, metals with a high atomic number are not very effective as dose enhancers in the megavoltage range.
Typically, external radiation therapy is carried out using heterogenous X-rays. However, monoenergetic beams were used in this study. X-rays have a relatively complicated energy spectrum. Additionally, for a given kVp, the spectrum is slightly different from one manufacturer to another [63]. On the other hand, a monoenergetic beam is easier to model and its results are easier to interpret. The term “beam quality” is usually used to describe the beam penetrability and attenuation properties. A half-value layer is usually used to describe the quality of the X-ray beam, especially in the low energy range. Therefore, it can be used to find the X-ray beam with a quality corresponding to monoenergetic beam quality.

5. Conclusions

The heterogeneity of the blood vascularization in tumors leads to an inhomogeneous distribution of NPs in the tumor. This study focused on investigating the effect of inhomogeneous distribution of NPs in tumors. It is clear from the results that the DEF is highly variable across the tumor depending on the concentration of NPs and photon energy. However, the DEF was maximal for gold and silver NPs for 50 keV energy and gadolinium NPs at 100 keV. The maximum DEF observed was approximately seven for 30 mg/g tissue of Ag. The highest number of characteristic X-rays generated from all NPs was for energy beams below 100 keV. Therefore, the dose delivered to the tumor from X-rays interacting with the tumor is also maximal for all NPs at beam energies below 100 keV. The clinical consequence of such inhomogeneous NPs distribution is unknown and requires further studies.

Author Contributions

Conceptualization, E.T. and F.A.; methodology, F.A. and F.D.; software, E.T.; validation, E.T., E.B. and A.A.; formal analysis, E.B., A.A. and E.T.; investigation, E.T.; resources, F.A.; data curation, E.T.; writing—original draft preparation, F.A.; writing—review and editing, A.N.; visualization, F.A.; supervision, A.N.; project administration, F.A.; funding acquisition, F.A. All authors have read and agreed to the published version of the manuscript.

Funding

This project was funded by the Deanship of Scientific Research (DSR) at King Abdulaziz University, Jeddah, under grant No. RG-12-135-41. The authors, therefore, gratefully acknowledge DSR for the technical and financial support.

Institutional Review Board Statement

Not applicable.

Informed Consent Statement

Not applicable.

Data Availability Statement

Not applicable.

Acknowledgments

This project was funded by the Deanship of Scientific Research (DSR) at King Abdulaziz University, Jeddah, under grant No. RG-12-135-41. The authors, therefore, gratefully acknowledge DSR technical and financial support.

Conflicts of Interest

The authors declare no conflict of interest.

References

  1. Tsujimoto, Y. Apoptosis and necrosis: Intracellular ATP level as a determinant for cell death modes. Cell Death Differ. 1997, 4, 429–434. [Google Scholar] [CrossRef] [Green Version]
  2. Zong, W.-X.; Thompson, C.B. Necrotic death as a cell fate. Genes Dev. 2006, 20, 1–15. [Google Scholar] [CrossRef] [Green Version]
  3. Baskar, R.; Lee, K.A.; Yeo, R.; Yeoh, K.W. Cancer and radiation therapy: Current advances and future directions. Int. J. Med. Sci. 2012, 9, 193–199. [Google Scholar] [CrossRef] [Green Version]
  4. Kupelian, P.A.; Ramsey, C.; Meeks, S.L.; Willoughby, T.R.; Forbes, A.; Wagner, T.H.; Langen, K.M. Serial megavoltage CT imaging during external beam radiotherapy for non-small-cell lung cancer: Observations on tumor regression during treatment. Int. J. Radiat. Oncol. Biol. Phys. 2005, 63, 1024–1028. [Google Scholar] [CrossRef]
  5. Shirato, H.; Le, Q.T.; Kobashi, K.; Prayongrat, A.; Takao, S.; Shimizu, S.; Giaccia, A.; Xing, L.; Umegaki, K. Selection of external beam radiotherapy approaches for precise and accurate cancer treatment. J. Radiat. Res. 2018, 59, i2–i10. [Google Scholar] [CrossRef] [Green Version]
  6. Moding, E.J.; Kastan, M.B.; Kirsch, D.G. Strategies for optimizing the response of cancer and normal tissues to radiation. Nat. Rev. Drug Discov. 2013, 12, 526–542. [Google Scholar] [CrossRef] [Green Version]
  7. Veldeman, L.; Madani, I.; Hulstaert, F.; De Meerleer, G.; Mareel, M.; De Neve, W. Evidence behind use of intensity-modulated radiotherapy: A systematic review of comparative clinical studies. Lancet Oncol. 2008, 9, 367–375. [Google Scholar] [CrossRef]
  8. Hainfeld, J.F.; Dilmanian, F.A.; Slatkin, D.N.; Smilowitz, H.M. Radiotherapy enhancement with gold nanoparticles. J. Pharm. Pharmacol. 2008, 60, 977–985. [Google Scholar] [CrossRef] [Green Version]
  9. Banoqitah, E.; Djouider, F. Dose Distribution and Dose Enhancement by Using Gadolinium Nanoparticles Implant in Brain Tumor in Stereotactic Brachytherapy. Radiat. Phys. Chem. 2016, 127, 68–71. [Google Scholar] [CrossRef]
  10. Taha, E.; Djouider, F.; Banoqitah, E. Monte Carlo simulations for dose enhancement in cancer treatment using bismuth oxide nanoparticles implanted in brain soft tissue. Australas. Phys. Eng. Sci. Med. 2018, 41, 363–370. [Google Scholar] [CrossRef]
  11. Taha, E.; Djouider, F.; Banoqitah, E. Monte Carlo simulation of dose enhancement due to silver nanoparticles implantation in brain tumor brachytherapy using a digital phantom. Radiat. Phys. Chem. 2019, 156, 15–21. [Google Scholar] [CrossRef]
  12. Podgorsak, E.B. Radiation Physics for Medical Physicists; Biological and Medical Physics, Biomedical Engineering; Springer: Berlin/Heidelberg, Germany, 2010; ISBN 978-3-642-00874-0. [Google Scholar]
  13. Su, X.Y.; Liu, P.D.; Wu, H.; Gu, N. Enhancement of radiosensitization by metal-based nanoparticles in cancer radiation therapy. Cancer Biol. Med. 2014, 11, 86–91. [Google Scholar]
  14. Butterworth, K.T.; Coulter, J.A.; Jain, S.; Forker, J.; McMahon, S.J.; Schettino, G.; Prise, K.M.; Currell, F.J.; Hirst, D.G. Evaluation of cytotoxicity and radiation enhancement using 1.9 nm gold particles: Potential application for cancer therapy. Nanotechnology 2010, 21, 295101. [Google Scholar] [CrossRef] [Green Version]
  15. Jain, S.; Coulter, J.A.; Butterworth, K.T.; Hounsell, A.R.; McMahon, S.J.; Hyland, W.B.; Muir, M.F.; Dickson, G.R.; Prise, K.M.; Currell, F.J.; et al. Gold nanoparticle cellular uptake, toxicity and radiosensitisation in hypoxic conditions. Radiother. Oncol. 2014, 110, 342–347. [Google Scholar] [CrossRef]
  16. Du, J.; Gu, Z.; Yan, L.; Yong, Y.; Yi, X.; Zhang, X.; Liu, J.; Wu, R.; Ge, C.; Chen, C.; et al. Poly(Vinylpyrollidone)- and Selenocysteine-Modified Bi2Se3 Nanoparticles Enhance Radiotherapy Efficacy in Tumors and Promote Radioprotection in Normal Tissues. Adv. Mater. 2017, 29, 1701268. [Google Scholar] [CrossRef]
  17. Hainfeld, J.F.; Slatkin, D.N.; Smilowitz, H.M. The use of gold nanoparticles to enhance radiotherapy in mice. Phys. Med. Biol. 2004, 49, N309–N315. [Google Scholar] [CrossRef]
  18. Hainfeld, J.F.; Smilowitz, H.M.; O’Connor, M.J.; Dilmanian, F.A.; Slatkin, D.N. Gold nanoparticle imaging and radiotherapy of brain tumors in mice. Nanomedicine 2013, 8, 1601–1609. [Google Scholar] [CrossRef] [Green Version]
  19. Hainfeld, J.F.; Ridwan, S.M.; Stanishevskiy, Y.; Panchal, R.; Slatkin, D.N.; Smilowitz, H.M. Iodine nanoparticles enhance radiotherapy of intracerebral human glioma in mice and increase efficacy of chemotherapy. Sci. Rep. 2019, 9, 4505. [Google Scholar] [CrossRef] [Green Version]
  20. Her, S.; Jaffray, D.A.; Allen, C. Gold nanoparticles for applications in cancer radiotherapy: Mechanisms and recent advancements. Adv. Drug Deliv. Rev. 2017, 109, 84–101. [Google Scholar] [CrossRef]
  21. Ricketts, K.; Ahmad, R.; Beaton, L.; Cousins, B.; Critchley, K.; Davies, M.; Evans, S.; Fenuyi, I.; Gavriilidis, A.; Harmer, Q.J.; et al. Recommendations for clinical translation of nanoparticle-enhanced radiotherapy. Br. J. Radiol. 2018, 91, 20180325. [Google Scholar] [CrossRef]
  22. Bonvalot, S.; Rutkowski, P.L.; Thariat, J.; Carrère, S.; Ducassou, A.; Sunyach, M.-P.P.; Agoston, P.; Hong, A.; Mervoyer, A.; Rastrelli, M.; et al. NBTXR3, a first-in-class radioenhancer hafnium oxide nanoparticle, plus radiotherapy versus radiotherapy alone in patients with locally advanced soft-tissue sarcoma (Act.In.Sarc): A multicentre, phase 2–3, randomised, controlled trial. Lancet Oncol. 2019, 20, 1148–1159. [Google Scholar] [CrossRef]
  23. Retif, P.; Pinel, S.; Toussaint, M.; Frochot, C.; Chouikrat, R.; Bastogne, T.; Barberi-Heyob, M. Nanoparticles for Radiation Therapy Enhancement: The Key Parameters. Theranostics 2015, 5, 1030–1044. [Google Scholar] [CrossRef] [Green Version]
  24. Wakefield, G.; Gardener, M.; Stock, M.; Adair, M. Nanoparticle Augmented Radiotherapy Using Titanium Oxide Nanoparticles. J. Nanomater. Mol. Nanotechnol. 2018, 7, S6-002. [Google Scholar] [CrossRef]
  25. Çeşmeli, S.; Biray Avci, C. Application of titanium dioxide (TiO2) nanoparticles in cancer therapies. J. Drug Target. 2019, 27, 762–766. [Google Scholar] [CrossRef]
  26. Rees, P.; Wills, J.W.; Brown, M.R.; Barnes, C.M.; Summers, H.D. The origin of heterogeneous nanoparticle uptake by cells. Nat. Commun. 2019, 10, 2341. [Google Scholar] [CrossRef]
  27. Koger, B.; Kirkby, C. Optimization of photon beam energies in gold nanoparticle enhanced arc radiation therapy using Monte Carlo methods. Phys. Med. Biol. 2016, 61, 8839–8853. [Google Scholar] [CrossRef]
  28. Hossain, M.; Su, M. Nanoparticle Location and Material-Dependent Dose Enhancement in X-ray Radiation Therapy. J. Phys. Chem. C 2012, 116, 23047–23052. [Google Scholar] [CrossRef] [Green Version]
  29. Zhang, S.X.; Gao, J.; Buchholz, T.A.; Wang, Z.; Salehpour, M.R.; Drezek, R.A.; Yu, T.-K. Quantifying tumor-selective radiation dose enhancements using gold nanoparticles: A monte carlo simulation study. Biomed. Microdevices 2009, 11, 925–933. [Google Scholar] [CrossRef]
  30. Cho, S.H.; Jones, B.L.; Krishnan, S. The dosimetric feasibility of gold nanoparticle-aided radiation therapy (GNRT) via brachytherapy using low-energy gamma-/X-ray sources. Phys. Med. Biol. 2009, 54, 4889–4905. [Google Scholar] [CrossRef]
  31. Cho, S.H. Estimation of tumour dose enhancement due to gold nanoparticles during typical radiation treatments: A preliminary Monte Carlo study. Phys. Med. Biol. 2005, 50, N163–N173. [Google Scholar] [CrossRef]
  32. Zhan, W.; Gedroyc, W.; Xu, X.Y. Effect of heterogeneous microvasculature distribution on drug delivery to solid tumour. J. Phys. D Appl. Phys. 2014, 47, 475401. [Google Scholar] [CrossRef] [Green Version]
  33. England, C.G.; Gobin, A.M.; Frieboes, H.B. Evaluation of uptake and distribution of gold nanoparticles in solid tumors. Eur. Phys. J. Plus 2015, 130, 231. [Google Scholar] [CrossRef] [Green Version]
  34. Lee, H.; Hoang, B.; Fonge, H.; Reilly, R.M.; Allen, C. In vivo distribution of polymeric nanoparticles at the whole-body, tumor, and cellular levels. Pharm. Res. 2010, 27, 2343–2355. [Google Scholar] [CrossRef]
  35. Cai, Y.; Xu, S.; Wu, J.; Long, Q. Coupled modelling of tumour angiogenesis, tumour growth and blood perfusion. J. Theor. Biol. 2011, 279, 90–101. [Google Scholar] [CrossRef]
  36. Grevillot, L.; Boersma, D.J.; Fuchs, H.; Aitkenhead, A.; Elia, A.; Bolsa, M.; Winterhalter, C.; Vidal, M.; Jan, S.; Pietrzyk, U.; et al. Technical Note: GATE-RTion: A GATE/Geant4 release for clinical applications in scanned ion beam therapy. Med. Phys. 2020, 47, 3675–3681. [Google Scholar] [CrossRef]
  37. Jan, S.; Santin, G.; Strul, D.; Staelens, S.; Assié, K.; Autret, D.; Avner, S.; Barbier, R.; Bardiès, M.; Bloomfield, P.M.; et al. GATE: A simulation toolkit for PET and SPECT. Phys. Med. Biol. 2004, 49, 4543–4561. [Google Scholar] [CrossRef]
  38. Sarrut, D.; Bardiès, M.; Boussion, N.; Freud, N.; Jan, S.; Létang, J.-M.; Loudos, G.; Maigne, L.; Marcatili, S.; Mauxion, T.; et al. A review of the use and potential of the GATE Monte Carlo simulation code for radiation therapy and dosimetry applications. Med. Phys. 2014, 41, 064301. [Google Scholar] [CrossRef] [Green Version]
  39. Papadimitroulas, P.; Loudos, G.; Nikiforidis, G.C.; Kagadis, G.C. A dose point kernel database using GATE Monte Carlo simulation toolkit for nuclear medicine applications: Comparison with other Monte Carlo codes. Med. Phys. 2012, 39, 5238–5247. [Google Scholar] [CrossRef]
  40. Grevillot, L.; Bertrand, D.; Dessy, F.; Freud, N.; Sarrut, D. A Monte Carlo pencil beam scanning model for proton treatment plan simulation using GATE/GEANT4. Phys. Med. Biol. 2011, 56, 5203–5219. [Google Scholar] [CrossRef] [Green Version]
  41. Jan, S.; Benoit, D.; Becheva, E.; Carlier, T.; Cassol, F.; Descourt, P.; Frisson, T.; Grevillot, L.; Guigues, L.; Maigne, L.; et al. GATE V6: A major enhancement of the GATE simulation platform enabling modelling of CT and radiotherapy. Phys. Med. Biol. 2011, 56, 881–901. [Google Scholar] [CrossRef]
  42. Bouchat, V.; Nuttens, V.E.; Lucas, S.; Michiels, C.; Masereel, B.; Féron, O.; Gallez, B.; Borght, T. Vander Radioimmunotherapy with radioactive nanoparticles: First results of dosimetry for vascularized and necrosed solid tumors. Med. Phys. 2007, 34, 4504–4513. [Google Scholar] [CrossRef]
  43. Zabihzadeh, M.; Moshirian, T.; Ghorbani, M.; Knaup, C.; Behrooz, M.A. A Monte Carlo Study on Dose Enhancement by Homogeneous and Inhomogeneous Distributions of Gold Nanoparticles in Radiotherapy with Low Energy X-rays. J. Biomed. Phys. Eng. 2018, 8, 13–28. [Google Scholar]
  44. Brocato, T.A.; Coker, E.N.; Durfee, P.N.; Lin, Y.-S.; Townson, J.; Wyckoff, E.F.; Cristini, V.; Brinker, C.J.; Wang, Z. Understanding the Connection between Nanoparticle Uptake and Cancer Treatment Efficacy using Mathematical Modeling. Sci. Rep. 2018, 8, 7538. [Google Scholar] [CrossRef] [Green Version]
  45. Humm, J.L.; Cobb, L.M. Nonuniformity of tumor dose in radioimmunotherapy. J. Nucl. Med. 1990, 31, 75–83. [Google Scholar]
  46. Chou, C.-Y.; Chang, W.-I.; Horng, T.-L.; Lin, W.-L. Numerical modeling of nanodrug distribution in tumors with heterogeneous vasculature. PLoS ONE 2017, 12, e0189802. [Google Scholar] [CrossRef] [Green Version]
  47. Bae, Y.H.; Park, K. Targeted drug delivery to tumors: Myths, reality and possibility. J. Control. Release 2011, 153, 198–205. [Google Scholar] [CrossRef] [Green Version]
  48. Golombek, S.K.; May, J.-N.; Theek, B.; Appold, L.; Drude, N.; Kiessling, F.; Lammers, T. Tumor targeting via EPR: Strategies to enhance patient responses. Adv. Drug Deliv. Rev. 2018, 130, 17–38. [Google Scholar] [CrossRef]
  49. Navya, P.N.; Kaphle, A.; Srinivas, S.P.; Bhargava, S.K.; Rotello, V.M.; Daima, H.K. Current trends and challenges in cancer management and therapy using designer nanomaterials. Nano Converg. 2019, 6, 23. [Google Scholar] [CrossRef] [Green Version]
  50. Yuan, F.; Dellian, M.; Fukumura, D.; Leunig, M.; Berk, D.A.; Torchilin, V.P.; Jain, R.K. Vascular permeability in a human tumor xenograft: Molecular size dependence and cutoff size. Cancer Res. 1995, 55, 3752–3756. [Google Scholar]
  51. Yildirimer, L.; Thanh, N.T.K.; Loizidou, M.; Seifalian, A.M. Toxicology and clinical potential of nanoparticles. Nano Today 2011, 6, 585–607. [Google Scholar] [CrossRef] [Green Version]
  52. Lewinski, N.; Colvin, V.; Drezek, R. Cytotoxicity of Nanoparticles. Small 2008, 4, 26–49. [Google Scholar] [CrossRef]
  53. Yu, M.; Zheng, J. Clearance Pathways and Tumor Targeting of Imaging Nanoparticles. ACS Nano 2015, 9, 6655–6674. [Google Scholar] [CrossRef] [Green Version]
  54. Kruszewski, M.; Grądzka, I.; Bartłomiejczyk, T.; Chwastowska, J.; Sommer, S.; Grzelak, A.; Zuberek, M.; Lankoff, A.; Dusinska, M.; Wojewódzka, M. Oxidative DNA damage corresponds to the long term survival of human cells treated with silver nanoparticles. Toxicol. Lett. 2013, 219, 151–159. [Google Scholar] [CrossRef]
  55. Ailawadi, G.; Stanley, J.C.; Williams, D.M.; Dimick, J.B.; Henke, P.K.; Upchurch, G.R. Gadolinium as a nonnephrotoxic contrast agent for catheter-based arteriographic evaluation of renal arteries in patients with azotemia. J. Vasc. Surg. 2003, 37, 346–352. [Google Scholar] [CrossRef] [Green Version]
  56. Beaudoux, V.; Blin, G.; Barbrel, B.; Kantor, G.; Zacharatou, C. Geant4 physics list comparison for the simulation of phase-contrast mammography (XPulse project). Phys. Medica 2019, 60, 66–75. [Google Scholar] [CrossRef]
  57. Apostolakis, J.; Bagulya, A.; Elles, S.; Ivanchenko, V.N.; Jacquemier, J.; Maire, M.; Toshito, T.; Urban, L. Validation and verification of Geant4 standard electromagnetic physics. J. Phys. Conf. Ser. 2010, 219, 032044. [Google Scholar] [CrossRef]
  58. Berger, M.J.; Hubbell, J.H.; Seltzer, S.M.; Chang, J.; Coursey, J.S.; Sukumar, R.; Zucker, D.S.; Olsen, K. XCOM: Photon Cross Section Database; Version 1.5; National Institute of Standards and Technology: Gaithersburg, MD, USA, 2010. Available online: http://physics.nist.gov/xcom (accessed on 21 February 2021).
  59. Jiao, D.; Cai, Z.; Choksi, S.; Ma, D.; Choe, M.; Kwon, H.-J.; Baik, J.Y.; Rowan, B.G.; Liu, C.; Liu, Z. Necroptosis of tumor cells leads to tumor necrosis and promotes tumor metastasis. Cell Res. 2018, 28, 868–870. [Google Scholar] [CrossRef] [Green Version]
  60. Liu, Z.; Jiao, D. Necroptosis, tumor necrosis and tumorigenesis. Cell Stress 2020, 4, 1–8. [Google Scholar] [CrossRef]
  61. Cho, S.H. TH-C-T-6C-04: Estimation of Tumor Dose Enhancement Due to Gold Nanoparticles during Typical Radiation Treatments: A Preliminary Monte Carlo Study. Med. Phys. 2005, 32, 2162. [Google Scholar] [CrossRef]
  62. Berbeco, R.I.; Ngwa, W.; Makrigiorgos, G.M. Localized Dose Enhanceent to Tumor Blood Vessel Endothelial Cells via Megavoltage X-rays and Targeted Gold Nanoparticles: New Potential for External Beam Radiotherapy. Int. J. Radiat. Oncol. 2011, 81, 270–276. [Google Scholar] [CrossRef]
  63. Sheikh-Bagheri, D.; Rogers, D.W.O. Monte Carlo calculation of nine megavoltage photon beam spectra using the BEAM code. Med. Phys. 2002, 29, 391–402. [Google Scholar] [CrossRef]
Figure 1. 3D Illustration of the tumor, including all layers, inside the water phantom.
Applsci 11 04900 g001
Figure 2. (a) Side and (b) top views showing the voxelization of the phantom. The white area represents the central voxels used to estimate the DEF along depth. Each central 4 voxels DEF is averaged for each depth.
Applsci 11 04900 g002
Figure 3. DEF along depth for (a) 50, (b) 100, (c) 150 and (d) 200 keV for 10, 20, and 30 mg/g concentrations of AgNPs.
Applsci 11 04900 g003
Figure 4. DEF along depth for (a) 50, (b) 100, (c) 150, and (d) 200 keV for 10, 20, and 30 mg/g concentrations of GdNPs.
Applsci 11 04900 g004
Figure 5. DEF along depth for (a) 50, (b) 100, (c) 150 and (d) 200 keV for 10, 20, and 30 mg/g concentrations of AuNPs.
Applsci 11 04900 g005
Figure 6. The maximum DEF in the tumor for (a) AgNPs, (c) GdNPs, and (e) AuNPs. The maximum DEF in non-tumor volume in the beam path for (b) AgNPs, (d) GdNPs, and (f) AuNPs.
Applsci 11 04900 g006
Figure 7. (a,c,e) The number of characteristic X-rays produced in the tumor as a function of incident photon energy for AgNPs, GdNPs, and AuNPs respectively. (b,d,f) The percentage of X-rays that escaped the tumor for AgNPs, GdNPs, and AuNPs respectively.
Applsci 11 04900 g007aApplsci 11 04900 g007b
Figure 8. (a,c,e) The total absorbed dose in the tumor as a function of energy for AgNPs, GdNPs, and AuNPs, respectively. (b,d,f) The contribution of characteristic X-rays to the total dose for AgNPs, GdNPs, and AuNPs, respectively.
Applsci 11 04900 g008aApplsci 11 04900 g008b
Table 1. The maximum DEF for different energies, NPs types and concentrations.
MaterialConcentration (mg/g)Energy (keV)
501001502003004006008001000150020004000
Ag102.981.661.271.121.061.121.051.041.031.041.021.02
204.902.301.461.201.111.071.051.051.031.051.031.02
306.742.901.651.311.111.051.051.041.041.041.031.03
Gd102.052.161.431.211.101.091.051.041.031.041.021.02
203.033.121.831.391.171.081.071.051.041.041.031.03
303.954.202.221.581.191.111.061.041.041.051.041.04
Au102.972.221.561.291.151.091.051.051.031.041.021.02
204.763.322.081.581.261.141.081.071.041.071.031.03
306.404.362.671.811.331.191.081.051.041.071.041.05
Table 2. Mass absorption and attenuation coefficients for Ag, Gd and Au [58].
Energy (keV)MaterialMass Absorption Coefficient (cm2/g)Mass Attenuation Coefficient (cm2/g)
50Ag6.069.44
Gd3.243.85
Au6.127.25
100Ag1.061.47
Gd1.843.10
Au2.075.15
150Ag0.360.54
Gd0.721.10
Au1.021.86
Publisher’s Note: MDPI stays neutral with regard to jurisdictional claims in published maps and institutional affiliations.

