Article

Adjustment of Wire Vibrations in Order to Improve Geometric Accuracy and Surface Roughness at WEDM

1
Department of Automobile and Manufacturing Technologies, The Technical University of Košice, Štúrova 31, 08001 Prešov, Slovakia
2
Department of Process Engineering, The Technical University of Košice, Štúrova 31, 08001 Prešov, Slovakia
*
Author to whom correspondence should be addressed.
Appl. Sci. 2021, 11(11), 4734; https://doi.org/10.3390/app11114734
Submission received: 30 April 2021 / Revised: 17 May 2021 / Accepted: 19 May 2021 / Published: 21 May 2021

Abstract

:
Although WEDM is one of the most precise finishing technologies, deviations from the required geometric shapes and surface roughness occur in the production of parts with rotary surfaces. Even though these shortcomings have only a minimal impact on planar cuts, the production of circular profiles is a different problem. One of the factors causing this poor quality is the vibration of the wire electrode. With appropriate vibration adjustment, it would be possible to achieve significant improvements of the eroded area quality, both in terms of geometric accuracy and in terms of surface roughness. This would significantly increase quality, enabling WEDM technology to compete with other technologies in terms of economic efficiency. Therefore, the proposed solution aims to provide a partial adjustment to the wire tool electrode vibrations, based on their sensing by the means of acoustic emissions or a laser beam, with subsequent dynamic adjustment of the actual technological parameter values. This way, the given solution will increase the production accuracy of circular holes, increase productivity, and ultimately provide an overall increase in the economic efficiency of the WEDM process. The article also presents the scheme of a control algorithm for monitoring and subsequent adjustments of the vibrations of the wire tool electrode during the electroerosion process in order to minimize geometric deviations of circularity, cylindricity and roughness of the machined surface.

1. Introduction

Because WEDM technology is a machining technologies with a high quality of machined surfaces, even a small geometric deviation in certain parts of a workpiece from the desired shape has an essential influence on the overall functionality of the component. Many research studies in this field point to this undesirable effect, such as Islam [1], Ali [2], and Firouzabadi [3]. In their research, they focused mainly on the identification of deviations in the eroded area from nominal dimensions. It is true that compliance with dimensional accuracy is an important, but not always, key factor in obtaining the required quality of an eroded surface. In practice, there is a large number of cases where the dimensional accuracy of a machined surface is maintained; however, the workpieces are still unsatisfactory in terms of exceeding permissible shape deviations. In the past, only a very small number of researchers have focused on research into these shape deviations. In addition, many of them have tried to understate the impact of geometric deviations of eroded surface shapes on the functionality of the finished product. They attributed this undesirable effect, in particular, to the inappropriate feed rate of the wire electrode. In particular, Yan [4], Sanchez [5], and Raksiri [6] paid attention to this area of research. In their works, they described a certain improvement in the geometric precision of the eroded surface by reducing the feed rate of the wire electrode. However, it should be emphasized that too low a wire electrode feed rate leads to a loss of productivity in the electroerosion process.
In order to achieve high reliability and a long lifespan for products, it is necessary to focus on the application of high-strength materials and on achieving high-quality machined surfaces. This was also noted by Ťavodová [7] who claimed that, in practice, we often encounter the fact that emphasis is placed only on qualitative indicators of a machined surface, concerning its dimensional accuracy, while geometric precision is treated as a sort of secondary quality parameter. In practice, its evaluation is only considered superficially. At the same time, according to Mouralova [8], it is the geometric deviations of the machined surface that have a primary influence on the operational functionality, durability, and service life of products made using progressive WEDM technology.
Habib [9] addressed the influence of tool electrode vibrations on the quality of eroded surfaces in terms of geometric accuracy. He found that the tool electrode vibrations also play significant role in the occurrence of geometric inaccuracies of machined surfaces after WEDM. In his study, he tried to identify the effect of the tensioning force of the tool electrode close to critical values in order to reduce the oscillation amplitude of the wire electrode during the electroerosion process. However, over the course of his work, he did not provide precise recommendations that could lead to their complete elimination. In this context, it is useful to draw attention to the fact that, by increasing the tensioning force of a wire electrode, it is possible to significantly contribute to an improvement in several qualitative indicators of a machined surface, after WEDM, in terms of geometric precision. Nevertheless, certain limitations follow from the material properties of wire electrodes, which only allow tensioning by a certain maximum force (Fw). When it is exceeded, the wire electrode breaks, which again has an adverse effect on the overall productivity of WEDM. Zheng [10], in his research, also focused on tool electrode vibrations, and he justified his research mainly by the fact that the issue of tool electrode vibrations, during WEDM, and their impact on the quality of an eroded surface, has been given very little space in the past.
Another group of researchers addressed the issue of the effect of wire electrode vibrations during WEDM on the quality of a machined surface in terms of surface roughness. Among them, Hoang [11] in particular is noted, who identified the influence of different vibration frequencies of the wire electrode and the workpiece on the roughness of a machined surface during WEDM. In his research, he found that the vibration of a workpiece has a significantly greater effect on the quality of a machined surface in terms of its roughness.
From the points mentioned above, it is apparent that the geometric precision and roughness of eroded planar surfaces, but especially curved surfaces in WEDM, are affected by a large number of technological and process input parameters. However, in many cases, we cannot determine the exact effects and contributions to the geometric inaccuracy of machined surfaces. Only to a very limited extent are the exact causes of these geometric deviations in eroded surfaces known; in many cases, there is only guesswork. The primary cause is not always exactly identified. One thing is certain though; they all have a common denominator, and that is the precision of the guiding of the wire electrode. These facts led us to carry out applied experimental research, the aim of which was to improve the quality indicators of machined surfaces after WEDM, in terms of geometric accuracy and surface roughness, by adjusting the vibrations of the wire tool electrode. The research was performed through the adjustment of vibrations after sensing them using the acoustic emission method and using a laser beam, followed by dynamic adjustment of the actual values of the technological parameters.

2. Geometric Accuracy and Surface Roughness in Electrical Discharge Machining

The machined surface quality achieved through electrical discharge machining, in terms of roughness parameters (according to ISO 4287) is according to Hamed [12], Slatineanu [13], and Ranjan [14], and is comparable to the surface quality of fine grinding (Figure 1). Grinded surfaces are often characterized by a high gloss of the machined surface. However, in many cases, these have higher values of the arithmetic mean deviation of the roughness profile (Ra), the maximum height of the roughness profile (Rz), or the root mean square deviation of profile Rq than matte eroded surfaces.
The resulting value of the maximum height of roughness profile Rz of the finished surface after WEDM is in the range from 1.5 to 20.0 micrometers. The arithmetic mean deviation of profile Ra is greater than 3 to 5 times.
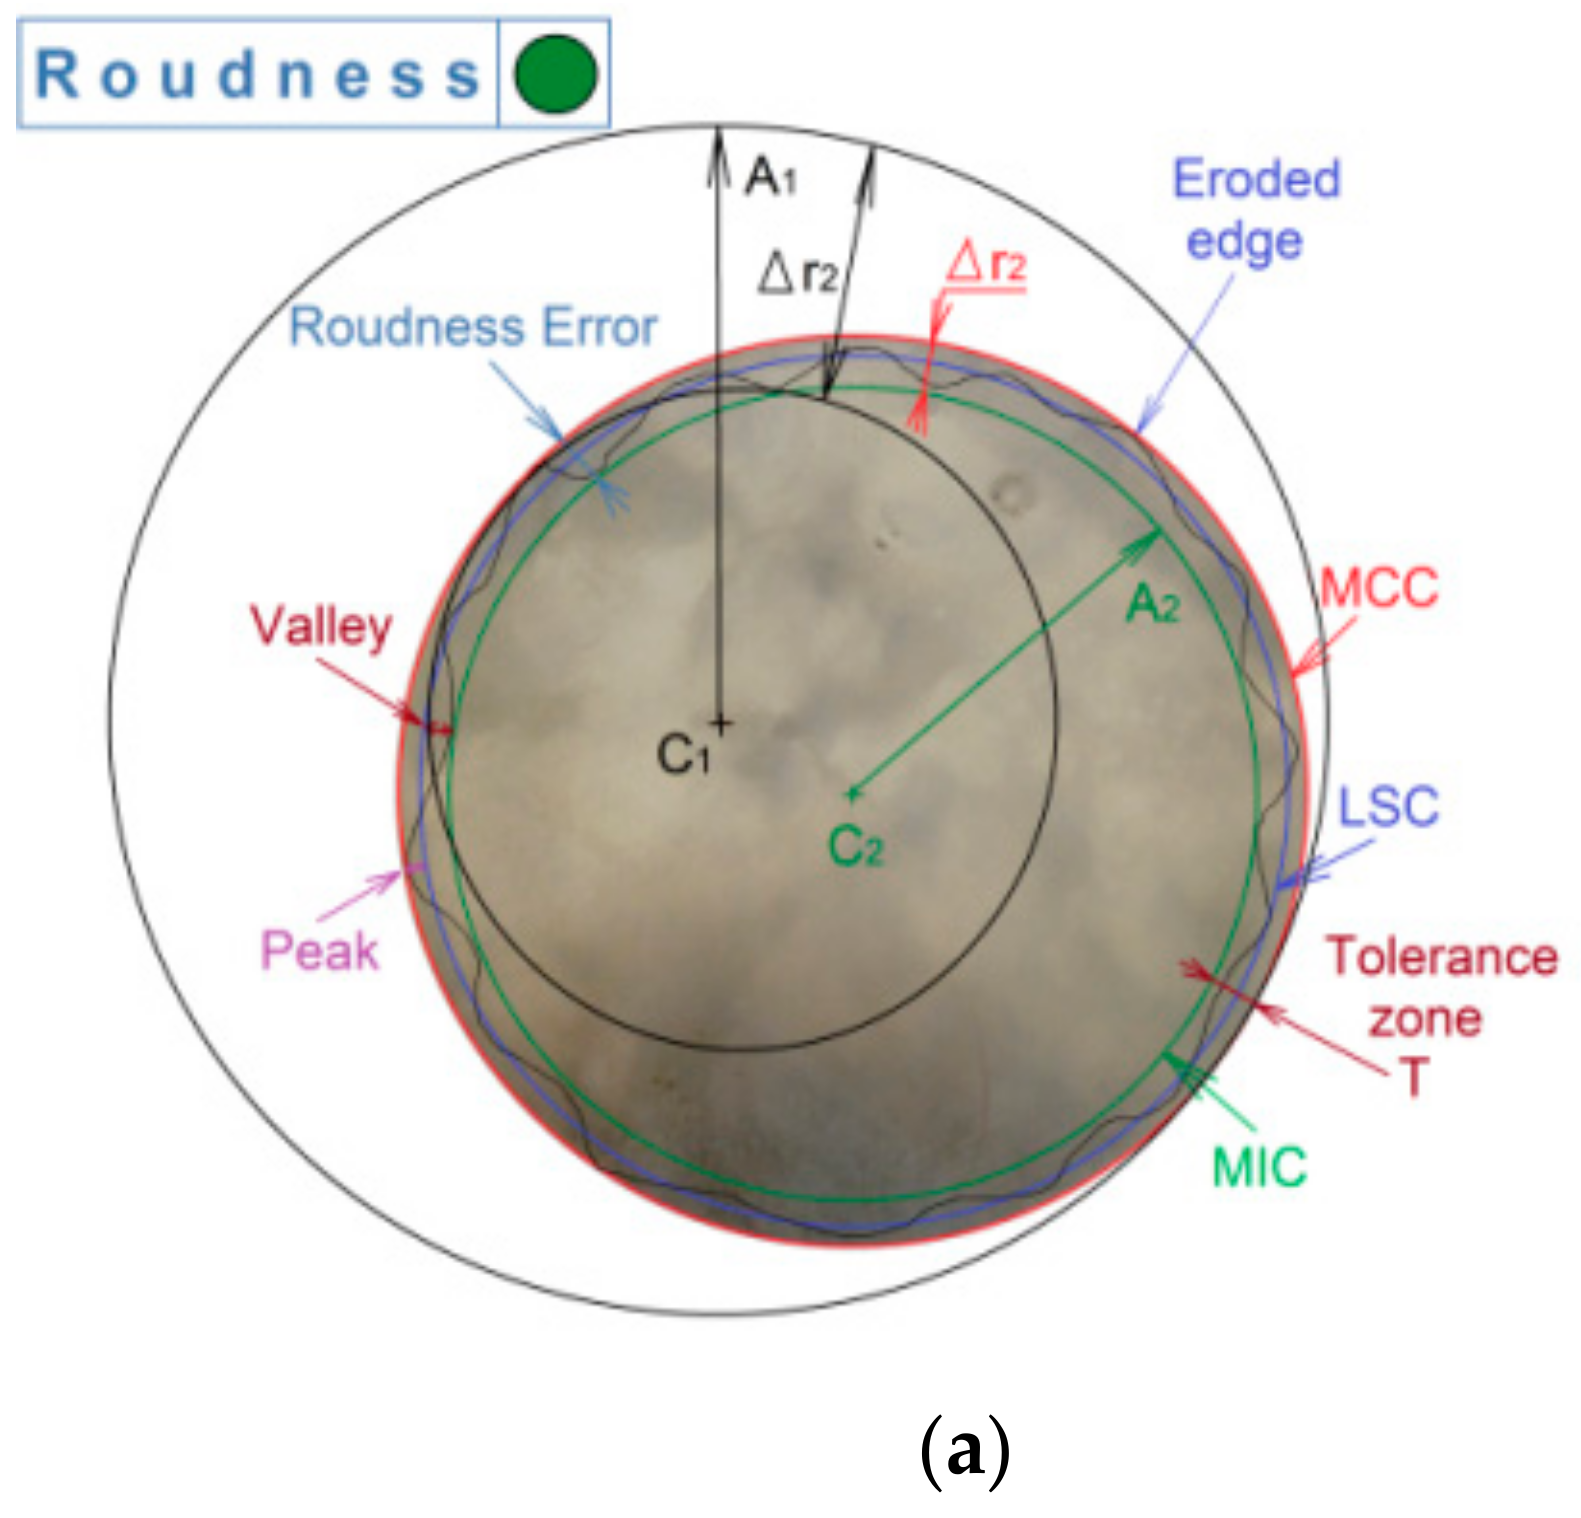
According to Mao [15], after WEDM, geometric deviations of the machined surface usually represent shape deviations. Of these, deviations in circularity and cylindricality are particularly important for maintaining the quality of a machined surface after WEDM with a circular shape profile [16]. In the case of circularity deviations, the circular profile can be considered correct if the difference in the radii of two concentric circles, between which is located any point of the actual profile, equals or is less than the tolerance value (T) (Figure 2a). In the case of cylindrical deviations, the cylindrical profile is suitable only if the difference between the diameters of two concentric cylinders, between which is located any point of the actual profile, equals or is less than the tolerance value (T) (Figure 2b). In both cases, the center of the concentric circles/cylinders and their radii must be chosen so that their difference is as small as possible.
If the correct position of the concentric circles is according to Figure 2a, designated as A2, with a center at C2, then the maximum permissible distance (Δr2) of the considered circular profile is represented by two concentric circles. Their maximum radial distance is equal to the maximum permissible value, and is usually given as tolerance (T). The actual achieved value of the dimension of the machined surface, in any part of the circular profile, must therefore be located between these two concentric circles. The same applies for cylindrical deviations. The maximum radial distance between two concentric cylinders, in general, equals the maximum permissible value given as tolerance (T) (Figure 2b).
Dzionk [17] and Meshram [18] argued that the occurrence of geometric deviations from circularity and cylindricality of an actual machined surface from a nominal surface after WEDM depends on several factors. First, these geometric deviations depend on the limit values of the accuracy of the hardware and software guidance of the wire electrode and the workpiece. This was also confirmed by Oniszczuk-Swiercz [19]. Other factors entering the process, which result in undesired geometric form deviations, are the properties of the wire electrode and those of the workpiece material. Shandilya [20], Rani [21], and Ngocpi [22] also declared these facts. According to Rouniyar [23], Yan [24], and Salcedo [25] the key factors are also technological and process parameters. Aggarwal [26] and Świercz [27] also claimed that the final value of the geometric form deviations from circular profiles, made using WEDM, is the result of the complex influence of these factors during the electroerosion process.

3. Materials and Methods

Because the magnitude of the geometric deviations from circularity and cylindricity of a machined surface after WEDM depends on many factors, it was necessary to include these effects in the experiments. The results of their complex actions were obtained from the wire electrode vibrations, with varying frequencies and amplitudes. Table 1 shows the basic ranges of the main technological parameter settings. It also provides a preliminary analysis of the causes of wire tool electrode vibrations, which were obtained from available sources of information.
From the analysis listed in Table 1, it is evident that an effective element in reducing the vibrations of the wire electrode during WEDM is an increase in the value of the technological parameter, toff. However, it should be emphasized that, with an increase in the value of the toff parameter, there is also a significant loss of productivity in the electroerosion process. For the purpose of experimental measurements, samples with circular cross-sections with a material thickness of Hw = 10.0, 50.0, and 100.0 mm were made with a variable diameter in the range of ⌀Ci = 5.0–120.0 mm. These dimensions were chosen in accordance with the valid standard STN ISO/TS 12781-1: 2008 Geometrical Product Specifications (GPS). All samples were made on an Agiecut Classic 3S EDM (AGIE SA, Losone, Switzerland) (Figure 3), an autonomous CNC electroerosion device.
The samples were made of tool steel, marked as EN 40CrMnMoS8-6 (W.-Nr. 1.2312), from Bogner Edelstahl Czech Republic Ltd. This is an alloyed chromium–manganese–molybdenum steel with good hardenability and machinability, thanks to its high sulphur content, even in a hardened and tempered state. Yaman [28] states that, in practice, this material is used for the production of molds for plastics and light alloys with a low melting point, etc. It is suitable for chromium plating and nitriding up to a hardness of approx. 800 HV. For less demanding tools, it can be used in a refined state at 950 to 1100 N·mm−2 without further heat treatment. Table 2 shows the chemical composition and selected mechanical and physical properties of EN 40CrMnMoS8-6 tool steel.
To achieve a maximum strength of 1950 MPa and a hardness of 53 HRC for the base material, the EN40CrMnMoS8-6 steel samples were heat treated using martensitic hardening before WEDM. The hardening was performed at a temperature of 1050 °C in oil. In order to eliminate errors related to the inhomogeneity of heat treatment and the removal of residual internal stresses that could adversely affect the results of the circularity and cylindricity deviation measurements, the sample material was subsequently heat treated via tempering at a low temperature of 100 °C.
An Ms wire electrode made of EN CW508L material (W.-Nr. 2.0321) with a 0.25 mm diameter, sold under the trade name Bedra Megacut pro® TWO/250 (Berkenhoff GmbH, Heuchelheim, Germany), was used in the experiments. Its basic mechanical, physical, and chemical properties are listed in Table 3.
The working medium was a dielectric liquid based on deionized water with an electrical conductivity less than 10 μS·cm1. The required dielectric fluid properties were achieved with AMBERLITE MB9L deionization resin. It is a homogeneous mixture of acid cation exchange resin (46–55%) in the form of hydrogen (H+) with a strongly basic anion exchange resin (54–45%) in the form of hydroxide (OH).
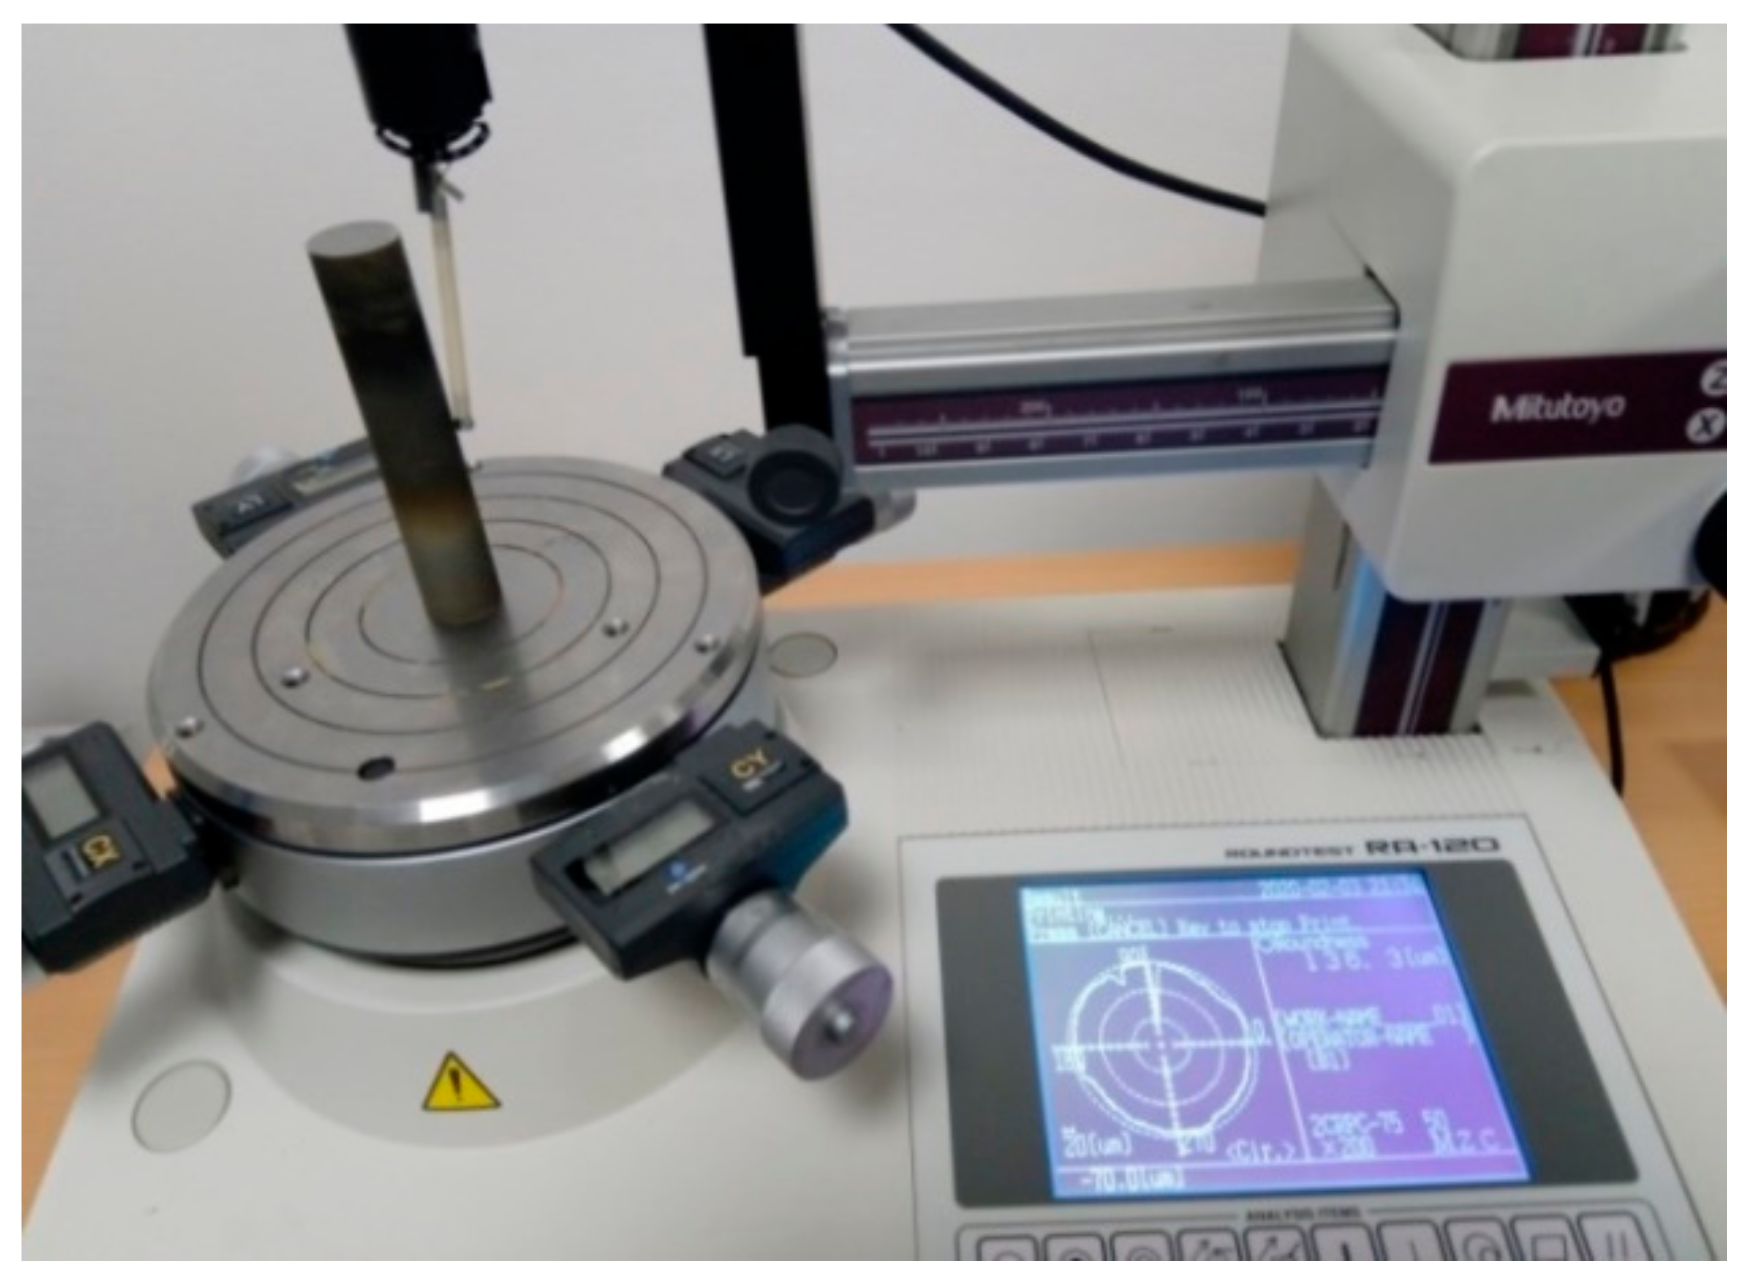
The evaluation of the deviations of the circularity (yCmax) and the cylindricity (zCmax) of the machined surface after WEDM was performed in accordance with valid standards (STN EN ISO 12181 and 12781). For the identification of deviation sizes, a compact measuring instrument (Roundtest RA-120 Mitutoyo) was used. To measure and evaluate the roughness parameters of the eroded surface, a Mitutoyo Surftest SJ 400 contact profilometer was used, which is used in practice as a standard for measuring roughness, corrugation, and primary profiles. The measurements were performed in accordance with the valid standard, STN ISO 4287.

4. Results of Experiments

4.1. Circularity Deviations vs. Roughness of Eroded Surface after Electrical Discharge Machining

The identification of geometric deviations of circularity yCmax of the experimental samples profile from EN40CrMnMoS8-6 tool steel was performed. Individual values of circularity deviations were successively measured from the upper edge downwards, as shown in Figure 4.
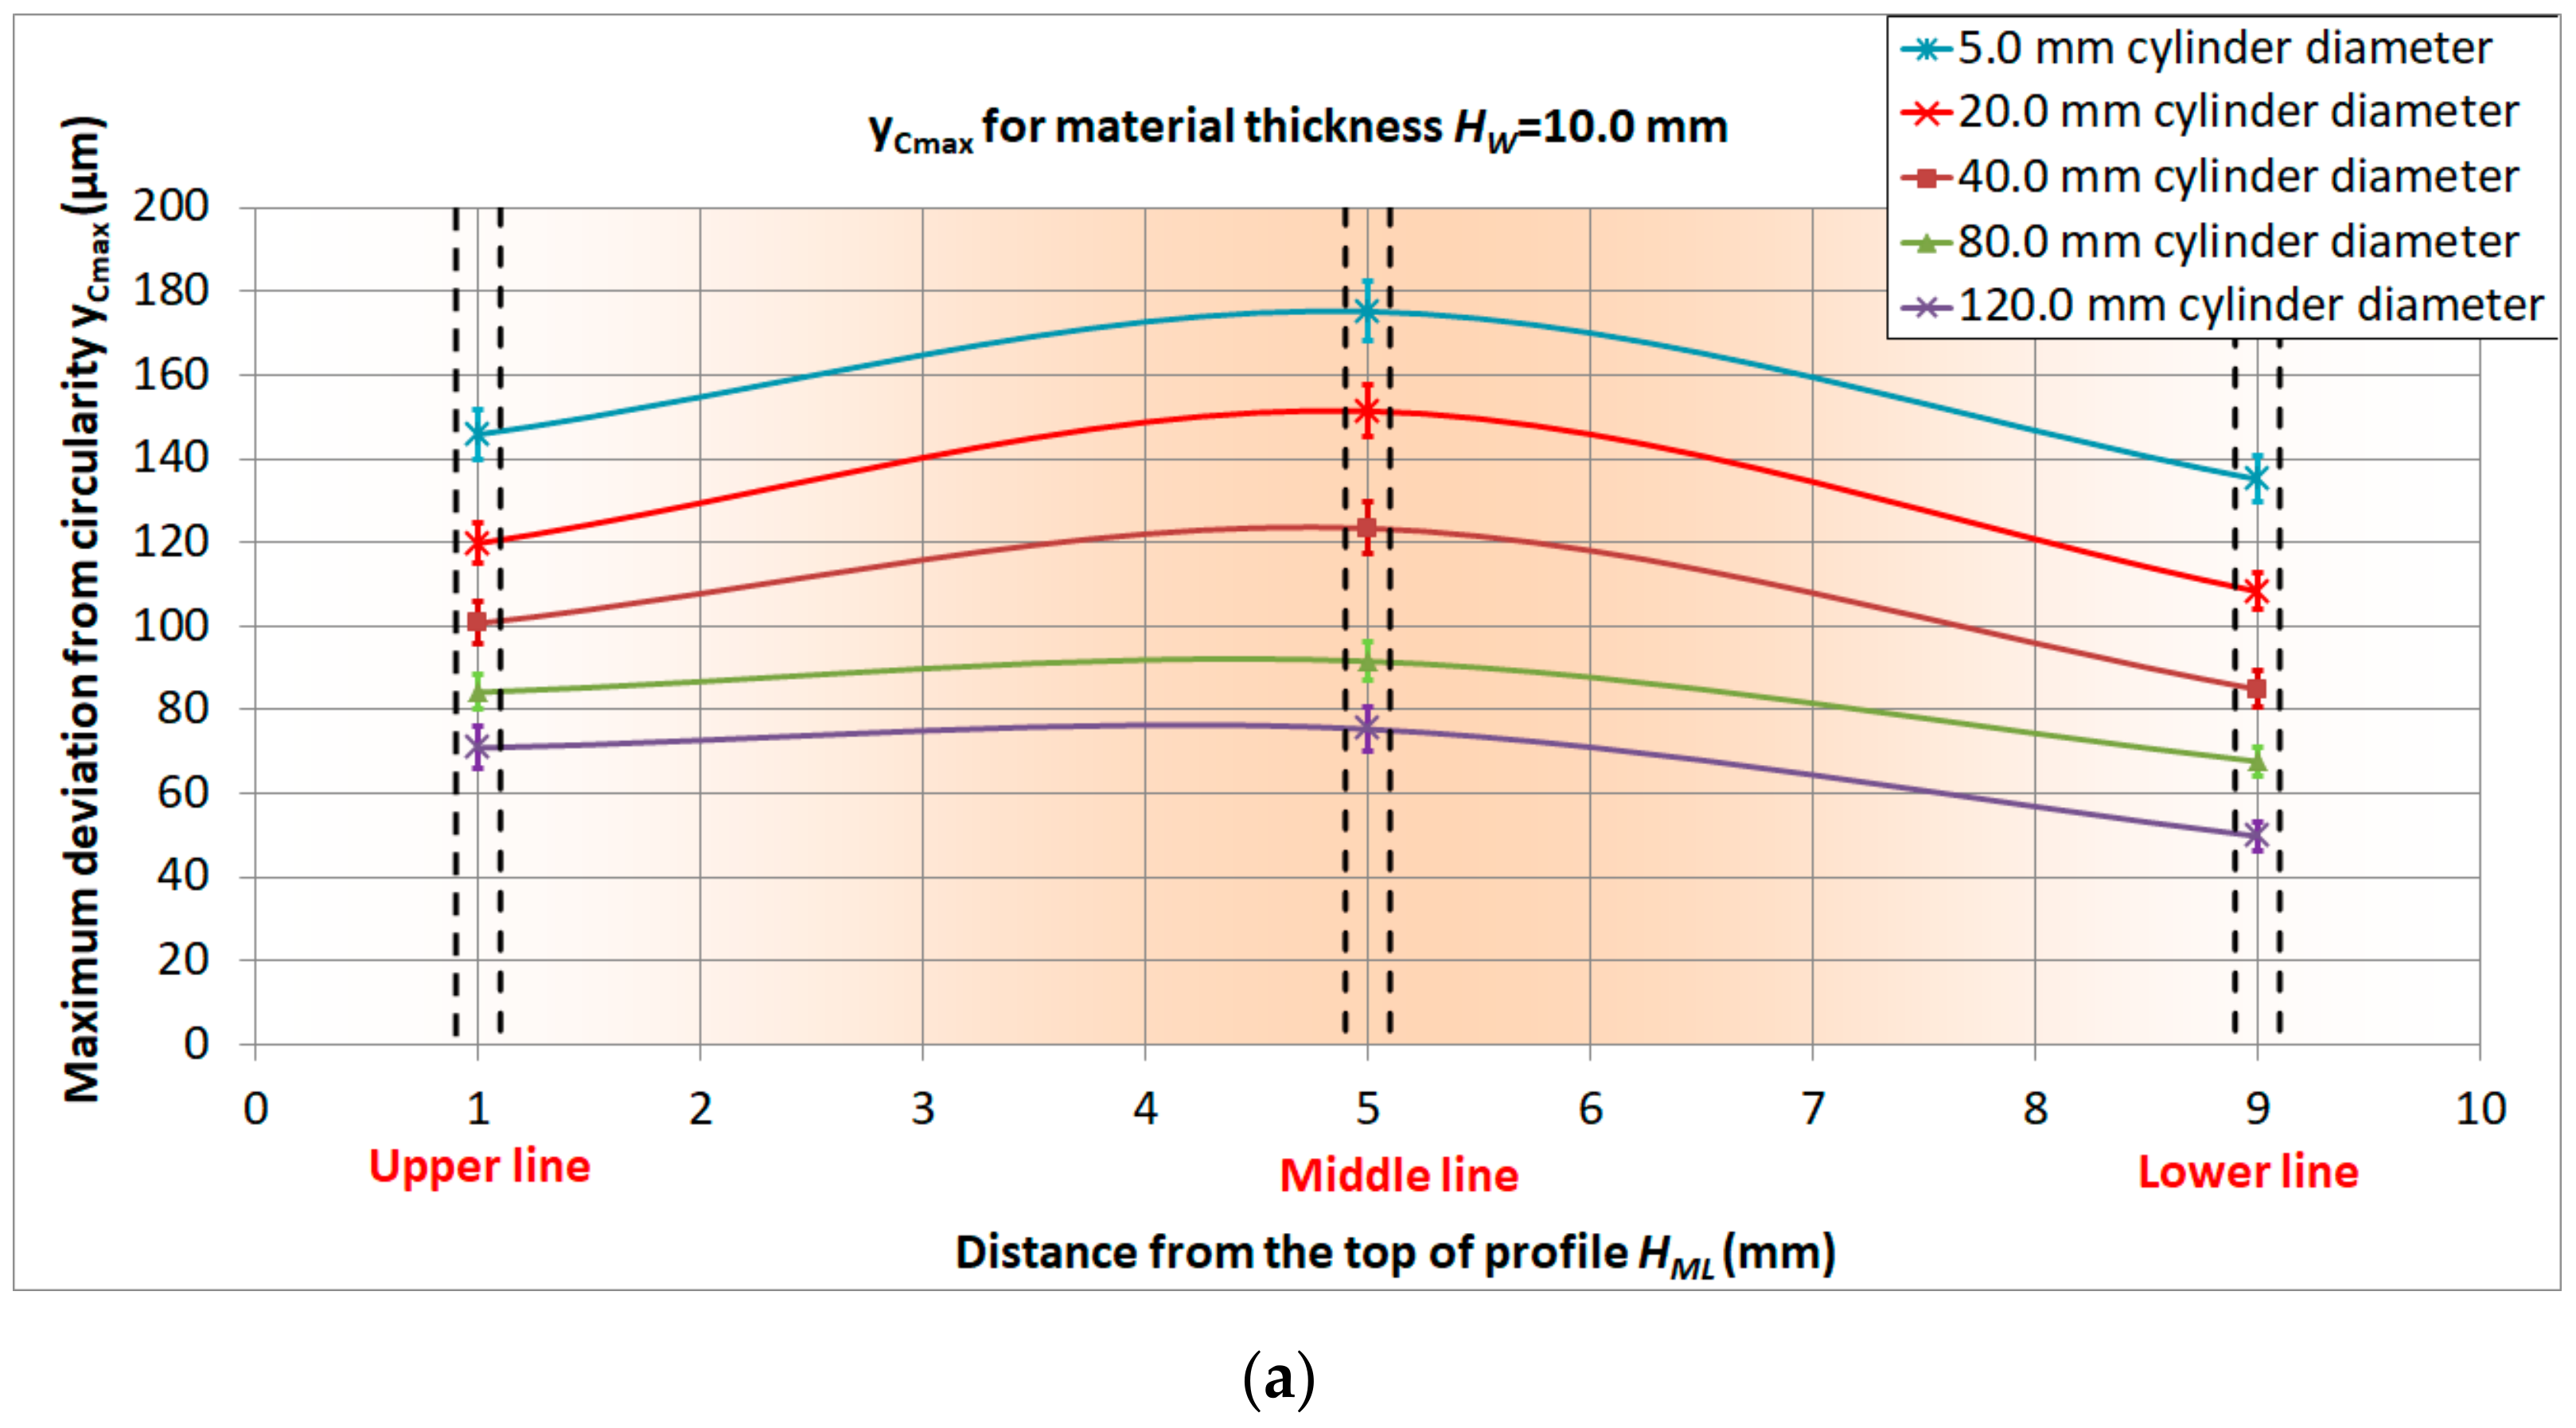
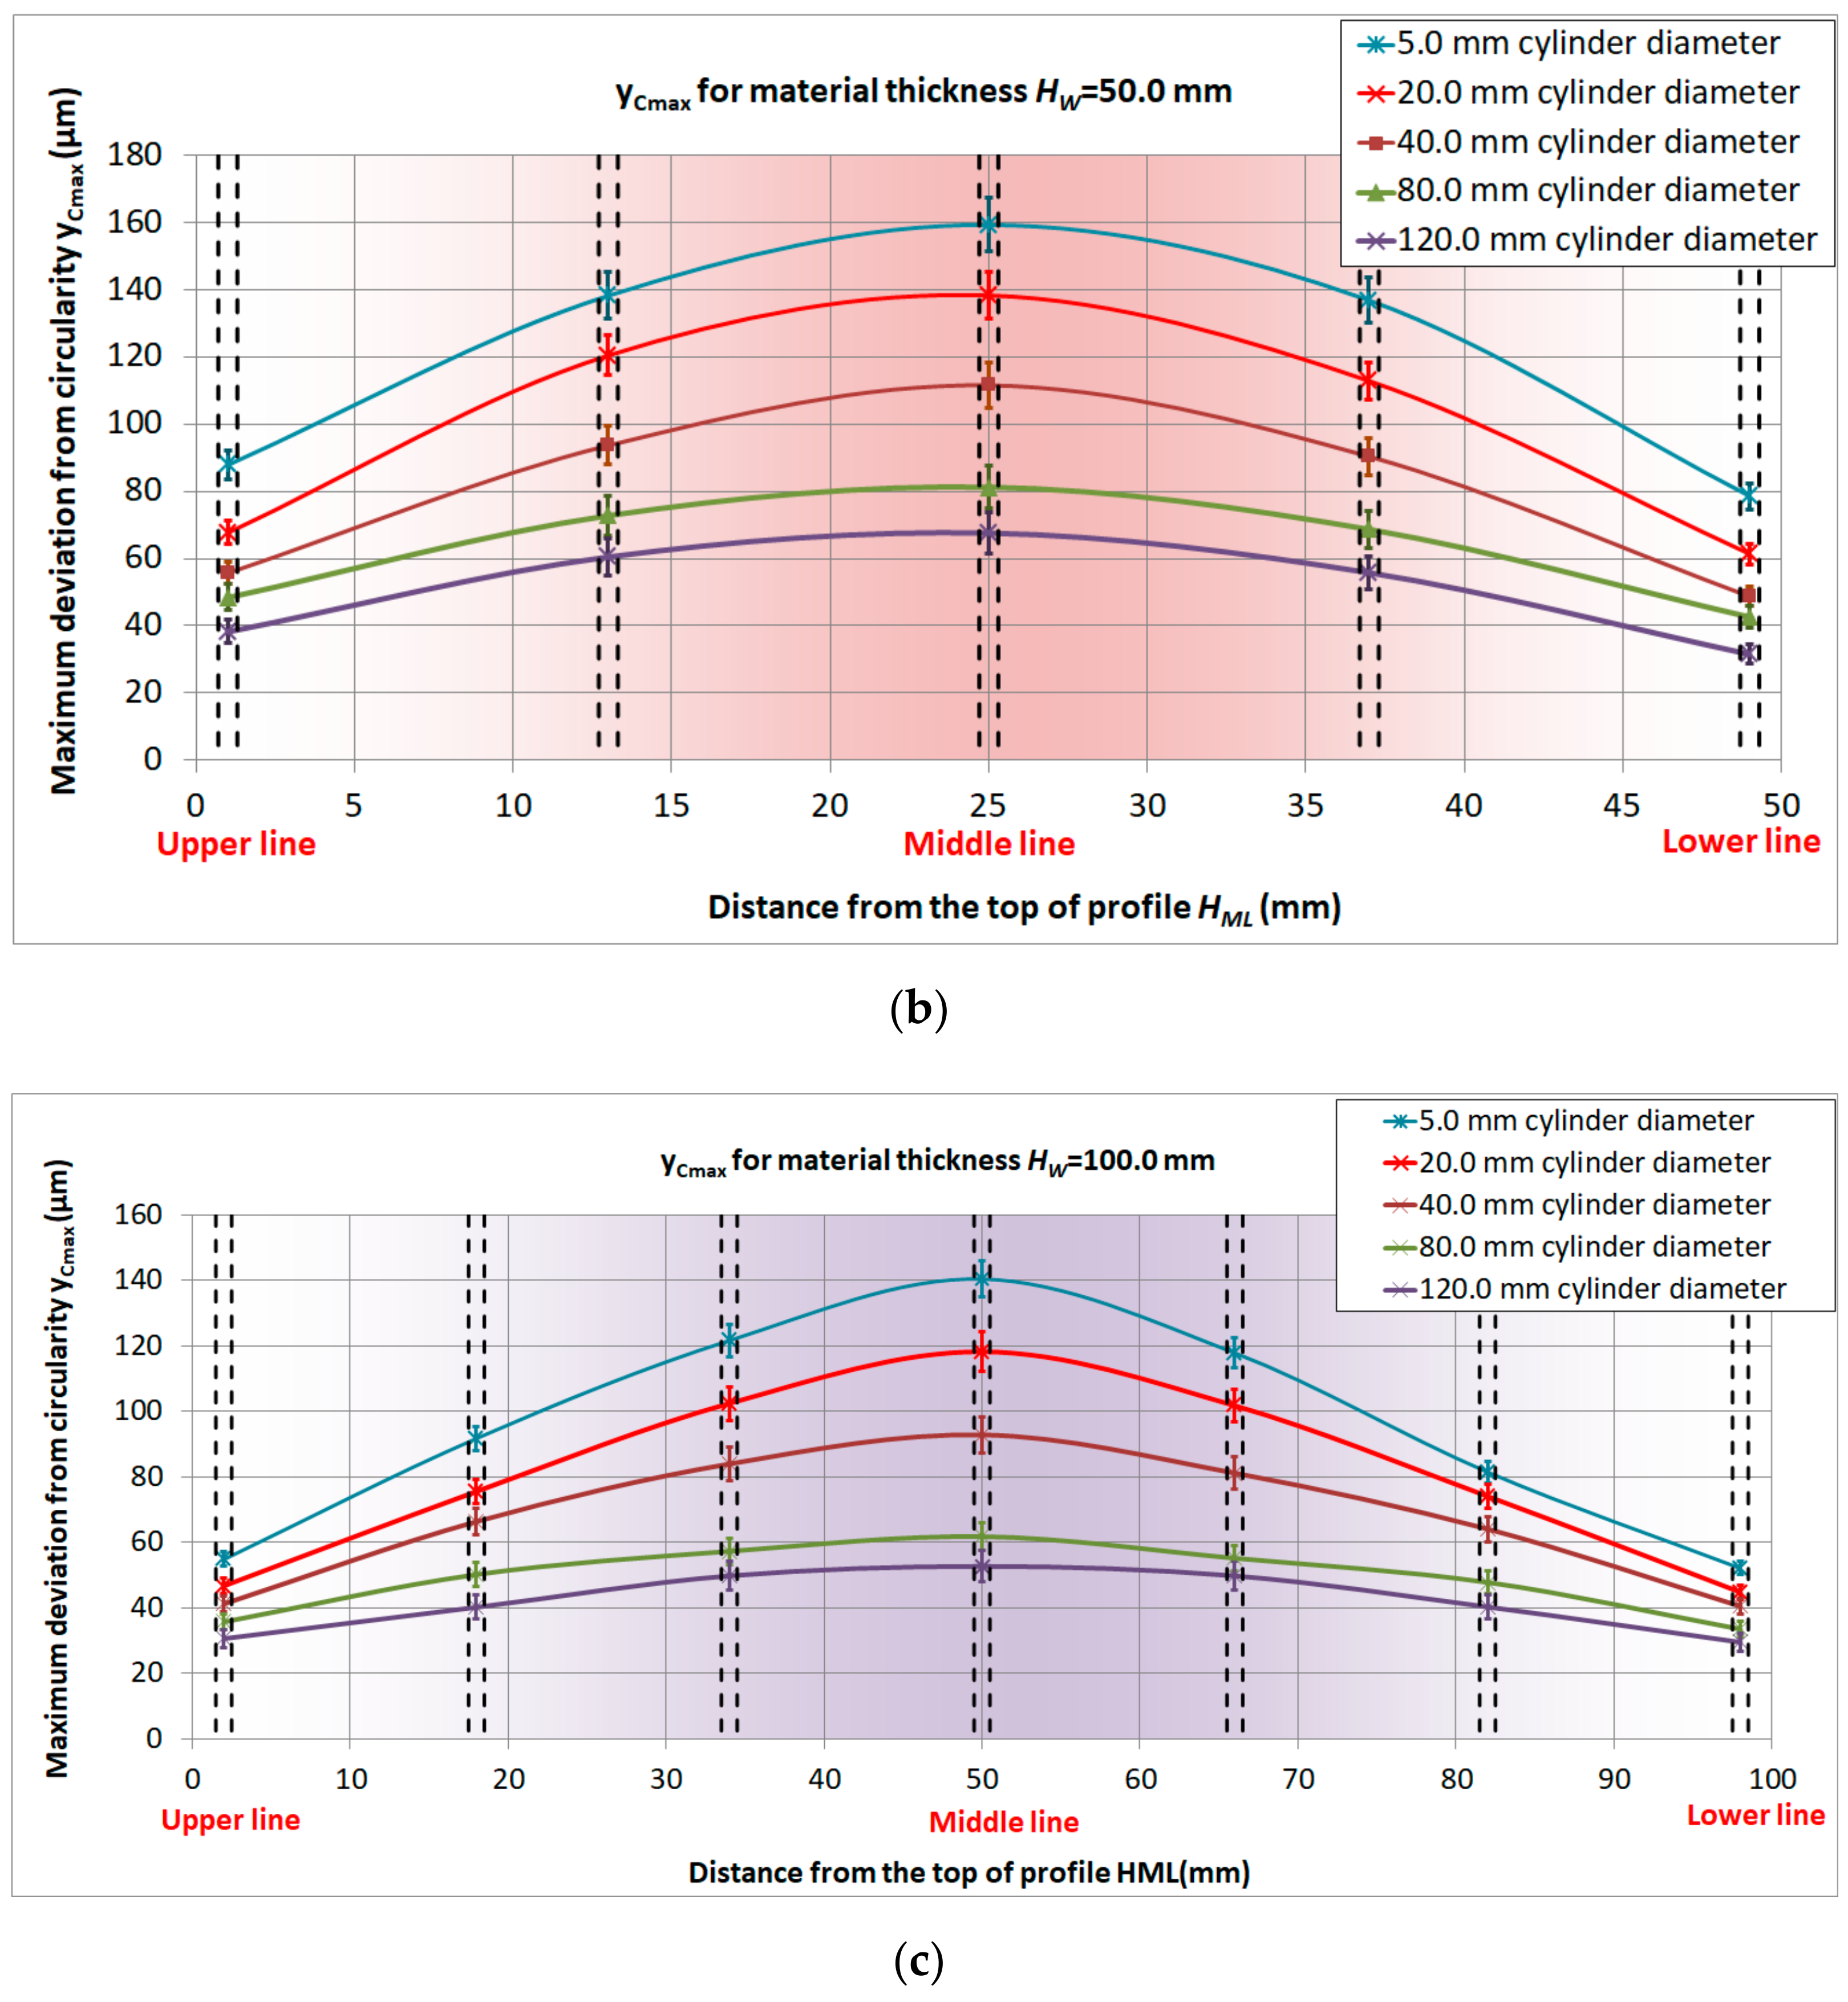
Through the complex identification of maximum geometric deviations from circularity yCmax of experimental samples (circular cross-section with nominal diameters of ⌀Ci = 5.0, 20.0, 40.0, 80.0, and 120.0 mm, made using WEDM technology from EN 40CrMnMoS8-6 tool steel using a wire electrode (Bedra Megacut pro® TWO/250) with a diameter ⌀TE = 0.25 mm) the courses of the deviations (Figure 5) were determined for individual material thicknesses of Hw = 10.0, 50.0, and 100.0 mm.
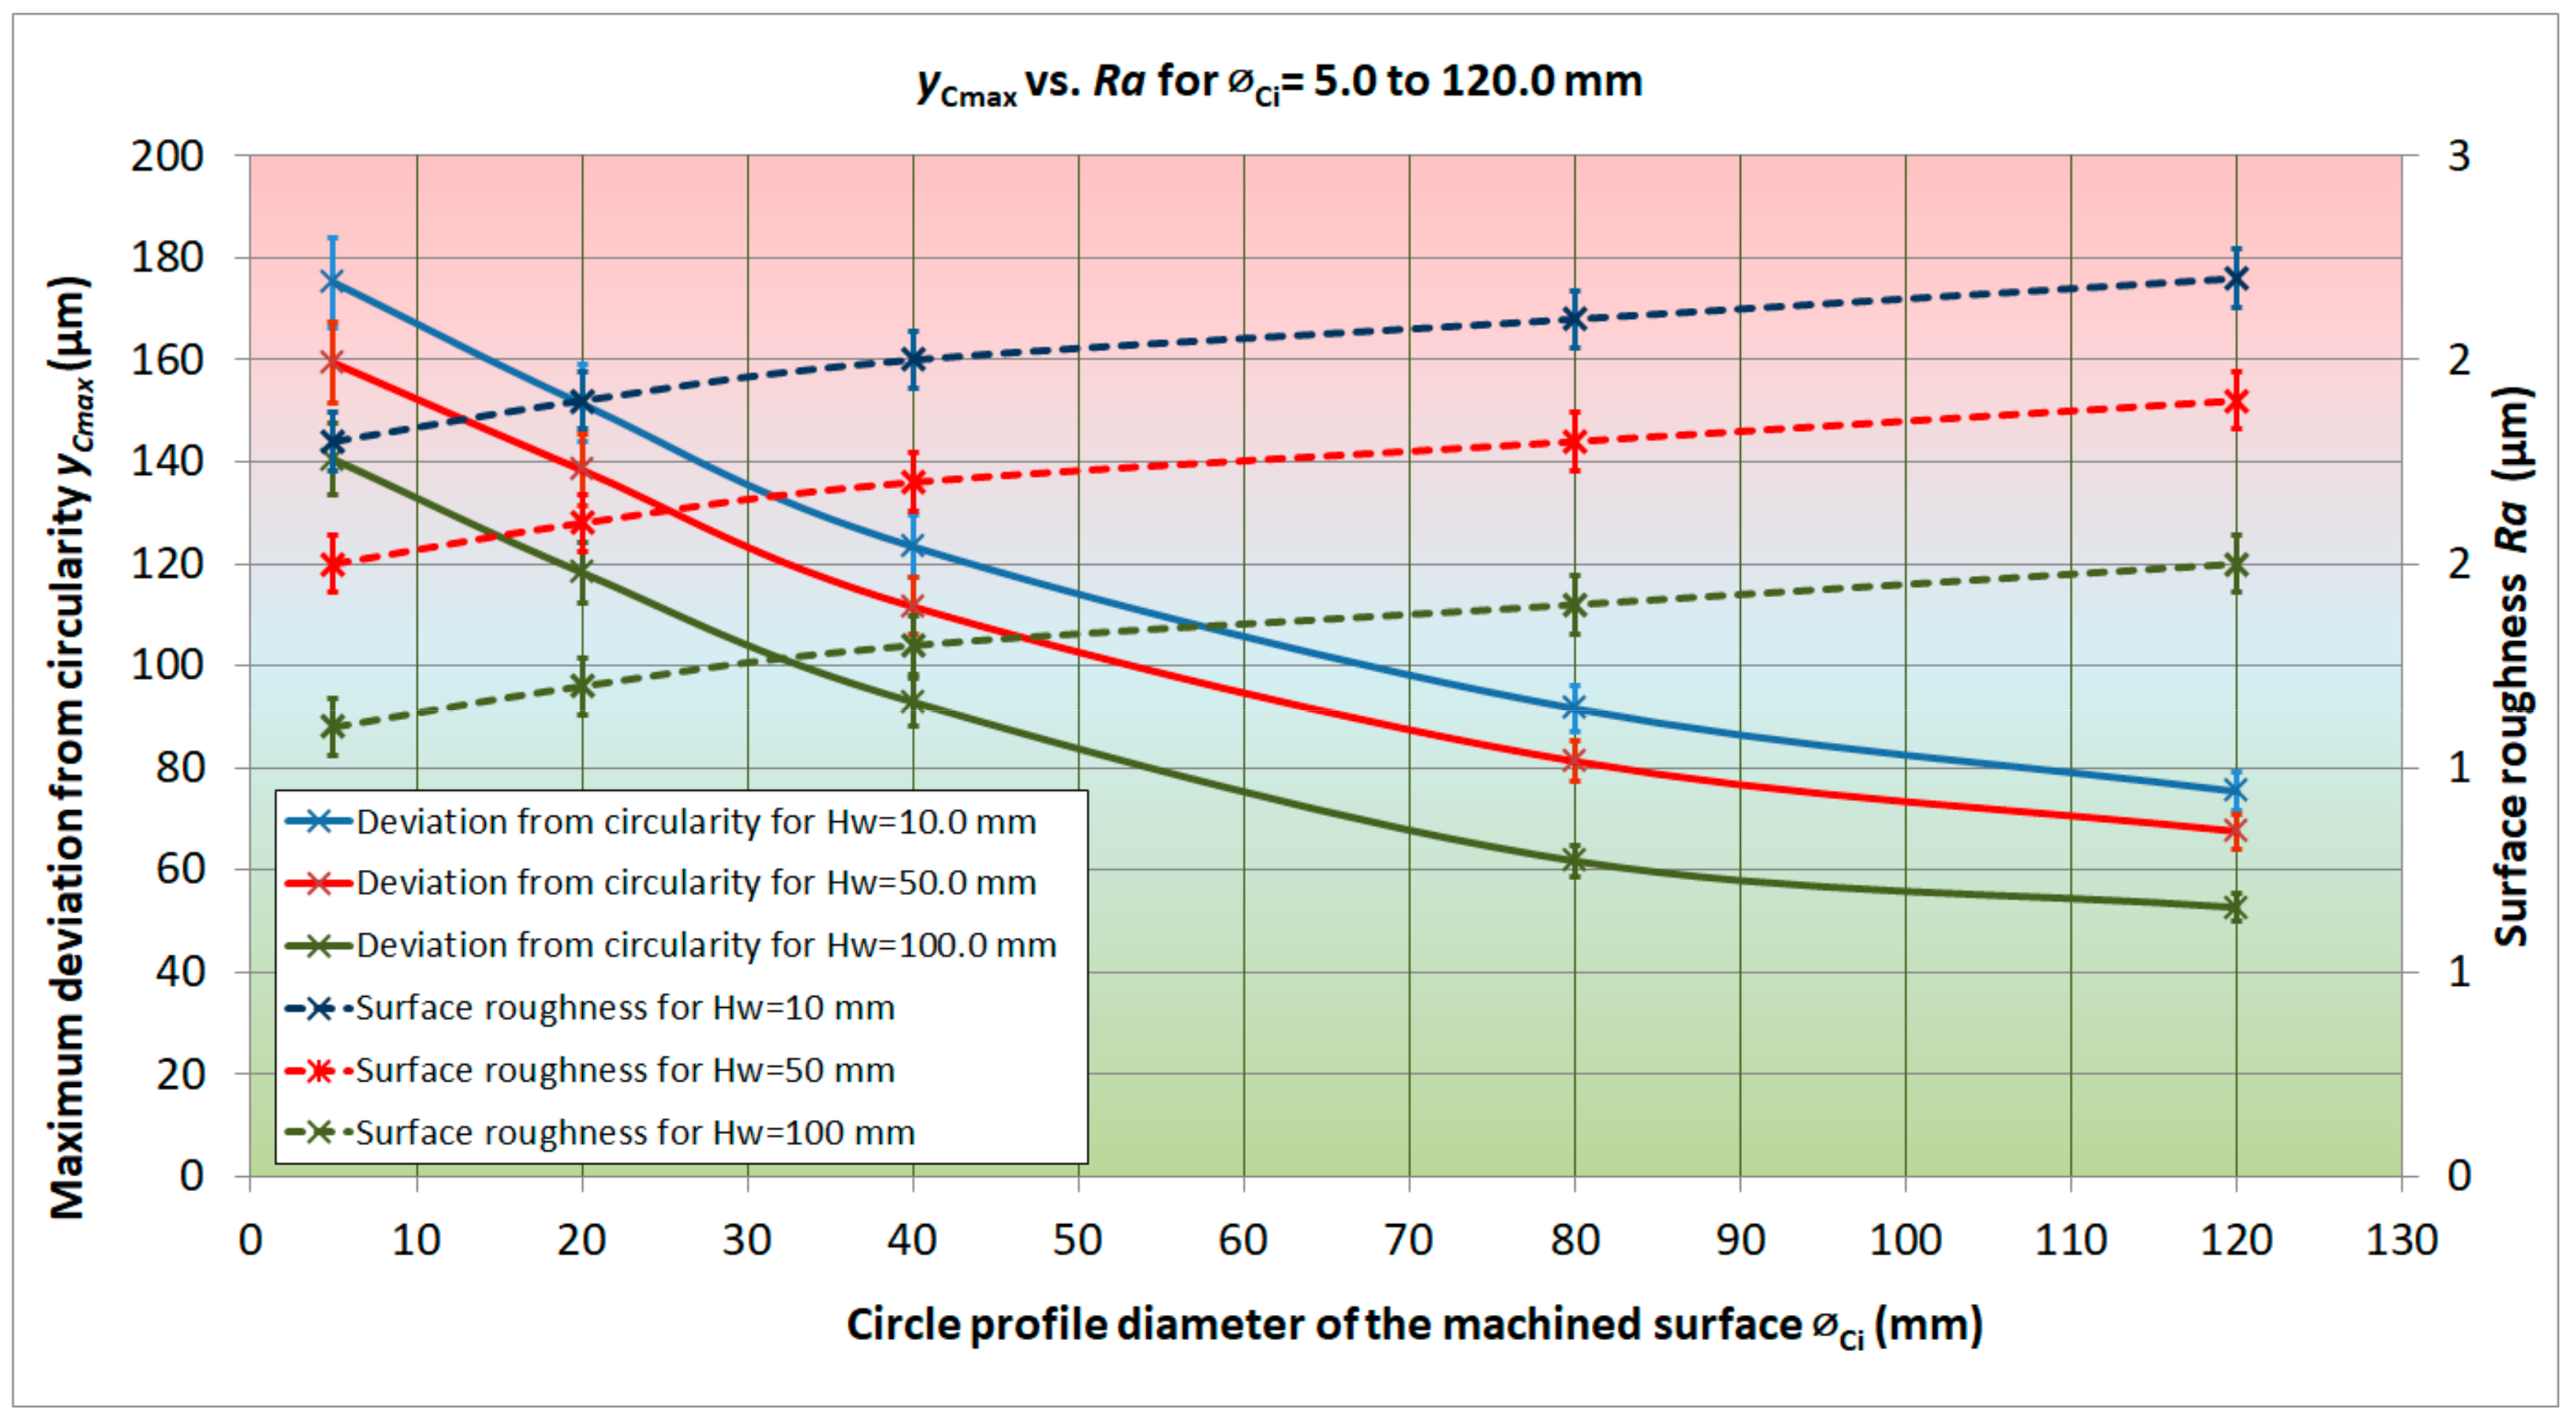
Based on the identified values of the maximum geometric deviations of circularity yCmax in the individual lines of the profiles of the machined surfaces after WEDM using a Ms wire electrode of ⌀TE = 0.25 mm, several significant facts were determined. First of all, it was found that the smallest deviations in circularity yCmax were recorded in the upper and lower profiles of the eroded area. The lowest value of yCmax = 29.5 μm was recorded in the lower edge of the eroded profile with a thickness Hw = 100.0 mm and a diameter ⌀Ci = 120.0 mm. These circularity deviations increased significantly in the direction of the middle of the profile, reaching a maximum value at approximately the middle of the profile. The highest value of yCmax = 175.2 μm was achieved in the middle of the erosion profile with a thickness Hw = 10.0 mm and diameter ⌀Ci = 5.0 mm. In some cases, the increase was up to two-fold.
At the same time, experimental measurements of the roughness parameters of the eroded surface were performed on the experimental samples made using tool steel after WEDM. The roughness of the machined surface was measured in several lines of the eroded area, from the upper edge of the sample towards the lower edge, as shown in Figure 6.
Even though several sources in the literature report that parameter Rz shows more reliable results for surfaces machined via electroerosion, from a practical point of view, roughness parameter Ra was considered when evaluating the results of the experimental measurements. The graphical dependences in Figure 7 document the course of deviations of circularity (yCmax) vs. roughness of the machined surface (Ra) of experimental samples after WEDM at individual parameters of ⌀Ci and Hw.
A trend was found of an increasing value of geometric deviations of circularity (yCmax) with a decreasing diameter of the machined profile; the largest value was achieved with a hole diameter of ⌀Ci = 5.0 mm. This is a relatively interesting finding because our initial assumption was that the value of the geometric deviations of the circularity (yCmax) would increase by increasing the diameter (⌀Ci) of the machined hole. Therefore, this effect was further investigated in detail. Based on the performed analyses, we supposed that this deviation was caused by an incorrect interpolation or incorrect control of the X and Y axes of the actuators. This deviation can also be, to some extent, eliminated by the proper setting of technological parameters and a high-quality technological base for the EDM machine. However, it is practically impossible to completely eliminate it. In addition, with increasing age and wear of the electroerosion machine, this deviation increases. The assumption that the range of technological parameter settings also significantly affects the deviation of circularity (yCmax) is also supported by the finding that, with an increasing thickness in the material (Hw) there was a partial decrease in the circularity deviation. The maximum deviation of circularity, yCmax = 175.2 μm, was recorded at the height of the eroded material, Hw = 10.0 mm, and at the diameter of ⌀Ci = 5.0 mm, while, at the height of the eroded profile, Hw = 100.0 mm, and a diameter of ⌀Ci = 5.0 mm, the maximum deviation of circularity, yCmax = 140.5 μm, was recorded. This represented a significant decrease. At the same time, the course of the surface roughness parameter (Ra) was identified based on the performed experimental measurements. It was found that with an increasing diameter (⌀Ci) the roughness of the machined surface also increased. It was also found that higher values of surface roughness (Ra) were recorded at smaller thicknesses (Hw) of the machined material. The highest value of the surface roughness, Ra = 2.2 μm, was recorded at Hw = 10.0 mm and ⌀Ci = 120.0 mm. On the contrary, the lowest value of the machined surface roughness, Ra = 1.1 μm, was recorded at Hw = 100.0 mm and ⌀Ci = 5.0 mm.

4.2. Cylindricity Deviations vs. Roughness of Eroded Surface after Electrical Discharge Machining

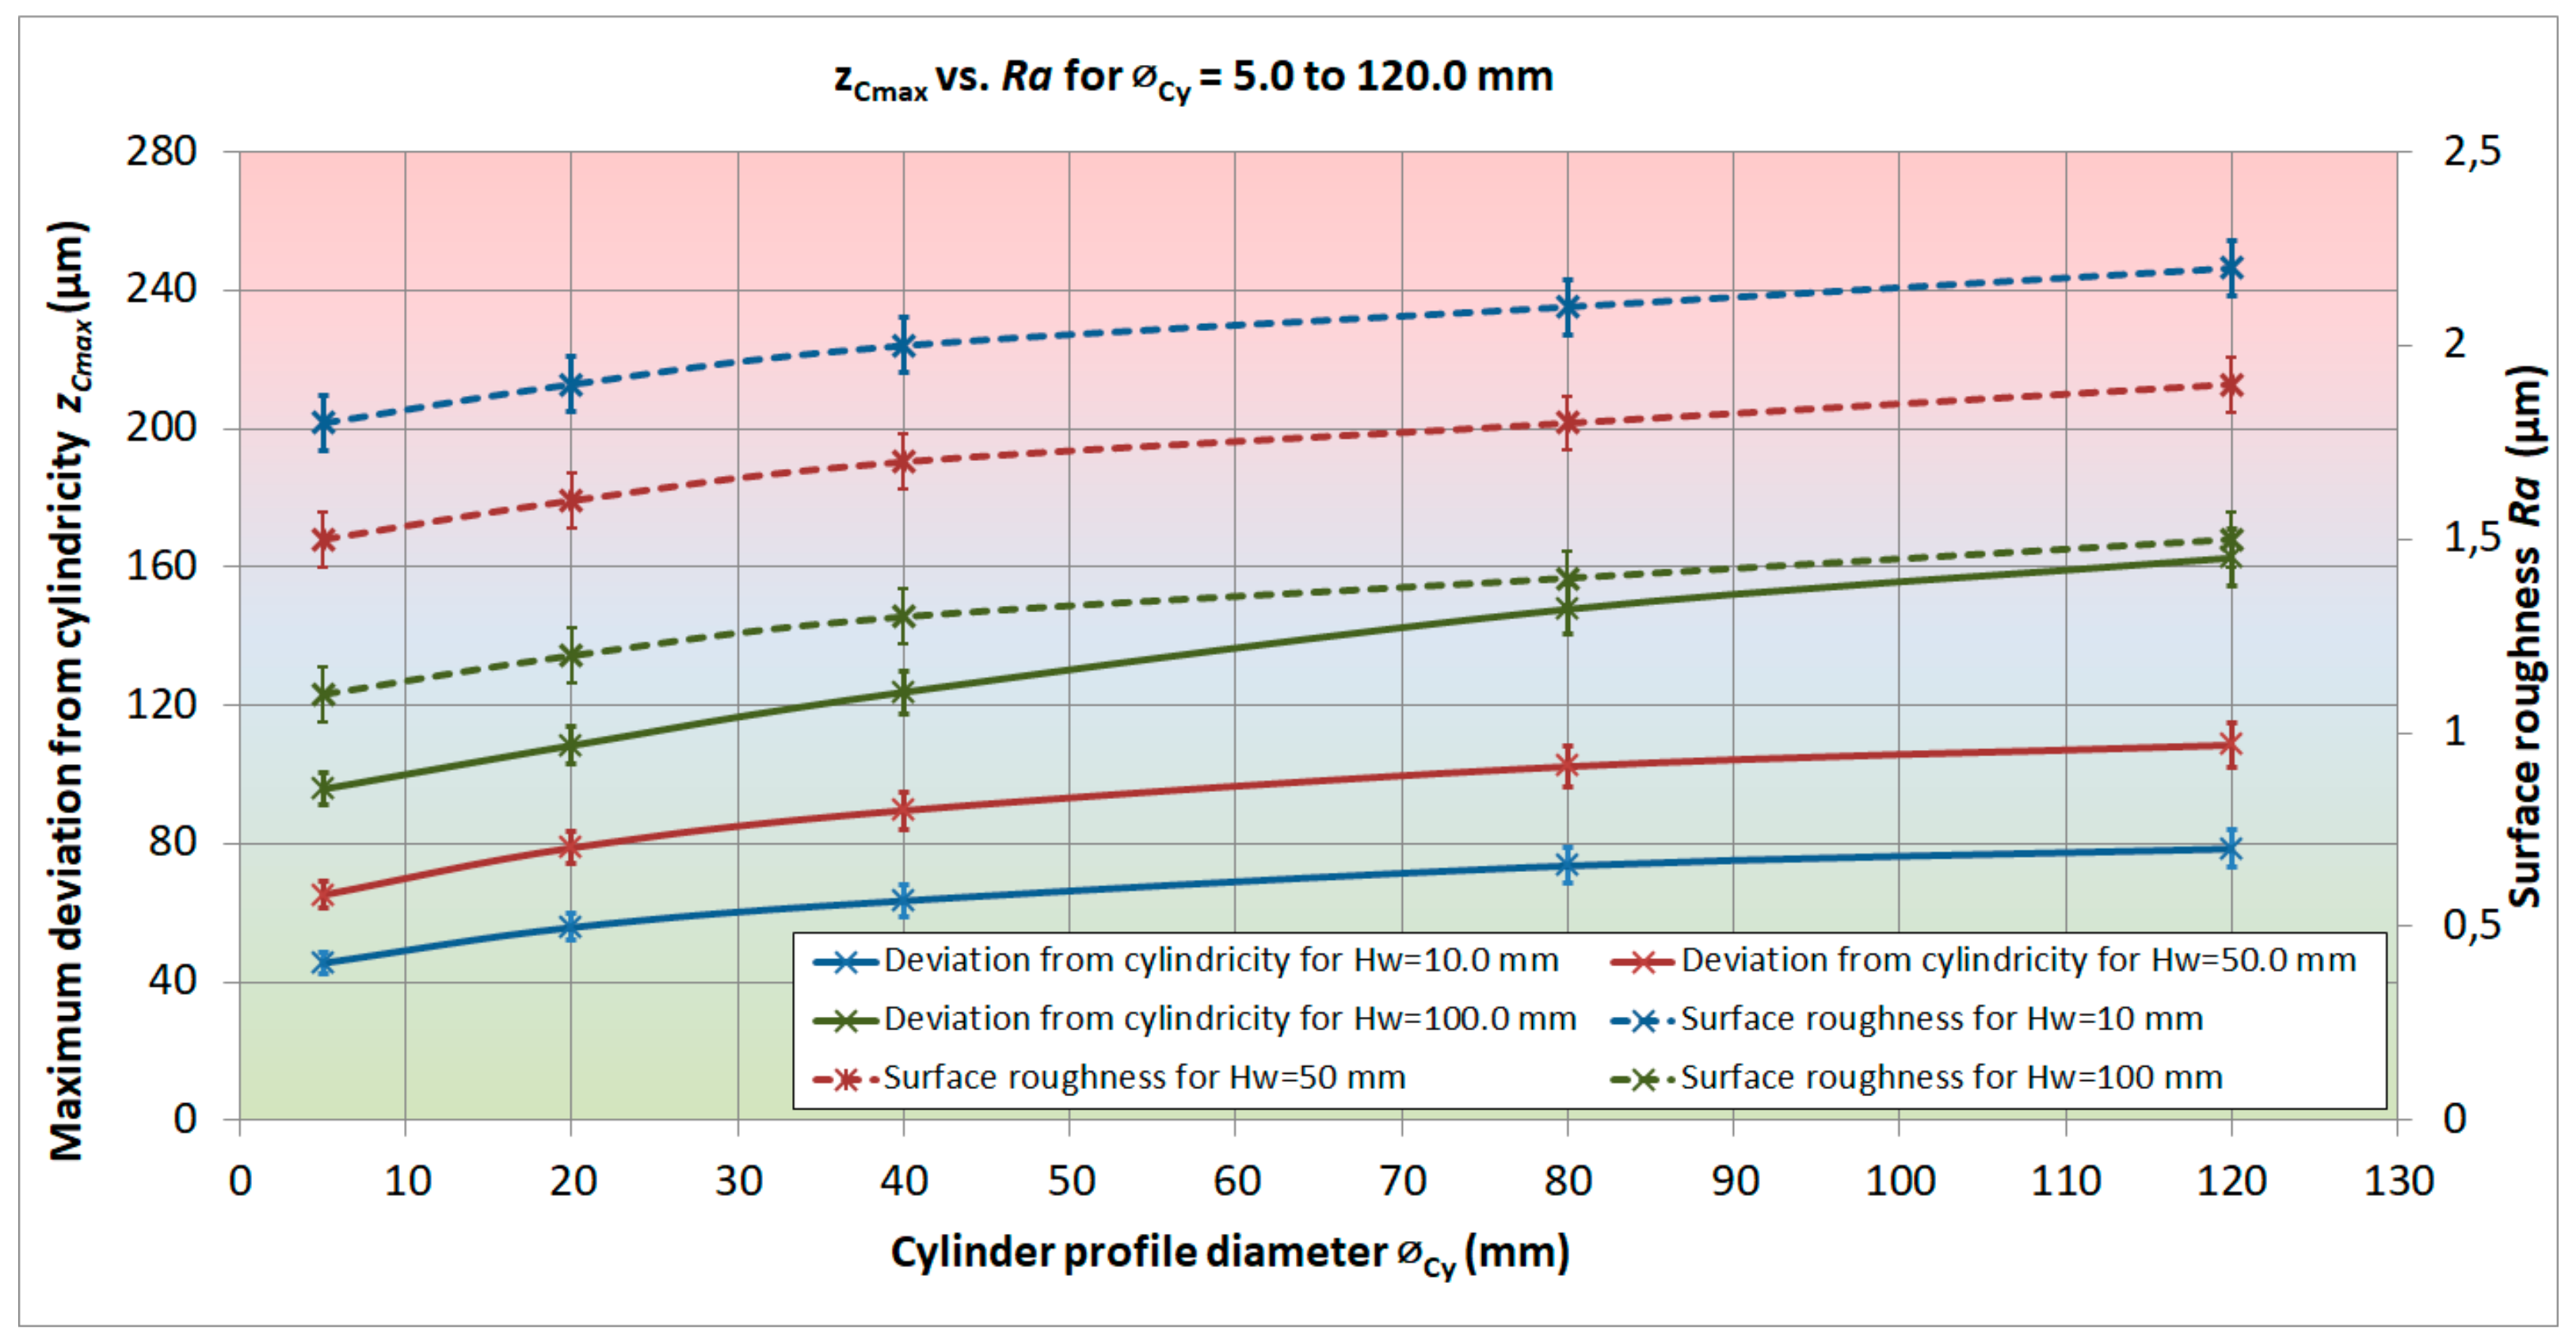
In terms of the evaluation complexity of the geometric precision of an eroded circular profile area, the maximum deviations in the cylindricity, zCmax, were also identified. A Roundtest RA-120 measuring device was also used for the identification and evaluation of these deviations. The measurements were performed in the whole profile of experimentally prepared samples, with the profile heights Hw = 10.0, 50.0, and 100.0 mm and diameters of ⌀Cy = 5.0, 20.0, 40.0, 80.0 and 120.0 mm. The graphical dependences in Figure 8 document the course of the deviations of the cylindricity (zCmax) vs. roughness of the machined surface (Ra) of the experimental samples after WEDM at the individual parameters of ⌀Ci and Hw.
From the diagrams in Figure 8, it can be observed that the values of geometric deviations from cylindricity (zCmax) of the machined surface after WEDM with an Ms wire electrode, ⌀TE = 0.25 mm, differed significantly depending on the diameter of the circular profile. The lowest value of zCmax = 45.6 µm was recorded for a circular profile of ⌀Cy = 5.0 mm, which had a material thickness of Hw = 10.0 mm. On the contrary, the highest value of zCmax = 162.6 µm was obtained for a circular profile of ⌀Cy = 120.0 mm, which had a material of thickness of Hw = 100.0 mm. Based on the results of the experimental measurements, it can be stated that, with an increasing diameter of the circular profile (⌀Cy), there is a significant increase in the maximum geometric deviation of the cylindricity (zCmax) of the machined surface after WEDM. This increase is at a material thickness Hw = 10.0 mm at the level of zCmax = 32.9 µm. At a material thickness of Hw = 100.0 mm, this increase is at the level of zCmax = 66.8 µm.
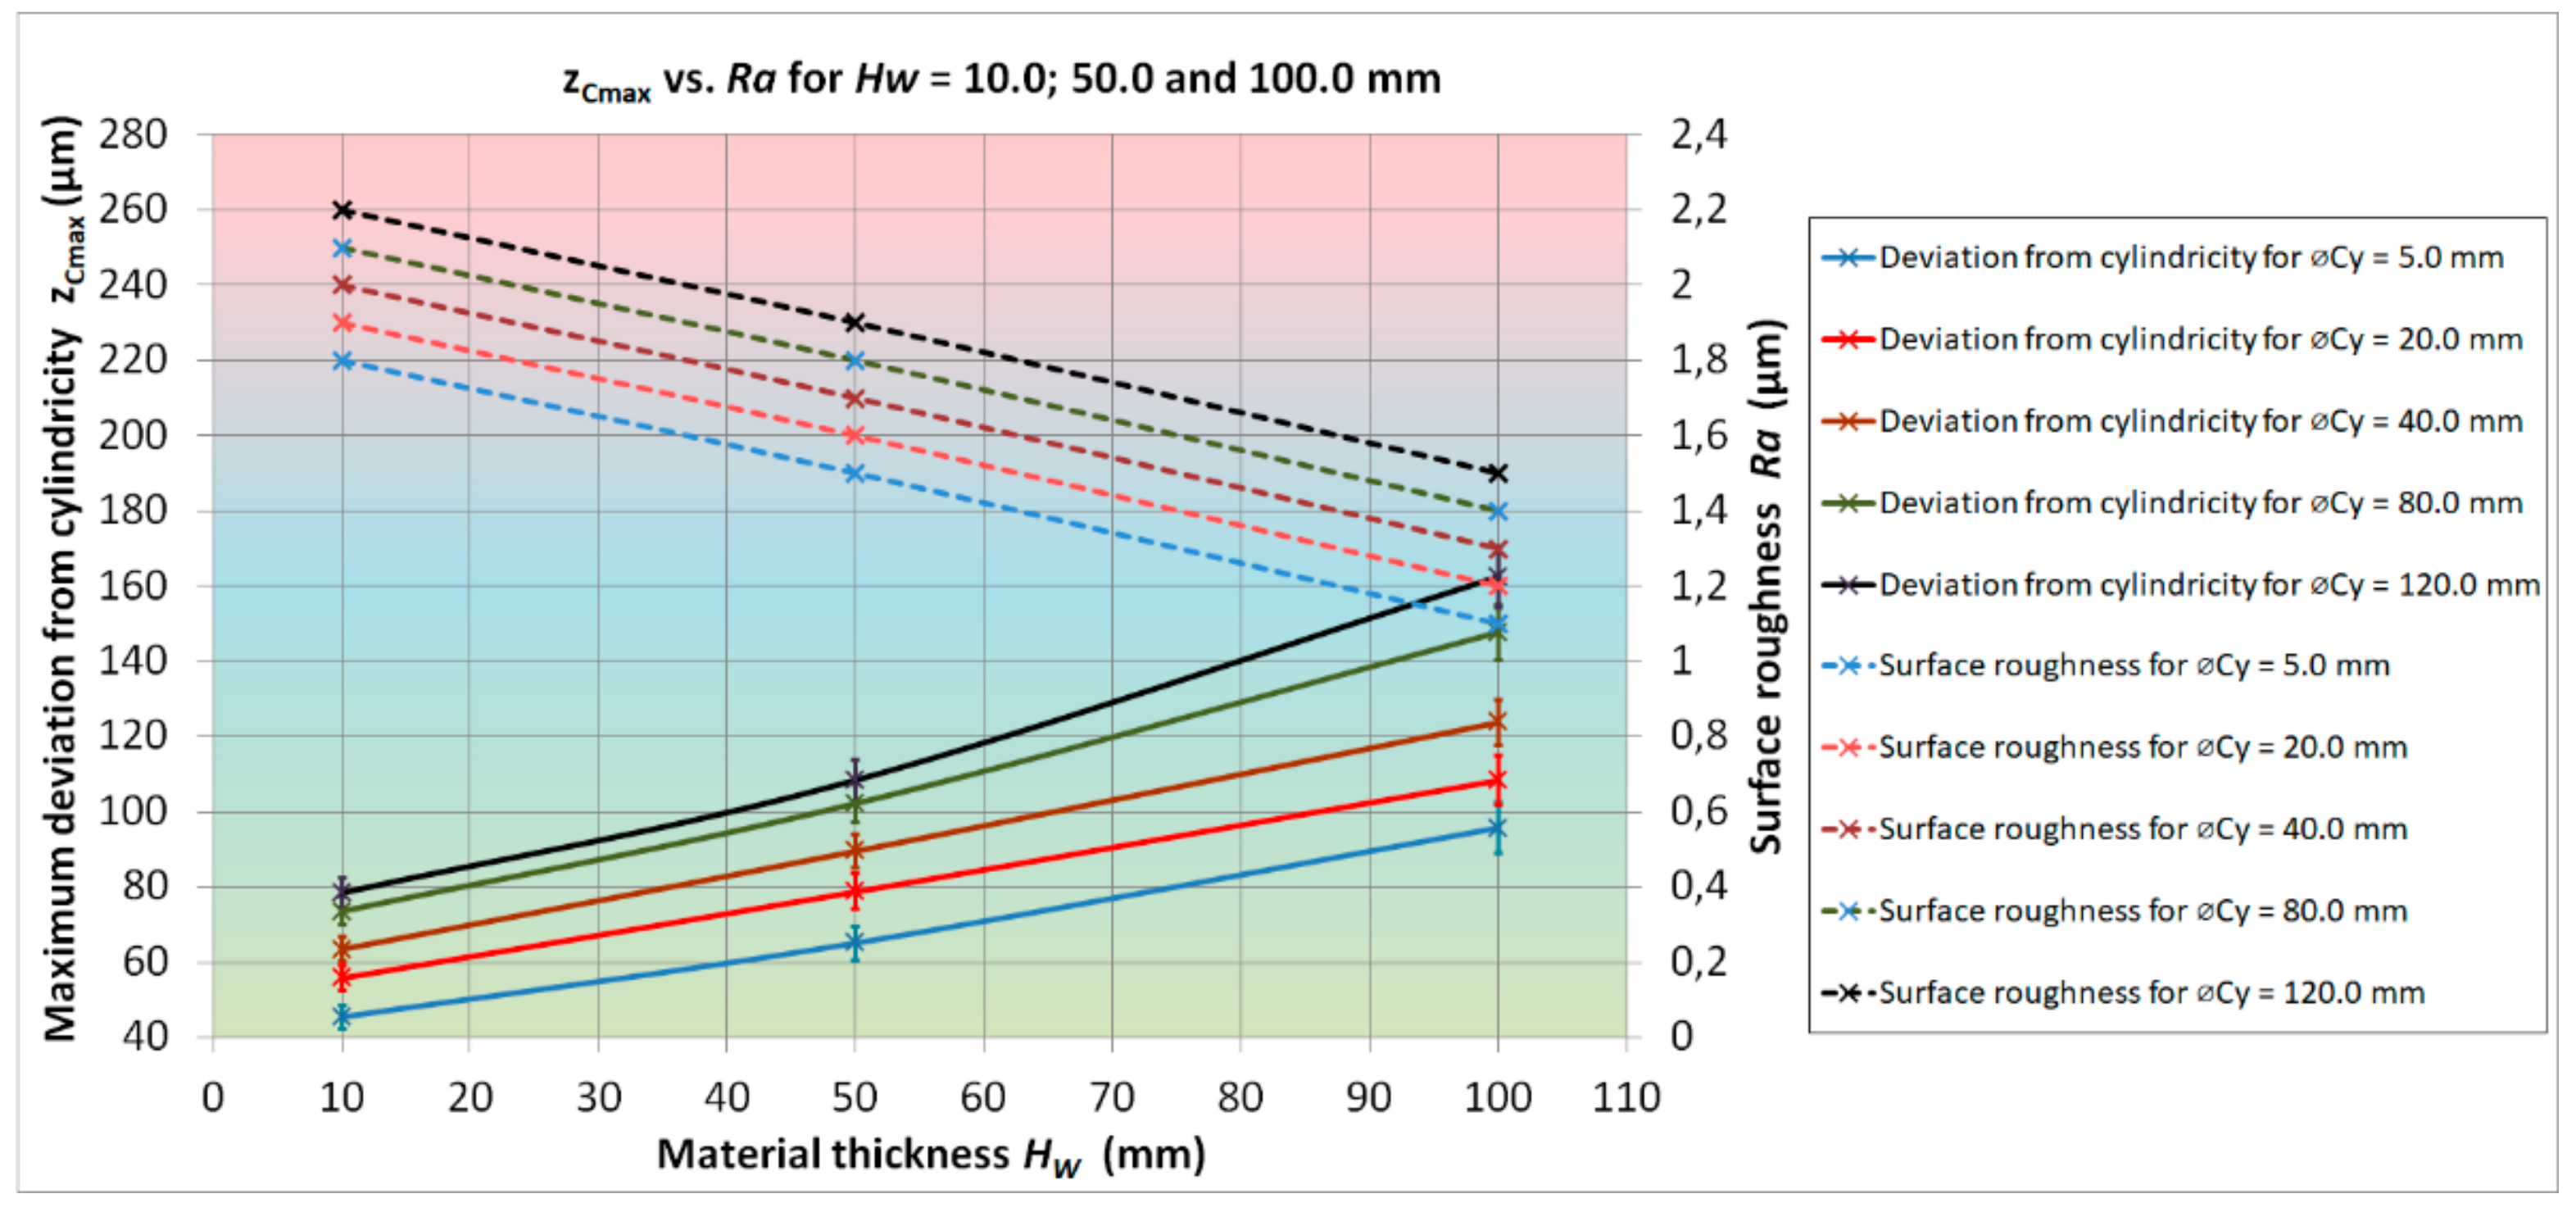
From the point of view of the complexity of the assessment of the results of experimental measurements, the graphical dependences are shown in Figure 9 were constructed. These graphical dependences document the course of the deviations of cylindricity zCmax vs. the roughness of machined area Ra of the experimental samples after WEDM at the individual parameters of ⌀Ci and Hw.
From the diagram in Figure 9, it can be observed that the values of the maximum geometric deviations of cylindricity (zCmax) of the machined circular cross-sectional area after WEDM also differ significantly, depending on the thickness change in the machined material (Hw). Based on the obtained results of experimental measurements, it can be stated that, with increasing thickness of the machined material (Hw), there is a significant increase in the maximum geometric deviation of the cylindricity (zCmax) of the machined surface during WEDM. This increase is smallest in a circular cross-section with a dimension ⌀Cy = 5.0 mm. In this cross-section, the geometric deviations from cylindricity increased by zCmax = 50.3 µm. On the contrary, the largest increase in the geometric deviation of cylindricity is in the circular cross section with a dimension of ⌀Cy = 120.0 mm. In this cross-section, the geometric deviations from cylindricity increased by zCmax = 84.1 µm.
Based on a detailed examination of the results of the experimental measurements, it was found that the application of a lower feed rate for the wire tool electrode, during WEDM, increased the geometric inaccuracies of the machined surface of the circular profiles in terms of parameter zCmax. Therefore, from the viewpoint of reducing these geometric deviations, it is not possible to apply the same procedure as in reducing the deviations of circularity, i.e., to apply a lower feed rate of the wire tool electrode. In this case, on-line monitoring of the vibrations of the wire tool electrode appears to be a suitable solution. Based on their actual values, it is then possible to adjust the vibration amplitudes of the wire tool electrode by changing the settings of the main technological and process parameters.

4.3. Measurement of Wire Tool Electrode Vibrations during Electrical Discharge Machining

As a part of the performed experimental measurements, on-line monitoring of the actual values of the vibration amplitude values of the wire tool electrode, during WEDM, on an Agiecut Classic 3S electroerosion device, was performed using a PDV 100 portable digital vibrometer laser measuring device. The measurement procedure is shown in Figure 10.
Amplitude vibrations were recorded during WEDM of the individual experimental samples of circular cross-sections with diameters (⌀Cy) in the range of 5.0–120 mm and thicknesses of machined material measuring Hw = 10.0, 50.0, and 100.0 mm. Figure 11 shows the individual courses during the machining of EN 40CrMnMoS8-6 tool steel by WEDM with a wire tool electrode of ⌀TE = 0.25 mm.
In the first case, from the recording of the vibrations of the wire tool electrode of ⌀TE = 0.25 mm during the electrical discharge machining of the experimental samples with a circular cross-section of ⌀Cy = 5.0 mm and a thickness of the machined material of Hw = 10.0 mm, made using EN 40CrMnMoS8-6 tool steel, several higher harmonic amplitude peaks can be observed in the first phase of measurements. These were caused by the onset of the wire tool electrode to the working position. At a critical oscillation frequency of the wire tool electrode of around 3 kHz, an increase in the oscillation amplitude value to 15 μm was recorded. After stabilization of the electroerosion process, the vibration frequency of the wire tool electrode ranged from 5 kHz to 25 kHz with an oscillation amplitude up to 10 μm. In the second case, during electrical discharge machining of the experimental samples with a circular cross-section of ⌀Cy = 80.0 mm and thickness of the machined material of Hw = 50.0 mm, several amplitude peaks, with values of around 60 μm, can be observed again at a critical frequency of around 5 kHz. After stabilization of the electroerosion process, the amplitude vibration of the wire tool electrode increased to 15 μm at a frequency of 10–40 kHz. In the latter case, in experimental samples of the circular cross-section with ⌀Cy = 120.0 mm and a thickness of machined material of Hw = 100.0 mm, after wire tool electrode onset to the working position and stabilization of the electroerosion process, the amplitude vibration of the wire electrode increased to 20 μm at a frequency of 10–40 kHz. Increased amplitude vibrations of the wire electrode with a value of 60 μm was recorded at a critical frequency of around 3 to 6 kHz Based on an analysis of the recorded values of the amplitude vibrations of the wire tool electrode during electrical discharge machining, an increase in wire electrode amplitude vibrations was identified with an increasing value in the parameters of Hw and ⌀Cy. This finding fully corresponds to the fact that, with an increasing diameter of the cylindrical profile, and with an increase in the height of the eroded profile, the geometric inaccuracy of the eroded surface decreases. This also confirms our assumption that this increase is caused by the wire tool electrode vibrations. Therefore, it is necessary to focus further research on the possibility of eliminating these vibrations during the electroerosion process.

5. Proposal of Solution for Adjustment of Wire Tool Electrode Vibration during Electrical Discharge Machining

For a more detailed examination of the possible causes of the increased value of the geometric deviations of circularity in the middle of the profile compared to the edge lines, we came to the conclusion that this phenomenon is caused by the vibrations of the wire tool electrode. Despite tensioning of the wire electrode, with tension force close to the maximum values for the given strength of the wire electrode material, it was not possible to completely eliminate the vibrations caused by discharges between the electrode and the machined material. This was also confirmed by research by Grigoriev [29], Straka [30], and Zhu [31]. These vibrations reach a maximum amplitude approximately in the middle of the machined surface profile, which is also confirmed by the particular recorded values of the maximum geometric deviations from circularity (yCmax).
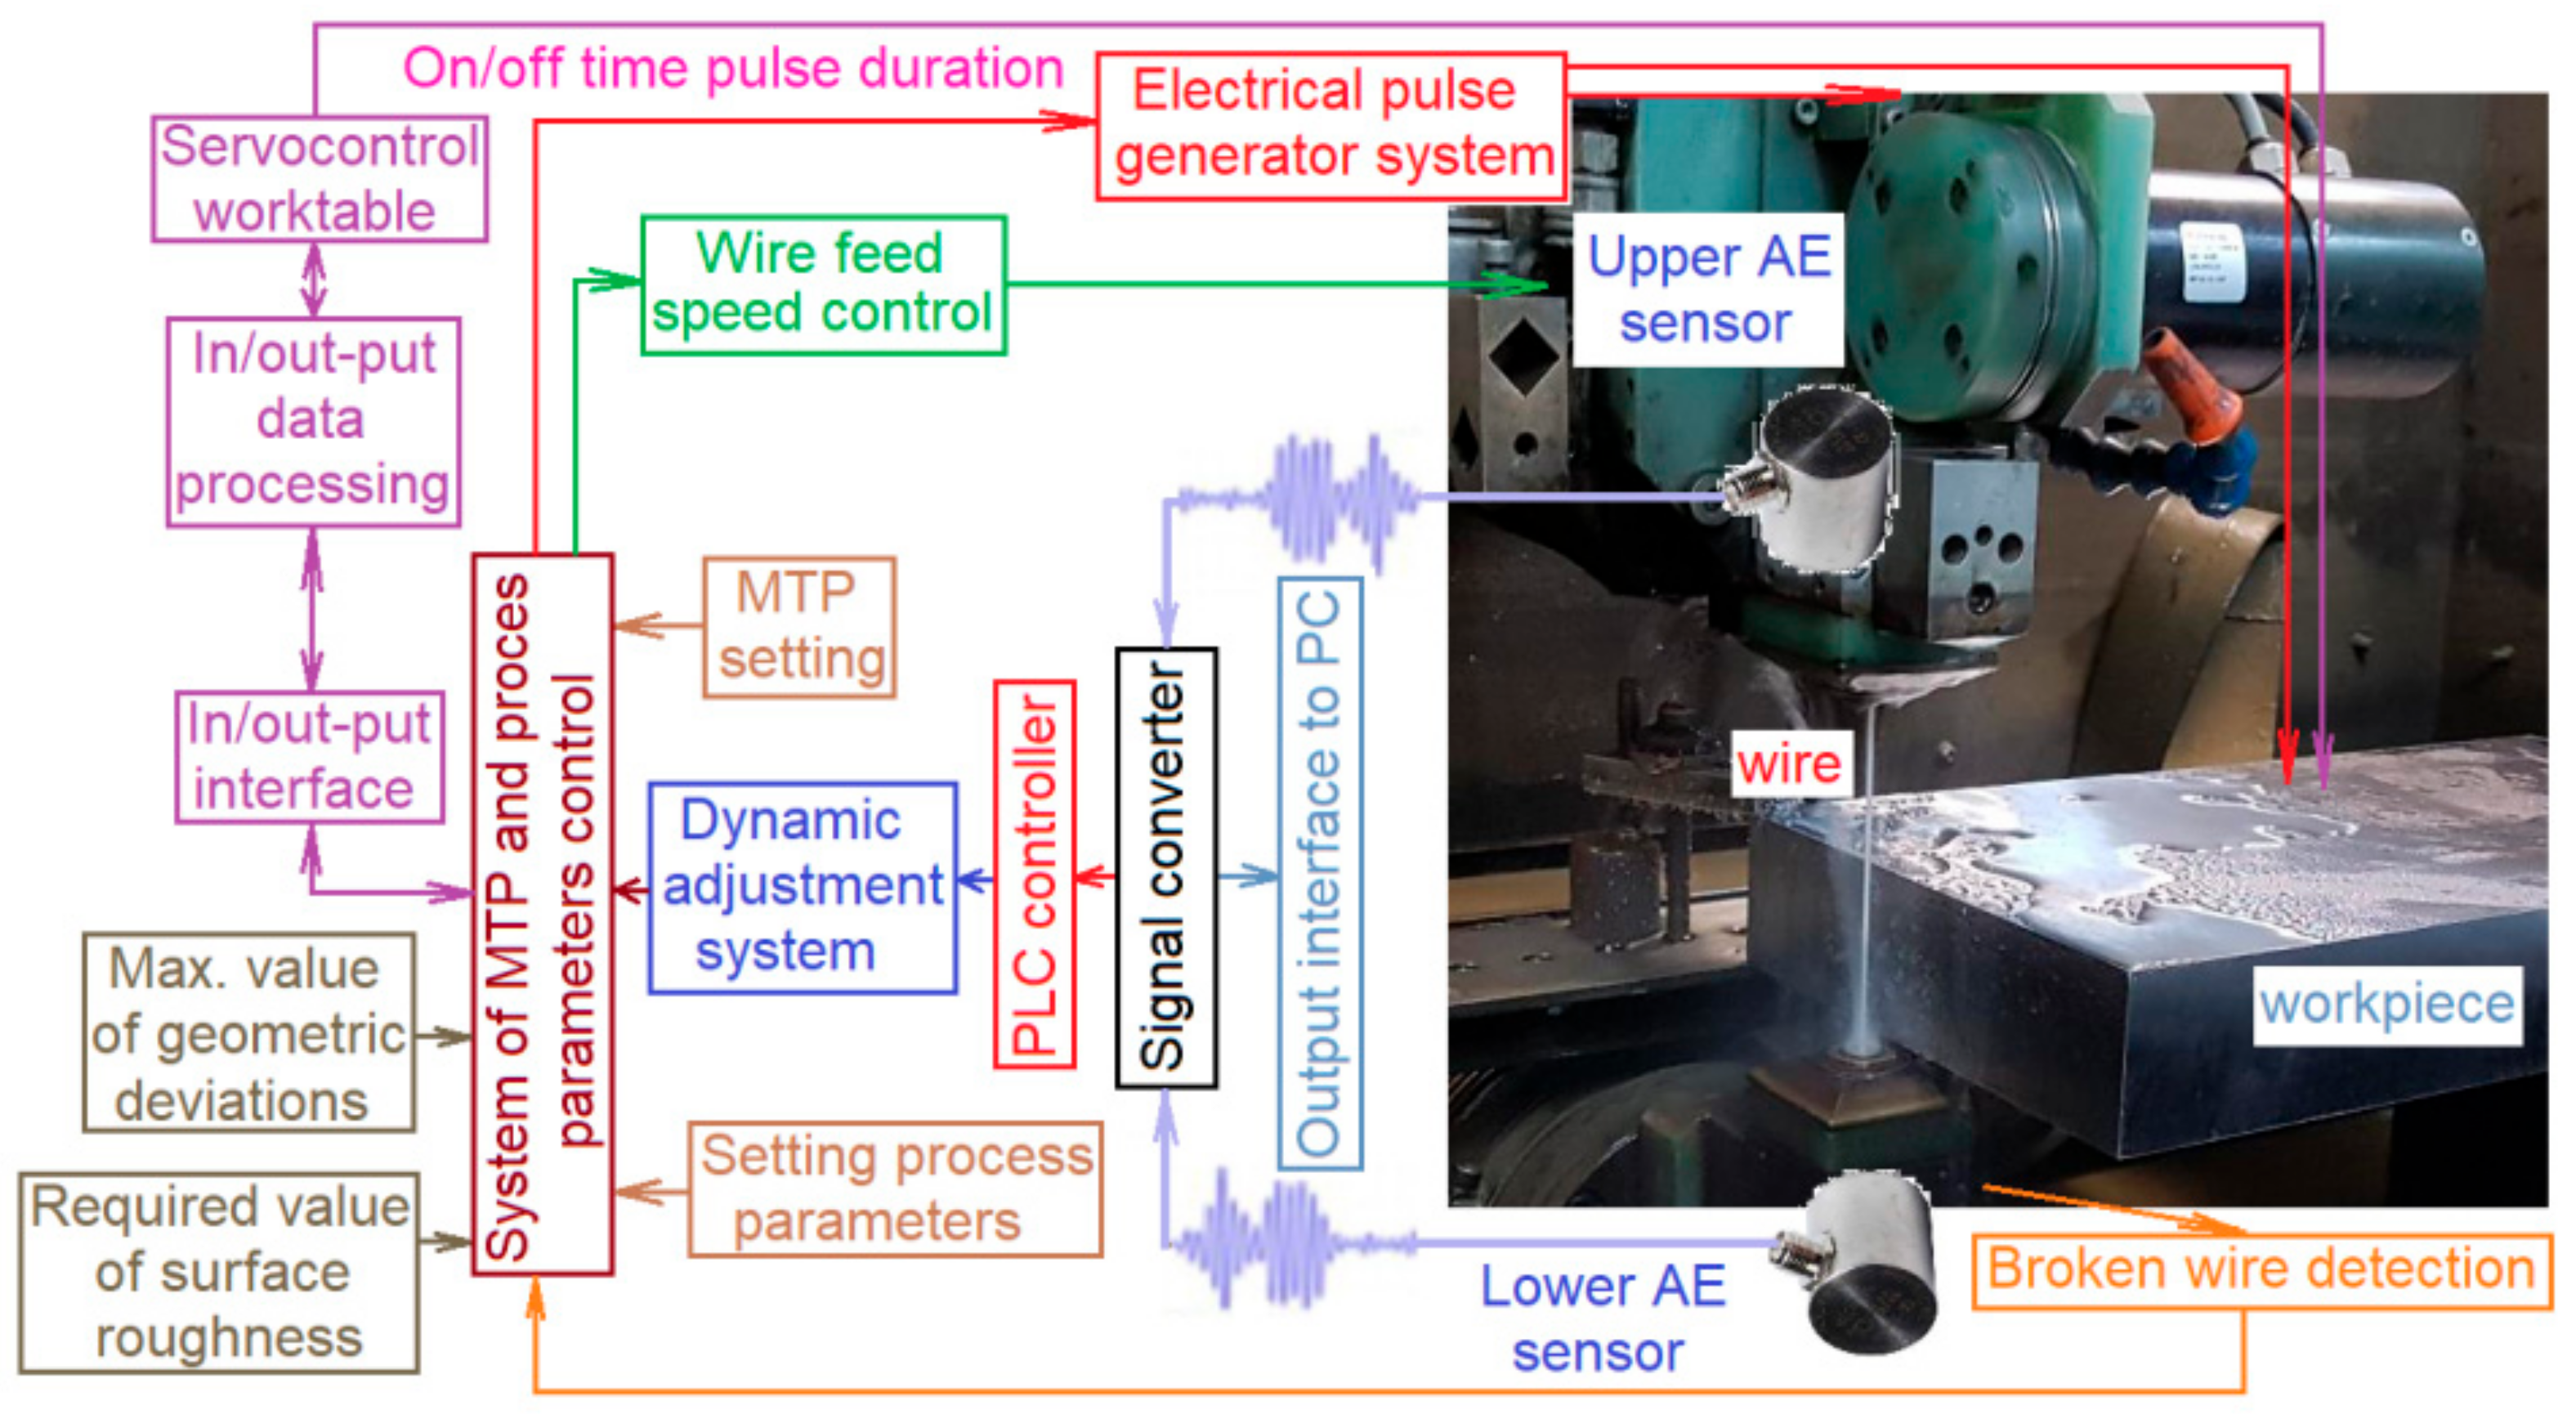
Based on a detailed analysis of the results of the experimental measurements of geometric deviations of circularity (yCmax) and cylindricity (zCmax) of the surface after WEDM, it can be concluded that the main cause of the deviations are vibrations of the wire tool electrode. The size of the deviations depends, to a large extent, on the tensioning force of the wire and also on the actual settings of the technological parameters of the electric discharge. Their range is defined by the frequency of the generated electric discharges. It was discovered that the maximum value of the amplitude vibrations of the wire tool electrode is reached when applying the critical frequency of the generated electric discharges. However, in addition to the electric discharge parameters, the critical frequency of the generated electric discharges also depends on other parameters, such as the thickness of the machined material, the diameter of the wire tool electrode, its tensile force (Fw) and a number of other parameters. Therefore, the critical frequency of generated electric discharges during WEDM cannot be implicitly determined. One possibility for their identification is the application of on-line monitoring. A suitable method for their identification during the electroerosion process appears to be the indirect measurement method, by means of acoustic emissions propagating in the tool wire electrode. However, there is a problem with the location of acoustic emission sensors. A proper solution seems to be their dual placement, on the upper and lower parts, of the wire tool electrode guide. If only one sensor is applied, there is a risk of distorting the recorded values. With the given method of indirect vibration measurement, there is a partial risk of electromagnetic interference (EMI) overlapping with the sensed acoustic emission signals. However, in this case, it was not a disturbing element, because, in both cases, it was essentially a noise. When unwanted vibrations of the wire tool electrode occur, the acoustic emission sensors capture the unwanted vibrations and send the signal regarding the acoustic emission to the transducer, and subsequently to the control unit, which controls the electroerosion process. The control unit processes these values and sends a signal to the electric pulse generator to adjust the parameters of electroerosion process and thus prevents unwanted vibrations of the tool electrode. In addition, the adjustment of the discharge energy can be performed in two phases. In the first phase, there is only a short-term change in the generated pulse frequencies; this change will disturb the increasing oscillation amplitude of the wire tool electrode. If the required change in vibration of the wire tool electrode is not achieved, the system will proceed to the overall adjustment of the values of the main technological parameters. After reaching a stable state, the control system restores the original settings of the main technological parameters. Figure 12 shows a diagram of the location and wiring of acoustic emission sensors for measuring wire tool electrode vibrations during WEDM.
The amplitude of the oscillation of the wire tool electrode, as well as its critical frequency, are relatively difficult to predict under real conditions with an electroerosion machine. However, a suitable way to identify them is to apply one of the direct or indirect methods. Therefore, the given procedure of identification of vibrations of wire tool electrodes during WEDM was also applied in our proposed solution. Based on the application of the proposed system for adjusting the vibration amplitude of the wire tool electrode during WEDM, a substantial increase in machined surface quality can be achieved, both in terms of the circularity parameter (yCmax) and in terms of the cylindricity parameter (zCmax). Although some research suggests that workpiece vibrations have a significantly greater effect on the quality of a machined surface, a proposal to locate the AE sensors on the top and the bottom guides of the wire tool electrode was applied. This was mainly due to the simpler application, which can also be used under real conditions of technical practice. However, further research should be focused on a suitable way of monitoring the vibrations of a workpiece, for subsequent adjustment of their amplitudes, in order to minimize geometric deviations of a machined surface. As a follow-up, it will be necessary to develop a complex model that can predict and subsequently modify those main technological and process parameters, which can significantly affect the vibration amplitude of the wire tool electrode during WEDM.

6. Conclusions

The article describes the technical design of a system for monitoring, and the subsequent adjustment of, the vibration amplitude of a wire tool electrode during WEDM. The solution was based on a detailed analysis of the obtained results of experimental measurements of the geometric deviations of circularity (yCmax), cylindricity (zCmax) and roughness (Ra) of the machined surface. A suitable technical solution for the minimization of the vibration amplitudes of the wire tool electrode was proposed as indirect vibration sensing by the means of acoustic emission sensors. When the critical frequency of the wire electrode vibrations is reached, the control unit temporarily adjusts the main technological parameters so that the vibrations are eliminated while maintaining the roughness quality parameter of the eroded surface. Through the active adjusting of the discharge energy according to the actual value of the acoustic emissions in the wire tool electrode guides, a substantial reduction in the geometric deviations of the eroded surface during WEDM is achieved, while maintaining a high productivity in the electroerosion process. The experimental research was oriented at the practical use of the achieved results, not only in theory, but also in practice. The proposed technical solution will thus enable to meet much narrower specifications placed on the quality of workpieces.
Summary of experimental research results:
based on the results of experimental research, the maximum deviations from circularity (yCmax), cylindricity (zCmax) and roughness values (Ra) of the machined surface were identified for the individual machined profiles, ⌀Ci = 5.0, 20.0, 40.0, 80.0, and 120.0 mm, with machined material thicknesses of Hw = 10.0, 50.0, and 100.0 mm;
it was found that the values of maximum geometric deviations from circularity (yCmax), cylindricity (zCmax) and roughness values (Ra) differed, not only for individual profiles (⌀Ci), but also for individual thicknesses (Hw) of machined material;
it was found that, in both cases, with increasing thickness of the machined material (Hw) and with increasing ⌀Ci of the machined profile, there is a decrease in the maximum deviation of the circularity (yCmax) and, conversely, an increase in the maximum deviations from cylindricity (zCmax);
the increase in the maximum geometric deviation of cylindricity zCmax was almost identical for all ⌀Cy profiles when thickness of machined material Hw changed from 10.0 to 100.0 mm—this increase was around 110%;
at the same time, it was found that with the decreasing thickness of the machined material (Hw) and with increasing ⌀Ci of the machined profile, the roughness parameter of the machined surface (Ra) increases;
possible causes of geometric deviations from circularity and cylindricity of the machined surface after WEDM were identified and defined;
a technical solution was designed for on-line monitoring of the vibration amplitude of the wire tool electrode using the acoustic emission method;
and a system diagram was proposed to adjust the critical vibration frequency of the wire tool electrode during WEDM by controlling the settings of the main technological and process parameters.

Author Contributions

Conceptualization, Ľ.S. and I.Č.; methodology, Ľ.S.; validation, Ľ.S.; formal analysis, I.Č.; investigation, Ľ.S.; data curation, I.Č.; writing—original draft preparation, Ľ.S.; visualization, I.Č.; project administration, Ľ.S.; funding acquisition, Ľ.S. All authors have read and agreed to the published version of the manuscript.

Funding

This research was funded by the Scientific Grant Agency of the Ministry of Education, Science, Research and Sport of the Slovak Republic, grant number VEGA 1/0205/19.

Institutional Review Board Statement

Not applicable.

Informed Consent Statement

Not applicable.

Data Availability Statement

All data are published with the paper.

Acknowledgments

The authors would like to thank the grant agency for supporting this research work through the project VEGA 1/0205/19 and also by the Project of the Structural Funds of the EU, ITMS code 26220220103.

Conflicts of Interest

The authors declare no conflict of interest.

Nomenclature

A1Location of concentric circles with the centre in C1
A2location of concentric circles with the centre in C2
AEAcoustic emission
C1, C2Centers of circles
FwTensioning force of the wire electrode (N)
HMLScanned line of the cut height (mm)
HwMaterial thickness (mm)
IPeak current (A)
LSCLeast squares mean circle
MCCMinimum circumscribed circle
MICMaximum inscribed circle
TTolerance zone (mm)
tonPulse on-time duration (µs)
toffPulse off-time duration (µs)
UVoltage of discharge (V)
WEDMWire electrical discharge machining
yCmaxMeasured value max. deviations from circularity (µm)
zCmaxMax. deviation of cylindricity (µm)
CiDiameter of the workpiece profile (mm)
ΔGeometric deviations from shape (µm)
Δr1, Δr2Particular radial distances of the circles (mm)
TEWire electrode diameter (mm)

References

  1. Islam, M.N.; Rafai, N.H.; Subramanian, S.S. An Investigation into Dimensional Accuracy Achievable in Wire-cut Electrical Discharge Machining. In Proceedings of the World Congress on Engineering, WCE 2010, London, UK, 30 June–2 July 2010; pp. 1–6. [Google Scholar]
  2. Ali, M.Y.; Banu, A.; Salehan, M.; Adesta, Y.E.T.; Hazza, M.; Shaffiq, M. Dimensional Accuracy in Dry Micro Wire Electrical Discharge Machining. J. Mech. Eng. Sci. 2018, 12, 3321–3329. [Google Scholar]
  3. Firouzabadi, H.A.; Parvizian, J.; Abdullah, A. Improving accuracy of curved corners in wire EDM successive cutting. Int. J. Adv. Manuf. Technol. 2015, 76, 447–459. [Google Scholar] [CrossRef]
  4. Yan, M.T.; Wang, P.W.; Lai, J.C. Improvement of part straightness accuracy in rough cutting of wire EDM through a mechatronic system design. Int. J. Adv. Manuf. Technol. 2016, 84, 2623–2635. [Google Scholar] [CrossRef]
  5. Sanchez, J.A.; Rodil, J.L.; Herrero, A.; De Lacalle, L.N.L.; Lamikiz, A. On the influence of cutting speed limitation on the accuracy of wire-EDM corner-cutting. J. Mater. Process. Technol. 2007, 182, 574–579. [Google Scholar] [CrossRef]
  6. Raksiri, C.; Chatchaikulsiri, P. CNC Wire-Cut Parameter Optimized Determination of the Stair Shape Workpiece. Int. J. Mech. Mechatron. Eng. 2010, 4, 924–929. [Google Scholar]
  7. Ťavodová, M. Research state heat affected zone of the material after wire EDM. Acta Fac. Technol. 2014, 19, 145–152. [Google Scholar]
  8. Mouralova, K.; Benes, L.; Zahradnicek, R.; Bednar, J.; Zadera, A.; Fries, J.; Kana, V. WEDM Used for machining high entropy alloys. Materials 2020, 13, 4823. [Google Scholar] [CrossRef]
  9. Habib, S. Optimization of machining parameters and wire vibration in wire electrical discharge machining process. Mech. Adv. Mater. Mod. Process 2017, 3, 3. [Google Scholar] [CrossRef] [Green Version]
  10. Zheng, J.; Lai, X.; Chen, A.; Zheng, W. Energy modeling and minimizing energy consumption control strategy of wire electrical discharge machining (WEDM) through electrical parameters. Int. J. Adv. Manuf. Technol. 2019, 103, 4341–4353. [Google Scholar] [CrossRef]
  11. Hoang, K.T.; Yang, S.H. A study on the effect of different vibration-assisted methods in micro-WEDM. J. Mater. Process. Tech. 2013, 213, 1616–1622. [Google Scholar] [CrossRef]
  12. Hamed, S.; Al-Juboori, L.A.; Najm, V.N.; Saleh, A.M. Analysis the impact of WEDM parameters on surface microstructure using response surface methodology. In Proceedings of the ASET 2020, Advances in Science and Engineering Technology International Conferences, Dubai, United Arab Emirates, 4 February–9 April 2020. [Google Scholar] [CrossRef]
  13. Slătineanu, L.; Dodun, O.; Coteaţă, M.; Nagîţ, G.; Băncescu, I.B.; Hriţuc, A. Wire electrical discharge machining—A review. Machines 2020, 8, 69. [Google Scholar] [CrossRef]
  14. Ranjan, A.; Chakraborty, S.; Kumar, D.; Bose, D. An Investigation on Surfactant Added PMWEDM of Inconel 718. Int. J. Automot. Mech. Eng. 2020, 17, 8140–8149. [Google Scholar] [CrossRef]
  15. Mao, X.; Wang, X.; Li, C.; Mo, J.; Ding, S. Effects of stepped cylindrical electrode in electrical discharge machining of blind holes. Int. J. Adv. Manuf. Technol. 2020, 110, 1457–1469. [Google Scholar] [CrossRef]
  16. STN EN ISO 1101: 2019-06—Geometrical Product Specifications (GPS)—Geometrical Tolerancing—Tolerances of Form, Orientation, Location and Run-Out (Hard Copy of International Standard, Office for Standardization, Metrology and Testing of the Slovak Republic, Bratislava, Slovakia) 2019. Available online: https://www.mystandards.biz/standard/stneniso-1101-1.6.2019.html (accessed on 23 March 2021).
  17. Dzionk, S.; Siemiatkowski, M.S. Studying the effect of working conditions on WEDM machining performance of super alloy Inconel 617. Machines 2020, 8, 54. [Google Scholar] [CrossRef]
  18. Meshram, D.B.; Puri, Y.M. Optimized curved electrical discharge machining-based curvature channel. J. Braz. Soc. Mech. Sci. 2020, 42, 82. [Google Scholar] [CrossRef]
  19. Oniszczuk-Swiercz, D.; Swiercz, R.; Chmielewski, T.; Salacinski, T. Experimental Investigation of Influence WEDM Parameters on Surface Roughness and Flatness Deviation. In Proceedings of the METAL 2020, 29th International Conference on Metallurgy and Materials, Brno, Czech Republic, 20–22 May 2020; Volume 29, pp. 611–617. [Google Scholar]
  20. Shandilya, P.; Jain, P.K.; Jain, N.K. Modelling and process optimisation for wire electric discharge machining of metal matrix composites. Int. J. Mach. Mach. Mater. 2016, 18, 1199–1207. [Google Scholar] [CrossRef]
  21. Rani, S.S.; Sundari, V.K.; Jose, P.S.H.; Sivaranjani, S.; Stalin, B.; Pritima, D. Enrichment of material subtraction rate on Eglin steel using electrical discharge machining process through modification of electrical circuits. Mater. Today 2020, 33, 4428–4430. [Google Scholar]
  22. Pi, V.N.; Tam, D.T.; Cuong, N.M.; Tran, T.-H. Multi-objective optimization of PMEDM process parameters for processing cylindrical shaped parts using taguchi method and grey relational analysis. Int. J. Mech. Prod. Eng. Res. Dev. 2020, 10, 669–678. [Google Scholar]
  23. Rouniyar, A.K.; Shandilya, P. Fabrication and experimental investigation of magnetic field assisted powder mixed electrical discharge machining on machining of aluminum 6061 alloy. Proc. Inst. Mech. Eng. B-J. Eng. 2019, 233, 2283–2291. [Google Scholar] [CrossRef]
  24. Yan, S.; Yao, J.; Li, J.; Zhu, X.; Wang, C.; He, W.; Ma, S. Study on point bar residual oil distribution based on dense well pattern in Sazhong area. J. Mines Met. Fuels 2018, 65, 743–748. [Google Scholar]
  25. Salcedo, A.T.; Arbizu, P.I.; Perez, C.J.L. Analytical modelling of energy density and optimization of the EDM machining parameters of inconel 600. Metals 2017, 7, 166. [Google Scholar] [CrossRef] [Green Version]
  26. Aggarwal, V.; Khangura, S.S.; Garg, R.K. Parametric modeling and optimization for wire electrical discharge machining of Inconel 718 using response surface methodology. Int. J. Adv. Manuf. Technol. 2015, 79, 31–47. [Google Scholar] [CrossRef]
  27. Świercz, R.; Oniszczuk-Świercz, D. Experimental Investigation of Surface Layer Properties of High Thermal Conductivity Tool Steel after Electrical Discharge Machining. Metals 2017, 7, 550. [Google Scholar] [CrossRef] [Green Version]
  28. Yaman, S.; Cakir, O. Investigation of the effects of EDM parameters on surface roughness. J. Adv. Manuf. Eng. 2020, 1, 46–55. [Google Scholar]
  29. Grigoriev, S.N.; Kozochkin, M.P.; Porvatov, A.N.; Volosova, M.A.; Okunkova, A.A. Electrical discharge machining of ceramic nanocomposites: Sublimation phenomena and adaptive control. Heliyon 2019, 5, 1–19. [Google Scholar] [CrossRef] [Green Version]
  30. Straka, L.; Hašová, S. Prediction of the heat-affected zone of tool steel EN X37CrMoV5–1 after die-sinking electrical discharge machining. Proc. Inst. Mech. Eng. B-J. Eng. 2016, 9, 1–12. [Google Scholar] [CrossRef]
  31. Zhu, S.; Chen, W.; Zhan, X.; Ding, L.; Zhou, J. Parameter optimisation of laser cladding repair for an Invar alloy mould. Proc. Inst. Mech. Eng. B-J. Eng. 2019, 233, 1859–1871. [Google Scholar] [CrossRef]
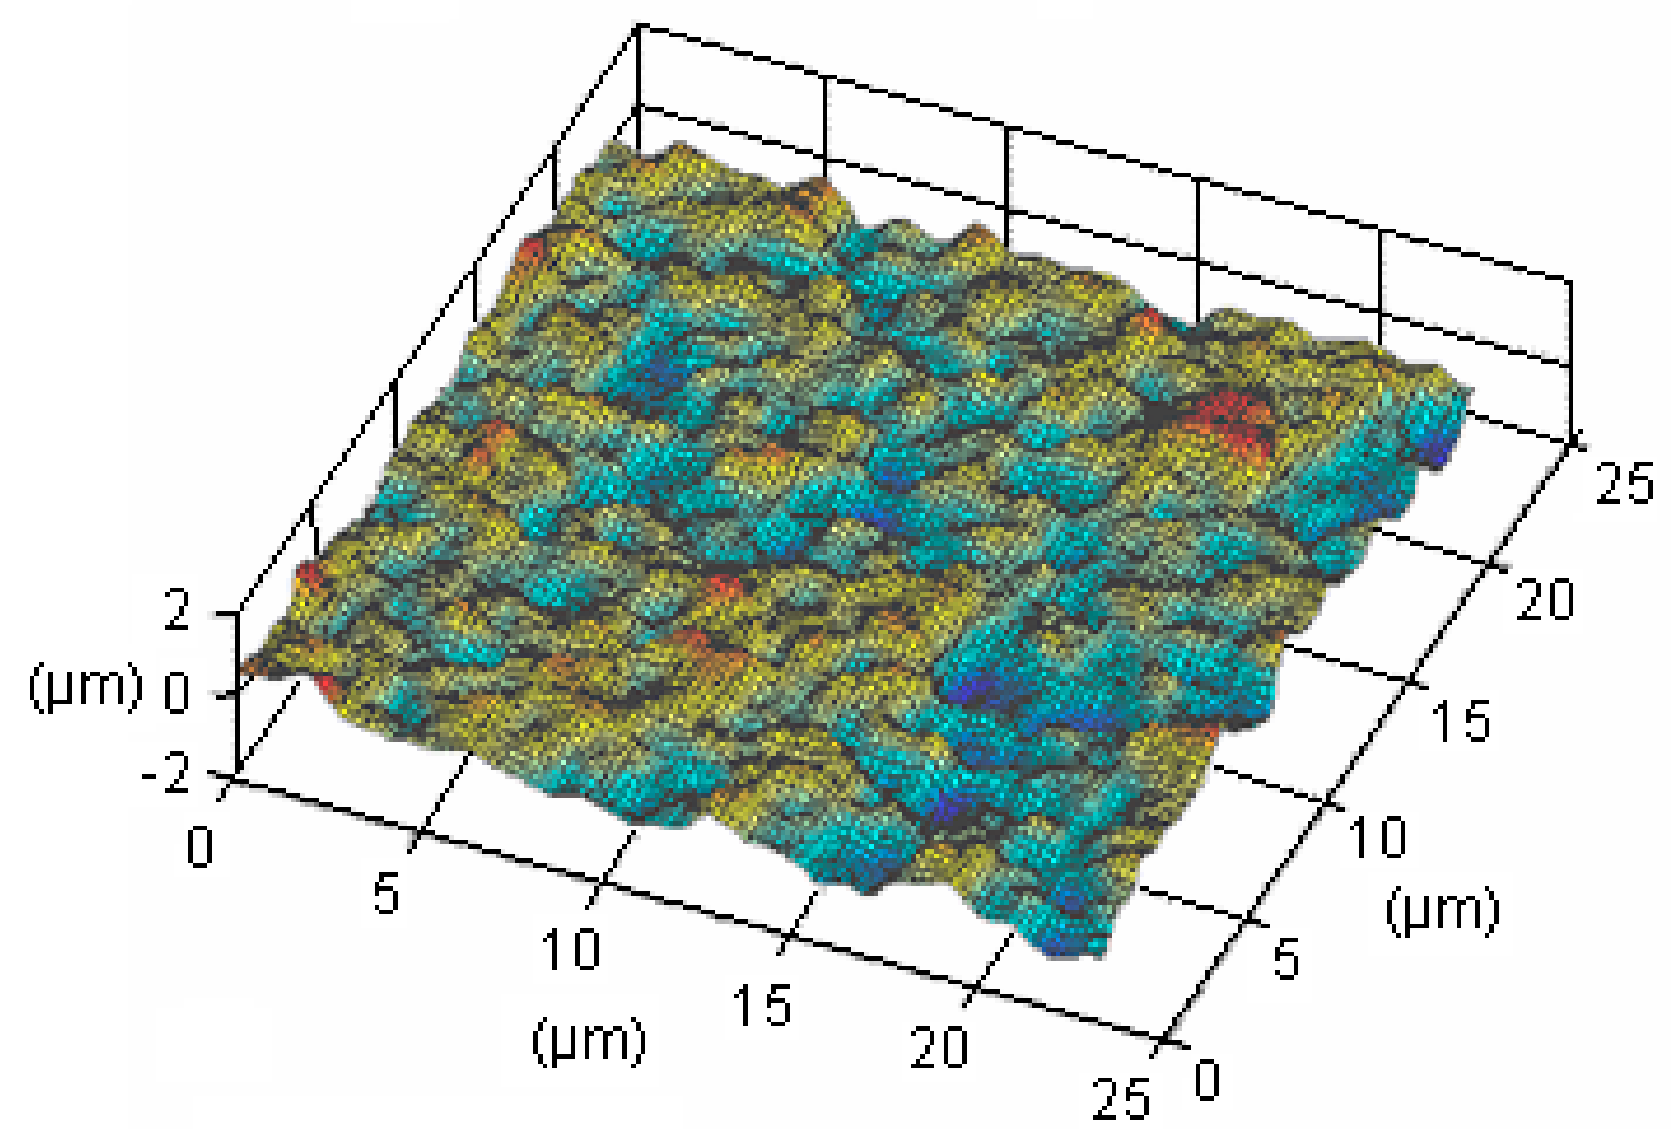
Figure 1. Relief of the material surface after wire electrical discharge machining with a coated electrode (magnification 1000×).
Applsci 11 04734 g001
Figure 2. Basic parameters of geometric deviations from (a) circularity and (b) cylindricity of machined surface after WEDM, prescribed by standard STN EN ISO 1101: 2019-06. A1—is the position of the concentric circles with the center in C1, A2—is the position of the concentric circles with the center in C2, Δr1, Δr2—is the respective radial distances of the circles, T—is the tolerance zone, Δ—is the cylindricity deviation, LSC—least squares mean circle, MCC—minimum circumscribed circle, MIC—maximum inscribed circle.
Applsci 11 04734 g002aApplsci 11 04734 g002b
Figure 3. Production of experimental samples from tool steel on an Agiecut Classic 3S EDM electroerosion device.
Applsci 11 04734 g003
Figure 4. Measurement of geometric deviations of the circular profile, ⌀Ci = 40.0 mm, on the measuring device Mitutoyo Roundtest RA-120 (Mitutoyo, Kawasaki, Japan).
Applsci 11 04734 g004
Figure 5. Maximum geometric deviations from circularity yCmax of experimental samples from tool steel with a circular cross-section with profile diameters ⌀Ci = 5.0, 20.0, 40.0, 80.0 and 120.0 mm and material thickness of Hw = 10.0, 50.0, and 100.0 mm after WEDM with Ms wire electrode of ⌀TE = 0.25 mm. (a) Material thickness Hw = 10.0 mm. (b) Material thickness Hw = 50.0 mm. (c) Material thickness Hw = 100.0 mm.
Applsci 11 04734 g005aApplsci 11 04734 g005b
Figure 6. Measurement of machined surface roughness parameters after WEDM with the Mitutoyo Surftest SJ 400 (Mitutoyo, Kawasaki, Japan) contact profilemeter.
Applsci 11 04734 g006
Figure 7. Geometric deviations of roundness (yCmax) vs. surface roughness (Ra) of experimental samples of circular cross-sections after WEDM for various parameters of ⌀Ci and Hw.
Applsci 11 04734 g007
Figure 8. Geometric deviations of cylindricity (zCmax) vs. surface roughness (Ra) of experimental samples of circular cross-section after WEDM for different parameters of ⌀Cy.
Applsci 11 04734 g008
Figure 9. Geometric deviations of cylindricity (zCmax) vs. surface roughness (Ra) of experimental samples of circular cross-sections after WEDM for various parameters of Hw.
Applsci 11 04734 g009
Figure 10. Measurement of vibration amplitude of Ms wire tool electrode using a PDV 100 portable digital vibrometer on an Agiecut Classic 3S electroerosion machine (AGIE SA, Losone, CH, Switzerland).
Applsci 11 04734 g010
Figure 11. Vibration amplitude values of wire tool electrode during WEDM on an Agiecut Classic 3S electroerosion machine.
Applsci 11 04734 g011
Figure 12. Diagram of the location and wiring of sensors for measuring acoustic emission during WEDM.
Applsci 11 04734 g012
Table 1. Range of the main technological parameter settings in the production of experimental samples using WEDM technology, including an analysis of their expected effects on wire electrode vibrations.
Main Technological Parameters Setting Range Influence of Technological Parameter on Wire Electrode Vibrations
Peak current
I (A)
1.0–15.0As the value of I increases, the vibrations of the wire electrode increase slightly.
Pulse on-time duration
ton (μs)
11.0–19.0As the ton value increases, the vibrations of the wire electrode increase significantly.
Pulse off-time duration toff (μs) 15.0–28.0As the toff value increases, the vibrations of the wire electrode decrease substantially.
Voltage of discharge
U (V)
65.0–90.0As the U value increases, the vibrations of the wire electrode increase slightly.
Table 2. Chemical composition and selected mechanical and physical properties of EN 40CrMnMoS8-6 tool steel (W.-Nr. 1.2312).
Chemical Composition of Tool Steel EN 40CrMnMoS8-6 (W.-Nr. 1.2312)
CMnSiCrMoPmaxSmax
0.35–0.45%1.4–1.6%0.30–0.50%1.8–2.0%1.5–0.25%0.03%0.05–0.1%
Selected Mechanical and Physical Properties of Tool Steel EN 40CrMnMoS8-6
(W.-Nr. 1.2312)
Density
kg/dm3
Tensile strength
Rm (MPa)
(in natural state)
Yield strength
Rp0.2 (MPa)
(in natural state)
Thermal conductivity W/(m·K) Specific heat capacity J/(g·K)Specific electric resist.
Ω·mm2/m
Modulus of elesticity
E [GPa]
Hardness after quenching
HRC
7.8596085034.50.470.1921050–53
Table 3. Basic mechanical, physical, and chemical properties of wire electrode material with the type designation of Bedra Megacut pro® TWO/250.
Coated Wire Electrode Bedra Megacut pro® TWO/250
Mechanical propertiesTensile Strength
Rm [MPa]
Yield Strength Rp0.2 [MPa]Proof Stress [MPa]Hardness
HV
Elastic modulus
E [GPa]
Elongation A50 [%]Grain
[mm]
900–1000≤500110–500≤170110≥30.015–0.07
Physical propertiesElectrical conduction [%IACS]Electrical resistivity [Ω·m]Melting point [°C]Thermal conduction
λ [W·m−1K−1]
Density ρ [g·cm−3] specific heat capacity
cp 20 °C [J·kg−1K−1]
coefficient of thermal
expansion
α 20 °C [10−6 K−1]
≥281.3589201168.4538020.5
Chemical compositionCuAlFeNiPbSnZn
62–64%<0.05%<0.1%<0.3%<0.1%<0.1%balance
Publisher’s Note: MDPI stays neutral with regard to jurisdictional claims in published maps and institutional affiliations.