Abstract
Understanding of fracture mechanics of the human knee structures within total knee replacement (TKR) allows a better decision support for bone fracture prevention. Numerous studies addressed these complex injuries involving the femur bones but the full macro-crack propagation from crack initiation to final failure and age-related effects on the tibia bone were not extensively studied. The present study aimed to develop a patient-specific model of the human tibia bone and the associated TKR implant, to study fatigue and fracture behaviors under physiological and pathological (i.e., age-related effect) conditions. Computed tomography (CT) data were used to develop a patient-specific computational model of the human tibia bone (cortical and cancellous) and associated implants. First, segmentation and 3D-reconstruction of the geometrical models of the tibia and implant were performed. Then, meshes were generated. The locations of crack initiation were identified using the clinical observation and the fatigue crack initiation model. Then, the propagation of the crack in the bone until final failure was investigated using the eXtended finite element method (X-FEM). Finally, the obtained outcomes were analyzed and evaluated to investigate the age-effects on the crack propagation behaviors of the bone. For fatigue crack initiation analysis, the stress amplitude–life S–N curve witnessed a decrease with increasing age. The maximal stress concentration caused by cyclic loading resulted in the weakening of the tibia bone under TKR. For fatigue crack propagation analysis, regarding simulation with the implant, the stress intensity factor and the energy release rate tended to decrease, as compared to the tibia model without the implant, from 0.15 2.5 to 0.111.9 (MPa) and from 10240 to 5133 (J), respectively. This led to the drop in crack propagation speed. This study provided, for the first time, a detailed view on the full crack path from crack initiation to final failure of the tibia bone within the TKR implant. The obtained outcomes also suggested that age (i.e., bone strength) also plays an important role in tibia crack and bone fracture. In perspective, patient-specific bone properties and dynamic loadings (e.g., during walking or running) are incorporated to provide objective and quantitative indicators for crack and fracture prevention, during daily activities.
1. Introduction
A total knee replacement (TKR) is a surgical method through which the knee joint is replaced by artificial material to deliver pain and recover locomotion functions of the involved patients [1]. However, periprosthetic fractures commonly occur when using the implant. The fractures can occur in the femur, tibia, or patella, affecting the areas within 15 cm from the joint surface, or within 5 cm from the intramedullary stem [2,3]. Thus, the management of these post-surgical complications remains a clinical and scientific challenge.
Understanding of fracture mechanics of the human knee structures allows a better decision support for clinical interventions. Numerous studies addressed these complex injuries involving the femur [4,5,6,7,8]. Reported findings showed that the successful nature of the TKR treatment links to both mechanical and biological aspects [9]. However, the dominant mechanical failure remains an important issue. Additionally, it is well-acknowledged that cracks play a vital role in the failure process. According to [10,11], periprosthetic fracture following TKR occurs most regularly in the femur, mostly in the supracondylar sector. Harris [12] clinically indicated that the interface crack (e.g., cement and implant) could be noticed as a hint of loosening, and its behavior needs to be elucidated for better management. Tibia fractures were also studied [10,13,14]. Most studies focused on the mechanical behavior at the bone–implant interface. Wang et al. [14] aimed to elucidate the relationship of tibial tunnel (TT) with fracture pattern and implants. The simulation of different types of osteosynthesis and the process of bony healing was also performed in Wong et al. [15]. However, the periprosthetic fractures in tibias, as a result of an implant, needs further investigations to better understand the role of cracks and their propagation path, which leads to the failure process. Moreover, the fatigue crack initiation and age-related effects of the bone properties are not yet extensively investigated.
From a clinical perspective, the fractures in tibias can happen at any stage of surgery, mostly during skeletal retraction, tibial insertion, or elimination of the pre-existing prosthesis in revision surgery [10]. As stated by the most often used classification system [5,10], which is based on the anatomical area of the fracture and the condition of the tibial component fixation, the tibial fracture is categorized into four types (I–IV) and three subtypes (A, B, C). Type-I tibial fracture can be found in the tibial plateau, type II is assigned inferior to the tibial plateau in the vicinity of the prosthetic stem, type III occurs distal to the stem of the tibia, and type IV concerns the tibial tubercle. Additionally, subtype A is located to a fracture with a stable prosthesis on radiographs, subtype B is determined as fractures with radiographic proof of component loosening, and subtype C could be seen as intraoperative fractures.
To quantify the resistance of a material to cracking under monotonic loading conditions, fracture toughness is commonly used [16]. Bone is considered to be a heterogeneous hierarchical material [17,18]. Under cyclic loading conditions, multiple micro-cracks can first occur and then coalesce into “macro-crack”, prior to leading to final failure—which is the separation of the bone in pieces. Most of the time, micro-cracks are eliminated by remodeling [16]. If fatigue damage in bone accumulates more speedily than the eliminated procedure by remodeling, fatigue failure could occur. Carter et al. [19] indicated that mechanical fatigue damage accumulates more rapidly in these “compressive” areas than in the “tensile” areas of the cortical bone. Specimens were tested at strain ranges from 0.005 to 0.01, under physiological loading rates. In addition to experimental mechanics to understand the bone fracture [19,20], computer-aided simulation plays an important role to elucidate the knowledge of crack initiation, propagation, and toughening mechanisms in the bone [21]. Most modeling and simulation studies focused on the finite element method (FEM). Mischinski [22] carried out two-dimensional (2D) cohesive finite element simulations to consider the crack spread into osteons. This study reported that the crack propagation relies on osteon fracture properties. Nevertheless, the modulus of elasticity of osteon had almost no dominance to the crack trajectory. Ural et al. [23] checked the effect of strain rate and porosity on the fracture toughness of human cortical bone, using a cohesive finite element model in 2D. This study showed that a decreased bone resistance to crack propagation could be caused by an increase in strain rate. The eXtended Finite Element Method (X-FEM), in which the crack is not explicitly meshed, was also used to study bone fracture [24]. Budyns et al. [25] developed a multi-scale model to study multiple crack growth in a human cortical bone under tension, using the X-FEM and a critical stress intensity factor standard for determining the crack propagation. Sedmak et al. [26] used X-FEM to simulate the fatigue crack growth in the hip implant. They simulated fatigue crack growth from the initial crack up to the critical point in a 3D model. The dimension of crack initiation was defined from the experience with failures of hip implants. Simultaneously, this investigation approximated the critical point according to the fracture toughness obtained by a hip implant experiment. This study reported that the stress intensity factors of Mode I were much greater than those of Mode II and Mode III. Furthermore, Budyn et al. [27] indicated the effect of aging on traits of human cortical bone using X-FEM. This study also considered that failure mechanisms and propagation of cracks in the cortical bone undergo tensile loading.
In summary, previous studies on the bone crack and fracture allow advancing the knowledge of these complex physical conditions. Most previous bone fracture simulation studies addressed the effects of micro-cracks on cortical bones. Moreover, femur crack and fracture are the most studied phenomena in the TKR context. In addition, these studies raise many questions about whether the role of the cancellous component’s mechanical properties could affect bone fracture analysis, and the limitation about the location of the crack initiation was not considered thoroughly. In particular, the mechanical behaviors of full macro-crack propagation and age-related effects on the tibia bone crack and fracture were not extensively studied. The present study aimed to develop a patient-specific model of the tibia bone and associated TKR implant, using X-FEM to study the tibia crack and fracture in physiological and pathological (i.e., age-related effects) conditions. Both cortical and cancellous bones were taken into consideration.
2. Materials and Methodology
2.1. Modeling and Simulation Workflow
A modeling and simulation workflow was established (Figure 1). Computed tomography (CT) data were used to develop a patient-specific model of the knee structures and associated implant. Segmentation and 3D reconstruction of the geometrical models of the femur, tibia, and implant were performed. Then, meshed models were generated. A two-step (initiation and propagation) crack simulation was applied. Finally, the obtained outcomes were analyzed and evaluated to investigate the age-related effects.
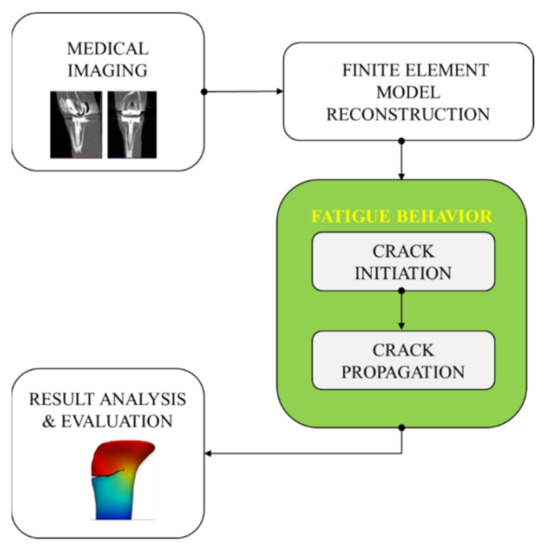
Figure 1.
Overview of the developed modeling and simulation workflow for analyzing the tibia crack propagation.
2.2. Patient Data and Finite Element Model Set-Up
The patient data from the Knee Grand Challenge [28] was acquired and used in this present study for making 3D tibia bone modeling. Computed tomography (CT) scan data were acquired for a patient (male, 88 years old, 168 cm body height, 66.7 kg body mass, and 23.6 kg/m2 Body Mass Index (BMI)) with a knee implant instrumented on his right knee side (Figure 2a).
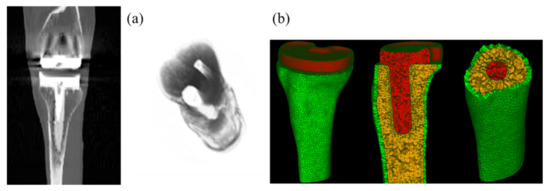
Figure 2.
CT images of the human knee with total knee replacement (TKR) implant of the patient (a) and associated meshed models of the tibia bone (cortical and cancellous bones corresponding to the green and yellow parts) and implant (the red part) (b).
Semi-automatic segmentation was applied on the CT scan data to segment different knee structures (femur and tibia bones) and TKR implant, using the 3D Slicer software. A thresholding process was performed to segment the bone tissues and the associated implant from surrounding tissues. A threshold value of 810 was used for cortical bone and implant segmentation and a threshold value of 560 was used for cancellous bone segmentation. 3D models of these structures were saved in STL format for further processing in numerical simulation. Tibia bone with and without the implant were considered in the present study. FEM simulations were performed using the Salome-Meca software (2019.03 version). The solver used in this platform was code_aster, an open-source finite element solver developed by EDF R&D in France since 1989, and dedicated to thermo-mechanical analyses of structures. All models were meshed with linear tetrahedral elements (see Figure 2b). Since the crack path was not known a priori, a finer mesh was generated around the crack tip during crack propagation, using automatically adaptive mesh refinement, in order to obtain a good accuracy.
All bony solids were modeled using homogeneous, isotropic, and linearly elastic laws. Their elastic properties are reported in Table 1, which were used for modeling the tibia bone with and without the implant or total knee replacement (TKR). As listed in the table, elastic modulus (16.6 GPa and 2.4 GPa for cortical and cancellous bones, respectively) and Poisson ratio (0.3) of the bone tissue were taken from the 24-year-old male volunteer [29]. Moreover, elastic properties of the bones associated with two different ages (27-year-old female, 56-year-old female) were also extracted from [20], in which the elastic modulus of the cortical bone was set up as 15.3 GPa and 13.4 GPa for the 27- and 56-years old, respectively. A linear elastic law was also applied for the tibia implant with an elastic modulus of 117 GPa and a Poisson ratio of 0.3 [29]. Regarding the applied boundary conditions, the bottom part of the tibia model was clamped as a physiological boundary condition in standing posture. A displacement of 0.0001 m was prescribed, following the axial direction at the top surface [19]. This displacement value was under normal physiological conditions and could be predicted in in vivo conditions. Furthermore, the interfaces between the cancellous bone and the implant were assumed to be perfectly bonded.

Table 1.
TKR knee material properties.
2.3. Fracture Mechanics Analysis under Monotonic and Cyclic Loading Conditions
2.3.1. Under Monotonic Loading Conditions
Within the framework of linear elasticity, under monotonic loading conditions, to quantify the severity of a crack, the stress intensity factor K was used. This parameter was estimated as follows:
where s is the nominal stress applied on the structure, a is the crack length, F is a coefficient related with the specimen geometry and loading conditions. There are three different modes of cracking—Mode I–opening, Mode II–shearing, and Mode III–tearing. Since the cortical bone shows the least resistance to fracture under the Mode I loading conditions, this loading mode received the most attention in the literature [16].
Under the elastic regime [30], the energy release rate (denoted by ) was the energy associated with the creation of a unit crack surface. This energy was estimated as follows:
where W is the potential energy, and is the crack area. For an isotropic linear elastic material and when the crack grows straight ahead, the energy release rate related to the stress intensity factors by
where , , and are the stress intensity factors, respectively, for the Mode I, Mode II, and Mode III, and
Under monotonic loading conditions, a crack was assumed to propagate instantly when K or G reached a critical value denoted as or , respectively, which define the fracture toughness—a characteristics of the material to resist crack propagation. The critical values for human tibia bone, i.e., , , respectively, in the ranges of 2.2 ÷ 5.7 (MPa) and 350 ÷ 900 (J) as reported by Norman et al. [16].
2.3.2. Under Cyclic Loading Conditions
It was noted that the fatigue crack initiation dealt with the apparition of the first micro crack (often taken as the smallest detective size of the crack), while crack propagation dealt with the propagation of the initial crack until the final failure of the structure.
In order to investigate the crack propagation, key information is the initial location and geometry of the initial crack. In this study, two different strategies were considered to determine the location of the crack initiation, respectively, based on the clinical observations and on the age-related critical point identification process, using fatigue crack initiation analysis.
Regarding the first strategy, the clinical observations in the literature [10] was used to insert the circular and planar crack of radius 0.01 m, as shown in Figure 3a. The material properties of the 24-year-old patient reported in Table 1 was considered. The corresponding numerical analyses were conducted with and without implant.
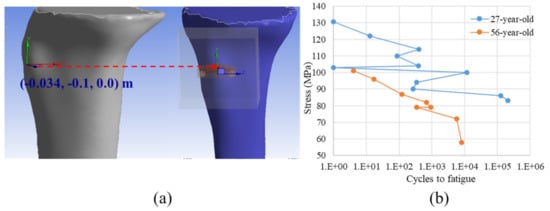
Figure 3.
Location of the crack initiation based on the clinical observation (a) and the Stress-Cycles to fatigue diagram (the so-called SN curve) from the accumulation of fatigue micro-damage in the human cortical bone of two different ages used in the age-related critical point identification process extracted from [20] (b).
Regarding the second strategy, a critical point was identified as the point at which the fatigue damage was maximal. At that critical point, the damage could be accumulated during cyclic loading and consequently, a crack could be formed. Additionally, the fatigue damage (i.e., D = 1/N) could be deduced from the number of cycles N whose value was determined by interpolating from a diagram of endurance, which is also known as the Wöhler curve (i.e., the S–N curve).
In the current work, the Wöhler curve was reconstructed using the experimental data from the tensile tests on two different age populations (27 and 56-year-old) [20], as shown in Figure 3b. To identify the critical point for the age-related analyses, a workflow was developed, as sketched in Figure 4, which was detailed as follows.
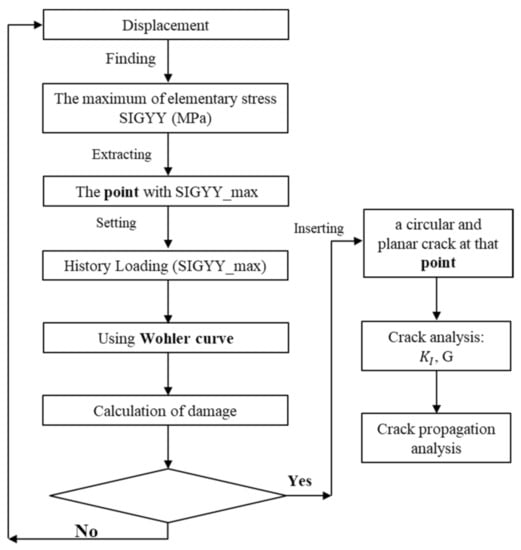
Figure 4.
The flow chart of the age-related critical point identification process.
First, the tibia bone modeled with the implant in the cases of the two different ages (27-year-old female and 56-year-old female) were used in this strategy, using the material properties reported in Table 1. These models were subjected to a prescribed displacement in the ranges of 0.00026 m–0.00041 m and 0.00029 m–0.0005 m, respectively, for the 27- and 56-year-old patients.
Then, the corresponding FEM simulations were performed to find the point at which the stress was maximal. Since the models were loaded under the axial direction (i.e., Y-axis), only the maximum value of the YY-component (denoted by SIGYY_max) of the stress tensor was considered. The history of SIGYY_max at that point was extracted.
Finally, using the Wöhler curve shown in Figure 3b, the number of cycles N was estimated by interpolation, from which the fatigue damage (D = 1/N) could be estimated.
It was noted that if the fatigue damage was not present, the crack could not be formed. On the other hand, if the fatigue damage was positive, it was confirmed that a crack was formed at that location. It should be noted that this approach could be generalized in the more complex loading conditions. In this particular study, the location of the maximum damage was identical to that of the maximum SIGYY, due to the fact that the bone was mainly under uniaxial loading conditions.
For both strategies, one location of the initial crack was determined, a circular and planar crack of radius 0.01 m on the plane Oxz passing through the initial location was inserted at that point for further crack propagation analysis.
When subjecting the cyclic loading, after being initiated, the crack would propagate in the bone until final failure. Under the framework of linear elasticity, Paris [16] proposed that the number of cycles required for the fatigue of a specimen with a crack could be related to the amplitude of the crack’s stress intensity factor . Let us consider the specimen under cyclic external loading ranging from to , the constitutive equation of the Paris’ law is expressed as follows:
where da/dN is the crack growth rate, a is the crack size, N is the number of fatigue cycles, C and n are the two material constants, and is an equivalent stress intensity factor, in which and are the stress intensity factors, respectively, in the cases of and . In this work, C = 10−8 and n = 2.8 were considered from the literature [31,32,33]. The crack propagation was modeled using eXtended Finite Element Method (X-FEM), in combination with the automatic mesh adaptivity through the Salome-Meca software.
The eXtended Finite Element Method (X-FEM) is becoming a popular method for modeling cracks in the linear elastic fracture mechanics (LEFM) approach [18,25]. In comparison to the classical finite element method where the crack needs to be meshed, the X-FEM method employed an analytical solution to represent the crack in the mesh without an explicit crack mesh. In simple terms, the method stands on enriching the finite element model with the addition of degrees of freedom, which are corresponded to the nodes of the elements that the crack pass-through. One of the advantages of the X-FEM relates to the fact that the crack path does not necessarily need to be defined a priori. Additionally, the laborious and tedious re-meshing during each step of crack propagation could be avoided. This method was used to study bone fracture and crack propagation analysis [18]. In fact, the crack becomes a structure that one could insert into the numerical model. For this reason, X-FEM is employed in this study. Note that X-FEM is only involved in crack representation. Once the model is built, a dedicated module of fracture mechanics analysis in code-aster was employed to compute the fracture mechanics parameters K and G, as well as to perform crack initiation and propagation analyses.
3. Computational Results
3.1. Mesh Sensitivity Study
A mesh sensitivity analysis was first performed to check the convergence of the fracture mechanics parameters, and to identify the optimal mesh size. For this purpose, four different meshes were considered for the case of the tibia bone with and without the implant, as shown in the Table 2, and performed in Figure 5 and Figure 6. For each FEM simulation, the stress intensity factor and the energy release rate were evaluated along the crack tip.
Table 2.
Different mesh configurations for the case of the tibia bone with and without the implant.
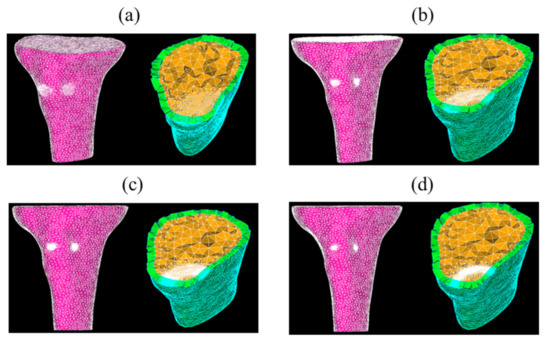
Figure 5.
Four meshes of the tibia model without implant—coarse (a), medium (b), fine (c), and very fine (d) meshes.
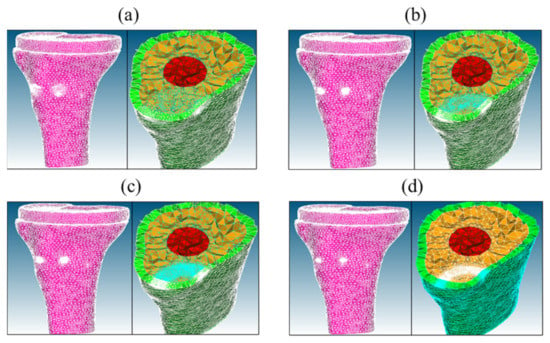
Figure 6.
Four meshes of the tibia model with implant (TKR model)—coarse (a), medium (b), fine (c), and very fine (d) meshes.
The values of and of along the crack tip for different meshes are shown in Figure 7 for the tibia models without implant (Figure 7a,b) and with the implant (Figure 7c,d). The computational times for the model without the implant were 71.68 s, 121.35 s, 194.15 s, and 237.77 s, respectively, for coarse, medium, fine, and very fine meshes, using a single Core i7 processor, while for the model with the implant, the computational times, respectively, were 126.69 s, 169.12 s, 248.13 s, and 259.79 s.
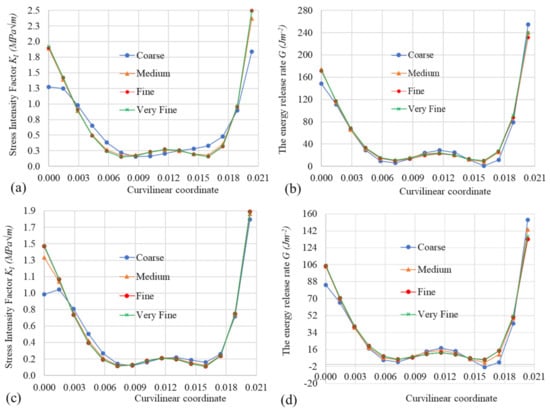
Figure 7.
Mesh size effect on the values of and of G versus the curvilinear coordinate along the crack tip—the tibia model without the implant (a,b) and the tibia model with the implant (c,d).
As shown in Figure 7, the mesh convergence of the values of and of along the crack tip was observed. The values of and of G were, respectively, in the range of 0.152.5 (MPa) and 10240 (J) for the model without implant, and in the range of 0.111.9 (MPa) and 5133 (J), respectively, for the model with the implant. Moreover, the values of and of G of the model with the implant were smaller than the corresponding values of the model without the implant, which allowed an increase in the resistance to crack propagation by fatigue in the former. The fine meshes for the models of the tibia bone without and with the implant were used for the crack propagation in the next section, since it provides a balance between the computational cost and the converged solution.
3.2. Crack Propagation Analysis
3.2.1. Fixed Initiation Location Strategy
The initial location using the clinical observations is shown in Figure 3a. The crack propagation is shown in Figure 8 and Figure 9, respectively, for the tibia model, without the implant and the model with the implant. It was noted that the values of and of G reported in Figure 7 of these two models were smaller than their critical values for human tibia bone, i.e., , , respectively, in the ranges of 2.2 ÷ 5.7 (MPa) and 350 ÷ 900 (J), as reported by Norman et al. [16]. Therefore, no crack was propagated under monotonic loading conditions, as discussed in Section 2.3.1. However, due to the uncertainty in the quantification of these values of the bone, especially the cancellous bones with much smaller values of , , the crack could be assumed to propagate. Additionally, even for the healthy tibia bone, the crack could also propagate under cyclic loading conditions. Therefore, crack propagation was studied in the subsequent sections.
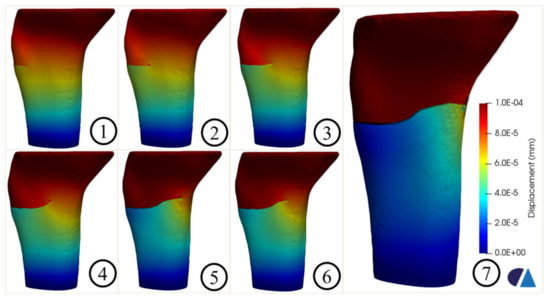
Figure 8.
Crack propagation in the tibia model without the implant.
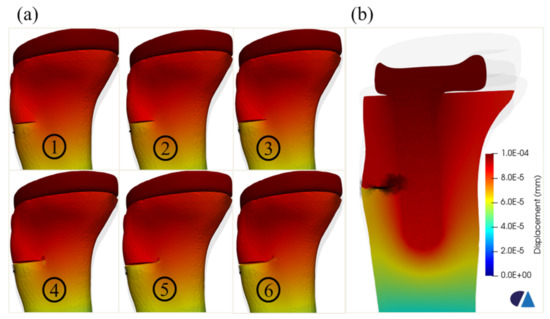
Figure 9.
Crack propagation in the tibia model with implant—different steps (a) and a slicing surface along the implant in the last step (b).
Figure 8 shows the crack propagation in the tibia model without implant. The crack path was the combination between the straight part (steps 1 and 2) and the oblique parts (steps 3, 4, 5, 6, and 7). The final failure was observed, as shown in step 7.
Figure 9 shows the fatigue crack propagation in the tibia model with the implant. The crack propagation was suspended at the interface between the implant and the cancellous bone. Moreover, the crack path tended to deviate longitudinally and upwards, after approaching the region of the implant. This observation agreed with the Type II of crack [10], particularly in subtype A, which was a fracture with a stable prosthesis on radiographs, due to the glued contact between the cancellous bone and the implant in this model.
3.2.2. Critical Point Identification Process and Age-Related Effect Analysis
The point with the maximum stress for two age-related models was found, as shown in Figure 10a. The history of the maximum stress (SIGYY_max) as a function of the displacement was tracked, as shown in Figure 10b. It was shown that the younger bone had a maximum stress greater than that of the older bones but in a smaller displacement range. In terms of medical perspective, the younger bone was always stronger than the older bone, leading to bone fracture risk with increasing age, due to the loss of bone mass and bone quality [34,35,36]. This remark was also confirmed from a mechanical viewpoint, due to the higher modulus of elasticity of the younger tissue.
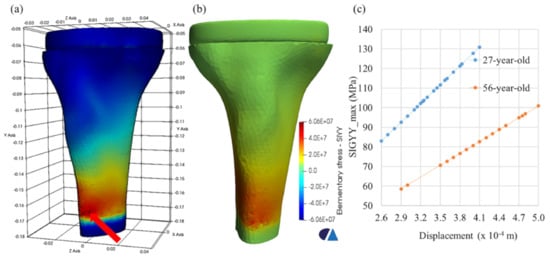
Figure 10.
Maximum stress location (red arrow) of the 56-aged model, (a) the distribution of the stress component SIGYY of the 56-aged model (b), and the history of SIGYY_max versus the displacement at the maximum stress location (c).
The correlation between two age-related (27-year-old female, 56-year-old female) tibia models with implant indicates that age unfavorably influenced the fatigue/lifetime of the human tibia bone material, particularly including implant prosthetics. The S–N curve witnessed a decrease with increasing age (Figure 11). This showed that older individuals would experience a lesser contraction in the fatigue cycles to failure than the younger individuals, with an increase in the applied loading. Moreover, the higher the stress, the faster is the gradual accumulation of damage. These observations concerning the accumulation of damage on the TKR model under tensile stress-cycling are similar to those presented by Zioupos [20].
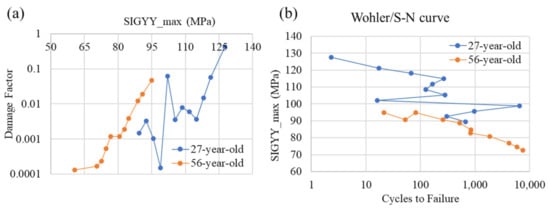
Figure 11.
The fatigue damage curve (a) and S–N curve (b) for two age-related tibia models with implant.
With regards to the stress intensity factor and the energy release rate of the model with implant for two related ages (27-year-old female, 56-year-old female), the findings of this study were in agreement with the literature ranges for values related to the characterized bone’s resistance to fracture. In terms of critical stress intensity factor was reported to be 2.2 ÷ 6.3 (MPa) in [31], and critical energy release rate was found to be 780 ÷ 1120 (J) for the cortical bone [16], as reported in Table 3.
Table 3.
Simulation and experiment values of and G.
The crack propagation simulations of the two age-related tibia models with implant are shown in Figure 12 and Figure 13, respectively. The crack paths of these two age-related models were quite similar and consisted of an initial straight part and an oblique part (steps 2–6). It was noted that the maximum stresses equaling to 95.8 and 60.6 MPa were obtained for the 27-year-old and 56-year-old bone models, respectively, corresponding to 977 and 7502 cycles to failure.
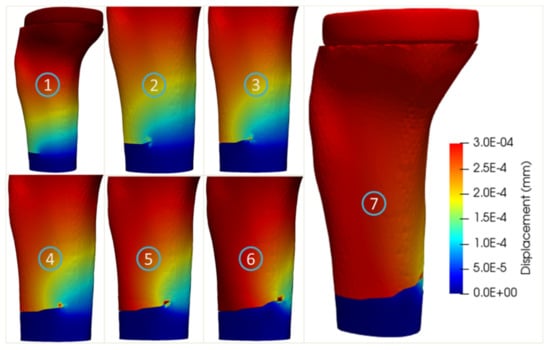
Figure 12.
Crack propagation in the tibia bone model with implant of the 27-year-old female.
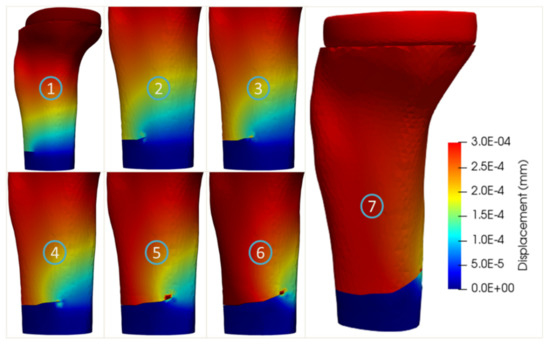
Figure 13.
Crack propagation of the tibia bone model with implant of the 56-year-old female.
4. Discussion
Understanding of crack propagation behavior within biological organs (e.g., femur, tibia) is of great clinical relevance to prevent the fractures [18]. Numerical methods such as eXtended Finite Element Method were considered as potential tools to provide quantitative and objective indicators (e.g., crack path, critical stress intensity factor, and critical strain energy release rate) for characterizing the crack propagation within bone structures [25,26,27]. Consequently, understanding the fracture mechanics of the human knee structures allows better decision support for clinical interventions. In this present study, the simulation of the tibia bone crack propagation under total knee replacement was simulated and evaluated. This study provided, for the first time, a detailed view on the full crack path of the tibia bone within the TKR implant. In particular, an age-related factor effect analysis in this process was conducted.
In our study, two strategies to identify the location of the initial crack were adopted. The first strategy related to the fixed-point location from clinical observation and the associated outcomes indicated that the propagation still happens with smaller values of the stress intensity factor and energy release rate, than those in the literature. This finding suggested a larger range of values for these factors, when propagating cracks within the human bone structures. In fact, this strategy was less sensitive to the value range of the stress intensity factor and the energy release rate. The second strategy dealt with the use of experimental data to calibrate an age-related point identification process. In fact, the automatic identification of the crack initiation point, based on the maximal stress under tensile loading, gives a more consistent range of values for the stress intensity factor and the energy release rate. Obtained outcomes indicated that the strategy to identify the crack initiation point is a very important factor. This present study suggested that the second strategy was the best strategy to perform crack analysis in the human system, thanks to its damage-based crack initiation approach.
In addition to the crack initiation, the material law of the bone tissue also plays an important role in the propagation process. In the present study, a homogeneous linear elastic law was used. However, with the presence of the implant, we observed the discontinuity at the bone–implant interface, leading to a disruption of the crack path. This finding confirmed the important role of the patient-specific material properties of the bone to analyze the crack propagation behavior.
Age-related micro-damage accumulation during surgery or daily life activities might affect the material properties of bone [33]. A scratch might inevitably occur on its surface, leading to an accumulation of stress at those points and the formation of a location for crack growth propagation. Additionally, the S–N curve observation revealed that older individuals would experience a lesser decline in the fatigue cycles to failure than younger ones, with a certain increase in the applied stress. In fact, the higher the stress, the faster was the gradual accumulation of damage. The present study compared the full crack path and fracture behavior of two age models (27-year-old and 56-year-old) with different material properties. The obtained outcomes also suggest that age (i.e., bone strength) plays an important role in the tibia crack and fracture. Our finding was in agreement with the literature work [20]. However, it is important to note that the strength of the bone tissue is an important factor for crack and fracture prevention. Thus, rehabilitation should be conducted after the TKR procedure, to improve the bone strength and joint flexibility.
In the framework of finite element modeling, the choice of the element formulation plays an important role for an accurate analysis. It is well-known that higher-order elements such as quadratic elements give more accurate results than linear elements. In the present study, linear tetrahedral elements were used. This choice was based on two main reasons. First, it was recommended in the used FE solver (Code_Aster) to use linear elements for the XFEM methods. This element type facilitated the crack identification. Second, during the crack proposition study, for each step of crack advancement, the model needed to rerun to compute the fracture mechanics parameters. To assure a balance between result accuracy and efficient computing time, it was plausible to select the model with linear elements after performing a convergence study on the mesh size. Note that we also performed simulations with the quadratic tetrahedral elements. The obtained outcomes showed that the values of stress intensity factor and the energy release rates were about 10% higher than those obtained with linear elements in the same mesh size. Additionally, both types of elements provided the same trends and converged quite well. However, the quadratic model required about 10 times of memory and computing time (37.10 s and 338.40 s for medium linear and quadratic mesh configurations) than those of linear elements. Moreover, 10% of the difference between the linear and quadratic elements of the same mesh sizes was not significant, due to the uncertainty of the boundary conditions and material properties.
Another effecting factor of our simulation outcomes might link to the segmentation error. In the present study, a thresholding process was performed. Due to the high contrast level of the bone tissue from CT scan, different bone structures (cortical and cancellous bone tissues and implant in titanium) were extracted in a straightforward manner. However, further investigation should take the sensitivity of the threshold values into consideration. Moreover, it is practically impossible to validate the simulation outcomes with in vivo patient data in a non-invasive manner. Thus, we adopted the strategy to compare the simulation outcomes with experimental observations. First, the stress intensity factor and the energy release rate from our simulations were closely in agreement with literature data. Moreover, in comparison to cracked ex vivo bone samples (pig femur in transverse and longitudinal planes with high-speed X-ray imaging technique [37], human proximal femoral diaphysis specimens with backscattered electron microscopic imaging technique [38]), the crack pattern was quite stable with no large deflection. The direction of crack was also in agreement with experimental observations. However, our simulations could not reproduce the micro-cracks around the crack path as commonly observed in the experimental cracked specimens [39,40].
One of the limitations of the present study relates to the use of only tibia structure and associated implant part. Thus, a full knee model including femur, tibia, cartilage, and ligament structures and the associated full TKR implant needs to be investigated in the future, to have a full view on the crack propagation behavior within the human knee. Another limitation dealt with the use of linear elastic law and generic material properties for modeling bone tissue. It is important to note that the material properties play an important role in the crack propagation analysis, especially when the ageing effect is considered. Bone tissue commonly exhibits an anisotropic, inhomogeneous, nonlinear, thermo-rheologically viscoelastic material. Thus, further studies on the integration of more complex behavior law and associated patient-specific properties of the bone tissue from medical imaging data [41,42] would be performed. In particular, more mechanical failure testing data on older bone specimens, especially tibia bones, need to be acquired to reconstruct the more appropriate S–N curves for patients with total knee replacement, who are generally older than the age range (27-year-old and 56-year-old) used in this present study. Moreover, only circular and planar crack was considered in the present study, further investigations to study the effect of the length and the various shape of the crack on propagation are needed. Additionally, the theories of crack initiation and propagation in the fracture mechanics field were originally developed for metals. Similar to previous studies discussed in Section 1, the use of these approaches in the crack propagation of the bone implied an important assumption that the fracture mechanics is applicable to study the bones. While the results obtained in this study are promising, further investigation is needed to revisit this assumption. Finally, the integration of dynamic loading during walking and running activities needs to be conducted. More precisely, a rigid musculoskeletal model of the knee structure would be investigated to provide a large range of dynamic loading conditions [43,44]. Thus, this multi-scale coupling is of great interest toward a better understanding of the damage and fracture mechanism during daily activities for injury prevention.
5. Conclusions
This study focused on the tibia bone crack, with and without an implant, to provide objective and quantitative indicators toward a better understanding of the full crack path and fracture mechanics. Crack initiation and crack propagation were performed using the extended finite element method (X-FEM). Two strategies (fixed-point location and age-related critical point identification) were adopted to determine the crack initiation location. This study provided, for the first time, a detailed view on the full crack path from crack initiation to final failure of the tibia bone within the TKR implant. The obtained outcomes also suggested that the age factor (i.e., bone strength) plays an important role in the tibia crack and bone fracture. In perspectives, patient-specific bone properties and dynamic loadings (e.g., during walking or running) will be incorporated in future, to provide objective and quantitative indicators for crack and fracture prevention during daily activities.
Author Contributions
Conceptualization, H.-Q.N., T.-T.D. and X.V.T.; methodology, H.-Q.N., T.-T.D., V.-D.N. and X.V.T.; modeling and simulation, H.-Q.N., T.-N.-T.N., T.-Q.-D.P. and V.-D.N.; result analysis and interpretation, H.-Q.N., T.-N.-T.N., T.-Q.-D.P., V.-D.N., X.V.T. and T.-T.D.; writing—original draft preparation, H.-Q.N. and T.-N.-T.N.; writing—review and editing, V.-D.N., X.V.T. and T.-T.D. All authors have read and agreed to the published version of the manuscript.
Funding
The present research study was funded by Thu Dau Mot University (TDMU) under grant number DT.20.1-028.
Institutional Review Board Statement
Not applicable.
Informed Consent Statement
Not applicable.
Data Availability Statement
Patient data were acquired from an open access repository (https://simtk.org/projects/kneeloads (accessed on 1 September 2020)).
Acknowledgments
The present research study was funded by Thu Dau Mot University (TDMU) under grant number DT.20.1-028.
Conflicts of Interest
The authors declare no conflict of interest.
References
- Confalonieri, N.; Biazzo, A.; Alessio, B.; Norberto, C. Computer-assisted surgery in total knee replacement: Advantages, surgical procedure and review of the literature. Acta Bio-Med. Atenei Parm. 2019, 90, 16–23. [Google Scholar]
- Cordeiro, E.N.; Costa, R.C.; Carazzato, J.G.; Silva, J.D.S. Periprosthetic fractures in patients with total knee arthroplasties. Clin. Orthop. Relat. Res. 1990, 252, 182–189. [Google Scholar] [CrossRef]
- Culp, R.W.; Schmidt, R.G.; Hanks, G.; Mak, A.; Esterhai, J.L., Jr.; Heppenstall, R.B. Supracondylar fracture of the femur following prosthetic knee arthroplasty. Clin. Orthop. Relat. Res. 1987, 222, 212–222. [Google Scholar] [CrossRef]
- Konan, S.; Sandiford, N.; Unno, F.; Masri, B.S.; Garbuz, D.S.; Duncan, C.P. Periprosthetic fractures associated with total knee arthroplasty: An update. Bone Jt. J. 2016, 98, 1489–1496. [Google Scholar] [CrossRef]
- Petrie, J.R.; Sassoon, A.A.; Haidukewych, G.J. Periprosthetic Fractures Around a Total Knee Arthroplasty with a Stable and Loose Tibial Component. In Periprosthetic Fractures of the Hip and Knee; Liporace, F., Yoon, R., Eds.; Springer Nature: Cham, Switzerland, 2019; pp. 143–157. [Google Scholar]
- Chen, F.; A Mont, M.; Bachner, R.S. Management of ipsilateral supracondylar femur fractures following total knee arthroplasty. J. Arthroplast. 1994, 9, 521–526. [Google Scholar] [CrossRef]
- Ritter, M.A.; Thong, A.E.; Keating, E.M.; Faris, P.M.; Meding, J.B.; Berend, M.E.; Pierson, J.L.; Davis, K.E. The effect of femoral notching during total knee arthroplasty on the prevalence of postoperative femoral fractures and on clinical outcome. JBJS 2005, 87, 2411–2414. [Google Scholar]
- Johnston, A.T.; Tsiridis, E.; Eyres, K.S.; Toms, A.D. Periprosthetic fractures in the distal femur following total knee replacement: A review and guide to management. Knee 2012, 19, 156–162. [Google Scholar] [CrossRef] [PubMed]
- McCormack, B.A.O.; Prendergast, P.J. An Analysis of Crack Propagation Paths at Implant/Bone-Cement Interfaces. J. Biomech. Eng. 1996, 118, 579–585. [Google Scholar] [CrossRef]
- Yoo, J.D.; Kim, N.K. Periprosthetic Fractures Following Total Knee Arthroplasty. Knee Surg. Relat. Res. 2015, 27, 1–9. [Google Scholar] [CrossRef] [PubMed]
- Dennis, D.A. Periprosthetic fractures following total knee arthroplasty. JBJS 2001, 83, 120. [Google Scholar] [CrossRef]
- Harris, W.H. Osteolysis and particle disease in hip replacement: A review. Acta Orthop. Scand. 1994, 65, 113–123. [Google Scholar] [CrossRef] [PubMed]
- Kim, S.-H.; Chang, S.-H.; Jung, H.-J. The finite element analysis of a fractured tibia applied by composite bone plates considering contact conditions and time-varying properties of curing tissues. Compos. Struct. 2010, 92, 2109–2118. [Google Scholar] [CrossRef]
- Wang, Y.; Qi, E.; Zhang, X.; Xue, L.; Wang, L.; Tian, J. A finite element analysis of relationship between fracture, implant and tibial tunnel. Sci. Rep. 2021, 11, 1–10. [Google Scholar]
- Wong, C.; Mikkelsen, P.; Hansen, L.B.; Darvann, T.; Gebuhr, P. Finite element analysis of tibial fractures. Dan. Med Bull. 2010, 57, 4148. [Google Scholar]
- Martin, R.B.; Burr, D.B.; Sharkey, N.A.; Fyhrie, D.P. Fatigue and Fracture Resistance of Bone. In Skeletal Tissue Mechanics; Springer: New York, NY, USA, 2015; pp. 423–482. [Google Scholar]
- Vashishth, D. Hierarchy of bone microdamage at multiple length scales. Int. J. Fatigue 2007, 29, 1024–1033. [Google Scholar] [CrossRef] [PubMed]
- Sabet, F.A.; Najafi, A.R.; Hamed, E.; Jasiuk, I. Modelling of bone fracture and strength at different length scales: A review. Interface Focus 2016, 6, 20150055. [Google Scholar] [CrossRef] [PubMed]
- Carter, D.R.; Caler, W.E.; Spengler, D.M.; Frankel, V.H. Fatigue behavior of adult cortical bone: The influence of mean strain and strain range. Acta Orthop. Scand. 1981, 52, 481–490. [Google Scholar] [CrossRef] [PubMed]
- Zioupos, P.; Wang, X.; Currey, J. The accumulation of fatigue microdamage in human cortical bone of two different ages in vitro. Clin. Biomech. 1996, 11, 365–375. [Google Scholar] [CrossRef]
- Idkaidek, A.; Jasiuk, I. Cortical bone fracture analysis using XFEM—Case study. Int. J. Numer. Methods Biomed. Eng. 2016, 33, e2809. [Google Scholar] [CrossRef] [PubMed]
- Mischinski, S.; Ural, A. Finite Element Modeling of Microcrack Growth in Cortical Bone. J. Appl. Mech. 2011, 78, 041016. [Google Scholar] [CrossRef]
- Ural, A.; Zioupos, P.; Buchanan, D.; Vashishth, D. The effect of strain rate on fracture toughness of human cortical bone: A finite element study. J. Mech. Behav. Biomed. Mater. 2011, 4, 1021–1032. [Google Scholar] [CrossRef]
- Feerick, E.M.; Liu, X.C.; McGarry, P. Anisotropic mode-dependent damage of cortical bone using the extended finite element method (XFEM). J. Mech. Behav. Biomed. Mater. 2013, 20, 77–89. [Google Scholar] [CrossRef] [PubMed]
- Budyn, E.; Hoc, T.; Jonvaux, J. Fracture strength assessment and aging signs detection in human cortical bone using an X-FEM multiple scale approach. Comput. Mech. 2008, 42, 579–591. [Google Scholar] [CrossRef]
- Sedmak, A.; Čolić, K.; Grbović, A.; Balać, I.; Burzić, M. Numerical analysis of fatigue crack growth of hip implant. Eng. Fract. Mech. 2019, 216, 106492. [Google Scholar] [CrossRef]
- Budyn, E.; Hoc, T. Multi-Scale Modeling of Human Cortical Bone: Aging and Failure Studies. Mrs Proc. 2006, 975, 1–6. [Google Scholar] [CrossRef]
- Fregly, B.J.; Besier, T.F.; Lloyd, D.G.; Delp, S.L.; Banks, S.A.; Pandy, M.G.; D’Lima, D.D. Grand challenge competition to predict in vivo knee loads. J. Orthop. Res. 2011, 30, 503–513. [Google Scholar] [CrossRef]
- Dong, Y.; Zhang, Z.; Dong, W.; Hu, G.; Wang, B.; Mou, Z. An optimization method for implantation parameters of individualized TKA tibial prosthesis based on finite element analysis and orthogonal experimental design. BMC Musculoskelet. Disord. 2020, 21, 165. [Google Scholar] [CrossRef]
- Griffith, A.A.; Gilman, J.J. The phenomena of rupture and flow in solids. Trans. ASM 1968, 61, 855–906. [Google Scholar]
- Shelton, D.R.; Martin, R.B.; Stover, S.M.; Gibeling, J.C. Transverse fatigue crack propagation behavior in equine cortical bone. J. Mater. Sci. 2003, 38, 3501–3508. [Google Scholar] [CrossRef]
- Ritchie, R.O.; Kinney, J.H.; Kruzic, J.J.; Nalla, R.K. A fracture mechanics and mechanistic approach to the failure of cortical bone. Fatigue Fract. Eng. Mater. Struct. 2005, 28, 345–371. [Google Scholar] [CrossRef]
- Wang, X.; Puram, S. The Toughness of Cortical Bone and Its Relationship with Age. Ann. Biomed. Eng. 2004, 32, 123–135. [Google Scholar] [CrossRef] [PubMed]
- Burr, D.B.; Forwood, M.R.; Fyhrie, D.P.; Martin, R.B.; Schaffler, M.B.; Turner, C.H. Bone Microdamage and Skeletal Fragility in Osteoporotic and Stress Fractures. J. Bone Min. Res. 1997, 12, 6–15. [Google Scholar] [CrossRef] [PubMed]
- Vashishth, D. Age-Dependent Biomechanical Modifications in Bone. Crit. Rev. Eukaryot. Gene Expr. 2005, 15, 343–358. [Google Scholar] [CrossRef] [PubMed]
- Ural, A.; Vashishth, D. Anisotropy of age-related toughness loss in human cortical bone: A finite element study. J. Biomech. 2007, 40, 1606–1614. [Google Scholar] [CrossRef]
- Zhai, X.; Nie, Y.; Gao, J.; Kedir, N.; Claus, B.; Sun, T.; Fezzaa, K.; Chen, W.W. The effect of loading direction on the fracture behaviors of cortical bone at a dynamic loading rate. J. Mech. Phys. Solids 2020, 142, 104015. [Google Scholar] [CrossRef]
- Wang, M.; Li, S.; Scheidt, A.V.; Qwamizadeh, M.; Busse, B.; Silberschmidt, V.V. Numerical study of crack initiation and growth in human cortical bone: Effect of micro-morphology. Eng. Fract. Mech. 2020, 232, 107051. [Google Scholar] [CrossRef]
- Vashishth, D.; Behiri, C.; Bonfield, W. Crack growth resistance in cortical bone: Concept of microcrack toughening. J. Biomech. 1997, 30, 763–769. [Google Scholar] [CrossRef]
- Vashishth, D.; E Tanner, K.; Bonfield, W. Contribution, development and morphology of microcracking in cortical bone during crack propagation. J. Biomech. 2000, 33, 1169–1174. [Google Scholar] [CrossRef]
- Nguyen, H.Q.; Dao, T.T.; Rassineux, A.; Ho Ba Tho, M.C. Material-driven mesh of the lumbar spine derived from CT data. Comput. Methods Biomech. Biomed. Eng. Imaging Vis. 2018, 6, 128–136. [Google Scholar] [CrossRef]
- Dao, T.T.; Fan, A.-X.; Dakpé, S.; Pouletaut, P.; Rachik, M.; Tho, M.C.H.B. Image-based skeletal muscle coordination: Case study on a subject specific facial mimic simulation. J. Mech. Med. Biol. 2018, 18, 1850020. [Google Scholar] [CrossRef]
- Dao, T.-T.; Marin, F.; Pouletaut, P.; Charleux, F.; Aufaure, P.; Tho, M.C.H.B. Estimation of accuracy of patient-specific musculoskeletal modelling: Case study on a post polio residual paralysis subject. Comput. Methods Biomech. Biomed. Eng. 2012, 15, 745–751. [Google Scholar] [CrossRef] [PubMed]
- Dao, T.T. Enhanced Musculoskeletal Modeling for Prediction of Intervertebral Disc Stress within Annulus Fibrosus and Nucleus Pulposus Regions during Flexion Movement. J. Med Biol. Eng. 2016, 36, 583–593. [Google Scholar] [CrossRef]


Publisher’s Note: MDPI stays neutral with regard to jurisdictional claims in published maps and institutional affiliations. |
© 2021 by the authors. Licensee MDPI, Basel, Switzerland. This article is an open access article distributed under the terms and conditions of the Creative Commons Attribution (CC BY) license (https://creativecommons.org/licenses/by/4.0/).