
Behavior Characteristics of Single Batter Pile under Vertical Load


Abstract
1. Introduction
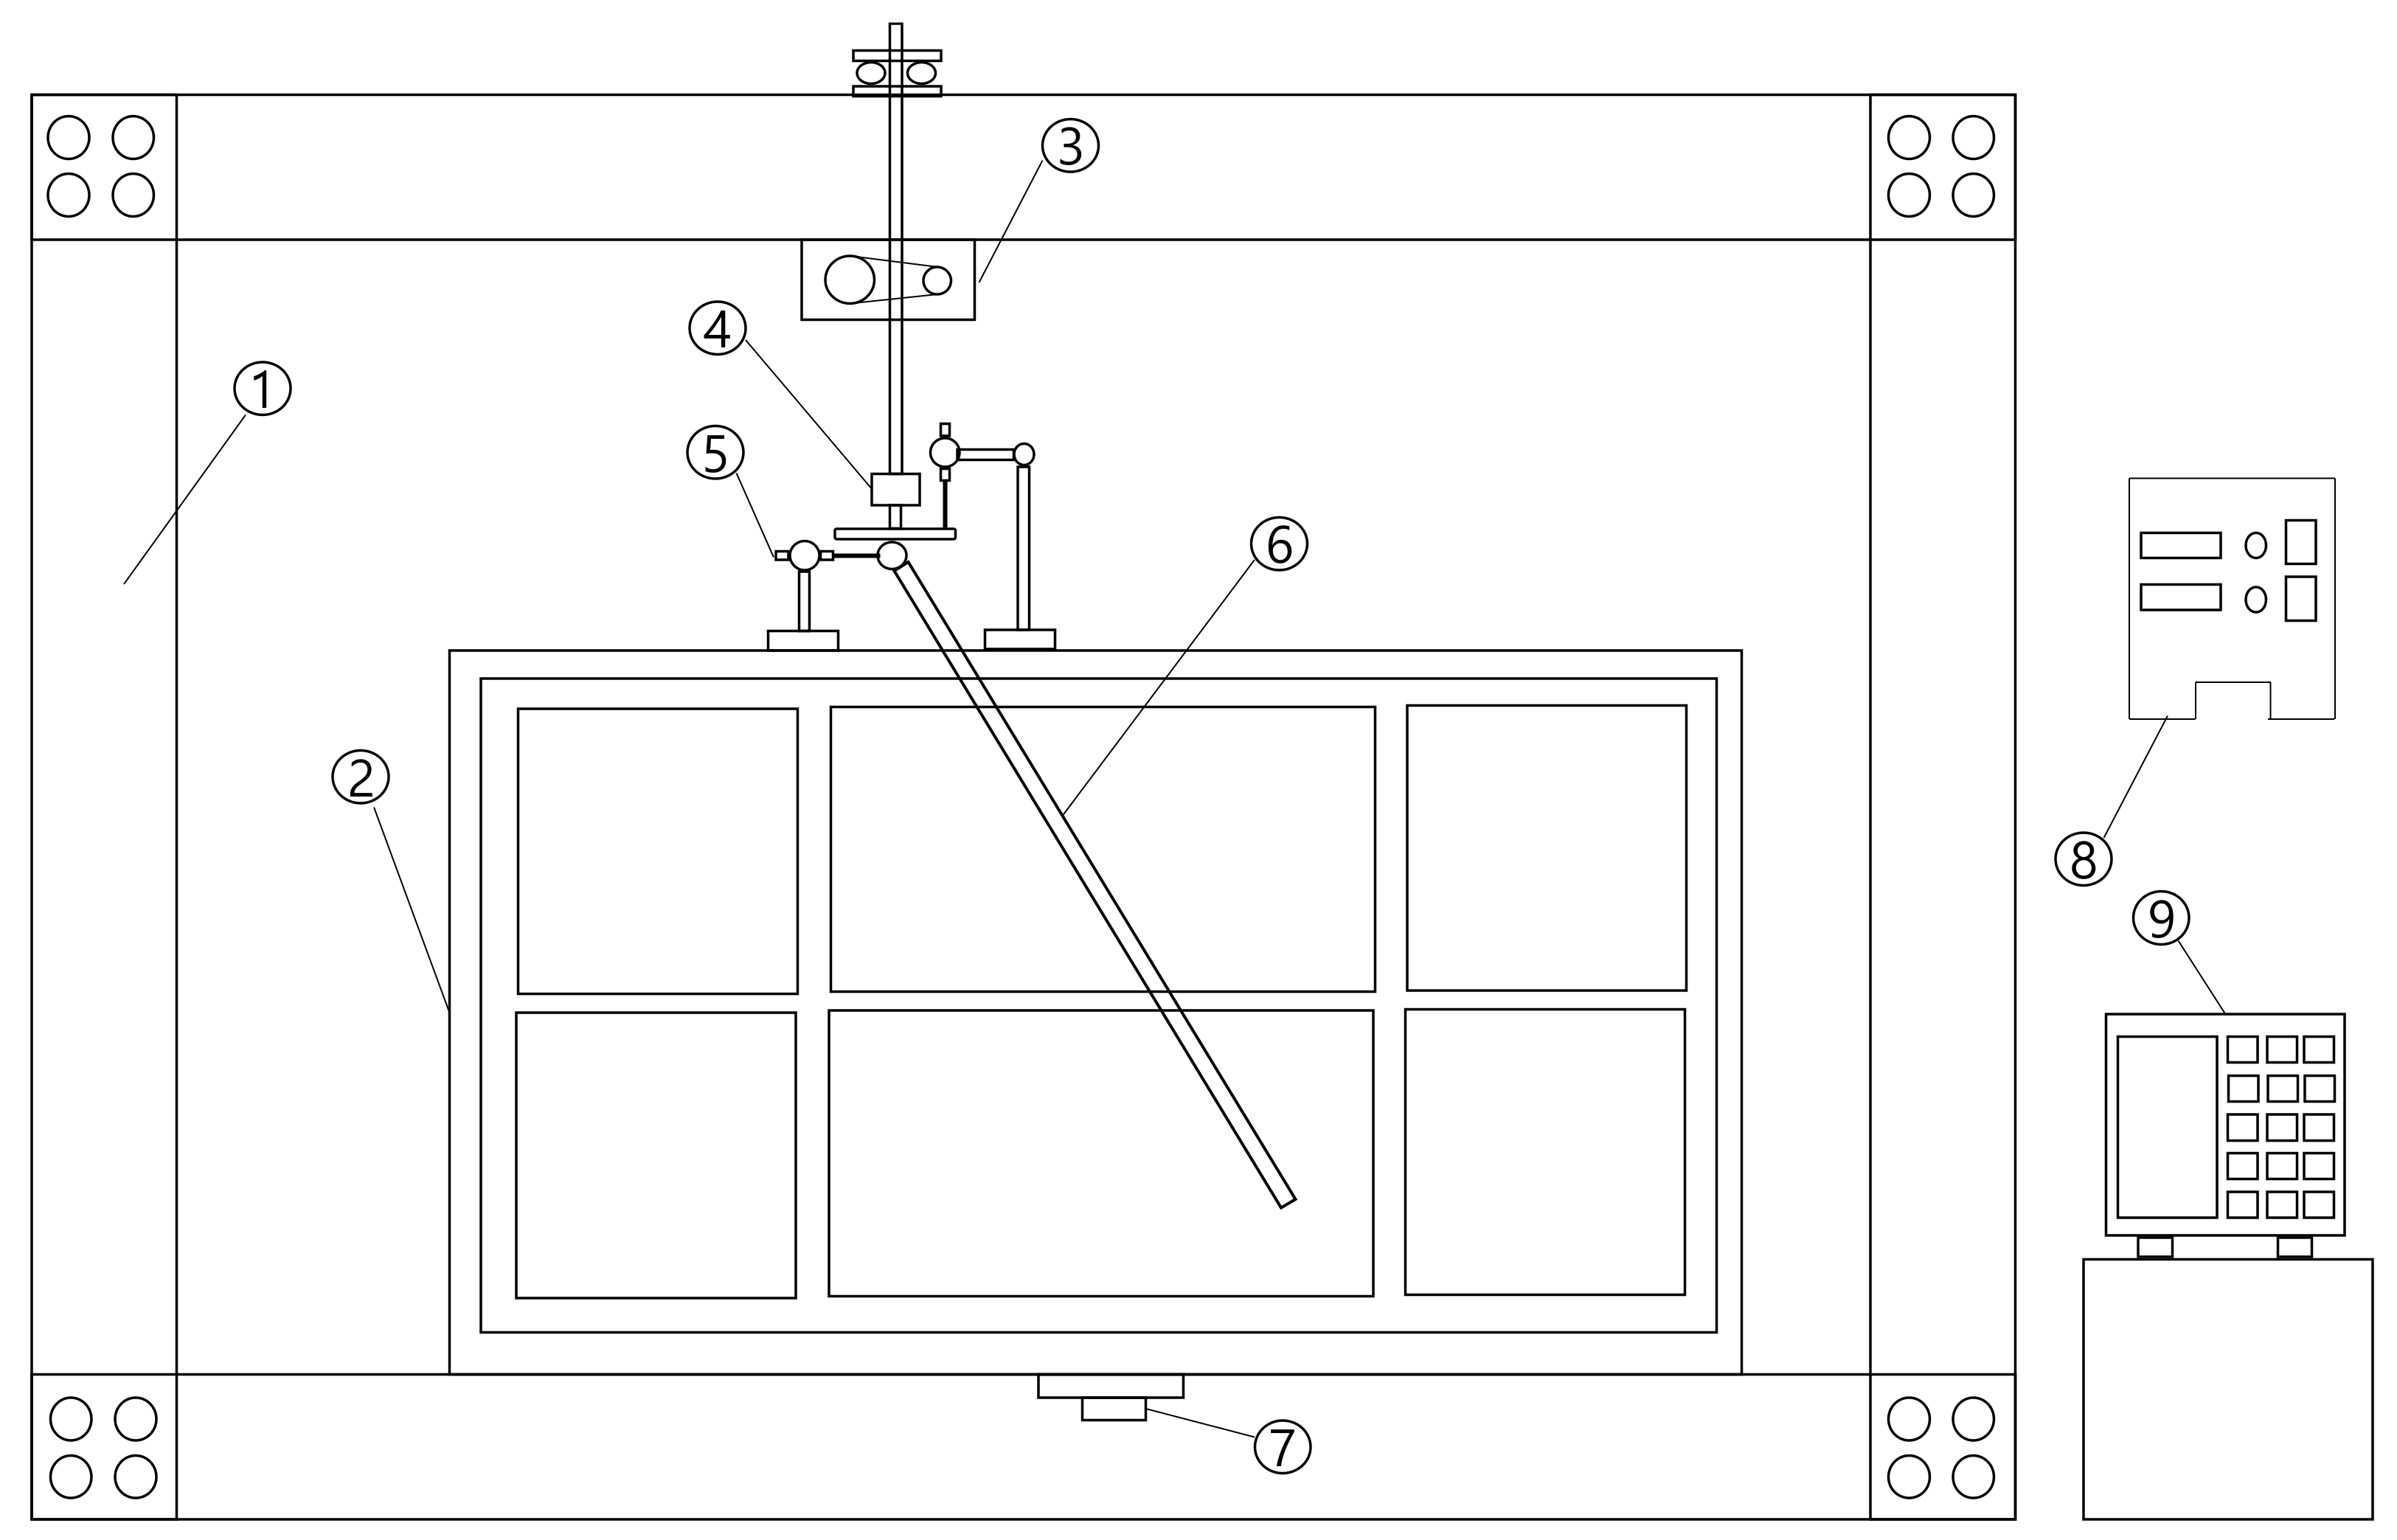
2. Model Test
3. Test Results and Analysis
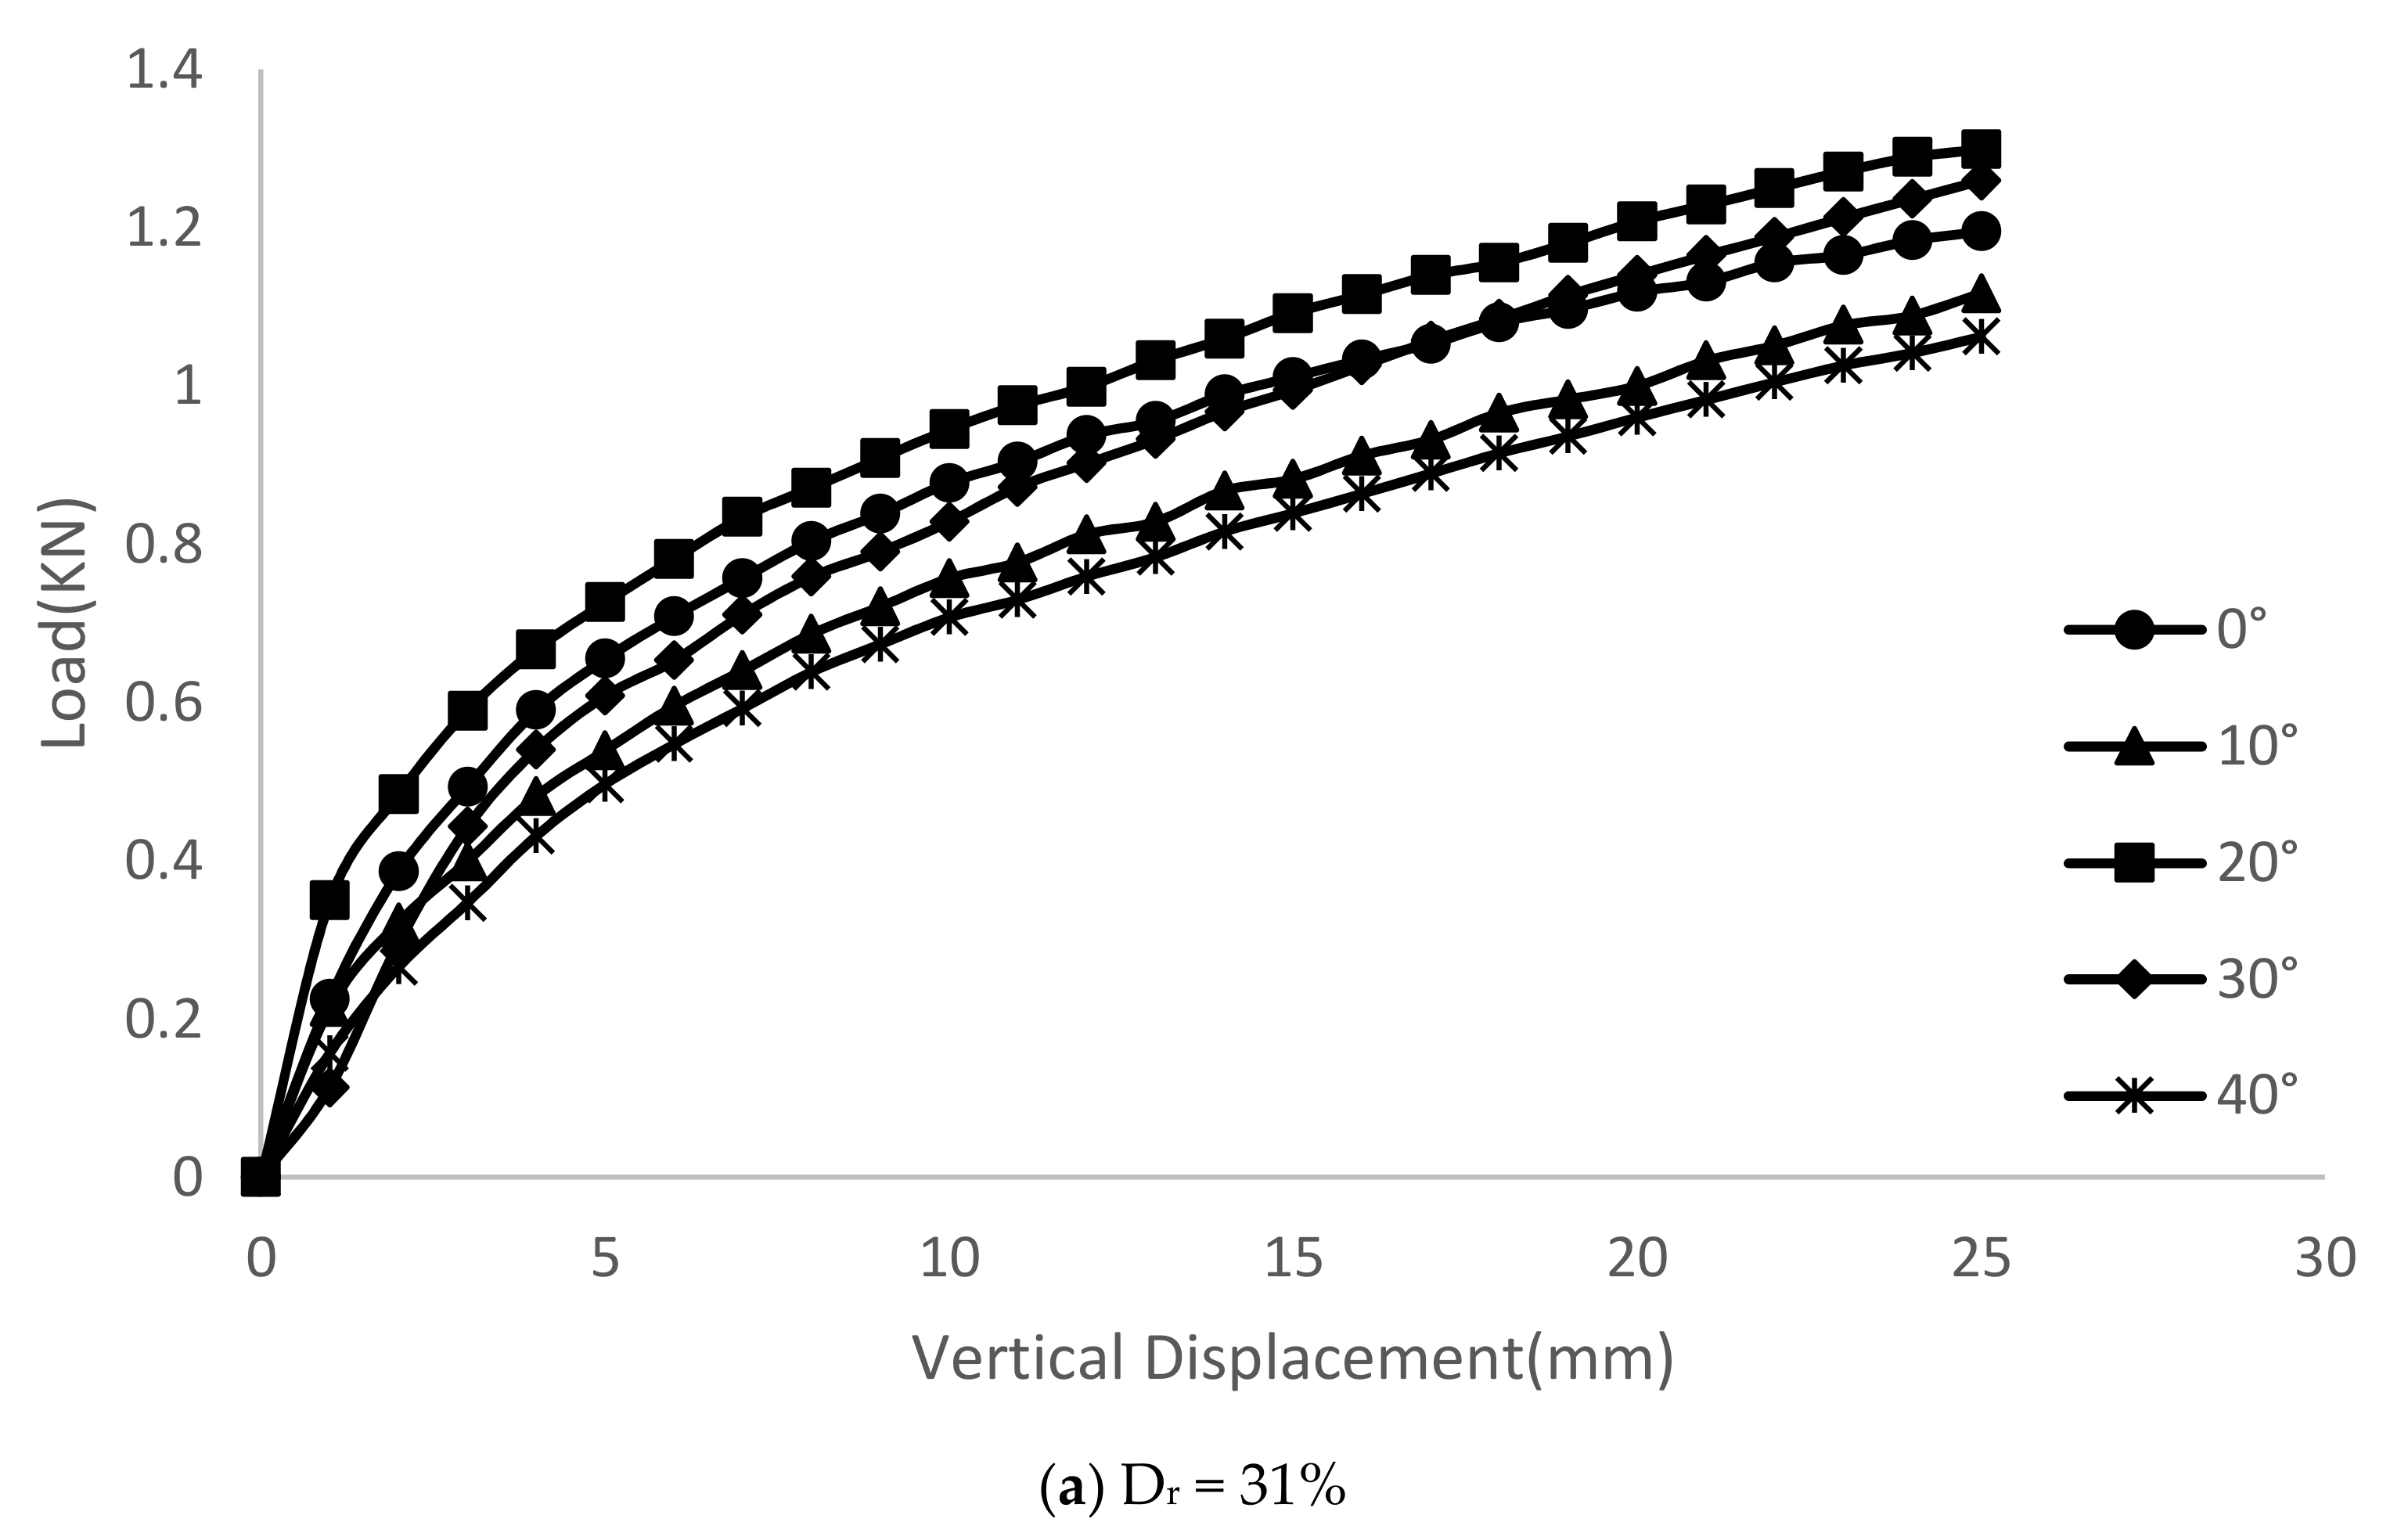
3.1. Relationship between Pile Head Displacement and Vertical Load
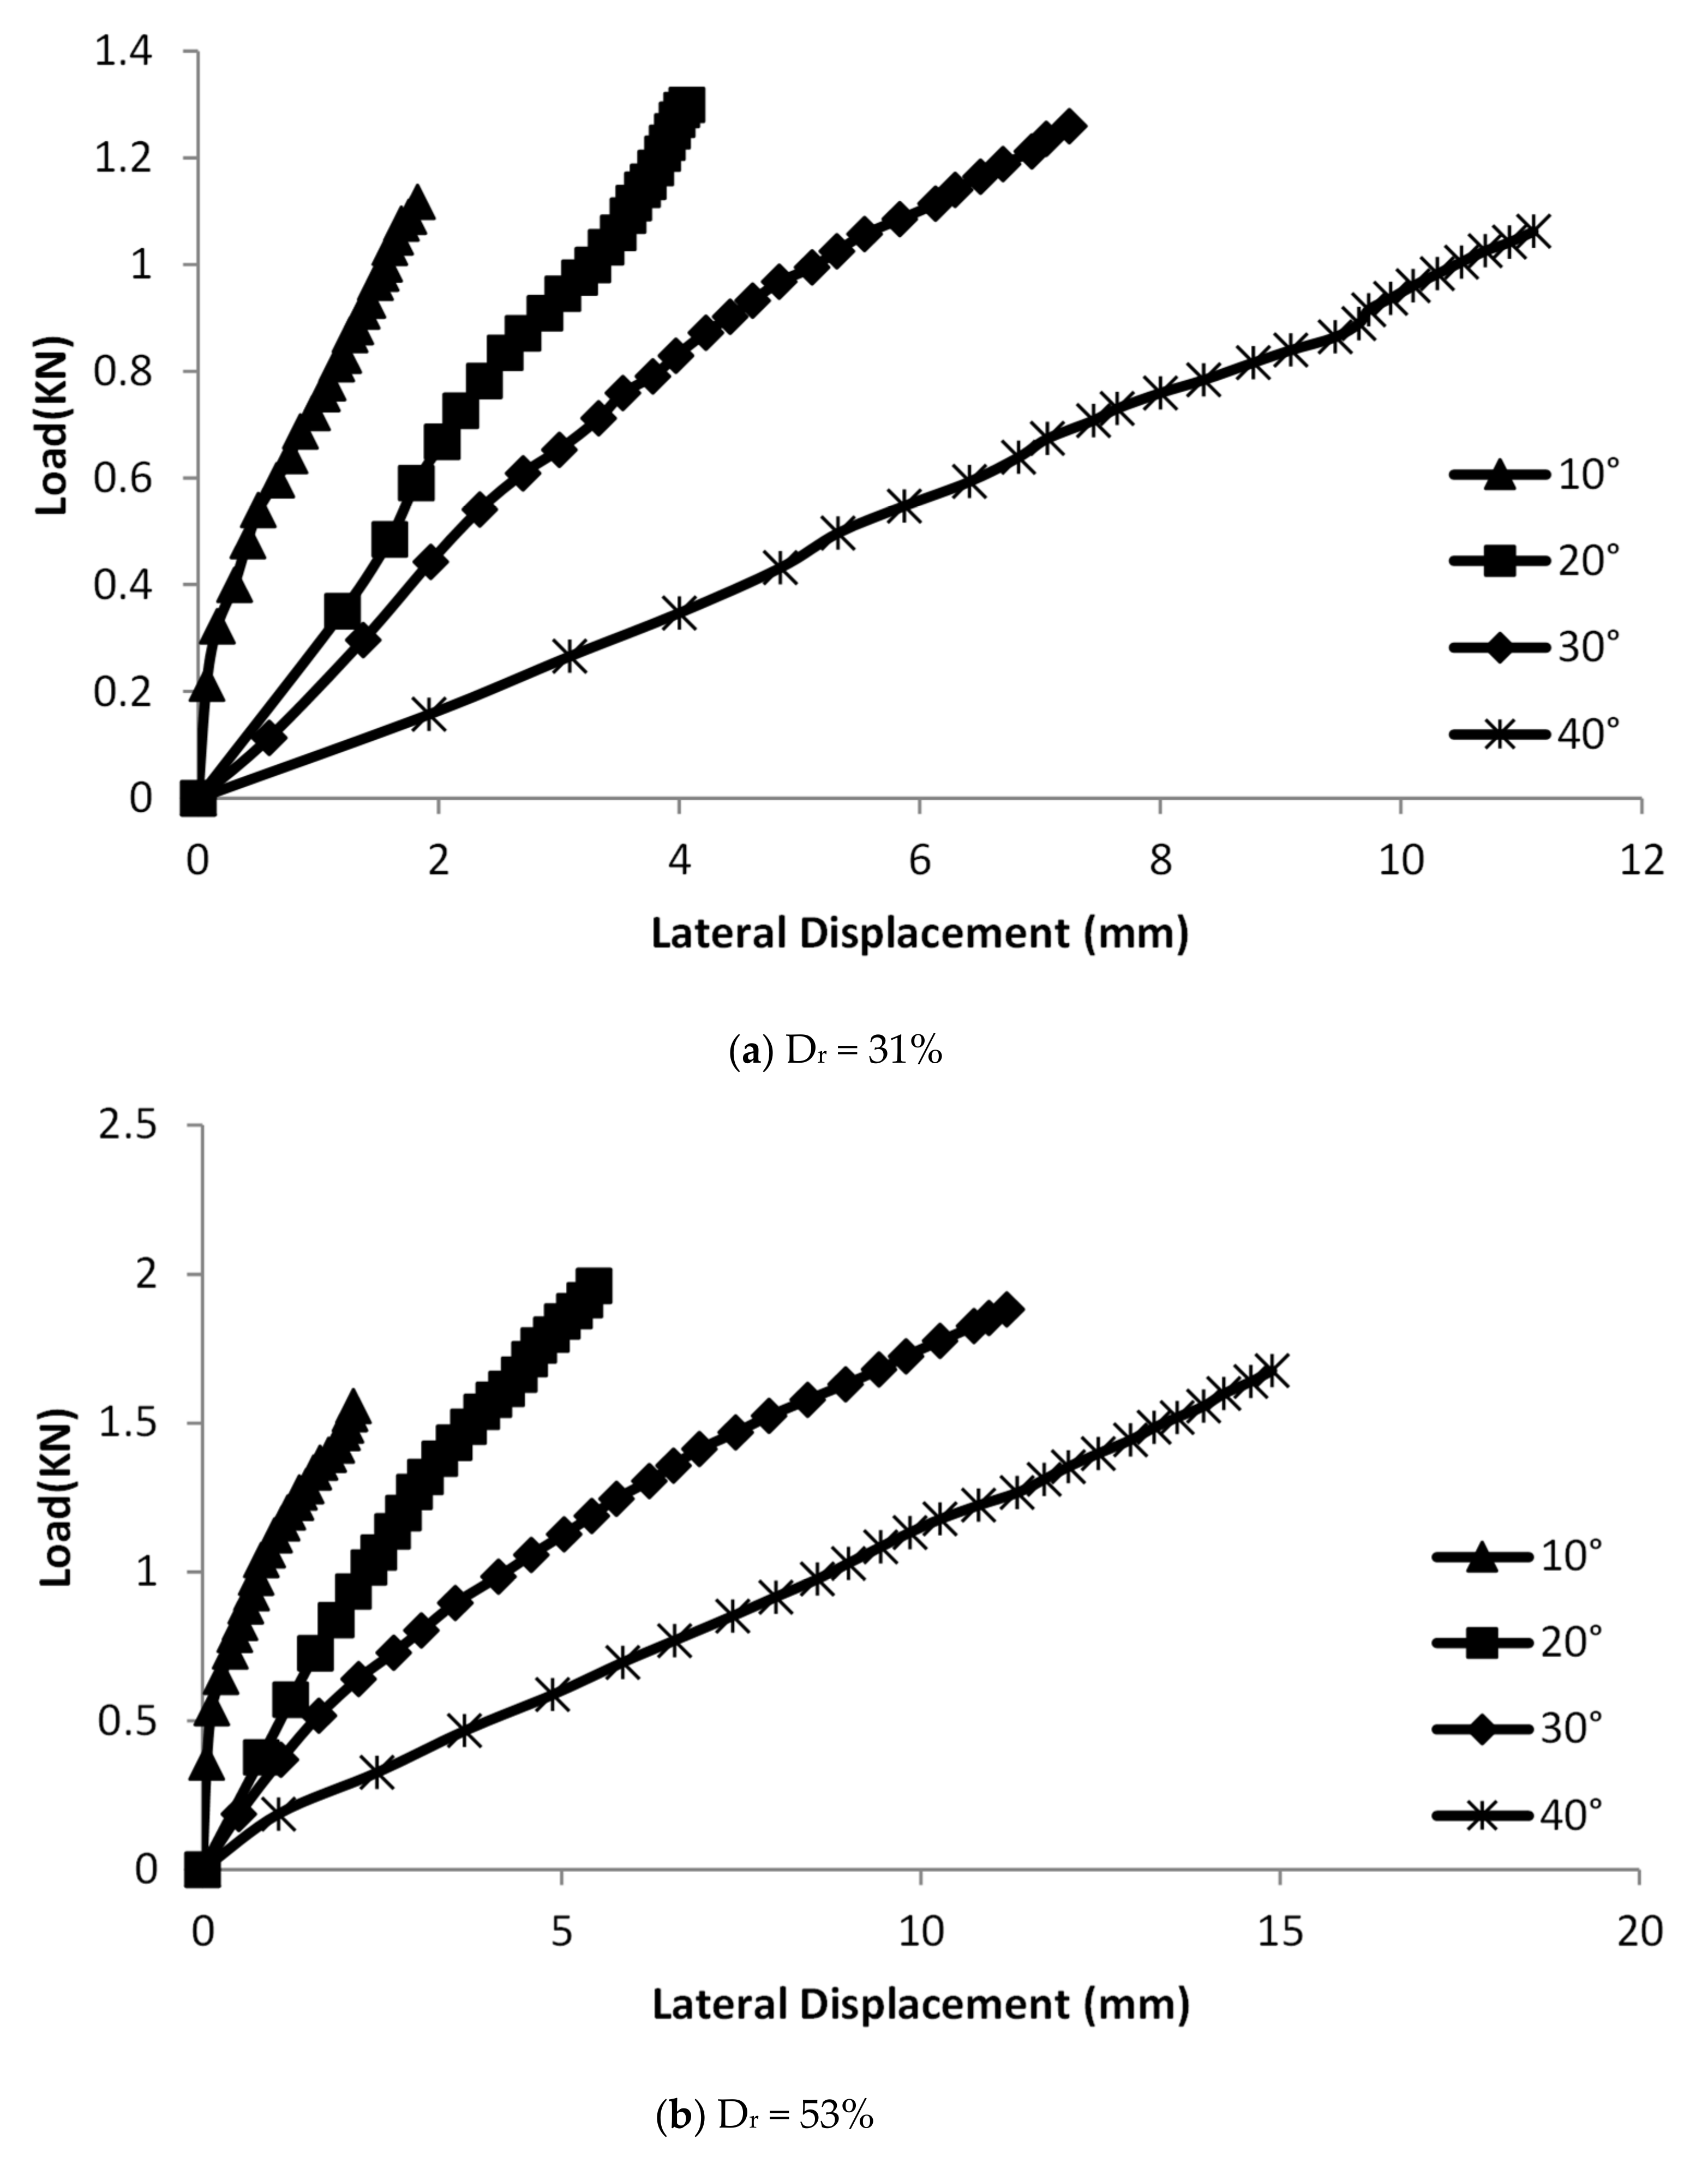
3.1.1. Relationship between Horizontal Displacement and Vertical Load of Each Pile Slope by Relative Density
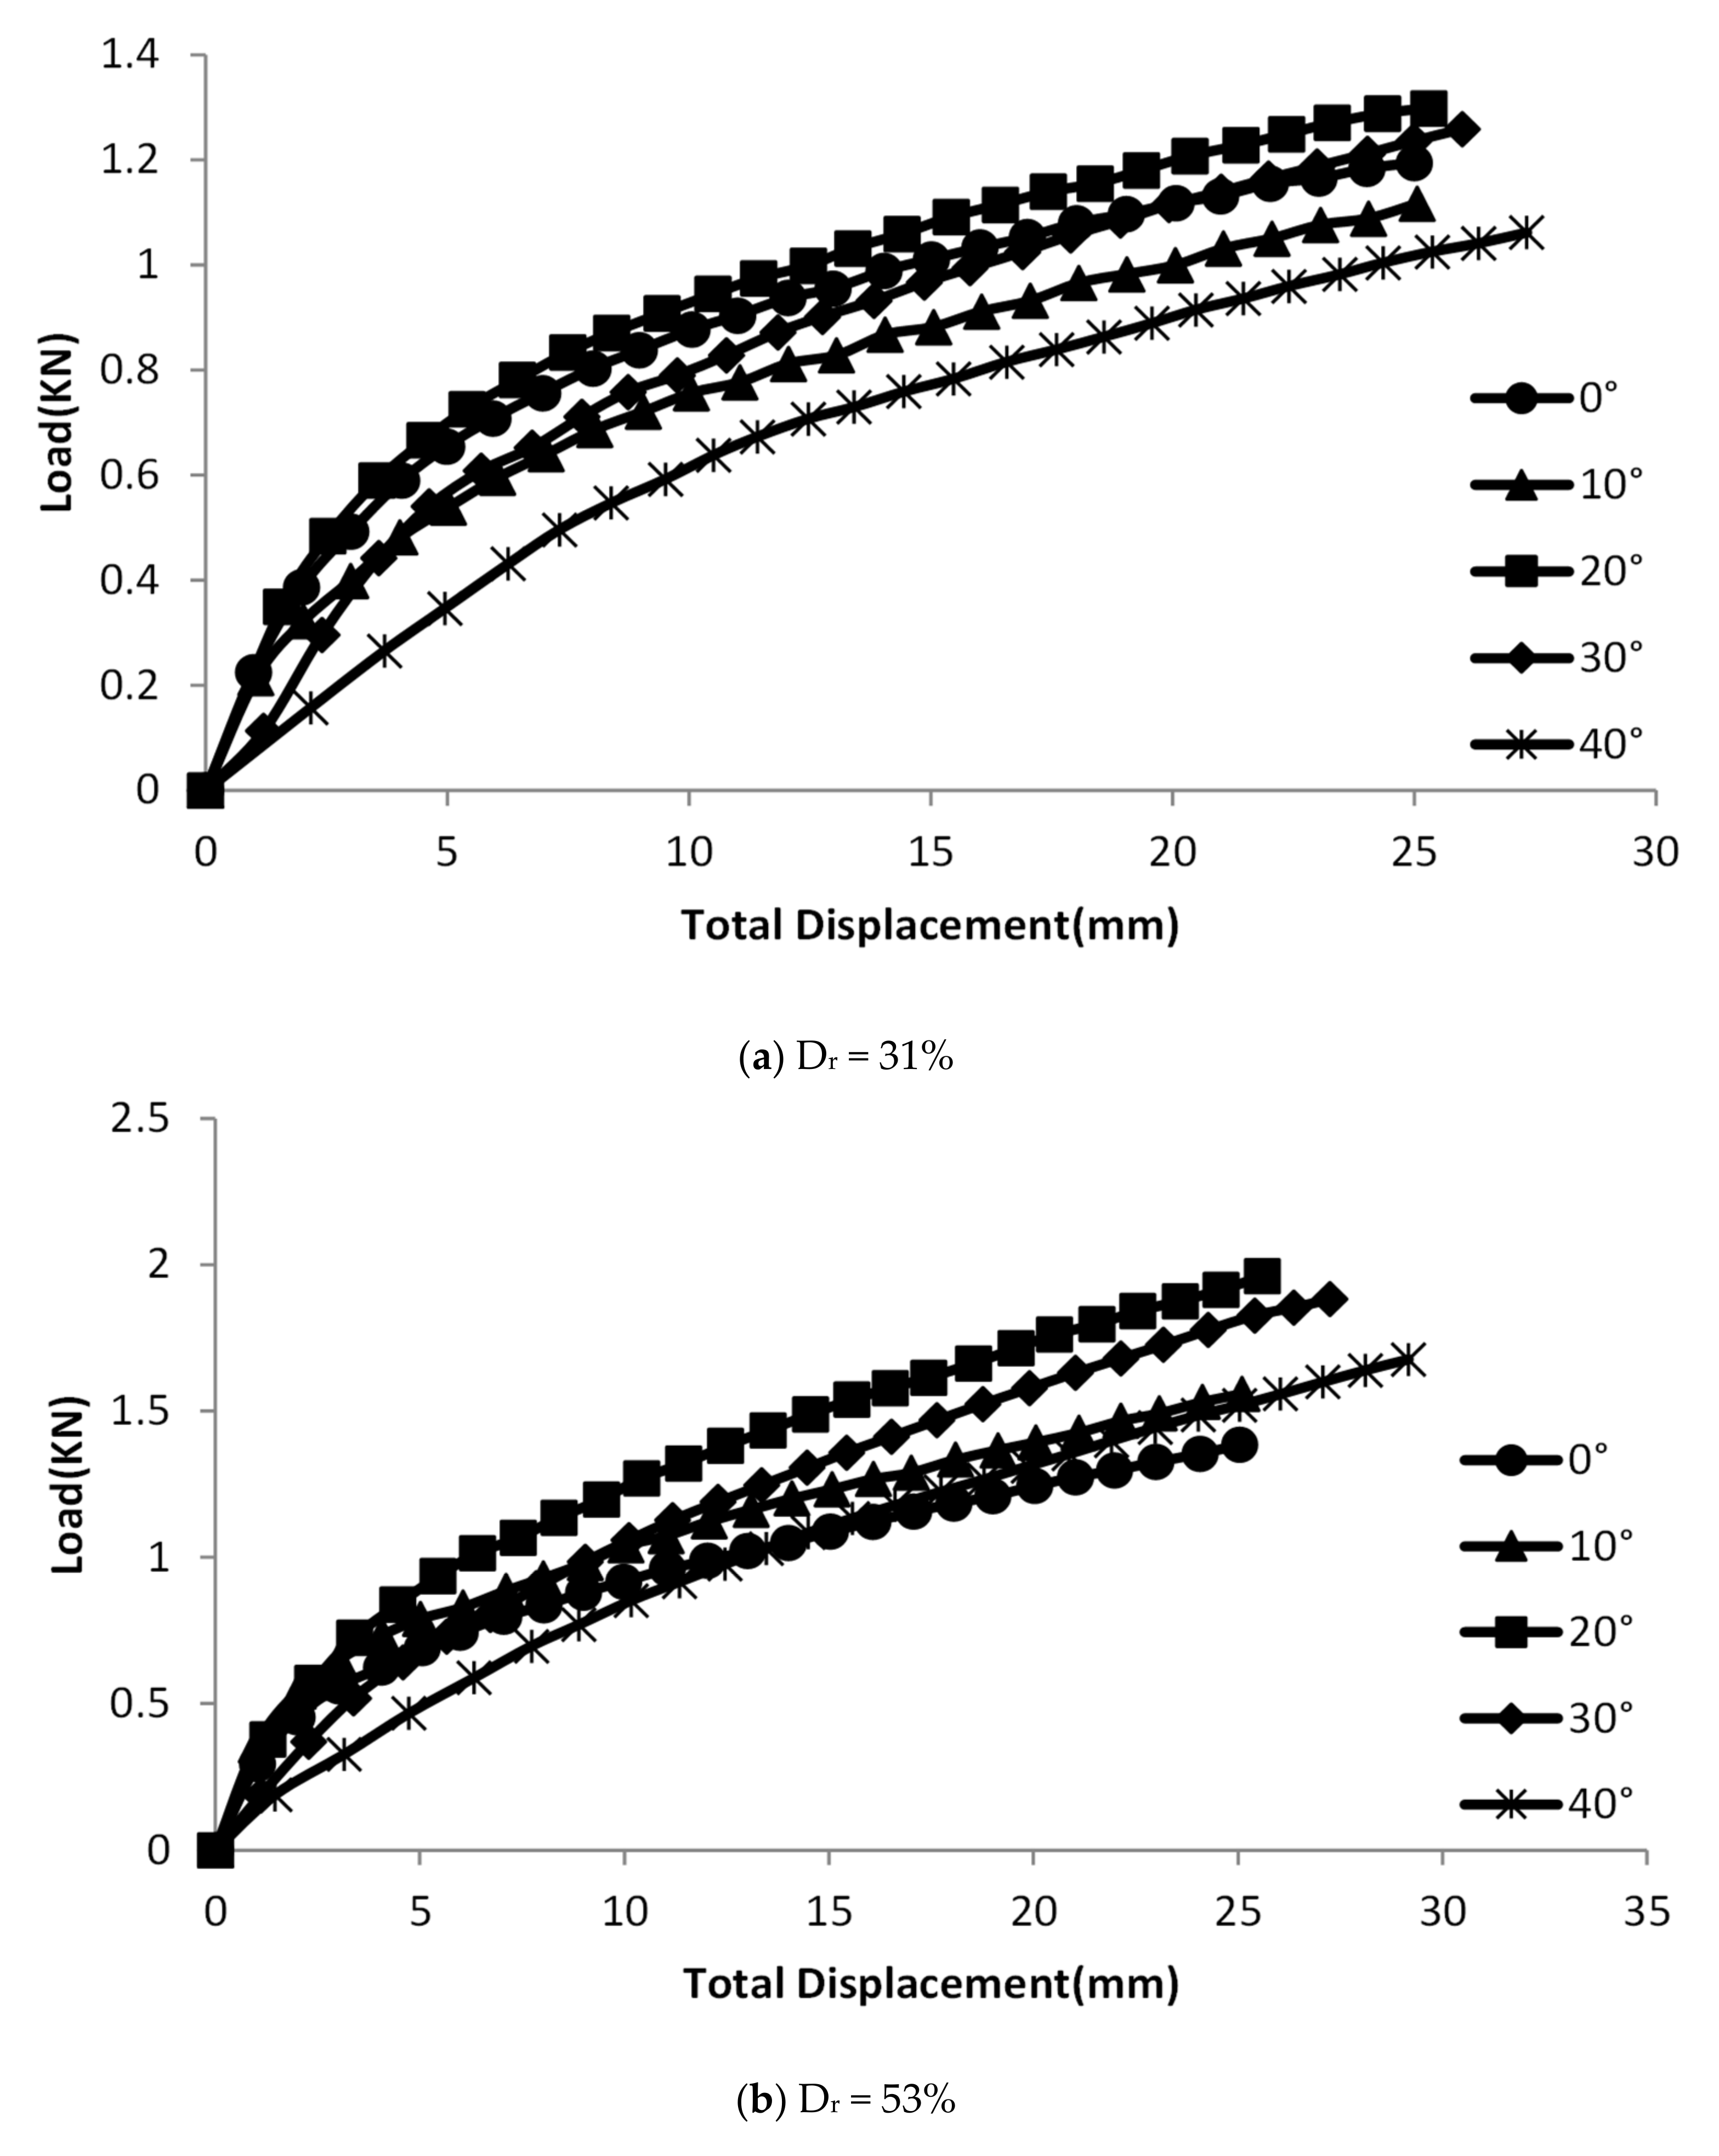
3.1.2. Relationship between the Total Displacement and Vertical Load of Each Slope by Relative Density
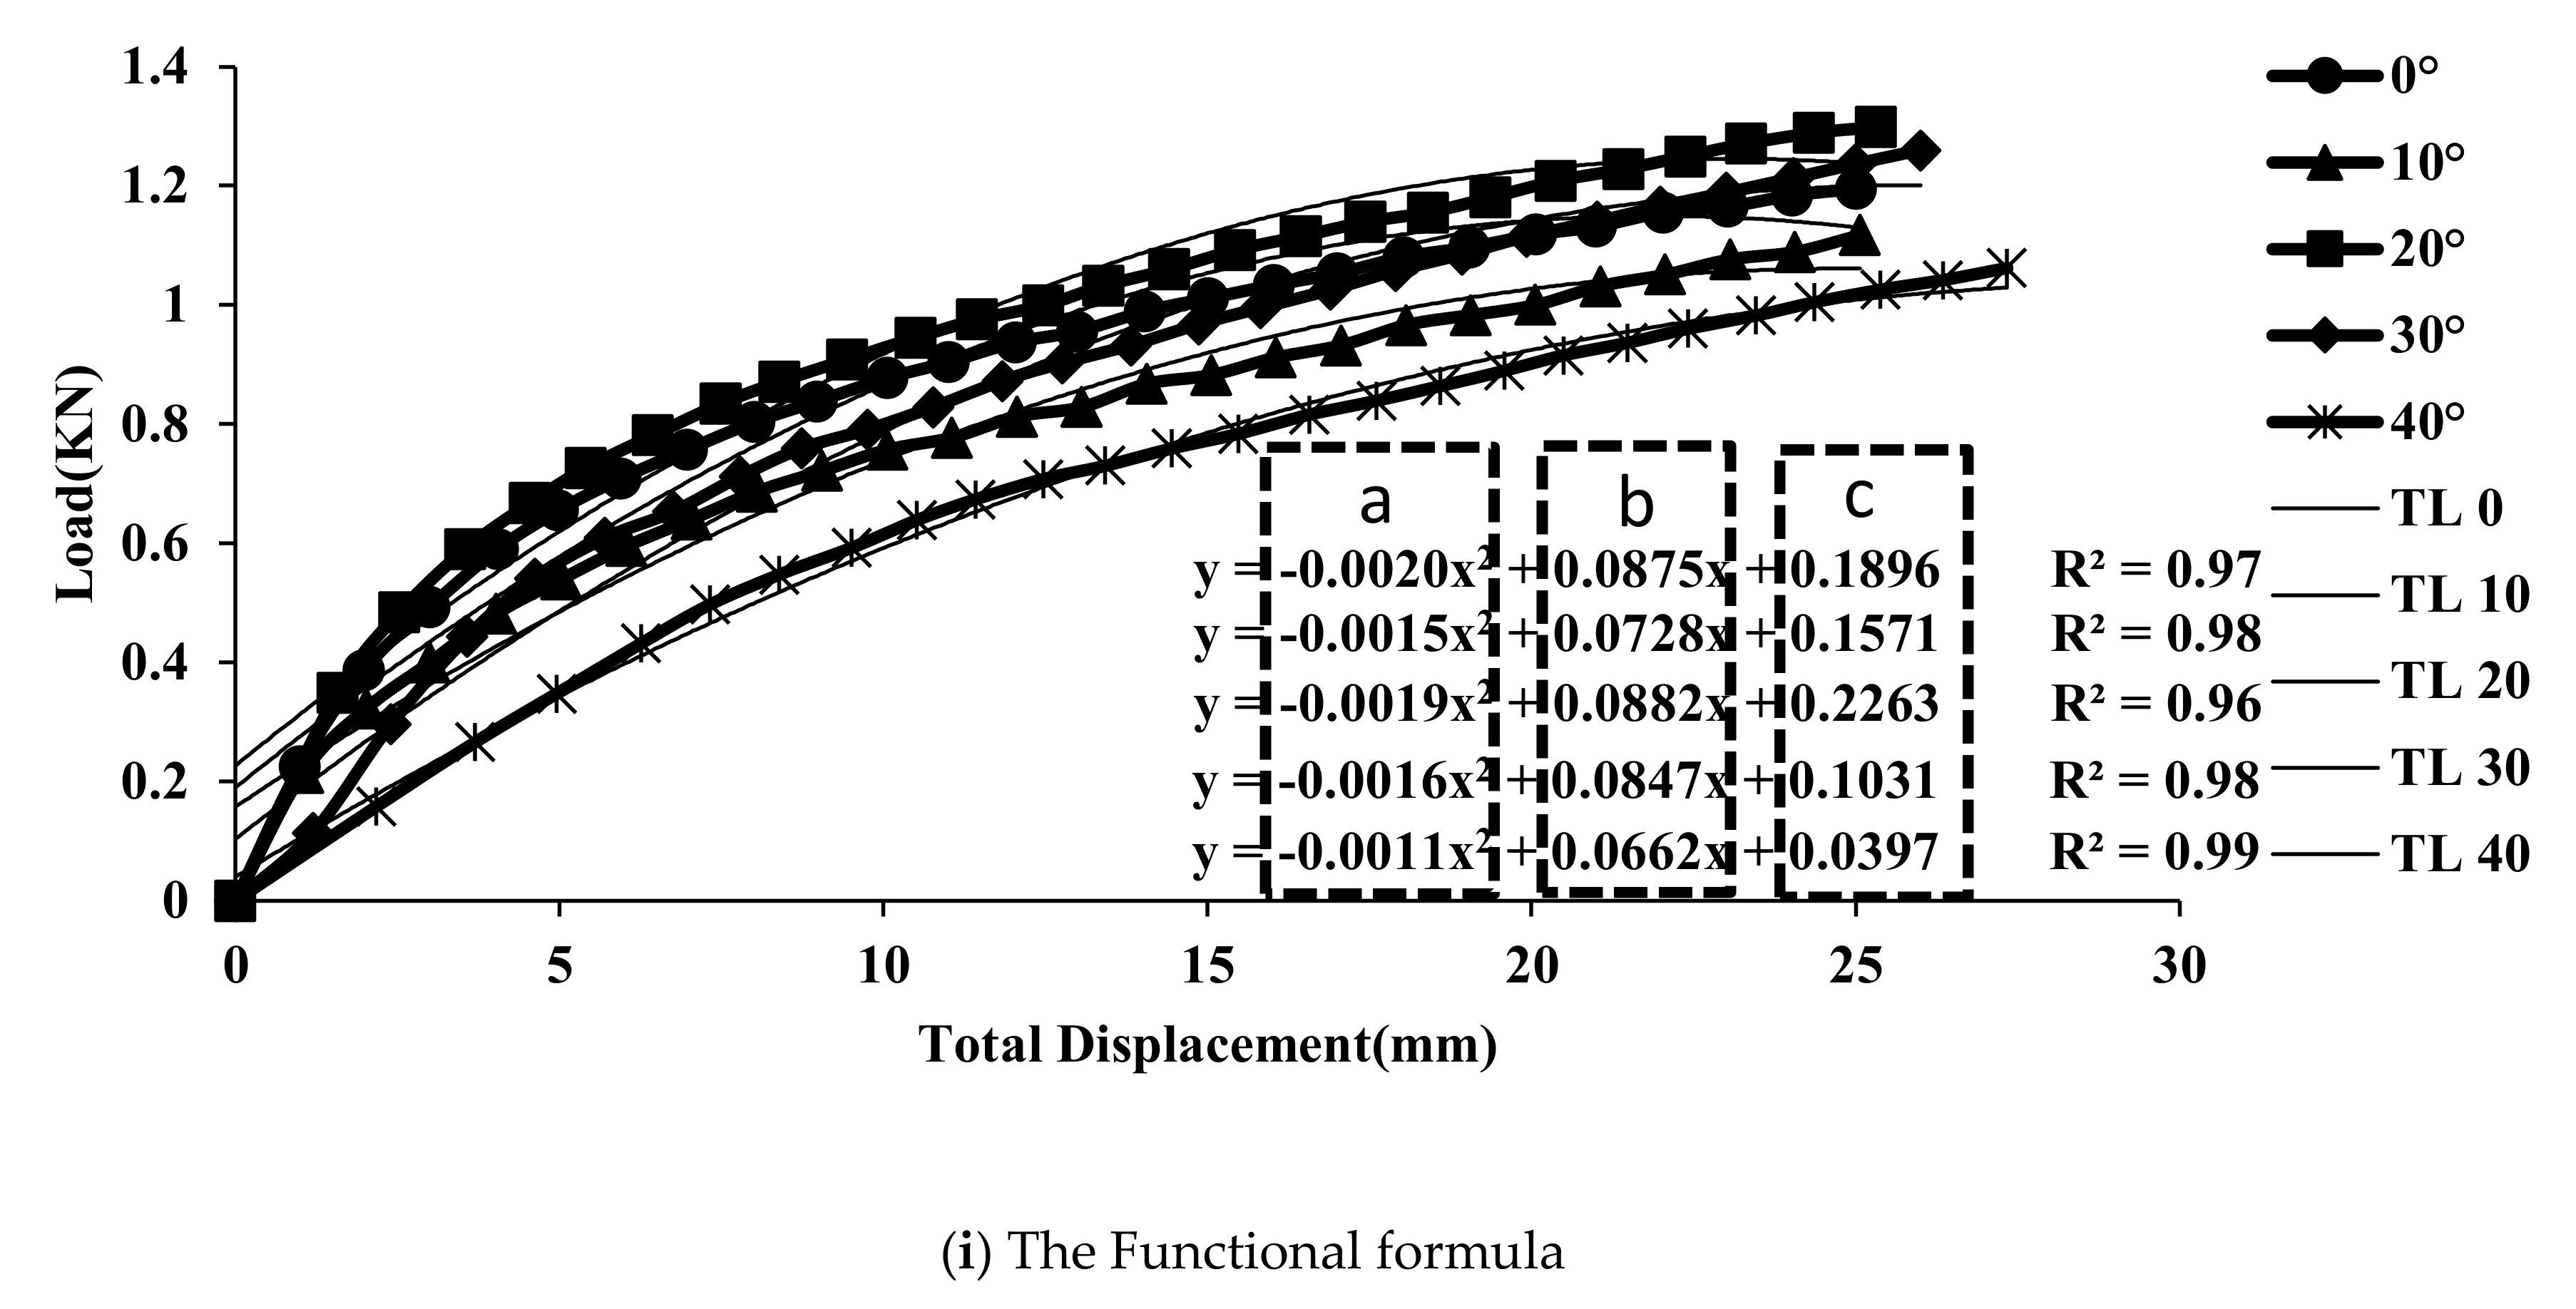
3.1.3. Proposal of an Experimental Formula for the Total Displacement and Vertical Load according to Relative Density
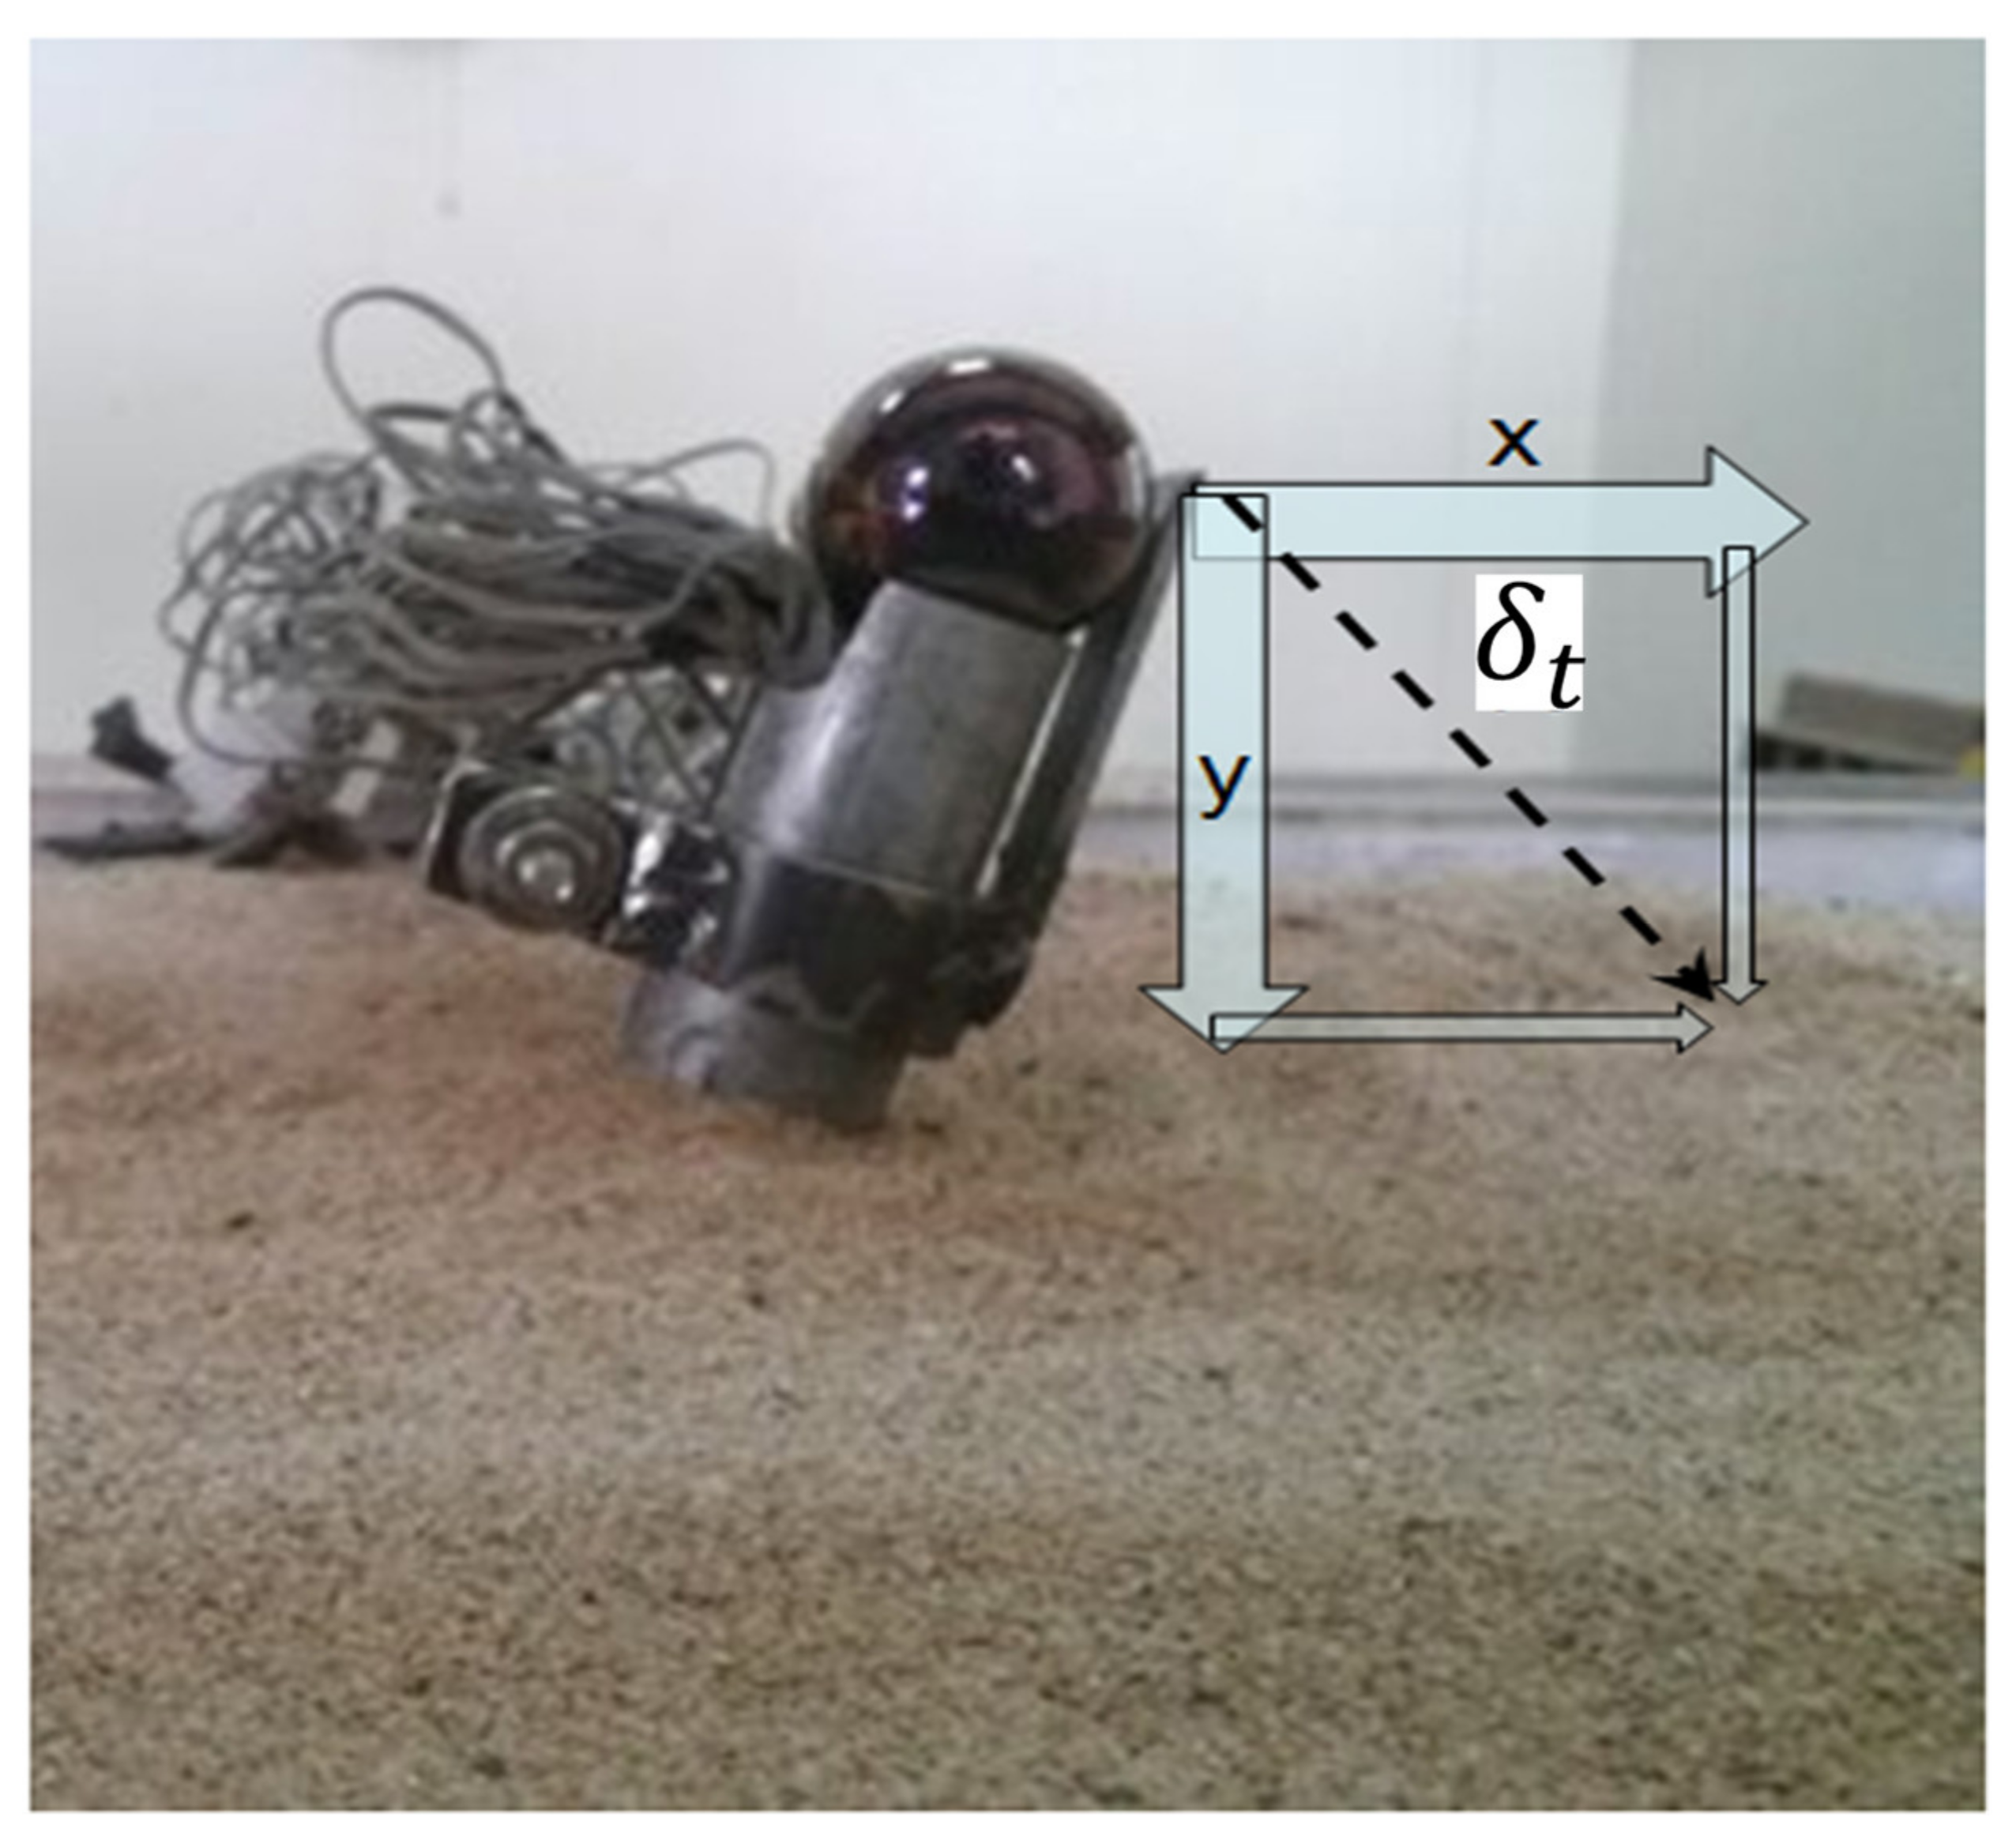
3.2. Relationship between Vertical Displacement of Pile Head and Moment
- ϵ: Compressive strain
- E, I: Bending rigidity of model pile
- d: Radius of model pile
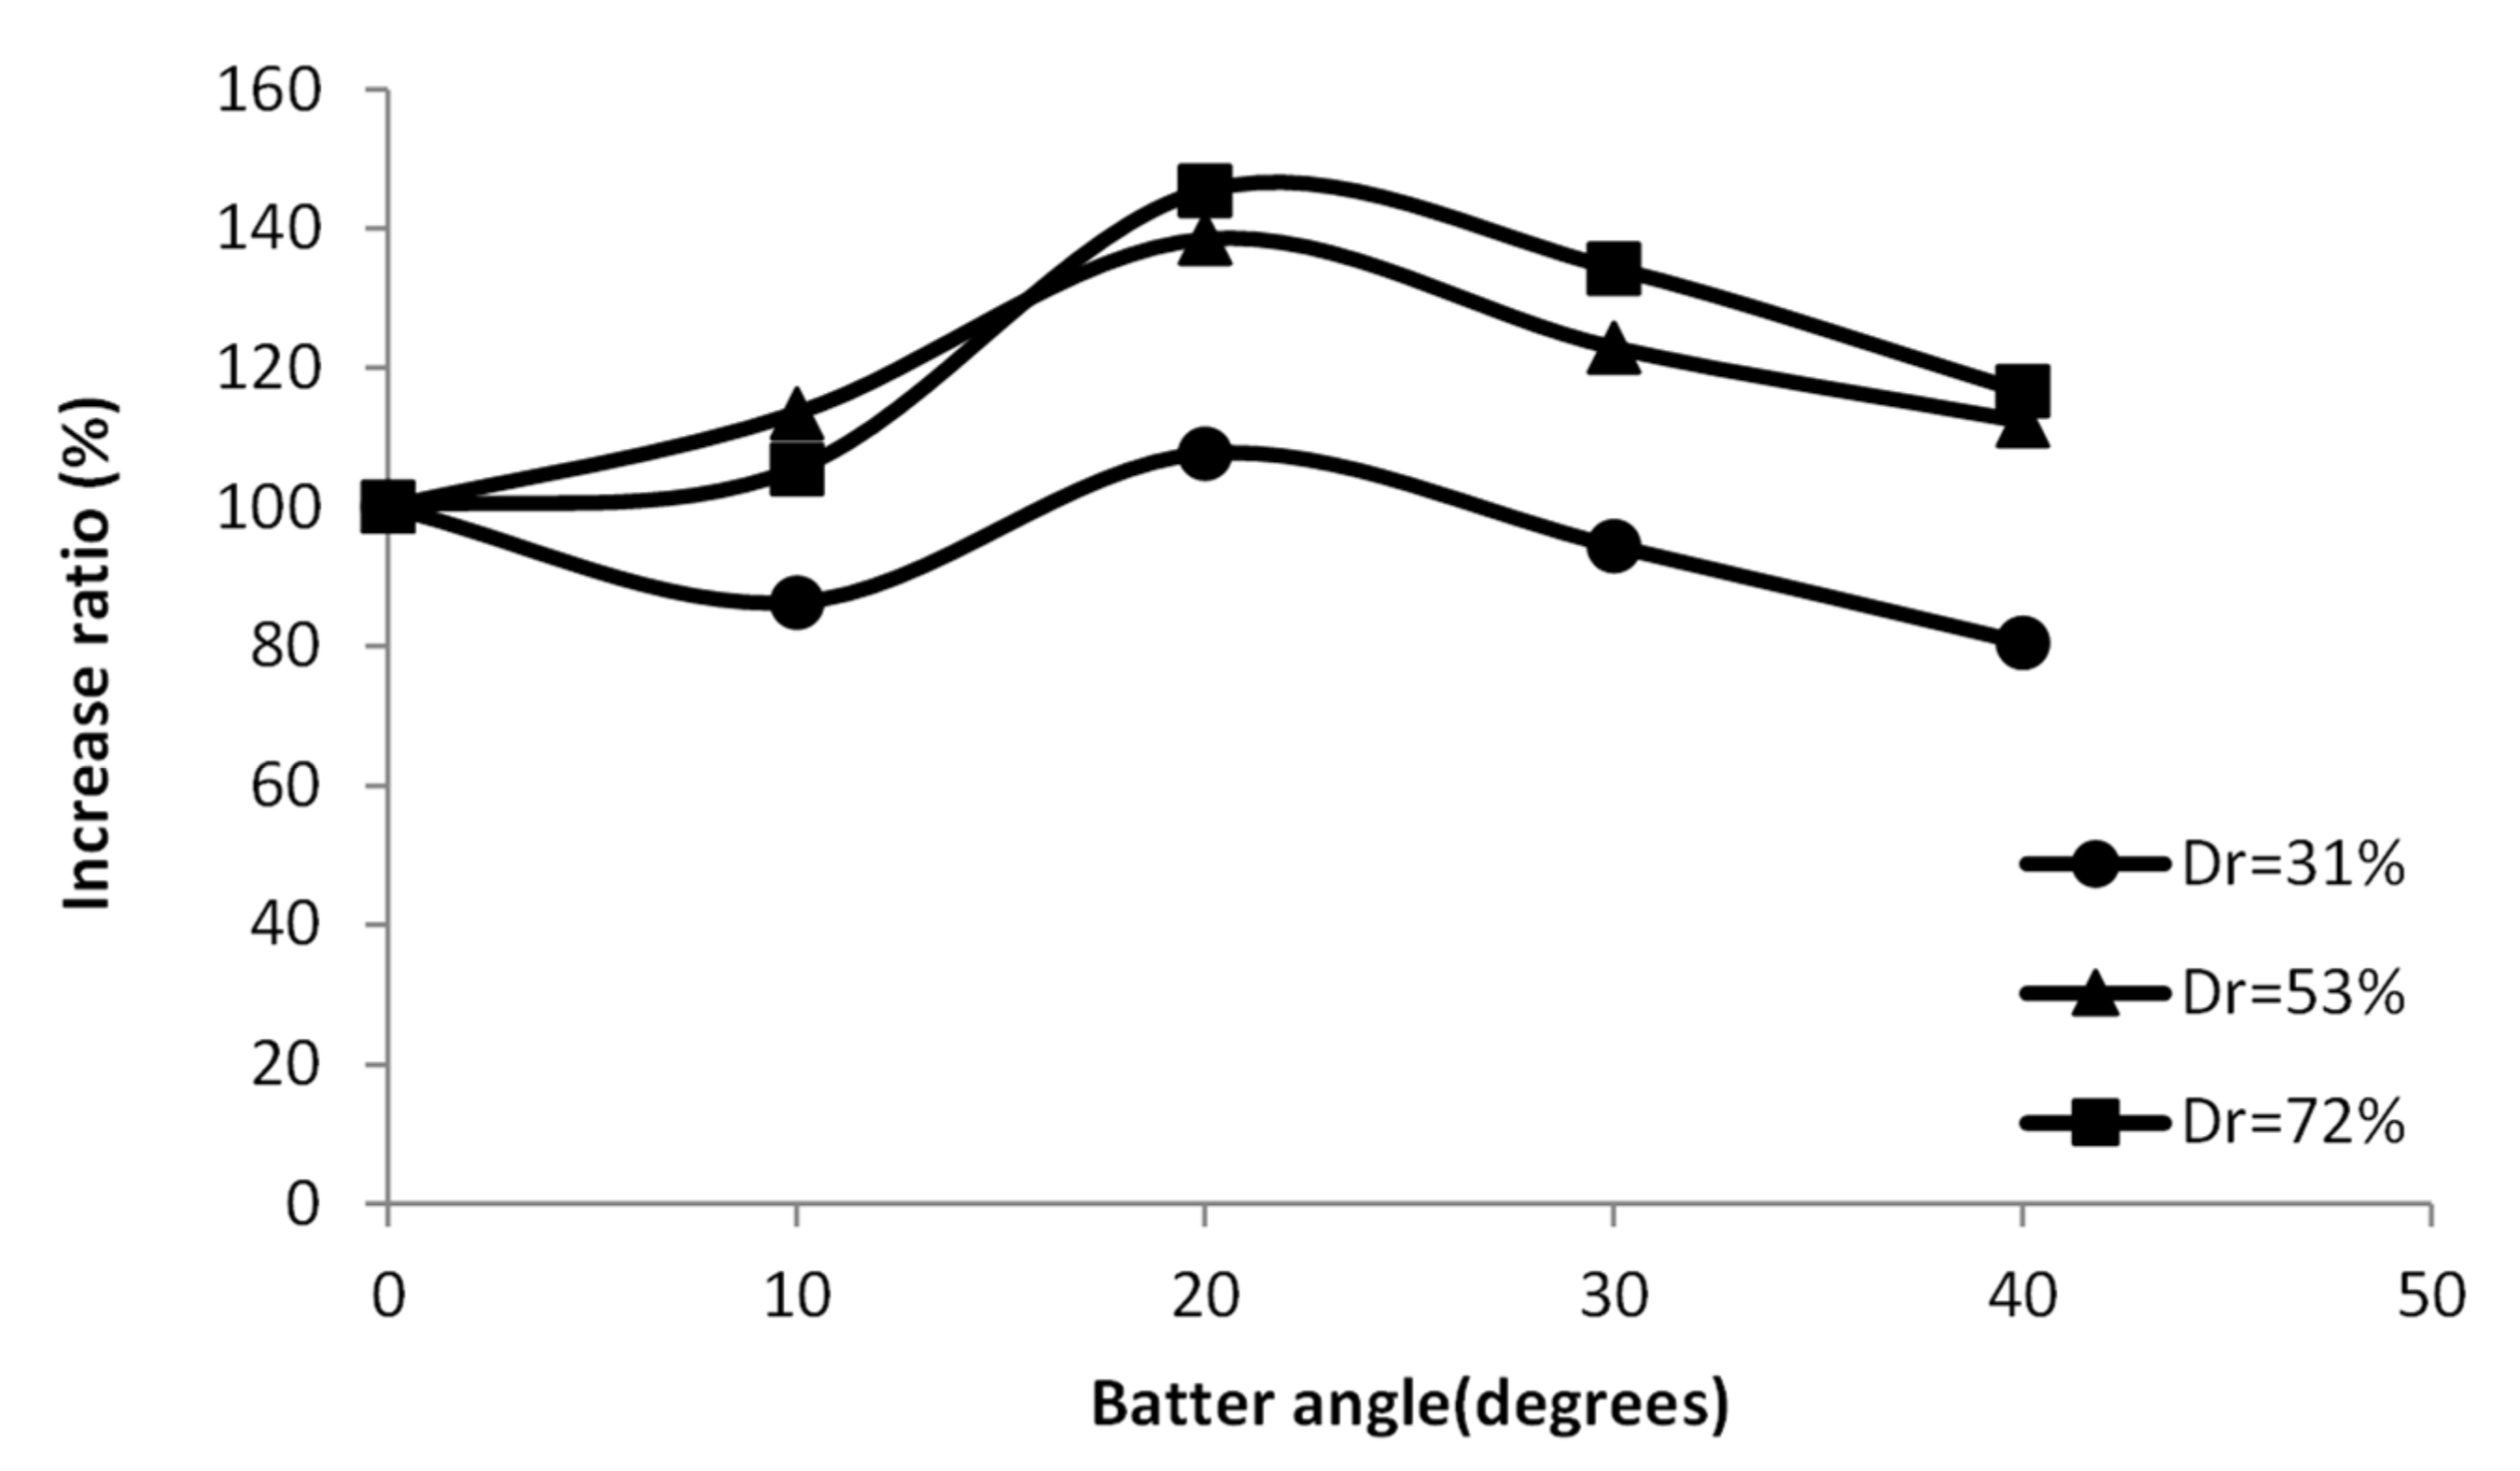
3.3. Changes in the Maximum Moment in Each Relative Density according to Pile Slope
3.4. Comparison with the Existing Researches
4. Conclusions
- When the relative density of the ground was medium (Dr = 53%) and high (Dr = 72%), the bearing capacity kept increasing when the angle of the pile moved from a vertical position (0°) to 20°, and then decreased gradually in a batter angle larger than 20°. In a ground with a low relative density (Dr = 31%), the bearing capacity was always less than the vertical pile except when the angle was 20°.
- The bending moment of the pile increased as the relative density of the ground and the batter angle of the pile increased. The position of the maximum bending moment came closer to the ground surface as the batter angle of the pile increased more, and it occurred at a point of 5.2~6.7 times the diameter (D) of the pile from the ground surface.
- As shown in Table 6, this study proposed an experimental formula to determine the bearing capacity using the batter angle of the pile in each relative density of the ground and the total displacement.
Author Contributions
Funding
Institutional Review Board Statement
Informed Consent Statement
Data Availability Statement
Conflicts of Interest
References
- Awad, A.; Petrasovits, G. Consideration on the Bearing Capacity of Vertical and Batter Piles Subjected to Forces Acting in Different Directions. In Proceedings of the 3rd Budapest Conferences on Soil Mechanics and Foundation Engineering, Budapest, Hungary, 15–18 October 1968. [Google Scholar]
- Meyerhof, G.G. Uplift Resistance of Inclined Anchors and piles. In Proceedings of the 8th International Conference on Soil Mechanics and Foundation Engineering, Moscow, Russia, 2–3 August 1972; pp. 162–172. [Google Scholar]
- Meyerhof, G.G.; Ranjan, G. The Bearing Capacity of Rigid Piles under Inclined Loads in Sand II: Batter Piles. Can. Geotech. J. 1973, 10, 71–85. [Google Scholar] [CrossRef]
- Hanna, A.; Nguyen, T.Q. Ultimate Skin Friction of Single Batter Piles in Sand. In Proceedings of the International Conference on Deep Foundations, Beijing, China, 1–5 September 1986; pp. 100–108. [Google Scholar]
- Afram, A. Uplift Capacity of Battered Pile in Sand. Master’s Thesis, Concordia University, Montreal, QC, Canada, 1984. [Google Scholar]
- Hanna, A.M.; Afram, A. Pull-Out Capacity of Single Batter Piles in Sand. Can. Geotech. J. 1986, 23, 387–392. [Google Scholar] [CrossRef]
- Das, B.M. Earth Anchores; Elesvier: New York, NY, USA, 1990; pp. 193–223. [Google Scholar]
- Bae, W.S. Pullout Behavior of Inclined Piles in Sand. Master’s Thesis, Chungbuk National University, Chungju, Korea, 1997. [Google Scholar]
- Zhang, L.; McVay, M.C.; Lai, P.W. Centrifuge Modelling of Laterally Loaded Single Battered Piles in Sands. Can. Geotech. J. 1999, 36, 1074–1084. [Google Scholar] [CrossRef]
- Kim, J.H. An Experimental Study on Bearing Capacity of Battered Pile. Master’s Thesis, Keimyung University, Daegu, Korea, 2001. [Google Scholar]
- Sung, I.C. A Study on the Vertical Bearing Capacity according to Inclination of the Better Piles Subjected to Vertical Load. Master’s Thesis, Kyungsung University, Pusan, Korea, 2002. [Google Scholar]
- Shakarchi, Y.J.A.; Fattah, M.Y.; Kashat, I.K. The Behaviour of Batter Piles under Uplift Loads. In Proceedings of the An International Conference on Geotechnical Engineering, Sharjah, United Arab Emirates, 3–6 October 2004. [Google Scholar]
- Manoppo, F.J. Behaviour of the Ultimate Bearing Capacity of Single Flexible Batter Pile under Horizontal Loads in Homo-Geneous Sand. Din. Teknik Sipil 2010, 10, 116–119. [Google Scholar]
- Nazir, A.; Nasr, A. Pullout Capacity of Batter Pile in Sand. J. Adv. Res. 2013, 4, 147–154. [Google Scholar] [CrossRef] [PubMed]
- Al-Neami, M.A.; Rahil, F.H.; Al-Bayati, K.S. Bearing Capacity of Batter Piles Embedded in Sandy Soil. Int. J. Geotech. Eng. 2016, 10, 529–532. [Google Scholar] [CrossRef]
- Iai, S. Similitude for Shaking Table Tests on Soil-Structure-Fluid Model in 1g Gravitational Field. Soils Found. 1989, 29, 105–118. [Google Scholar] [CrossRef]
- Rollins, K.M.; Peterson, K.T.; Weaver, T.J. Lateral Load Behavior of Full-Scale Pile Group in Clay. J. Geotech. Geoenviron. Eng. 1998, 124, 468–478. [Google Scholar] [CrossRef]


| Scale Factor, λ = 19.54 Ration of | Iai(1989) | Experiment | Reality |
|---|---|---|---|
| Vertical length | λ | 1 | 19.54 |
| Horizontal length | λ | 1 | 19.54 |
| Density | 1 | 1 | 1 |
| Stress and pressure | λ | 1 | 19.54 |
| Time | λ3/4 | 1 | 9.29 |
| Acceleration | 1 | 1 | 1 |
| Displacement | λ3/2 | 1 | 86.36 |
| Bending moment | λ3 | 1 | 7458.84 |
| Strain | λ1/2 | 1 | 4.42 |
| L (mm) | D (mm) | T (mm) | E (MN/cm2) | I (cm4) | EI (MN•cm2) |
|---|---|---|---|---|---|
| 940 | 28.6 | 1.27 | 12.25 | 1.020 | 12.50 |
| Property | Symbol | Value |
|---|---|---|
| Max. void ratio | emax | 0.79 |
| Min. void ratio | emin | 0.58 |
| Max. dry density | (kN/m3) | 15.78 |
| Min. dry density | (kN/m3) | 13.92 |
| Specific gravity | Gs | 2.54 |
| Average grain size | D50 | 0.59 |
| Effective grain size | D10 | 0.28 |
| Uniformity coefficient | Cu | 2.50 |
| Coefficient of gradation | Cc | 0.92 |
| Fineness modulus | F.M. | 2.59 |
| Vibrating Time (sec.) | Range of Values of Dr (%) | Avg. Dr (%) | Classification |
|---|---|---|---|
| 2 | 29.26~32.15 | 31 | Loose |
| 15 | 50.51~54.70 | 53 | Medium |
| 90 | 69.06~75.55 | 72 | Dense |
| Dr (%) | 31 | 53 | 72 |
|---|---|---|---|
| Batter angle (Degrees) | α = 0, 10, 20, 30, 40 | ||
| Pile head-deflection | 25 mm | ||
| Velocity | 1 mm/min. | ||
| Load limit | 1960 N | ||
| Relative Density | Experimental Formula (kN) |
|---|---|
| Low | Q = (0.00002α − 0.002)δt 2 − (0.0003α– 0.086)δt − (0.0035α − 0.2139) |
| Medium | Q = (0.00001α − 0.0019)δt 2 + (0.0002α + 0.0724)δt − (0.005α − 0.2917) |
| High | Q = (−0.00003α − 0.0034)δt 2 + (0.001α + 0.135)δt − (0.0076α − 0.3543) |
Publisher’s Note: MDPI stays neutral with regard to jurisdictional claims in published maps and institutional affiliations. |
© 2021 by the authors. Licensee MDPI, Basel, Switzerland. This article is an open access article distributed under the terms and conditions of the Creative Commons Attribution (CC BY) license (https://creativecommons.org/licenses/by/4.0/).
Share and Cite
Kim, J.; Yun, S.-K.; Kang, M.; Kang, G. Behavior Characteristics of Single Batter Pile under Vertical Load. Appl. Sci. 2021, 11, 4432. https://doi.org/10.3390/app11104432
Kim J, Yun S-K, Kang M, Kang G. Behavior Characteristics of Single Batter Pile under Vertical Load. Applied Sciences. 2021; 11(10):4432. https://doi.org/10.3390/app11104432
Chicago/Turabian StyleKim, Jiseong, Seong-Kyu Yun, Minsu Kang, and Gichun Kang. 2021. "Behavior Characteristics of Single Batter Pile under Vertical Load" Applied Sciences 11, no. 10: 4432. https://doi.org/10.3390/app11104432
APA StyleKim, J., Yun, S.-K., Kang, M., & Kang, G. (2021). Behavior Characteristics of Single Batter Pile under Vertical Load. Applied Sciences, 11(10), 4432. https://doi.org/10.3390/app11104432