Article

Chlorine Removal from U.S. Solid Waste Blends through Torrefaction

Department of Mechanical Engineering, Michigan Technological University, Houghton, MI 49931, USA
*
Author to whom correspondence should be addressed.
Appl. Sci. 2020, 10(9), 3337; https://doi.org/10.3390/app10093337
Submission received: 26 March 2020 / Revised: 2 May 2020 / Accepted: 6 May 2020 / Published: 11 May 2020
(This article belongs to the Special Issue Small Scale Energy from Waste and Biomass)

Abstract

:

Featured Application

This study provides a pathway to remove chlorine from the solid wastes, and to produce low-cost solid fuels with enhanced properties for power applications.

Abstract

The amount of solid waste generated annually is increasing around the world. Although the waste has a high calorific value, one major obstacle that may prevent it from becoming a feedstock for power applications is the existence of polyvinyl chloride (PVC), which causes corrosion and emission issues after combustion due to its high chlorine content. Torrefaction is known to release hydrochloric acid; thus, it has been applied in this study for the reduction of chlorine from potential waste feedstocks. Fiber-plastic (60–40%) waste blends, with different chlorine content levels, as well as PVC were used in the current study. Torrefaction was conducted at 400 °C. Chlorine and heat content were measured. Experimental results showed that organically bonded chlorine was reduced during torrefaction as a function of mass loss. The chlorine removal efficiency was only dependent on temperature and residence time, not chlorine level. The heat content of the sample increased with mass loss up to a maximum of ~34 MJ/kg at ~45% mass loss. It was also observed that at ~30% mass loss, the organic chlorine content per unit heat content reduced by ~90%, while the heat content was ~32 MJ/kg, and ~90% energy was retained.

1. Introduction

Solid waste generation is increasing across the world, and this trend is growing as the population grows [1]. Due to reasons like cost and poor quality of material, much of these wastes cannot be feasibly recycled and are instead landfilled [2]. For instance, the United States alone landfilled 139 million tons of municipal solid waste in the year 2017 [3]. The practice of landfilling is known to cause significant environmental damage and negative health impact [4,5]. Moreover, landfilling is economically destructive by wasting a precious, energy-intensive resource. Closely following population and economic growth, global energy demand is expected to increase by 48% from 2012 to 2040 [6], requiring investment into safe, low cost, and clean energy sources. Furthermore, in a highly competitive and increasingly regulated sector, existing coal power plants are facing more stringent regulations [7]. These issues can be reconciled by utilizing a thermal treatment process to convert solid waste into a low-cost and clean fuel source.
Torrefaction is a thermochemical treatment process with the purpose of improving the feedstock characteristics for later use in pyrolysis, gasification, or combustion. It has long been studied as a key to develop the use of woody biomass, a renewable energy source, to help replace fossil fuels [8]. Although the technology is well established, biomass has not yet taken off as a major energy source on the market, contributing to just 1.4% of U.S. energy production [9]. Among many obstructions to the commercialization of technology for biomass torrefaction [10], the prohibitive high cost is the most prominent [11,12].
Solid waste has been recently proposed as a feedstock for the torrefaction process to produce fuels for power applications [8]. It solves many of the challenges associated with woody biomass [10], but most importantly, the source is ubiquitous and readily available. With waste disposal tipping fees, the waste feedstock often has a negative price, helping the economic issues associated with biomass feedstocks.
Solid waste has already been considered as a feedstock for waste to energy (WTE) plants, and 12.7% of U.S. municipal solid waste (MSW) was combusted with energy recovery in the year 2017 [3]. A major reason this idea has failed to take hold is the poor properties of the untreated mixed solid wastes such as energy density, moisture content, and the high costs associated with the high chlorine in the flue gas treatment [10]. However, a simple torrefaction process of solid waste is being increasingly studied and shown to be an inexpensive and reliable method for improving the feedstock quality [13]. Additionally, using heat-treated MSW has been shown to be carbon-neutral due to the reduction in methane and CO2 emissions from landfills [14].
Xu et al., 2018 previously showed that torrefied solid waste has similar characteristics to the common Powder River Basin (PRB) coal and can be used to replace it in existing plants [10]. Using heat-treated solid waste in existing coal-fired plants, the full economic advantage of the available resources can be taken, while simultaneously curbing the use of heavily polluting coal and reducing the accumulation of waste. The same team also studied the characteristics of extruded wastes produced by the same feedstock, which addressed multiple properties including densification, grindability, water resistance, durability, heat content, and combustion behaviors [13].
A major hurdle solid waste faces as a potential solid fuel is the chlorine released from PVC waste during combustion. This chlorine is known to cause corrosion and emission issues [15]. Hatanaka et al., 2000 found that the higher the chlorine level of the waste, the more the emission of polychlorinated dibenzo-p-dioxins and dibenzofurans (PCDD/Fs) will be produced [16]. Vikelsoe et al., 1990 also studied the effect of PVC content on PCDD emissions during MSW combustion. The results showed that doubling the PVC content of MSW would increase PCDD emissions during combustion by 32% [17]. A study done by Tian and Ouyang, 2003 found that there existed MSW incinerators that emitted more dioxins than the national standard in China [18]. A later study done by Ni et al., 2009 showed that the dioxin emissions from the new-generation MSW incinerators met the national standard [19]. Cangialosi et al., 2007 carried out a case study of air pollutants for an MSW incineration plant in Italy [20]. The results showed that their PCDD/Fs emission levels had a rather small health impact on the surrounding population. However, they also indicated that the source of the waste and the technology used for the incineration would affect the final results. The EPA also has stringent guidelines for PCDD emissions, which require the risk factor to be lower than 10−6 (one occurrence per one million people) [21]. Since the source of solid waste is mostly unknown, it is essential to remove the chlorine to reduce the potential PCDD/Fs emission.
Chlorine removal from wastes has been studied extensively over the years. Takeshita et al., 2004 reported a method of hydrothermally treating PVC waste in subcritical and supercritical regions. They were able to decompose the PVC without producing any harmful chlorinated organics. However, the behavior of chlorine removal from mixed waste was still lacking since this study focused on just PVC waste. Inoue et al., 2008 carried out a mechano-chemical method of de-chlorination by co-grinding the PVC with various metal oxides using a planetary ball mill. The ground product was dispersed in water to extract the inorganic chlorine compounds, and the release of chlorine was found to increase as the grinding time and additive ration increased. However, the PVC used in this study was in powder form and therefore does not apply to existing PVC waste [22].
Indrawan et al., 2011 introduced a hydrothermal process to produce chlorine-free solid fuels from MSW. This process used saturated steam at ~200 °C with a pressure of 2 MPa on a one-ton batch feedstock, and they were able to produce chlorine-free solid fuels. However, the product additionally required water washing to remove the inorganic chlorine produced during the hydrothermal treatment. For sufficient chlorine removal, the weight ratio of water used to MSW cleaned was 3:1 [23].
Xu et al., 2018 investigated the method of chlorine removal from solid waste in the previous study [10]; however, it was done at 300 °C, which required relatively long residence times of torrefaction involved with high-shear mixing with water. In the recent study, Xu et al., 2020 studied the mechanism and kinetics of the de-chlorination of pure PVC [24]. They investigated the products of torrefaction and proposed a comprehensive mechanism of PVC degradation at 300 °C, which provided insight into the process of PVC de-chlorination.
To improve solid waste feedstock quality, this study more closely investigates the issue of chlorine as a contaminant in potential feedstocks. As it is known that waste as a feedstock contains a variety of components that may widely affect the initial chlorine levels, it is essential to study PVC chlorine removal at different chlorine levels in order to apply this method to other types of wastes compositions.
The present paper deals with two aspects: (1) determination of appropriate torrefaction process parameters that can maximize the retained energy and minimize the chlorine levels; (2) the effect of different chlorine levels of material on the PVC de-chlorination behavior.

2. Materials and Methods

2.1. Materials

Convergen Energy, LLC (CE) supplied the mixed solid waste used in this study, which was shredded to a 75–125 mm size. Both the “low chlorine” (LC) and “high chlorine” (HC) materials used were blends of 40% plastic and 60% fiber waste, with a chlorine content of ~1100 ppm and 16,000 ppm, respectively. The properties of these materials have been well documented over the past seven years and have been shown to be consistent [10]. Both types contained a variety of mixed materials, including non-recyclable plastic and paper flakes, cartons, cardboard, laminated papers, fibers, and different types of plastics. The major difference between the two types of material was the increase in the chlorine concentration for the HC material, due to the higher content of PVC. Throughout this study, it was observed that the HC material contained approximately 15 times the concentration of chlorine as the LC material.
To improve the grindability of the sample, the materials were placed in a Lindberg/Blue BF51828C-1 muffle furnace at 300 °C for 2 min in ~100 g batches. Two of these 100 g “reference” samples were made for both LC and HC materials. The mass losses of the samples from this process were negligible. The material became more brittle after the process and was ground in a Col-Int Tech CIT-FW-800 High-Speed Rotor Mill/Grinder (Columbia International, Irmo, SC, USA) for 1–2 min to decrease the particle size and increase the homogeneity for further testing.
Even with the well-ground 100 g reference samples, some heterogeneity was observed. It was found that the error could be reduced significantly by taking ~4 g samples for each test, mixing them well, and testing 1 g of that 4 g sample as a reference to compare to any tests from the remaining 3 g sample. This method was employed for most of the tests, but due to the inherent heterogeneity of the mixed waste, variability in the results still existed.
The PVC used in Section 3.3 for the comparison with results of solid waste was procured from Shintech Inc. with Grade SE-950 and density = 1400 kg/m3.

2.2. Torrefaction

For each torrefaction test, a 203 mm long, 9.5 mm outer diameter (OD), and 0.25 mm wall thickness stainless-steel tube reactor was assembled with insulation separating the material from the bottom of the sealed cap. A stainless-steel tube with the same diameter was connected to the reactor to guide the produced gaseous to an induced draft (ID) fan. The torrefaction experimental setup was identical to the one used in the previous study [24]. Before each test, the reactor’s mass was taken on an A&D EJ-410 scale (readability of 0.01 g) to get a value for m1 from Equation (1). The reactor was then filled with 1.3–1.4 g of material from a well-mixed 4 g sample of one of the 100 g CE batches and weighed again for m2.
The reactor filled with tested material was attached to a long pipe inserted into a ventilation system to remove any gas produced by the torrefaction process. The pipe and reactor were then lowered into the furnace (Lindberg/Blue type BF51828C-1 Muffle Furnace, Cole-Parmer, Vernon Hills, IL, USA) and held for a set time, ranging from 1 to 75 min. The furnace was kept at 400 °C for every test in this study to increase the reaction rate and reduce the residence time. The same practice was also done for a few PVC torrefaction experiments at 400 °C.
After the set time, the reactor was immediately removed from the furnace and quenched in a container of water to rapidly cool down the temperature of the reactor. To ensure no water entered the reactor pipe, metal seals were placed on each end. This water was completely dried off with a paper towel before any mass measurements were taken. After the reactor was fully dried, the mass of all the constituents was taken to obtain m 3 . The total mass loss was calculated according to Equation (3),
M L ( t ) = m 2 m 3 ( t ) m 2 m 1 .
where m 1 . is the reactor vessel mass, m 2 . is the reactor mass with the test material, and m 3 ( t ) is the reactor mass with test material after torrefaction. After measuring the mass loss, the sample would be removed for further testing.

2.3. Characterization

2.3.1. Moisture Content

The moisture contents of HC and LC materials were tested before the experiments. For each test, one-gram samples were tested in the HFT 1000 Moisture Analyzer by Data Support Co. Inc. The moisture analyzer worked by heating the material to 120 °C and continuously weighing the material placed inside the analyzer until the sample weight stabilized. The moisture content was calculated by measuring the percent change of the total weight. The moisture contents for the LC and HC material were measured to be 3.4% and 3.1%, respectively. To avoid moisture buildup, the sample was kept in a SHEL LAB SMO28-2 Forced Air Oven (Sheldon Manufacturing. Inc, Cornelius, OR, USA) before drying it at 80 °C at all times after being taken out of the furnace.

2.3.2. Heat Content

The heat content of all samples was measured with a Parr-6100 bomb calorimeter. A small metal crucible was filled with 0.5–1 g of material for each test. The test material was weighed in the crucible on an A&D HR-60 scale. This crucible was then placed inside the calorimeter’s bomb, and a cotton thread was used to help the ignition of the sample. Five milliliters of 2% Na2CO3 were added to capture any HCl released for later chlorine testing. The bomb was then sealed and injected with 400 psi compressed oxygen to permit complete combustion. The bomb was submerged in a 2000 g bath of distilled water, and the calorimeter calculated the sample heat content based on the temperature increase of the water after the test sample was ignited. The error caused by the extra 2% Na2CO3 in the bomb (5 mL) was neglected since it was insignificant compared to the total water (2000 mL) in the bucket.

2.3.3. Chlorine Content

Chloride concentration was measured using a chloride ion-selective electrode with the Oakton Ion 700 Cl-meter, calibrated using 1, 10, and 100 ppm dilutions from a 1000 ppm Cl- standard solution. For this study, all chlorine originated from the solid phase, and the sample to be measured was prepared in accordance with ASTM standard D4208-18. After the combustion was complete, the bomb was opened, and the pressure was then released at a steady rate, taking at least 2 min to avoid disturbing the contents. After the bomb was opened, all interior parts were washed thoroughly with distilled water and collected in a 140 mL beaker for testing. The total volume of liquid was kept between 80 and 90 mL. Liquid mass was next taken on an A&D EK-15KL scale (readability of 0.1 g). Finally, prior to measuring the chlorine content, two milliliters of 5M NaNO3 ionic strength adjustor (ISA) were added to the solution.
The Oakton Cl-meter determined the chloride concentration by measuring electric potential across a liquid and converting it to a concentration value in ppm. During measurements, a magnetic stirrer was used to keep the solution homogeneous, and ambient temperature was maintained for each test. Since the aqueous chloride concentration provided by the measurement was given with respect to the mass, the chlorine concentration of the original solid could be calculated according to Equation (3),
C C l ,   s a m p l e = C C l ,   a q M a q M s a m p l e .
where C C l ,   s a m p l e . and C C l ,   a q are the chlorine/chloride concentrations in ppm of the material sample and aqueous solution, respectively. M s a m p l e . and M a q . are the respective masses of the material sample and aqueous solution.

3. Results and Discussion
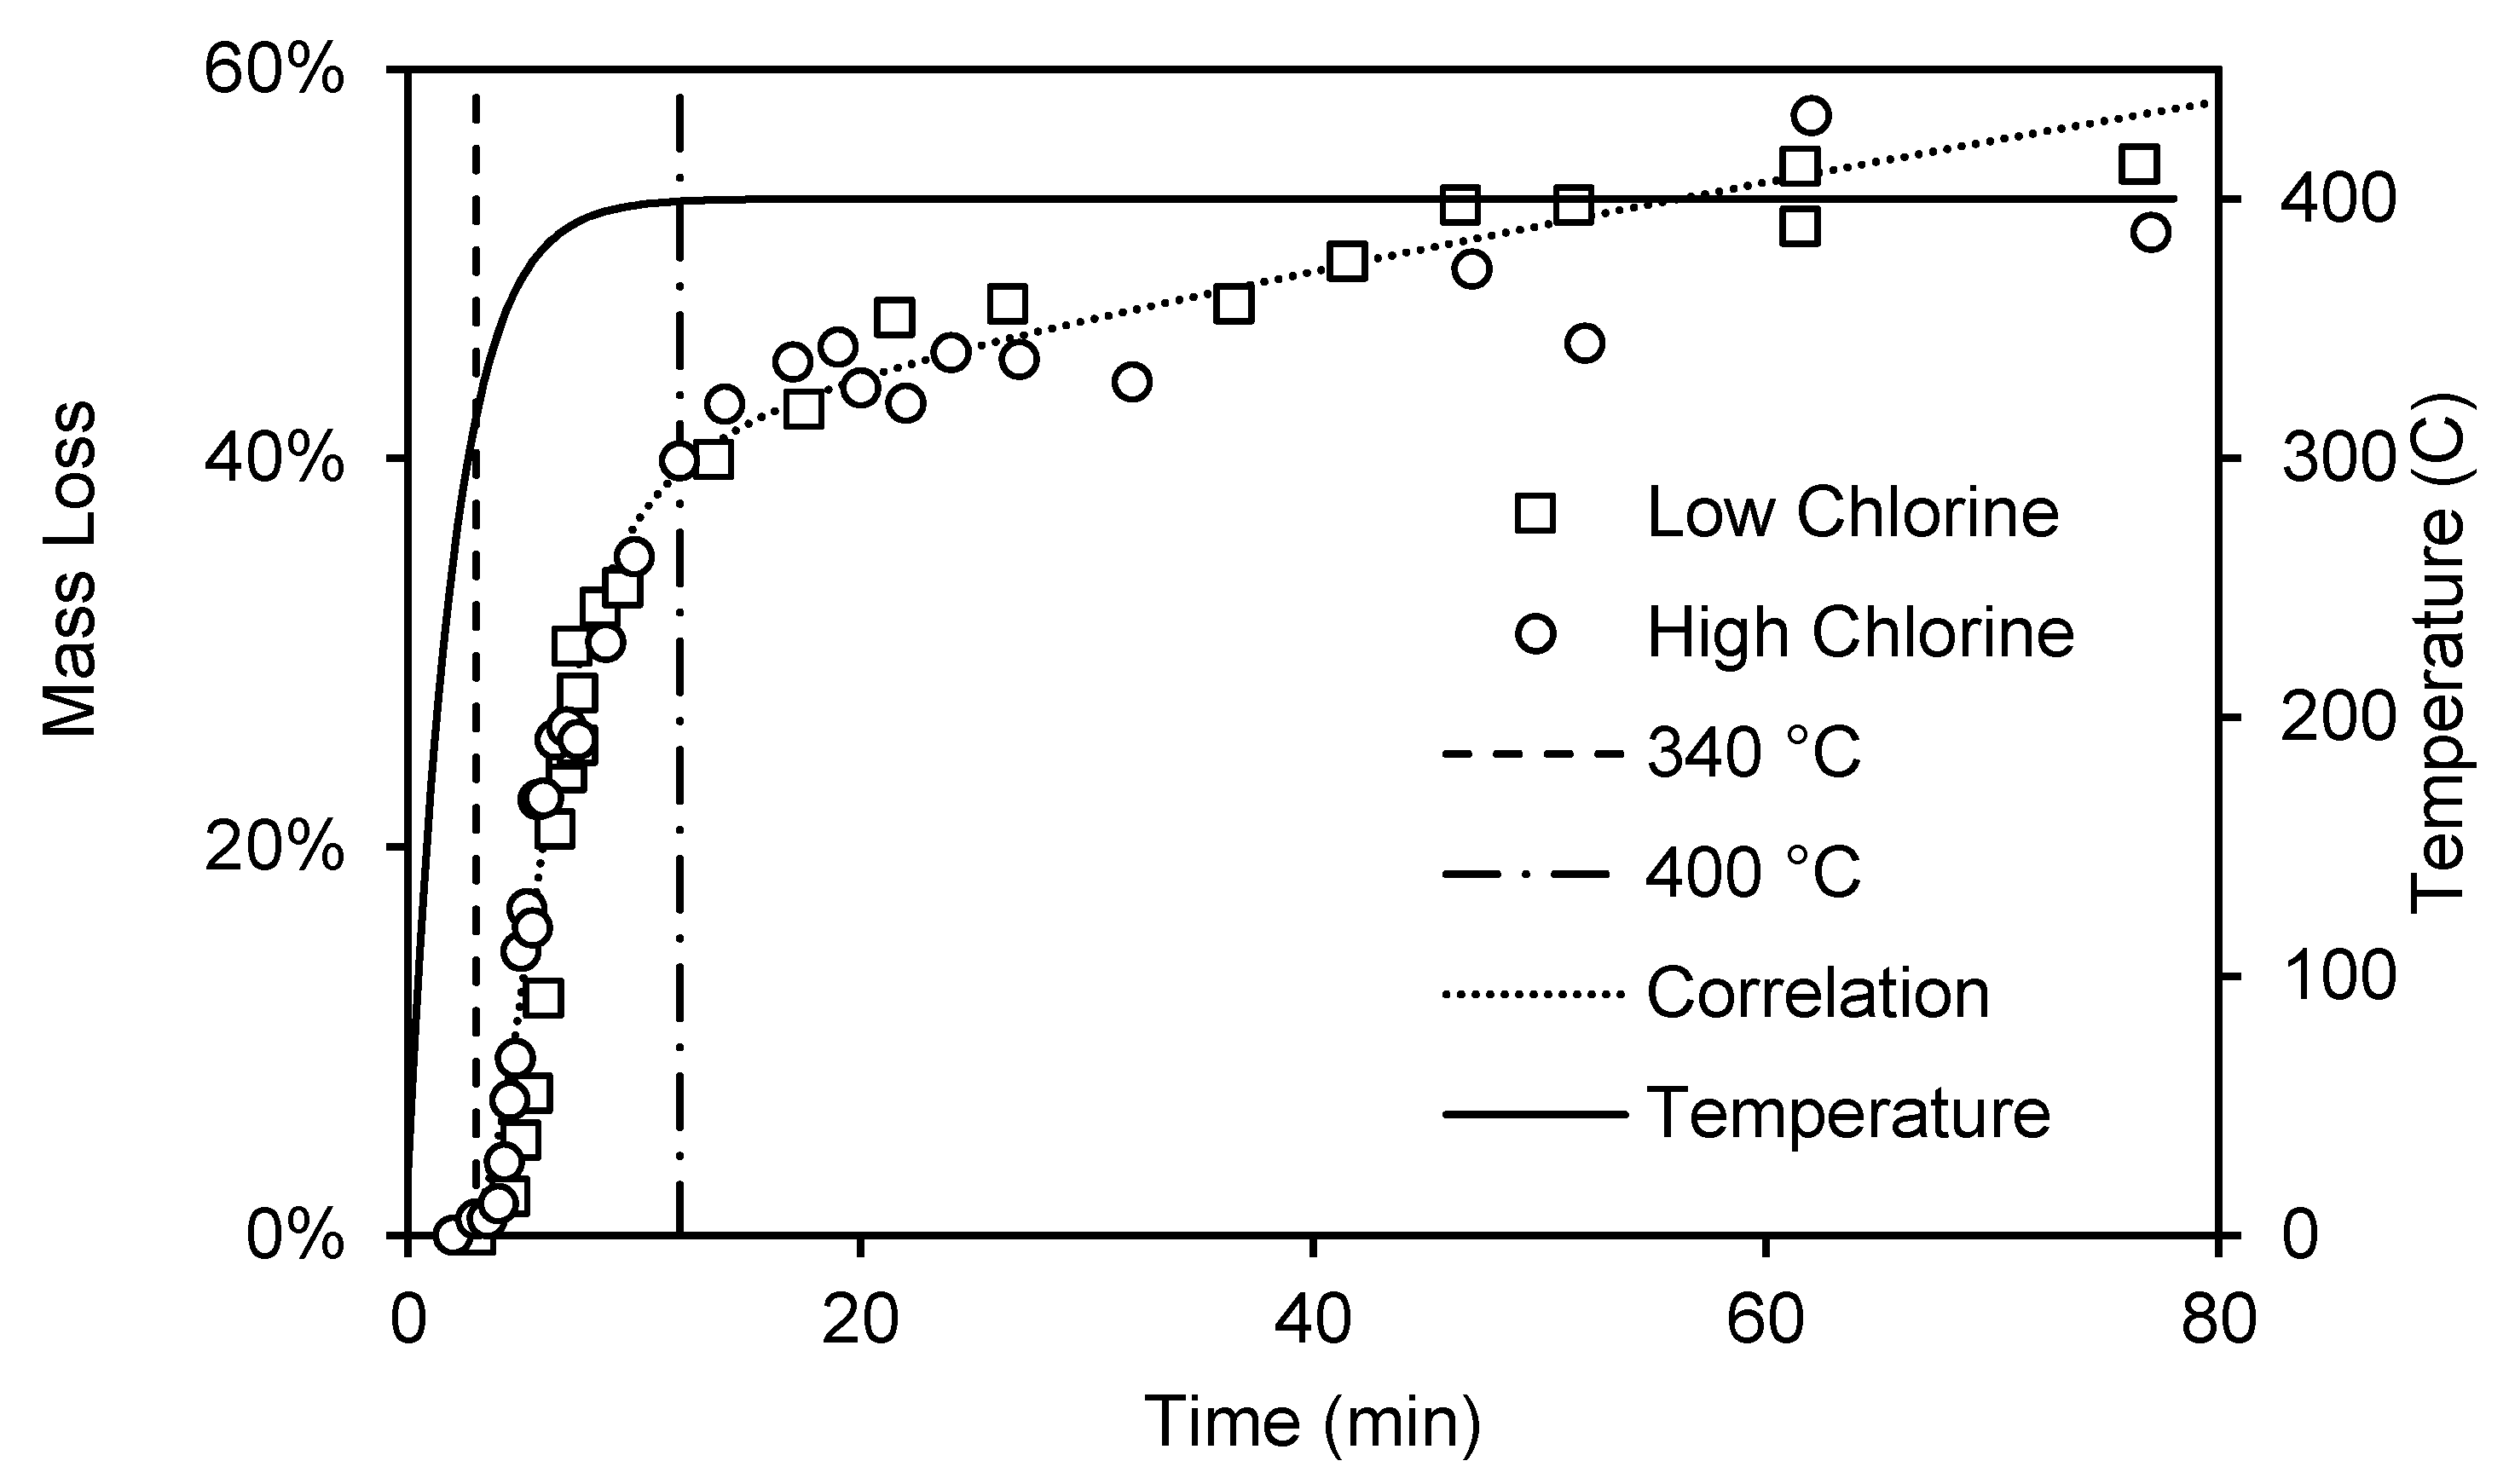
3.1. Torrefaction

As mentioned, all the experiments were carried out by placing the tubular reactor in the muffle furnace set at 400 °C. In order to determine the heat transfer regime of the system behavior, the Biot number (Bi), which relates to the heating regime of the material, and the thermal Thiele modulus (M), relating to the propagation of the reaction within the sample, were determined as:
B i = h λ / L c .
M = R λ / ( c p L c 2 ) .
The parameters are summarized in Table 1 below.
Note that the thermal conductivity for stainless-steel was significantly greater than the value for the CE material [28]. Furthermore, the diameter of the reactor was significantly smaller compared to the size of the furnace chamber; thus, the influence of the stainless-steel tube on the heat convection from the furnace wall to the sample surface was neglected. The Bi and M for this experimental setup were obtained for the CE material. Since Bi equaled 0.15, which was smaller than one, this indicated that the samples were thermally thin, and the heat conduction into the sample was much faster than the heat convection from the furnace wall to the sample surface. For M equal to 0.009, it indicated that the reaction rate was much smaller than the heat conduction into the sample. Therefore, the reaction rate was governed by the heat convection from the furnace to the sample surface, after which the temperature of the particle became uniform instantly.
The analysis of the same experimental setup was done by Xu et al., 2020, and the temperature of the sample particle could be defined as:
T w T ( t ) T w T o = e t / τ
where Tw, To, and τ represent the furnace wall temperature, the initial temperature of the sample, and the characteristic time, respectively [24]. τ can be defined as:
τ = m c p h A .
For this specific experiment setup, the characteristic time was calculated to be 120.3 s. The waste consisted of both fiber and plastics, and the previous study showed that fiber and plastic behaved differently during the torrefaction [13]. In order to obtain a preliminary correlation to study the behavior of the torrefaction behavior of this waste material, we assumed two first-order reactions. This is a rather common assumption in biomass and plastic torrefaction, which represented the degradation of fiber and plastic during the torrefaction experiment [29,30,31]. A similar correlation was developed and implemented successfully by Xu et al., 2018 [10]. The correlation between mass loss and time was represented by the following equation:
α = 1 ( a 1 A 1 e T a 1 T ( t ) + a 2 A 2 e T a 2 T ( t ) )
where α, a, A*, and Ta are the mass loss, scalar for fiber and plastic, pre-exponential factor, and characteristic time, respectively. The values of the parameters were determined by fitting Equation (6) to the experimental results, and the results are shown in Table 2.
With the model developed above, the temperature transient, as well as the mass loss were plotted as a function of time as shown in Figure 1. The dotted line indicates the correlation between the mass loss of the material and time. The two vertical dashed lines represent the time when the sample reached 340 °C and 400 °C, respectively. It indicated that the mass loss started at ~340 °C and increased to ~30% at 400 °C after ~12 min. The mass loss later gradually increased and reached ~55% after 60 min. According to Zinchik et al., 2020, a relatively fast increase in the mass loss at an early stage could mainly be attributed to the decomposition of the fibers, while the later slow increase in mass loss could mainly be attributed to the torrefaction of the plastics [13]. The results showed that the mass loss behavior as a function of time was similar for both LC and HC materials. However, this mass loss behavior was unique to this material blend (40% plastic and 60% fiber).

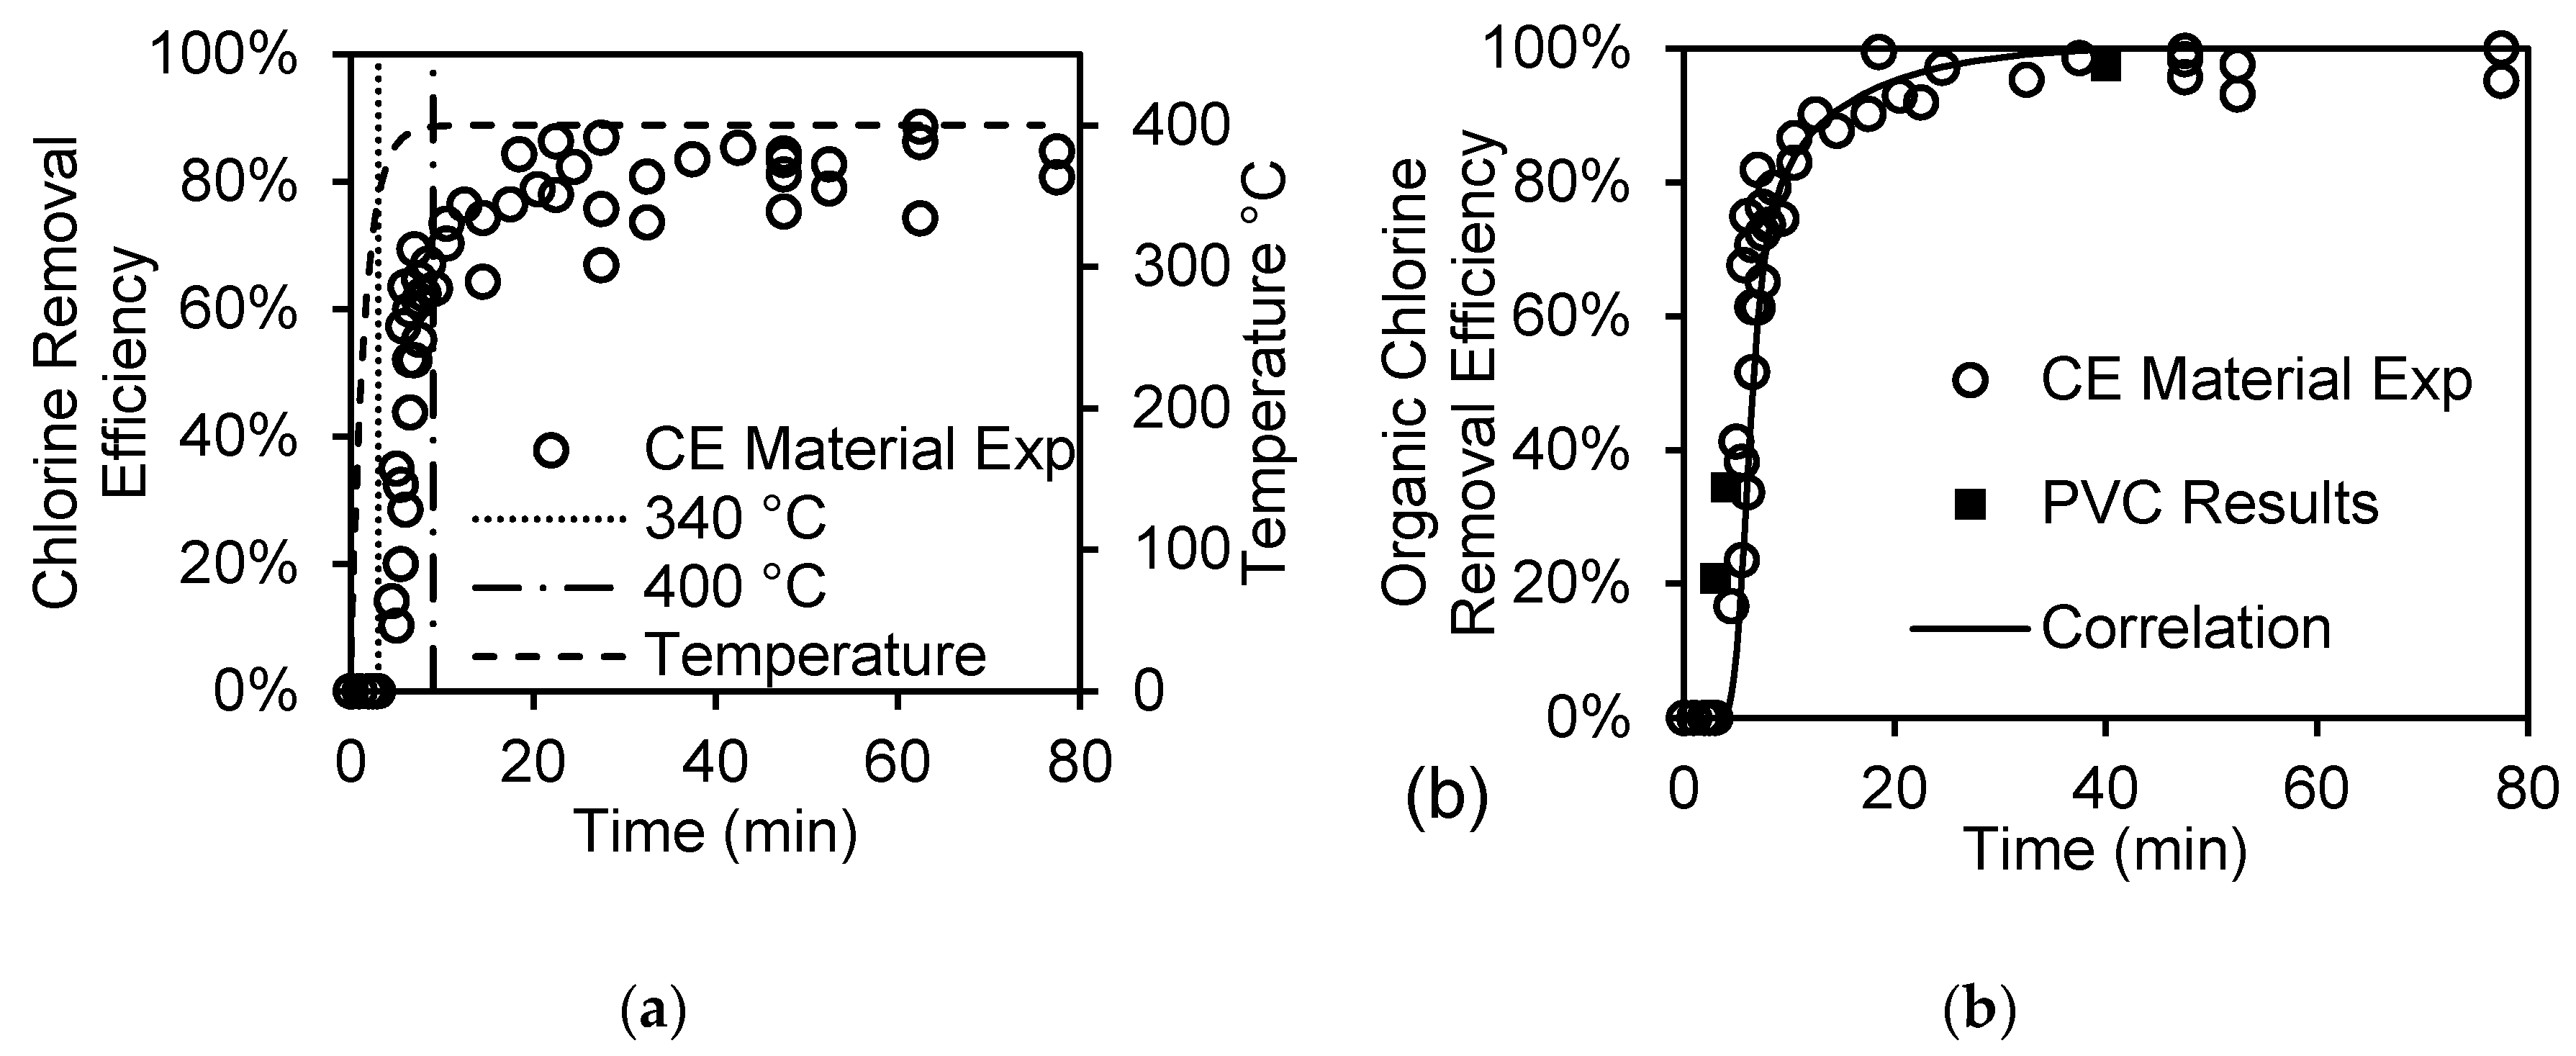
3.2. Chlorine Content

Chlorine content is one of the major considerations for the use of wastes as a feedstock for energy production. In this study, the chlorine content of the waste at different extents of torrefaction was measured, and the results are shown below in Figure 2a. The term “CE material” represents both LC and HC materials since they have similar behavior for chlorine removal efficiency. The release of chlorine started at ~340 °C, which also aligned with the findings of the mass loss behavior in Section 3.1 since the PVC would release chlorine in the form of hydrochloric acid (HCl) during the torrefaction process [32]. The results showed chlorine reaching an asymptotic value at ~80% removal efficiency after 20 min of torrefaction at 400 °C.
The previous study showed that the chlorine removal efficiency through torrefaction of PVC would increase as the residence time increased, eventually reaching 100% [24]. However, we noticed that the chlorine removal efficiency of the waste material did not reach 100%, which contradicted the previous results if PVC were the only source of chlorine in the waste.
Since the chlorine removal efficiency reached an asymptotic value of ~80%, it indicated that all the chlorine from PVC was removed, while the remaining 20% was from an unknown source. The organic chlorine reduction efficiency of CE material through torrefaction was calculated by normalizing the results to its peak value and denoted as organic chlorine removal efficiency. The de-chlorination reaction of chlorine from PVC was assumed to be the first-order reaction, and the organic chlorine removal efficiency was determined by the following equation:
α = 1 A 3 e T a 3 T ( t ) .
where A 3 = 1.11 × 10⁹ and T a 3 = 1.51 × 10⁴. The results are shown in Figure 2b, denoted as correlation. To compare the chlorine removal behavior of PVC to the solid waste, torrefied PVC samples at 400 °C with different times were also characterized. Figure 2b also presents the results of organic chlorine removal efficiency from waste and from PVC vs. time, showing that the chlorine release from PVC was not affected by the composition difference. This indicated that chlorine removal from PVC and waste materials, containing PVC, during torrefaction depended on temperature and residence time, not on the waste composition. It also showed that the chlorine removal behavior was independent of the initial chlorine levels and that removal of chlorine was not affected by the presence of other waste components in the surrounding during the process.
It was also essential to identify the sources of the remaining 20% of chlorine. Ma et al., 2010 studied the existence of inorganic chlorine in the waste that was found to release in the temperature range of 700 °C to 1000 °C using a thermal treatment. According to Lu et al., 2018, alkali chlorides (salt, e.g., KCl, NaCl) were the main sources of the inorganic chlorine in the waste [33]. The method of measuring the chlorine content in the current study was by analyzing the HCl in gaseous form after the combustion of the sample with the combustion temperature of the waste over 850 °C [34]. Therefore, based on the temperature range indicated, it could be hypothesized that the remaining chlorine from the CE material originated from inorganic sources, as this chlorine did not release during torrefaction at 400 °C. To prove this hypothesis, we used the method by Donepudi, 2017, who showed that inorganic compounds containing chlorine were very brittle and therefore could be well pulverized in order to be separated through sifting [35]. Therefore, we took a sample of the waste, pulverized it in a high-shear grinder (24,000 rpm with stainless-steel blades), and sifted it using various mesh screens. Preliminary results showed that sifting with a 425-micron sized screen could remove the inorganic chlorine. However, a more comprehensive study is needed to have conclusive results on the removal of inorganic chlorine by sifting.

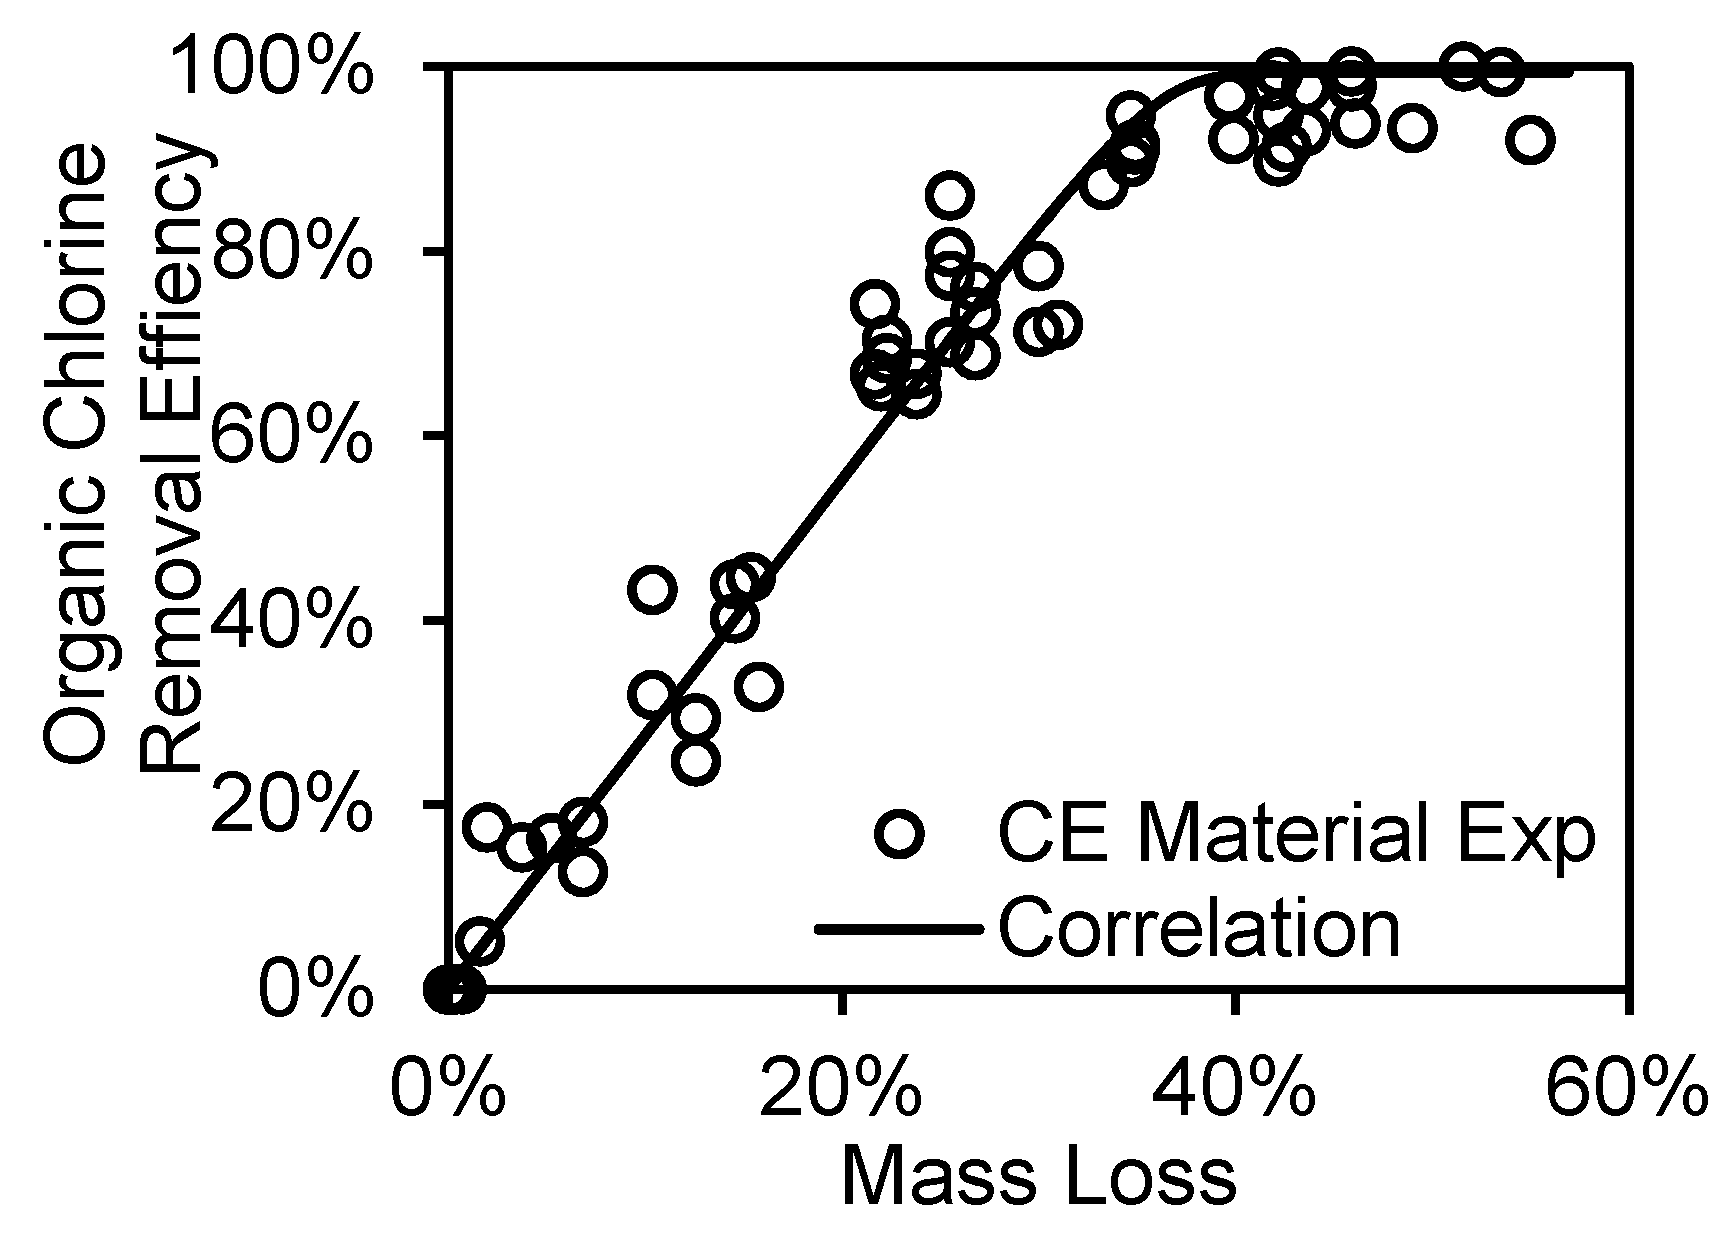
3.3. Correlation between Chlorine Removal and Mass Loss

To study the correlation between chlorine removal and the mass loss, the results of the organic chlorine removal efficiency were plotted using the correlation developed above. Figure 3 shows that the efficiency increased as the mass loss increased, and all the chlorine from PVC was released after the mass loss reached ~40%. The behavior in Figure 3 was unique to the specific waste blend, i.e., the chlorine removal efficiency vs. mass loss would depend on the waste composition. As noted above, chlorine removal depended only on temperature and residence time. However, for a given blend, the results of Figure 3 were useful as they provided a predictive behavior that could be used for design considerations.

3.4. Heat Content

Figure 4 shows the heat content of the sample at different mass losses. It demonstrates that the LC and HC samples had similar behavior with the extent of torrefaction. Although there existed some scatters in the results (due to the heterogeneous nature of the sample), it indicates a trend that heat content of both LC and HC samples increased due to the release of volatiles as the mass loss increased, reaching a maximum of ~34 MJ/kg at ~45% mass loss. After 45% mass loss, the heat content started decreasing as the mass loss increased, due to the formation of fixed carbon, and it reached ~32 MJ/kg at ~58% mass loss. As compared to PRB coal with a heat content of ~17 to 19 MJ/kg [36], these numbers were rather encouraging. In order to help further study the behavior of the effect on the heat content of the material, the experimental results were fitted mathematically as shown in Figure 4. It is essential to note that Figure 4 is only applicable to this specific blend of material since different compositions will have different heat content. If we were to produce chlorine-free solid fuels, predicting the heat content of such a fuel is essential. After all the organic chlorine was removed, the remaining inorganic chlorine (salts) could potentially be removed through a mechanical process (pulverizing and sifting). Since the calorific value of inorganic chlorine is negligible and the mechanical processes did not affect the calorific value of other materials in the waste, we could assume that the heat content of fully dechlorinated waste was comparable to the one after all the organic chlorine was removed.
Since the torrefaction process releases volatiles, which also contain some energy, it is essential to understand the energy retained at the different extents of torrefaction compared to the initial amount. Figure 5 shows the normalized retained energy vs. mass loss, which indicated that the energy retained for both LC and HC samples had similar behavior with the extent of torrefaction. The retained energy decreased as the mass loss increased to a final value of ~50% of retained energy at ~58% mass loss.

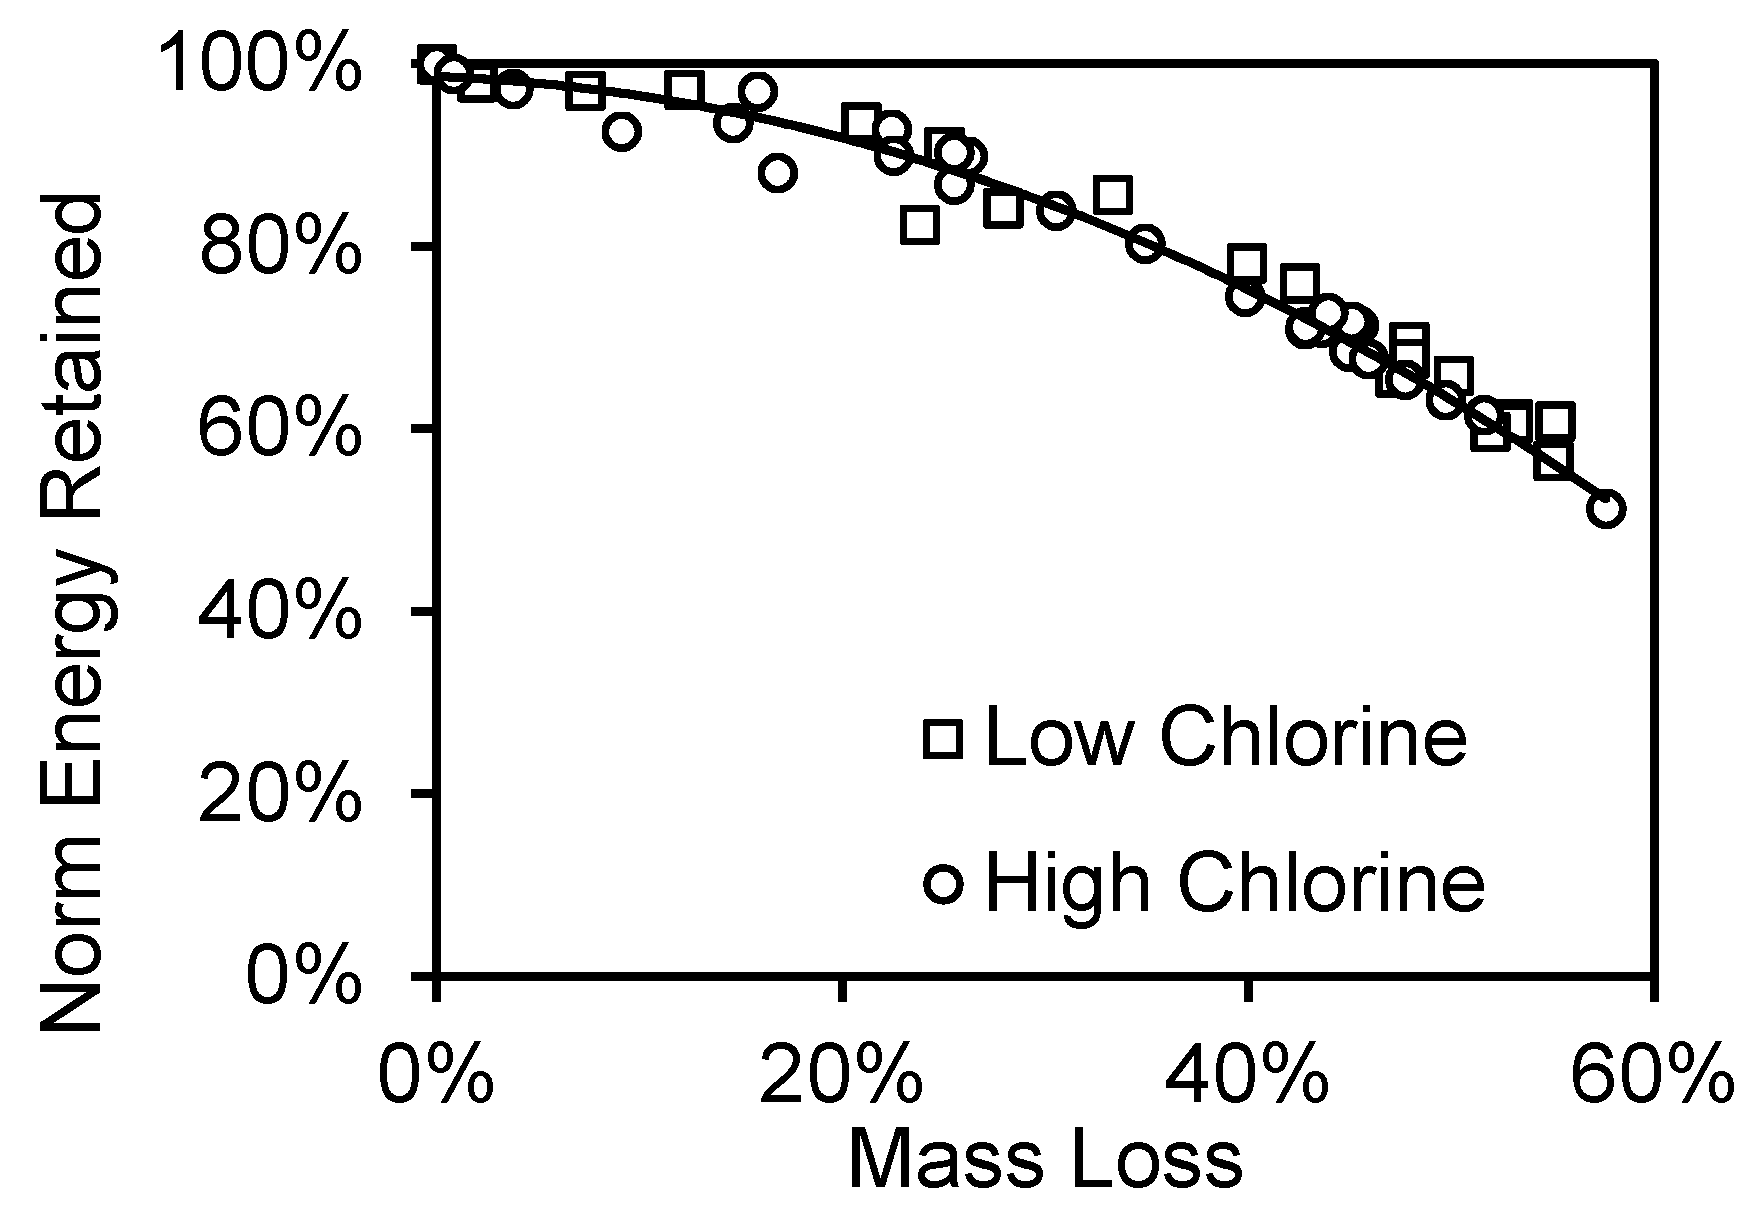
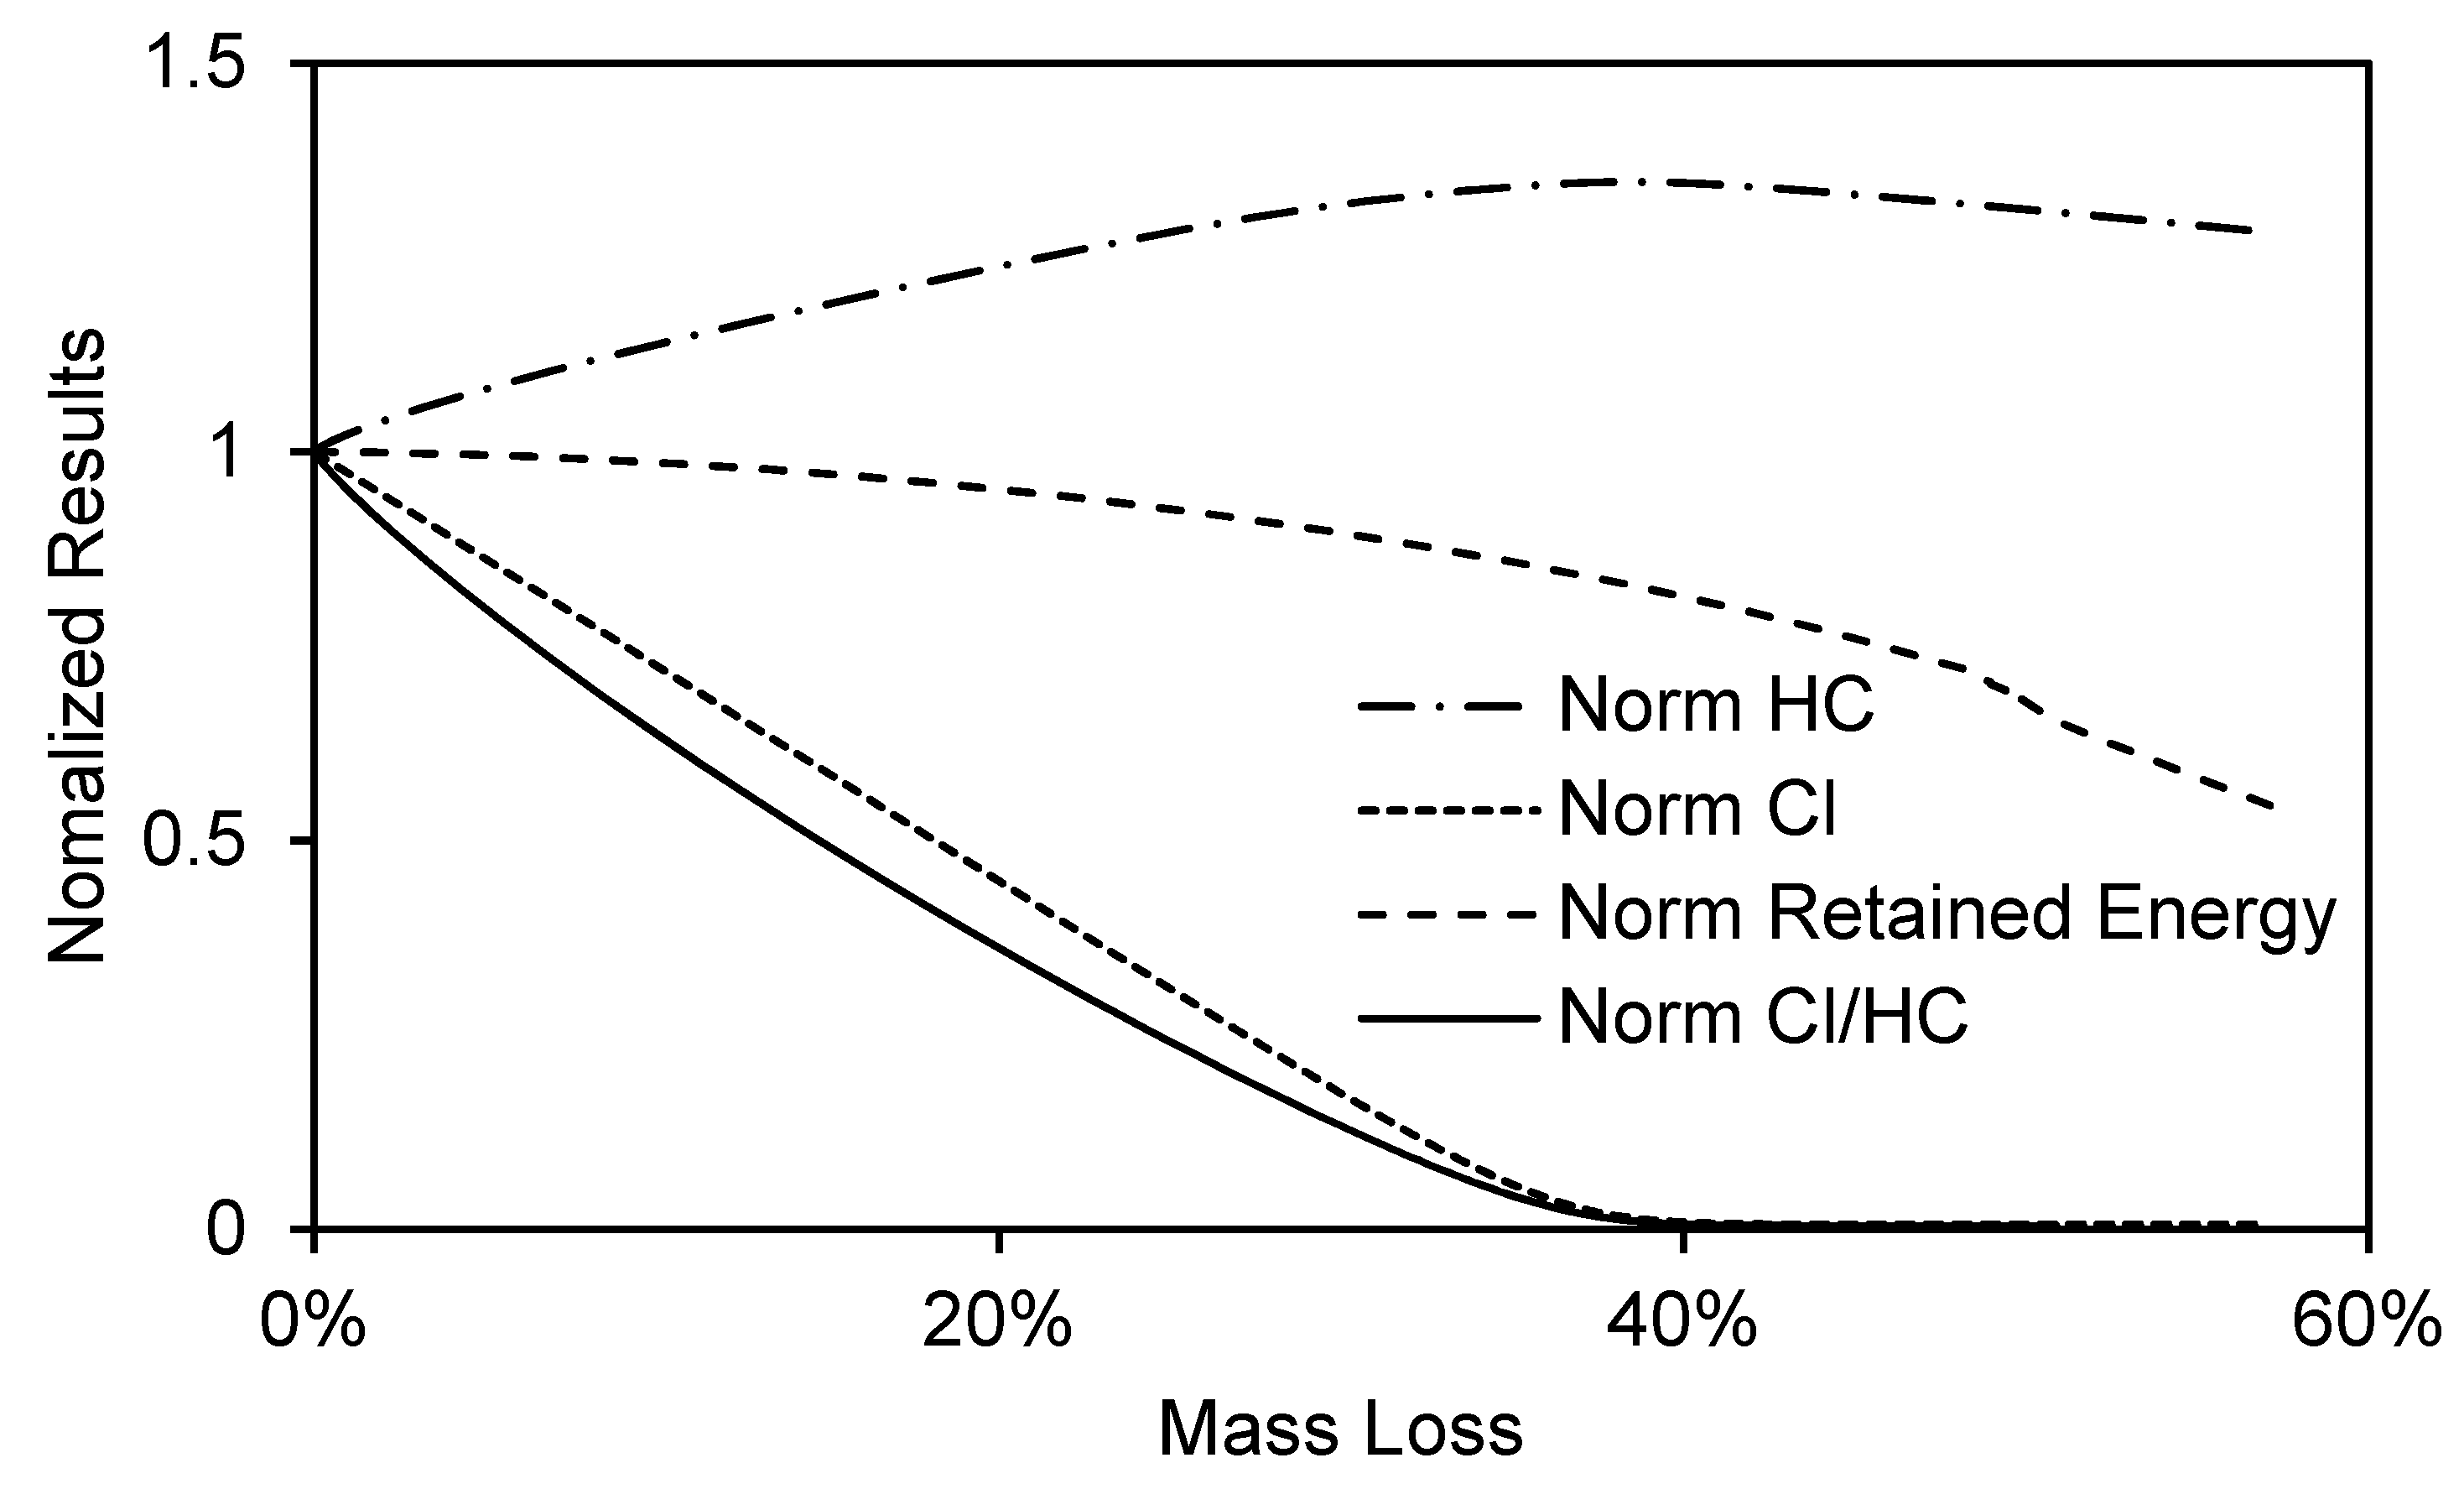
3.5. Chlorine Removal per Unit Energy

In order to further study the relationship between the chlorine content and energy content, several normalized properties (normalized according to their initial values) were calculated from the developed correlations above. The normalized properties included: (i) heat content (Norm HC), (ii) organic chlorine content (Norm Cl), (iii) retained energy (Norm retained energy), and (iv) organic chlorine per unit heat content (Norm Cl/HC), and they are plotted in Figure 6. It indicates that as the mass loss increased, the organic chlorine per unit heat content reduced faster compared to the chlorine content. This suggested that we would need less residence time if we considered reducing the chlorine emission levels from the Cl/HC point of view. For instance, at ~30% mass loss, the organic chlorine content per unit heat content reduced ~90%, while the heat content was ~32 MJ/kg, and ~90% energy was retained. This could help to predict the properties and optimize the process parameters for treating this type of waste blend.

4. Summary and Conclusions

In the present study, two types of fiber and plastic waste blends with a ratio of 60:40, including LC and HC material, were torrefied at 400 °C with different residence times. It was found that although these two types contained different chlorine contents, the torrefaction behaviors were comparable, and their heat contents and chlorine removal efficiencies were also similarly correlated to torrefaction. The mass losses both started at ~340 °C and reached ~55% after 60 min. The mass losses increased relatively faster at the early stage, which could be mainly attributed to the decomposition of the fiber, while a slower increase at a later stage was mainly due to the torrefaction of the plastics. The heat content of the CE material was found to increase as the mass loss increased due to the release of volatiles. It reached a peak value (~34 MJ/kg) at ~45% mass loss and gradually decreased as mass loss increased due to the formation of fixed carbon. However, the behaviors of mass loss and heat content only applied to this specific type of material. The chlorine removal efficiency increased as mass loss increased, reaching an asymptotic value of ~80% after ~20 min at ~ 40% mass loss, while the remaining 20% of chlorine could be attributed to inorganic sources (mainly alkali chlorides such as KCl and NaCl). The results indicated that the behavior of organic chlorine removal efficiency over time from PVC at 400 °C was universal regardless of its composition. It was also observed that the chlorine content per unit heat content reduced as the mass loss increased, and the lowest value was obtained at ~40% mass loss. However, if we considered reaching high chlorine removal efficiency while avoiding losing too much energy, it was found that at ~30% mass loss, the organic chlorine content per unit heat content reduced by ~90%, while the heat content was ~32 MJ/kg, and ~90% energy was retained.

Author Contributions

Methodology, Z.X., and J.W.A.; formal analysis, Z.X., and J.W.A.; writing, original draft, Z.X., and J.W.A.; writing, review and editing, S.S.K. and S.Z.; conceptualization and supervision, E.B.-Z. All authors have read and agreed to the published version of the manuscript.

Funding

This research was funded by Michigan Translational Research & Commercialization (MTRAC) program by the State of Michigan 21st Century Jobs Fund received through the Michigan Strategic Fund and administered by the Michigan Economic Development Corporation, grant number RC109248.

Acknowledgments

This research was supported under the Michigan Translational Research & Commercialization (MTRAC) Program by the State of Michigan 21st Century Jobs Fund received through the Michigan Strategic Fund and administered by the Michigan Economic Development Corporation, Grant Number RC109248.

Conflicts of Interest

The authors declare no conflict of interest.

References

  1. Hoornweg, D.; Bhada-Tata, P. What a Waste: A Global Review of Solid Waste Management; World Bank Group: Washington, DC, USA, 2012; Volume 15, p. 8. [Google Scholar]
  2. Subramanian, P.M. Plastics recycling and waste management in the US. Resour. Conserv. Recycl. 2000, 28, 253–263. [Google Scholar] [CrossRef]
  3. National Overview: Facts and Figures on Materials, Wastes and Recycling. Available online: https://www.epa.gov/facts-and-figures-about-materials-waste-and-recycling/national-overview-facts-and-figures-materials#Landfilling (accessed on 19 January 2020).
  4. El-Fadel, M.; Findikakis, A.N.; Leckie, J.O. Environmental impacts of solid waste landfilling. J. Environ. Manage. 1997, 50, 125. [Google Scholar] [CrossRef]
  5. Goorah, S.S.D.; Esmyot, M.L.I.; Boojhawon, R. The health impact of nonhazardous solid waste disposal in a community: The case of the Mare Chicose landfill in Mauritius. J. Environ. Health 2009, 72, 48–55. [Google Scholar] [PubMed]
  6. Conti, J.; Holtberg, P.; Diefenderfer, J.; LaRose, A.; Turnure, J.T.; Westfall, L. International Energy Outlook 2016 with Prokctions to 2040; U.S. Energy Information Administration: Wahington, DC, USA, 2016; Volume 0484.
  7. Kotchen, M.J.; Mansur, E.T. How stringent are the US EPA’s proposed carbon pollution standards for new power plants? Rev. Environ. Econ. Policy 2014, 8, 290–306. [Google Scholar] [CrossRef]
  8. Yuan, H.; Wang, Y.; Kobayashi, N.; Zhao, D.; Xing, S. Study of Fuel Properties of Torrefied Municipal Solid Waste. Energy Fuels 2015, 29, 4976–4980. [Google Scholar] [CrossRef]
  9. What is U.S. electricity generation by energy source? Available online: https://www.eia.gov/tools/faqs/faq.php?id=427&t=3 (accessed on 29 April 2020).
  10. Xu, Z.; Zinchik, S.; Kolapkar, S.; Bar-ziv, E.; Hansen, T.; Conn, D. Properties of Torrefied U. S. Waste Blends. Front. Energy Res. 2018, 6, 65. [Google Scholar] [CrossRef] [Green Version]
  11. Kumar, L.; Koukoulas, A.A.; Mani, S.; Satyavolu, J. Integrating torrefaction in the wood pellet industry: A critical review. Energy Fuels 2017, 31, 37–54. [Google Scholar] [CrossRef]
  12. Radics, R.I.; Gonzalez, R.; Bilek, E.M.; Kelley, S.S. Systematic review of torrefied wood economics. BioResources 2017, 12, 6868–6884. [Google Scholar] [CrossRef] [Green Version]
  13. Zinchik, S.; Xu, Z.; Kolapkar, S.S.; Bar-Ziv, E.; McDonald, A.G. Properties of pellets of torrefied U.S. waste blends. Waste Manag. 2020, 104, 130–138. [Google Scholar] [CrossRef]
  14. McCabe, J.G. Addressing Biogenic Carbon Dioxide Emissions from Stationary Sources; United States Enviromental Protection Agency: Washington, DC, USA, 2014.
  15. Solmaz, R.; Kardaş, G.; Çulha, M.; Yazıcı, B.; Erbil, M. Investigation of adsorption and inhibitive effect of 2-mercaptothiazoline on corrosion of mild steel in hydrochloric acid media. Electrochim. Acta 2008, 53, 5941–5952. [Google Scholar] [CrossRef]
  16. Hatanaka, T.; Imagawa, T.; Takeuchi, M. Formation of PCDD/Fs in artificial solid waste incineration in a laboratory-scale fluidized-bed reactor: Influence of contents and forms of chlorine sources in high-temperature combustion. Environ. Sci. Technol. 2000, 34, 3920–3924. [Google Scholar] [CrossRef]
  17. Vikelsoe, J.; Nielsen, P.; Blinksbjerg, P.; Madsen, H.; Manscher, O. Significance of chlorine sources for the generation of dioxins during incineration of MSW. Organohalogen. Compd. 1990, 3, 193–196. [Google Scholar]
  18. Tian, H.H.; Ouyang, N. Preliminary Investigaton on Dioxing Emission from MSW Incinerators. Environ. Chem. 2003, 22, 255–258. [Google Scholar]
  19. Ni, Y.; Zhang, H.; Fan, S.; Zhang, X.; Zhang, Q.; Chen, J. Emissions of PCDD/Fs from municipal solid waste incinerators in China. Chemosphere 2009, 75, 1153–1158. [Google Scholar] [CrossRef] [PubMed]
  20. Cangialosi, F.; Intini, G.; Liberti, L.; Notarnicola, M.; Stellacci, P. Health risk assessment of air emissions from a municipal solid waste incineration plant—A case study. Waste Manag. 2008, 28, 885–895. [Google Scholar] [CrossRef]
  21. EPA Clean Air Act, 42 USC 7412(f). Available online: https://www.govinfo.gov/content/pkg/USCODE-2013-title42/html/USCODE-2013-title42-chap85-subchapI-partA-sec7412.htm (accessed on 19 January 2020).
  22. Inoue, T.; Miyazaki, M.; Kamitani, M.; Kano, J.; Saito, F. Mechanochemical dechlorination of polyvinyl chloride by co-grinding with various metal oxides. Adv. Powder Technol. 2004, 15, 215–225. [Google Scholar] [CrossRef]
  23. Indrawan, B.; Prawisudhap, P.; Yoshikawa, K. Chlorine-free Solid Fuel Production from Municipal Solid Waste by Hydrothermal Process. J. Japan Inst. Energy 2011, 90, 1177–1182. [Google Scholar] [CrossRef]
  24. Xu, Z.; Kolapkar, S.; Zinchik, S.; Bar-Ziv, E.; Mcdonald, A. Comprehensive Kinetic Study of Thermal Degradation of Polyvinylchloride (PVC). Polym. Degrad. Stab. 2020, 176, 109148. [Google Scholar] [CrossRef]
  25. Incropera, F.P.; Dewitt, D.P.; Bergman, T.L.; Lavine, A.S. Incropera, Lavine, DeWitt—2011–Fundamentals of Heat and Mass Transfer, 7th ed.; John Wiley & Sons: Hoboken, NJ, USA, 2011; pp. 280–376. ISBN 9780470501979. [Google Scholar]
  26. De Carvalho, G.; Frollini, E.; Dos Santos, W.N. Thermal conductivity of polymers by hot-wire method. J. Appl. Polym. Sci. 1996, 62, 2281–2285. [Google Scholar] [CrossRef]
  27. Incropera, F.P.; Dewitt, D.P.; Bergman, T.L.; Lavine, A.S. Fundamentals of Heat and Mass Transfer, 7th ed.; John Wiley & Sons: Hoboken, NJ, USA, 2011; pp. 983–1011. ISBN 9780470501979. [Google Scholar]
  28. Jung, Y.G.; Choi, S.C.; Oh, C.S.; Paik, U.G. Residual stress and thermal properties of zirconia/metal (nickel, stainless steel 304) functionally graded materials fabricated by hot pressing. J. Mater. Sci. 1997, 32, 3841–3850. [Google Scholar] [CrossRef]
  29. Jacques Lédé Biomass Pyrolysis: Comments on Some Sources of Confusions in the Definitions of Temperatures and Heating Rates. Energies 2010, 3, 886–898. [CrossRef] [Green Version]
  30. Funke, A.; Henrich, E.; Dahmen, N.; Sauer, J. Dimensional Analysis of Auger-Type Fast Pyrolysis Reactors. Energy Technol. 2017, 5, 119–129. [Google Scholar] [CrossRef]
  31. Bach, Q.V.; Chen, W.H.; Eng, C.F.; Wang, C.W.; Liang, K.C.; Kuo, J.Y. Pyrolysis characteristics and non-isothermal torrefaction kinetics of industrial solid wastes. Fuel 2019, 251, 118–125. [Google Scholar] [CrossRef]
  32. Anuar Sharuddin, S.D.; Abnisa, F.; Wan Daud, W.M.A.; Aroua, M.K. A review on pyrolysis of plastic wastes. Energy Convers. Manag. 2016, 115, 308–326. [Google Scholar] [CrossRef]
  33. Lu, P.; Huang, Q.; Bourtsalas, A.T.; Themelis, N.J.; Chi, Y.; Yan, J. Review on fate of chlorine during thermal processing of solid wastes. J. Environ. Sci. (China) 2019, 78, 13–28. [Google Scholar] [CrossRef]
  34. Abbas, Z.; Moghaddam, A.P.; Steenari, B.M. Release of salts from municipal solid waste combustion residues. Waste Manag. 2003, 23, 291–305. [Google Scholar] [CrossRef]
  35. Donepudi, Y. Impact of Pretreatment Methods on Fast Pyrolysis of Biomass. Ph.D. Thesis, Michigan Technological University, Houghton, MI, USA, 2017. [Google Scholar]
  36. Luppens, J.A. A critical review of published coal quality data from the southwestern part of the Powder River Basin, Wyoming; US Geological Survey: Reston, Virginia, 2011; Volume 5.
Figure 1. Mass loss and temperature transient vs. time.
Applsci 10 03337 g001
Figure 2. (a) Chlorine removal efficiency (from waste) and temperature vs. time; (b) organic chlorine removal efficiency from waste and from PVC vs. time.
Applsci 10 03337 g002
Figure 3. Organic chlorine removal efficiency vs. mass loss.
Applsci 10 03337 g003
Figure 4. Heat content vs. mass loss.
Applsci 10 03337 g004
Figure 5. Normalized retained energy vs. mass loss.
Applsci 10 03337 g005
Figure 6. Chlorine removal per unit energy vs. mass loss.
Applsci 10 03337 g006
Table 1. Estimated values for the parameters to determine the Bi and M. CE, Convergen Energy, LLC.
ParameterValueSource
h, W/m2-K10[25]
λ for CE material, W/m-K0.2[26]
ρ (apparent), kg/m31150Measured in this study
cp (apparent), J/kg-K1600[27]
Lc diameter, m0.003Measured in this study
Bi0.15Current result
M0.009Current result
Table 2. Fitted parameter values used in Equation (7).
a10.39a20.61
A 1 2.81 × 10⁷ A 2 7.58 × 10⁵
T a 1 1.53 × 10⁴ T a 2 1.55 × 10⁴

