Potential and Feasibility Study of Hybrid Wind–Hydroelectric Power System with Water-Pumping Storage: Jordan as a Case Study

 ,
,  , ,
, ,
Abstract
1. Introduction
1.1. Energy Situation in Jordan
1.2. Pumped-Hydro Storage Technology
1.3. Hybrid Wind-Powered Pumped-Hydro Energy Storage
2. Description of the Site
2.1. Dams in Jordan
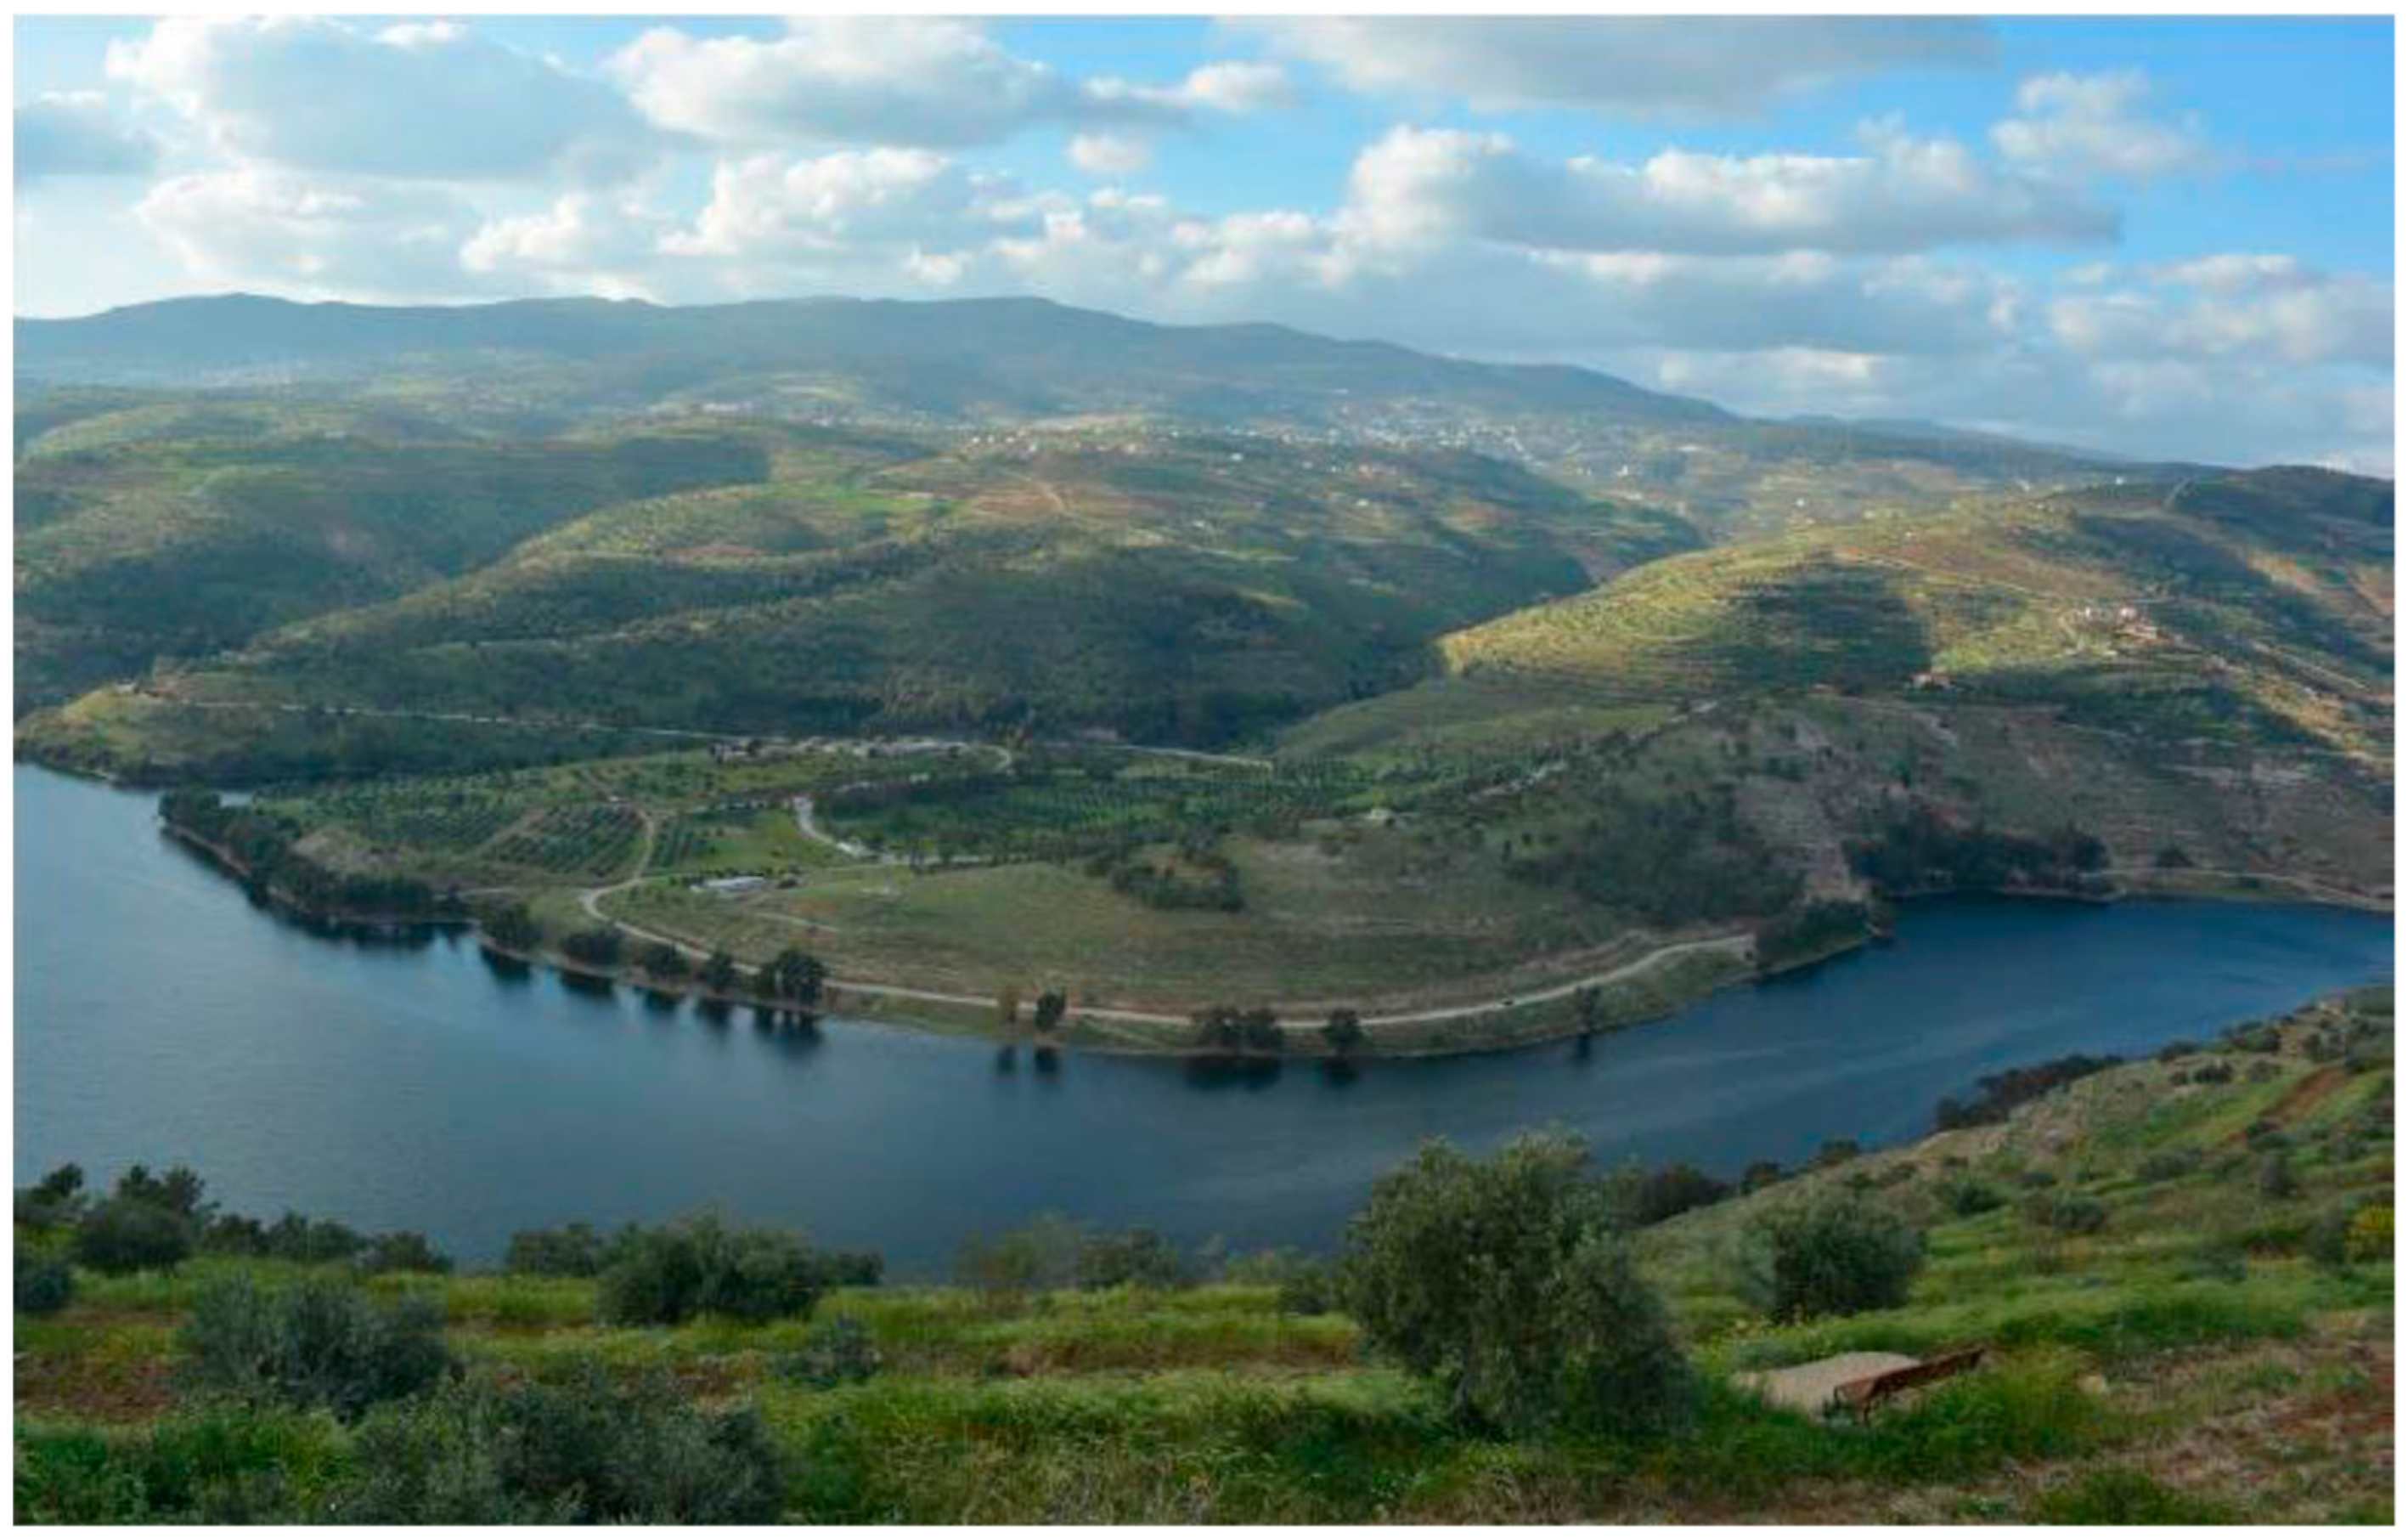
2.2. King Talal Dam
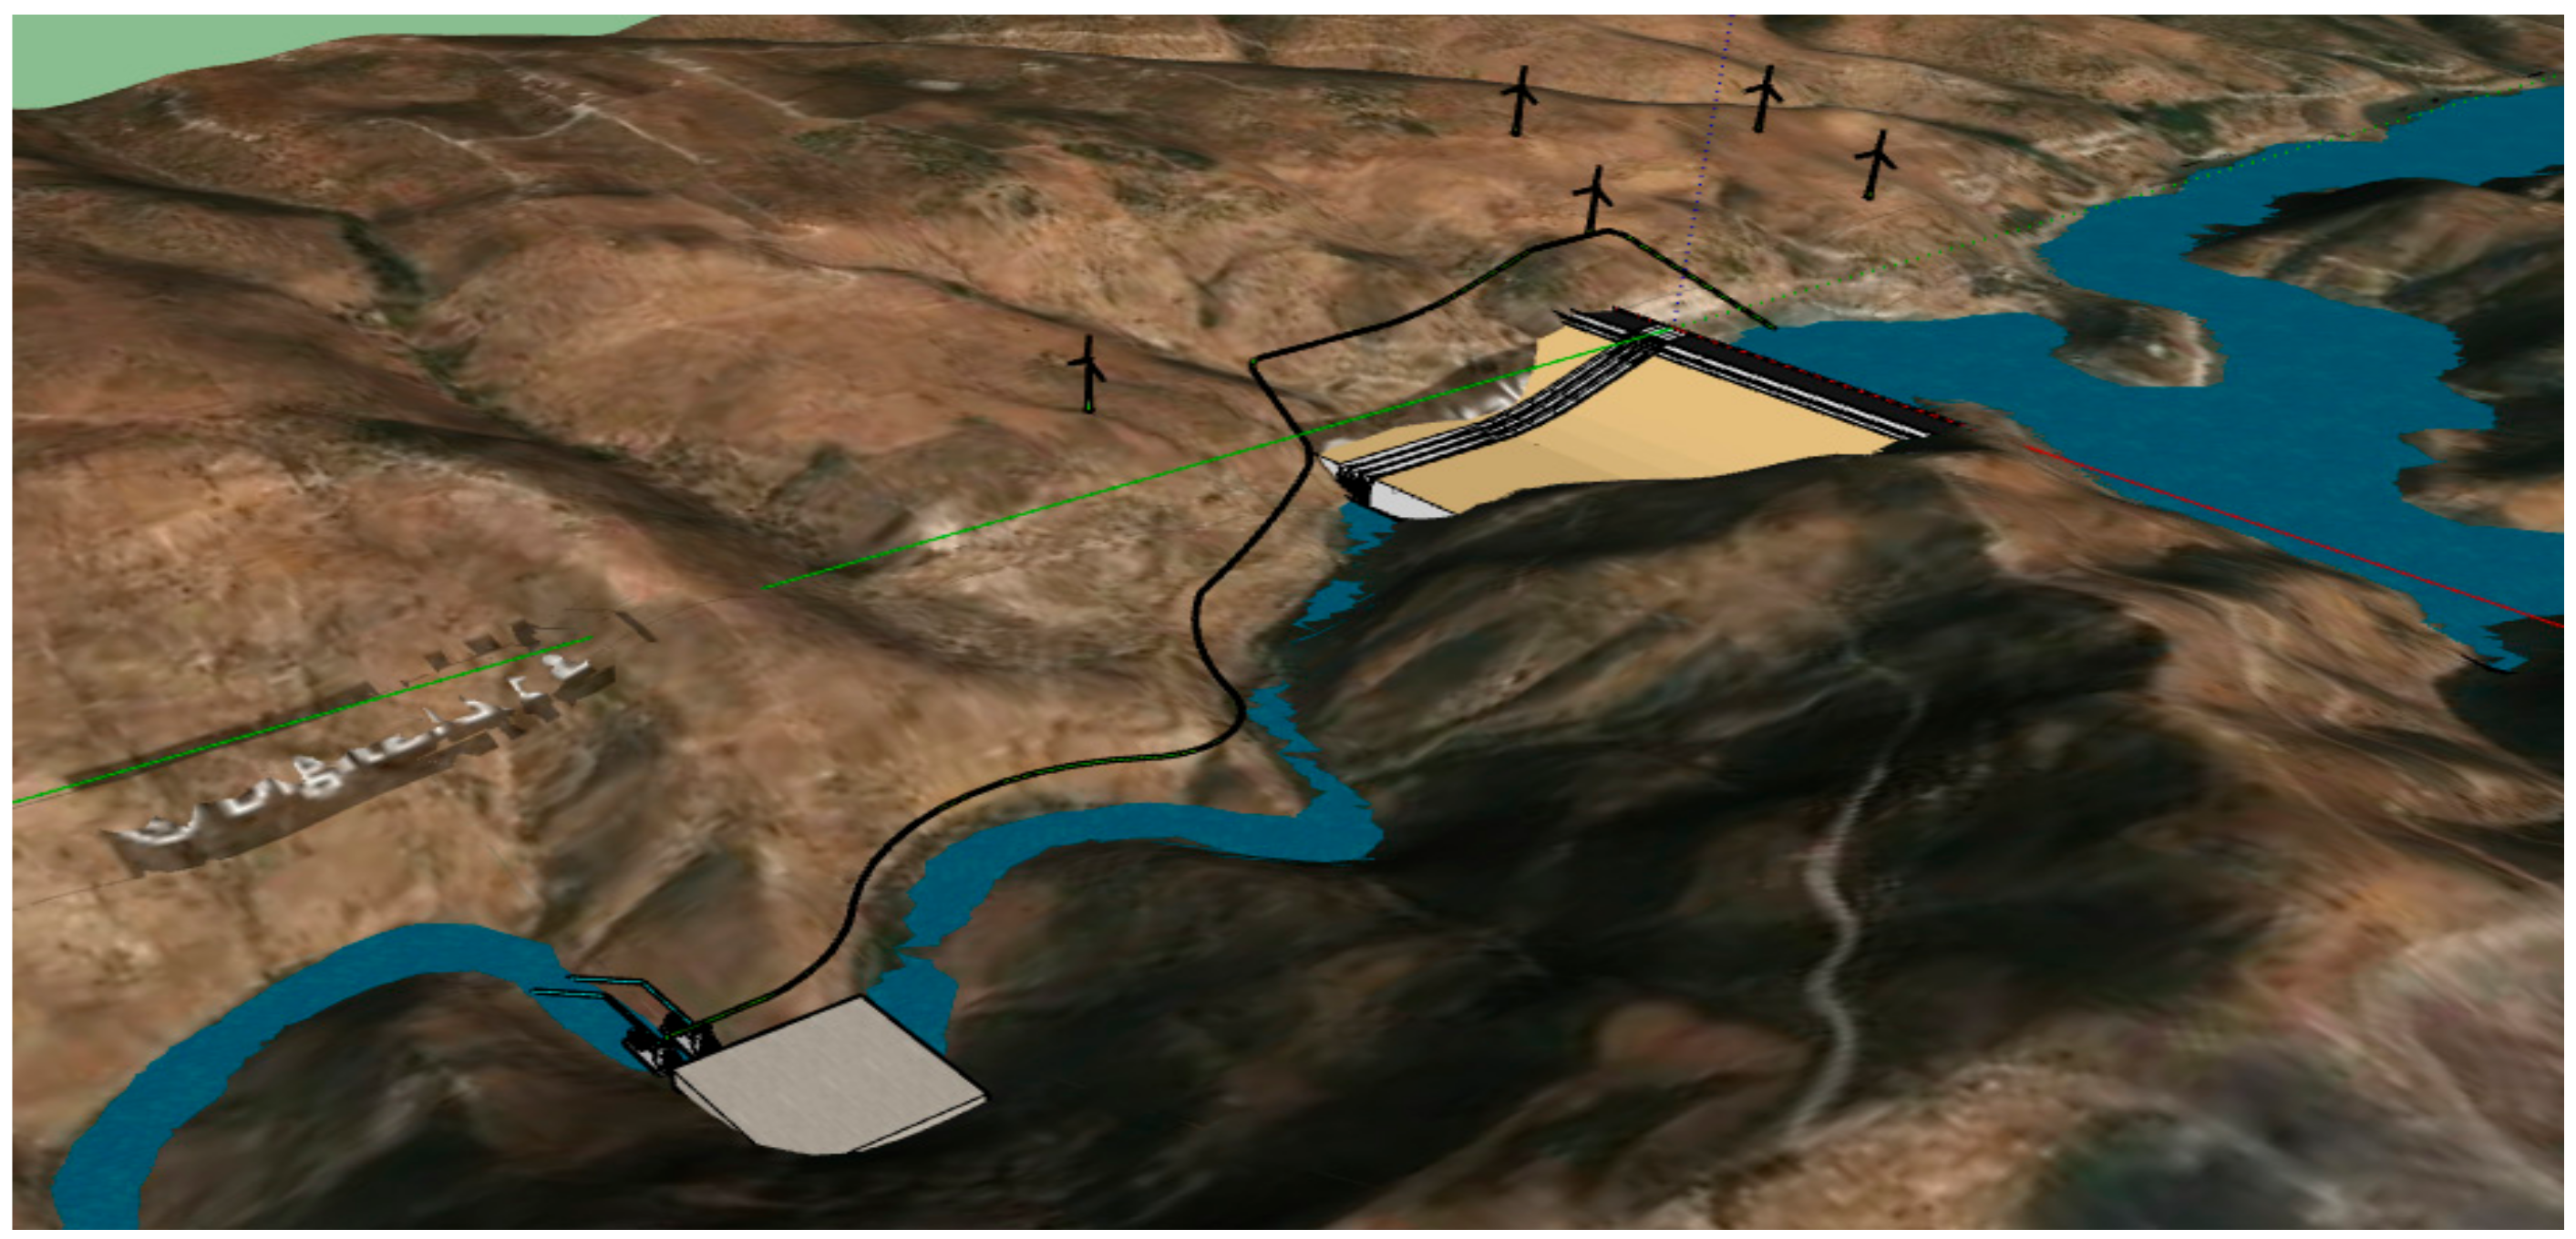
Water-Pumping Subsystem Location and Layout
3. Methodology
3.1. Simulation Software
3.1.1. Model Description
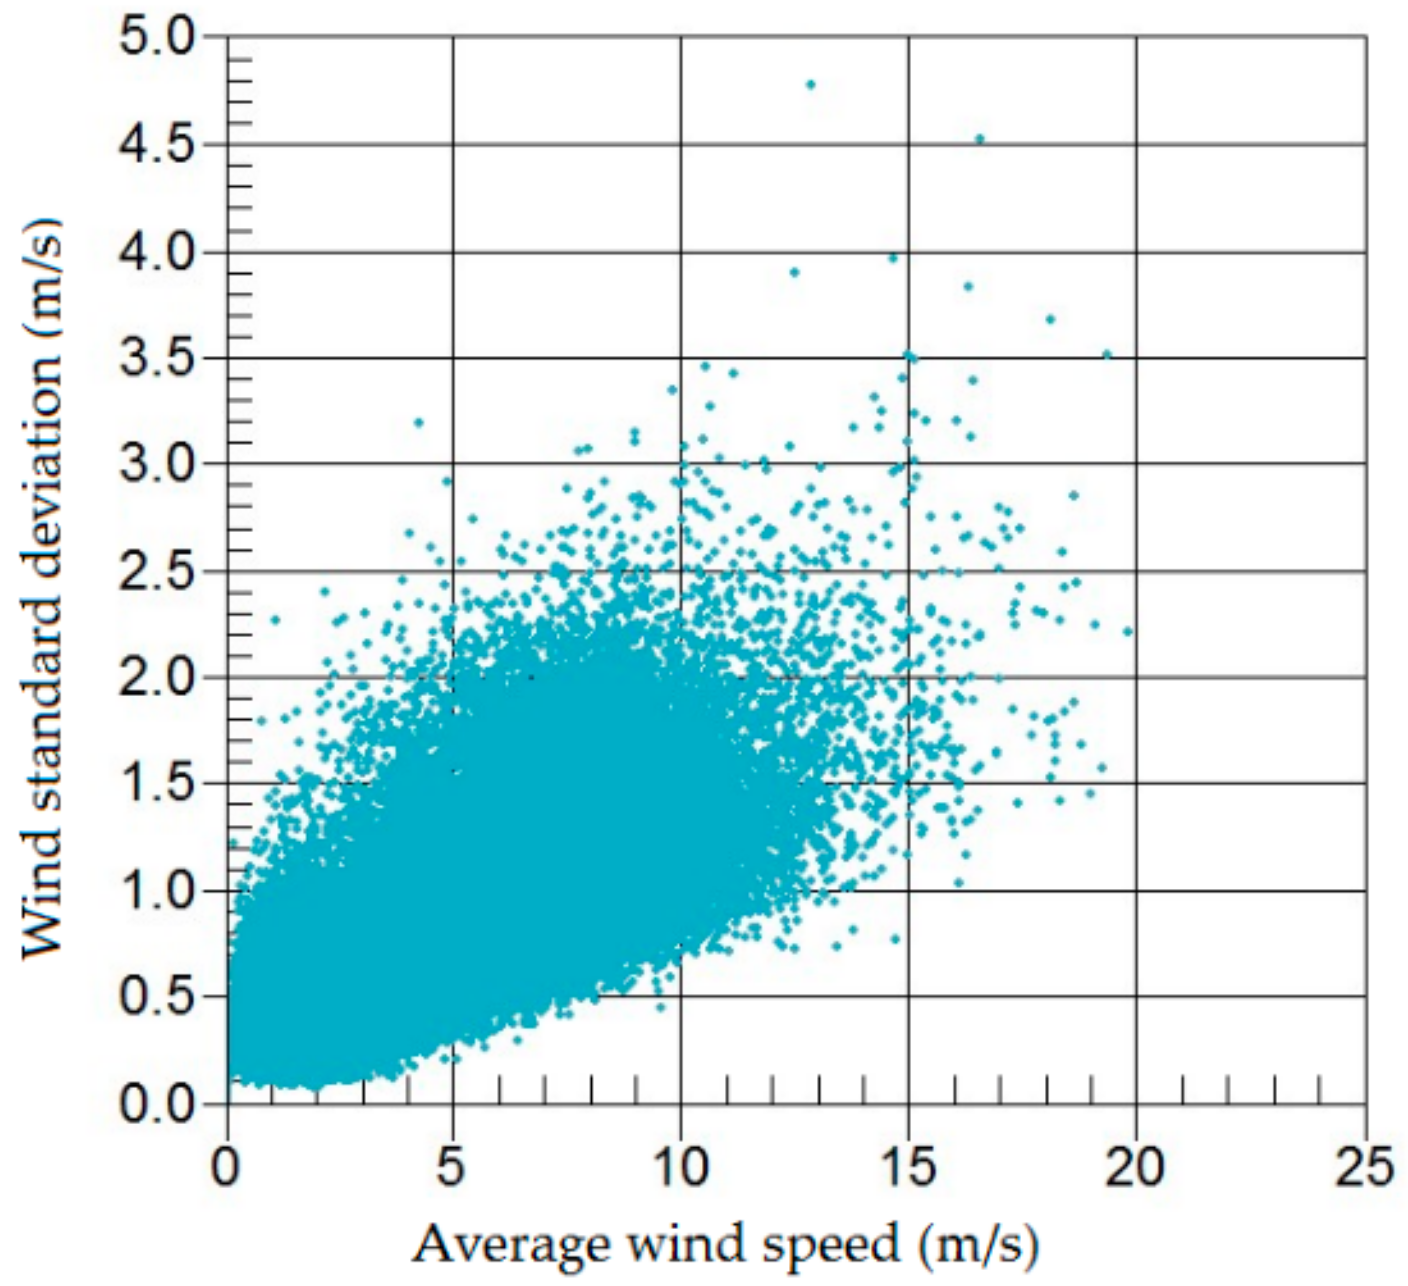
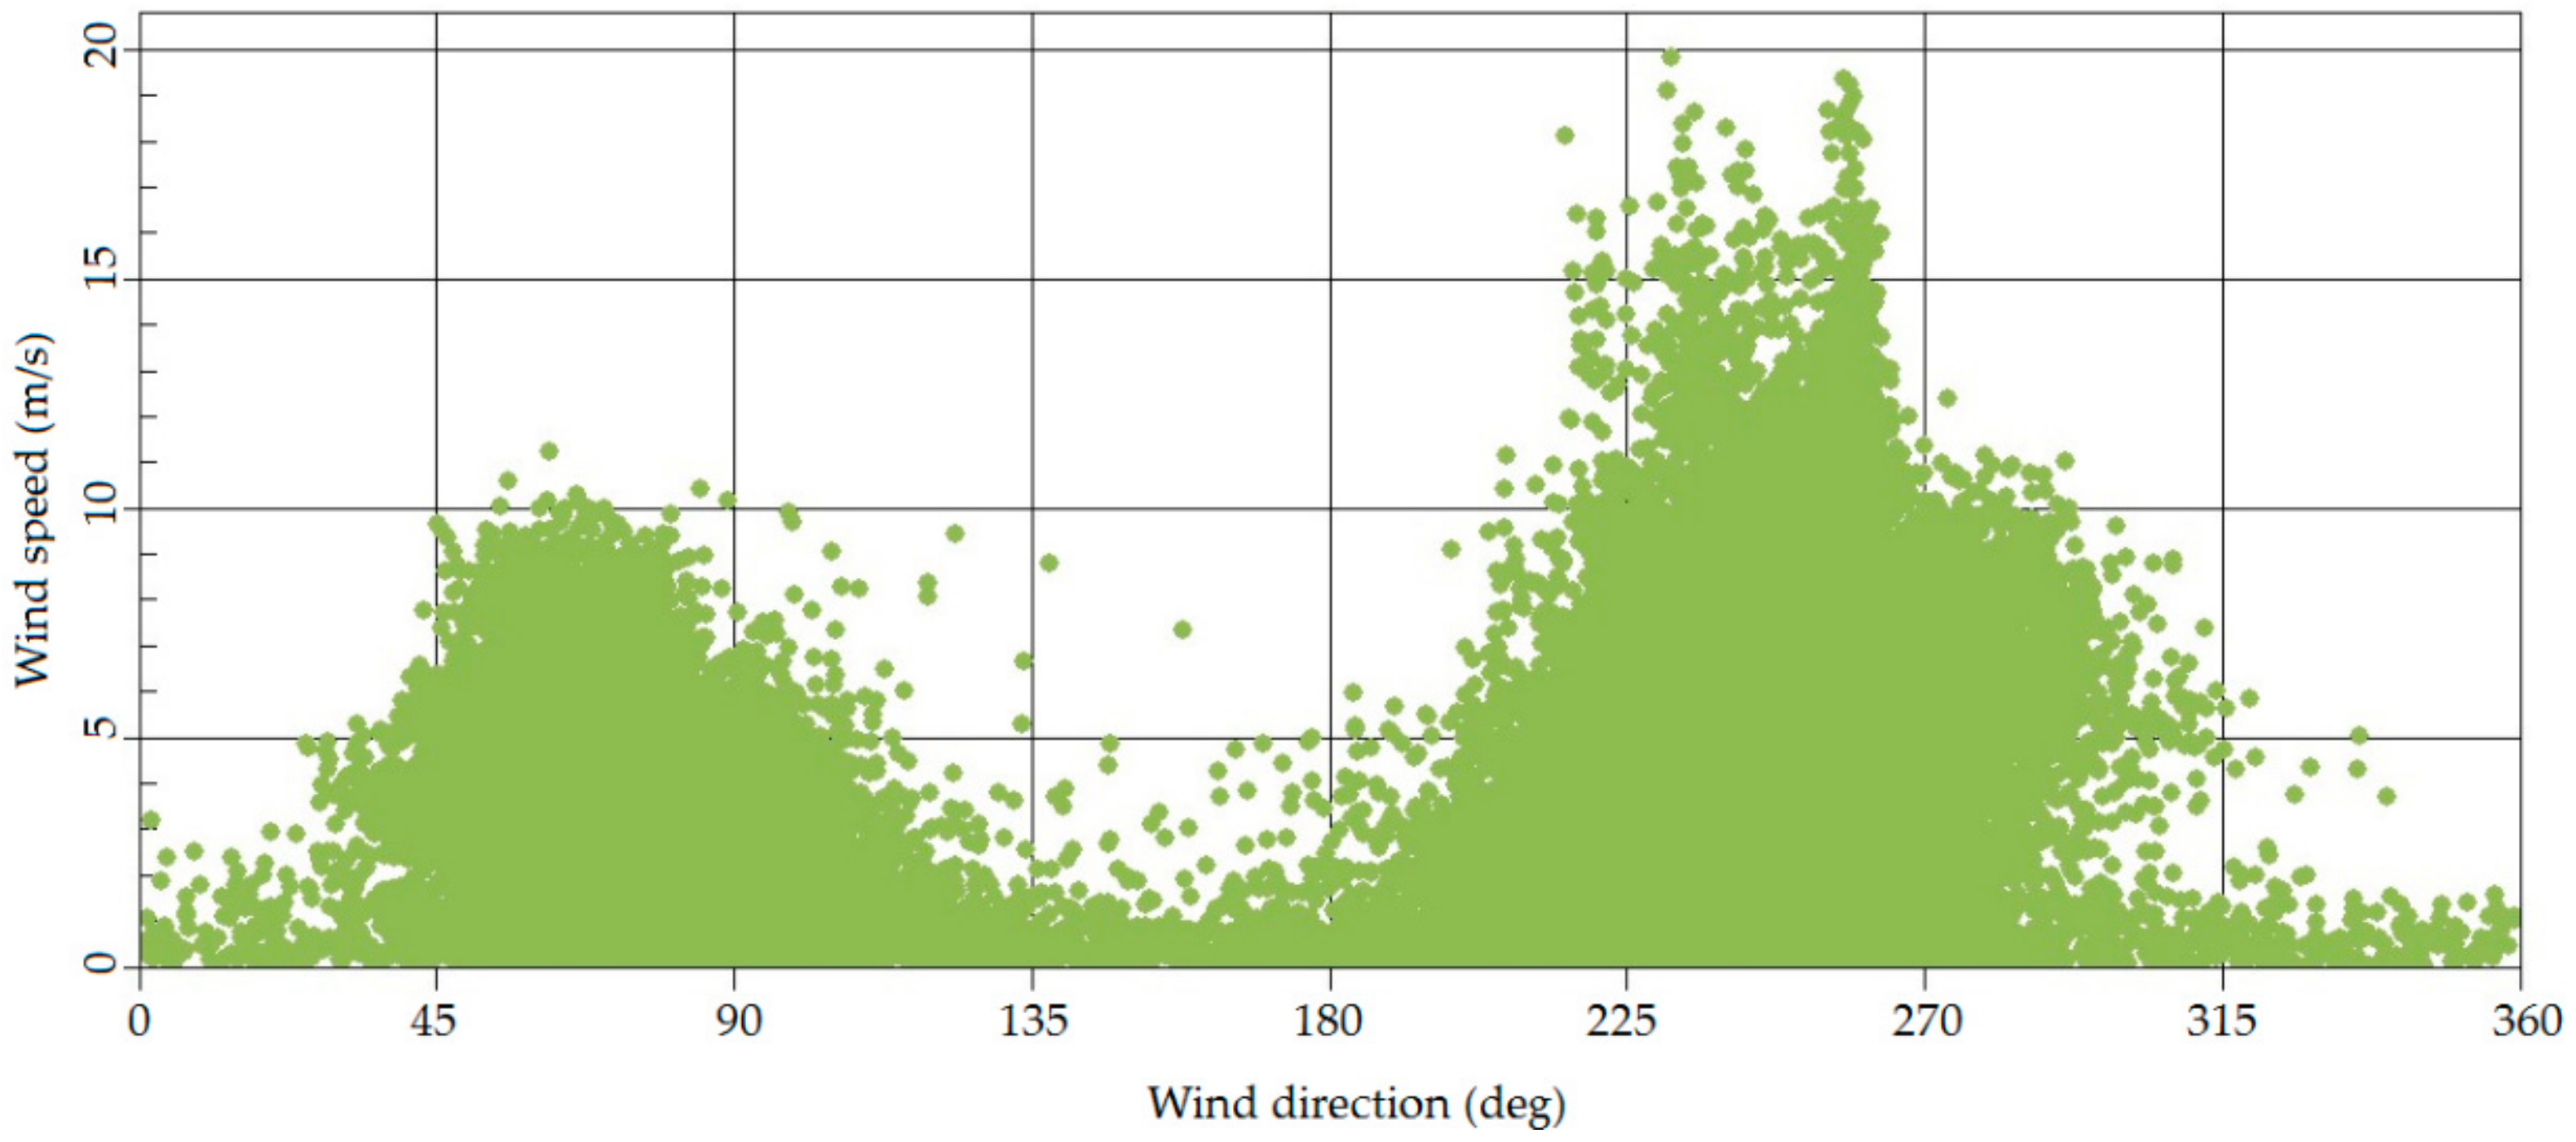
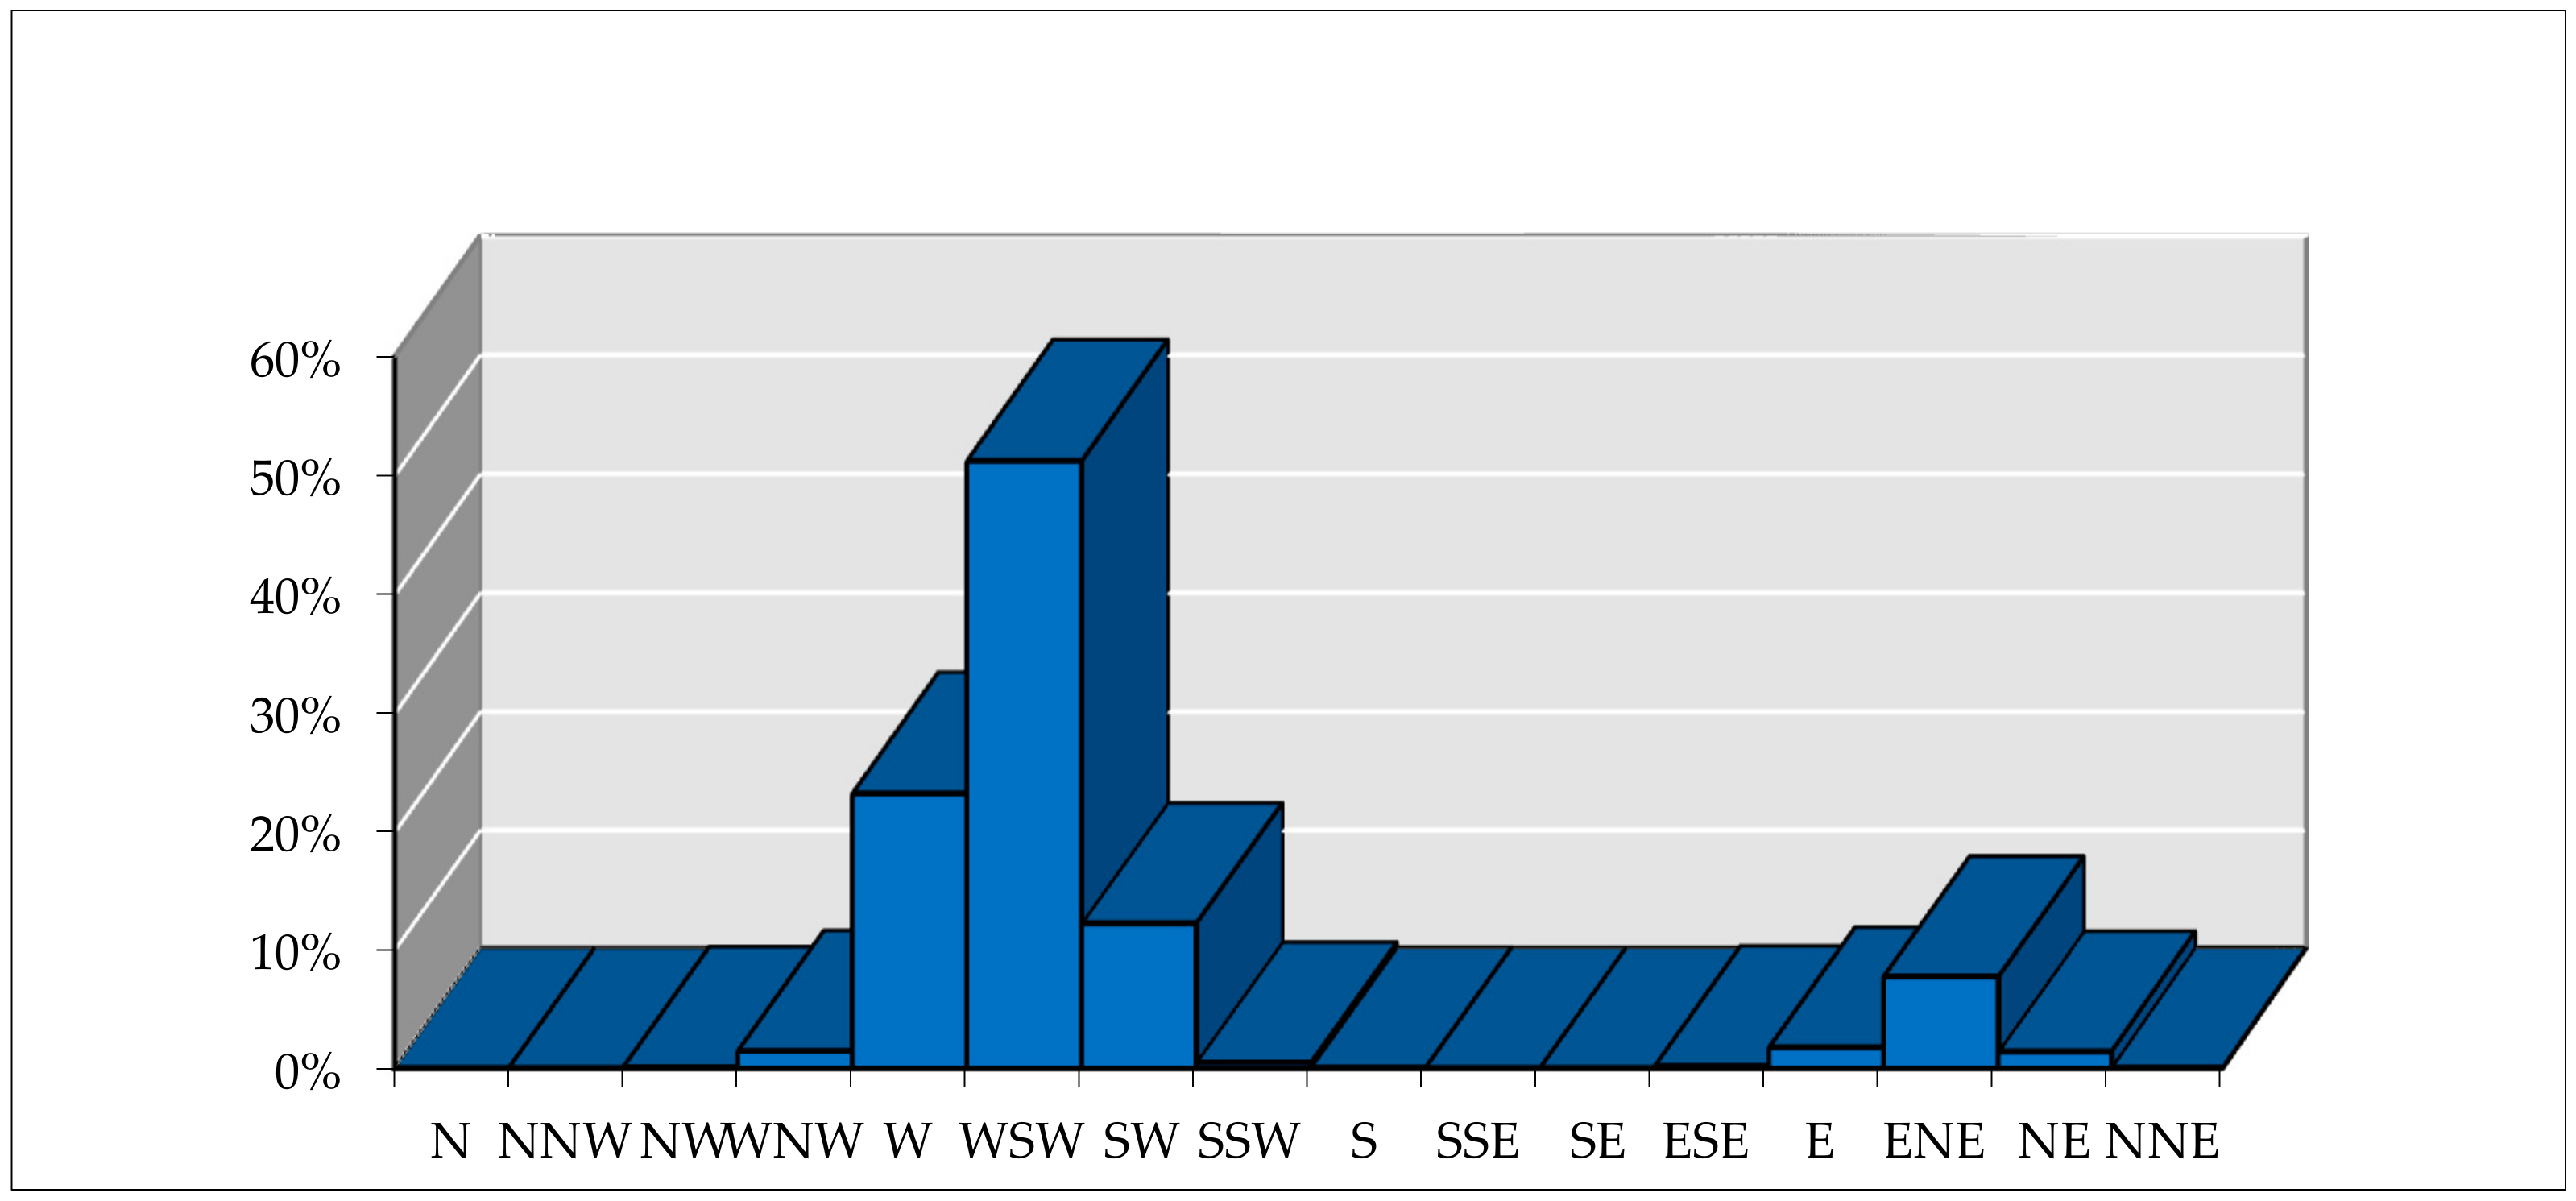
- Wind distribution data–A wind rose representing the wind farm site at a specific point including wind profile and turbulence information.
- Wind turbine data–Geometry along with power and thrust data versus wind speed.
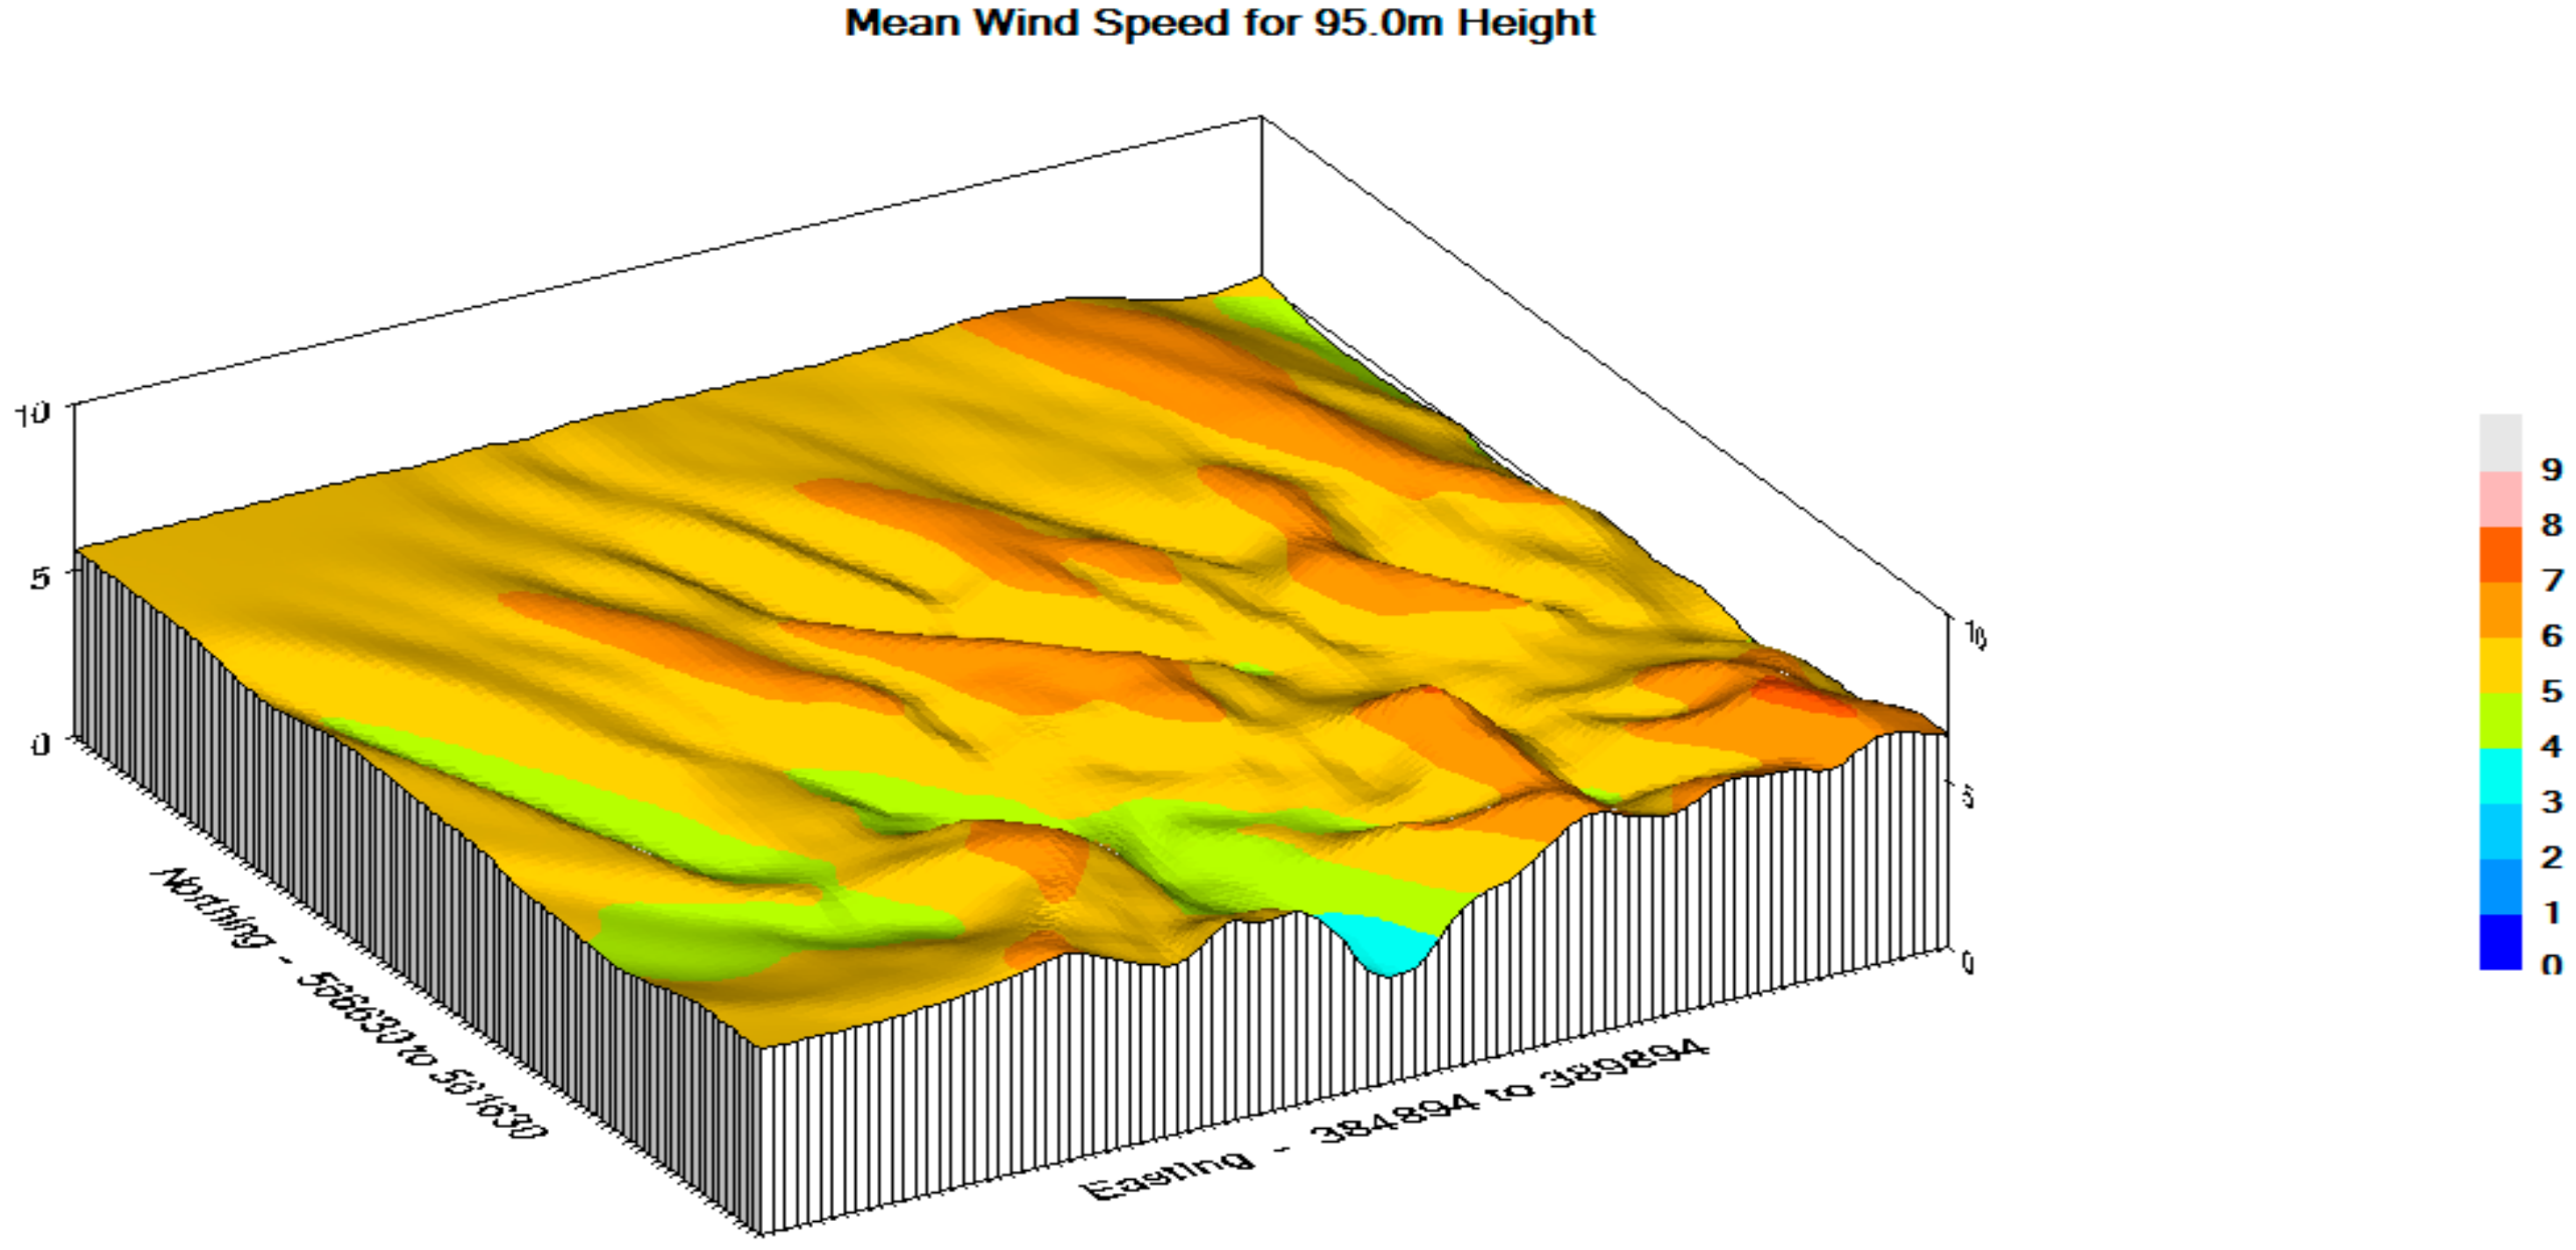
- Topographic data–A representation of the topography (which includes both height and roughness data) of the wind farm site and its surroundings.
3.1.2. Implemented Mathematical Equations and Correlations
- is the power produced by the Pelton hydraulic turbines, KW
- the air density, kg/m3
- is the air mass flow rate, kg/sec
- is the wind speed, m/sec
- is the swept area, m2
- is the aerodynamic capacity factor (wind power fraction captured by the wind turbine).
- per wind speed range and per direction sector
- per wind speed range but for all directions
- per direction, but for all the wind speeds (above calms)
- for all wind speeds, no matter the direction
3.2. Water-Pumping Subsystems
3.3. Water-Pumping Subsystem Location and Layout
3.4. Master Controller
4. Economic Feasibility
4.1. Assumptions and Input Data for the Analysis of the Hybrid System
- Wind Park Cost:
- System size: Defined through the scale of the project.
- Land size: Defined through the required land size in decacre (1000 m2).
- System cost: Defined through the cost of the wind turbine per watt, and the cost of the transformer switchgear, electrical protection equipment, and aviation Light, in the local market. This parameter also includes the installation cost per Mega-Watt in the local market in addition to the grid interconnection fees, transportation fees, storage, start-up, and land cost.
- System life expectancy: Defined through the system components’ lifespan and maintenance.
- Energy generation for 20 years “lifetime of the project”: Defined through forecasting the amount of energy that can be produced from the wind park for 20 years of its operation.
- Average energy selling tariff or saving energy: Defined through the average tariff for selling electric energy to the local distribution company for 2017.
- Annual inflation in tariff: Defined through the percentage of inflation in the energy selling tariff to the local distribution company.
- Operations and Maintenance (O&M) cost percentage: Defined through the changed costs for operating and maintaining the system based on the lifetime of the system.
- Annual inflation in O&M cost: Defined through the percentage of inflation in the operation and maintenance costs per annum.
- Insurance percentage: Defined through the fixed costs for insurance as a percentage of the initial investment.
- Annual inflation in insurance: Defined through the percentage of inflation in the insurance costs per annum.
- 2.
- Pumping System and Subsystem Estimated Cost
- Development cost: studies, design, drawing, cost analysis and permissions/approvals will be approximately the 6–7% of the total cost.
- Electrical cost: Control system, transformers, auxiliary transformer, MV equipment, SCADA system, motors, junction boxes, cables, earthing system, connection to the grid, internal electrical lines, fire system, and lightning system.
- Mechanical cost: Steel pipes, isolations, base unit, valves, manifold systems, piping system, water flow meter, overhead lighting, air-conditioning units, water equipment, drainage system, fire system etc.
- Project management: Supervision, reporting, etc.
- Commissioning: Electrical, mechanical, and control systems.
- Civil works and labor cost: Excavation, levelling, water tanks, powerhouse building, pump foundation, control room, pipe’s foundation.
4.2. Financing Scheme Debt Financing and Analysis for KTD’s Hybrid Power System
5. Results and Discussion
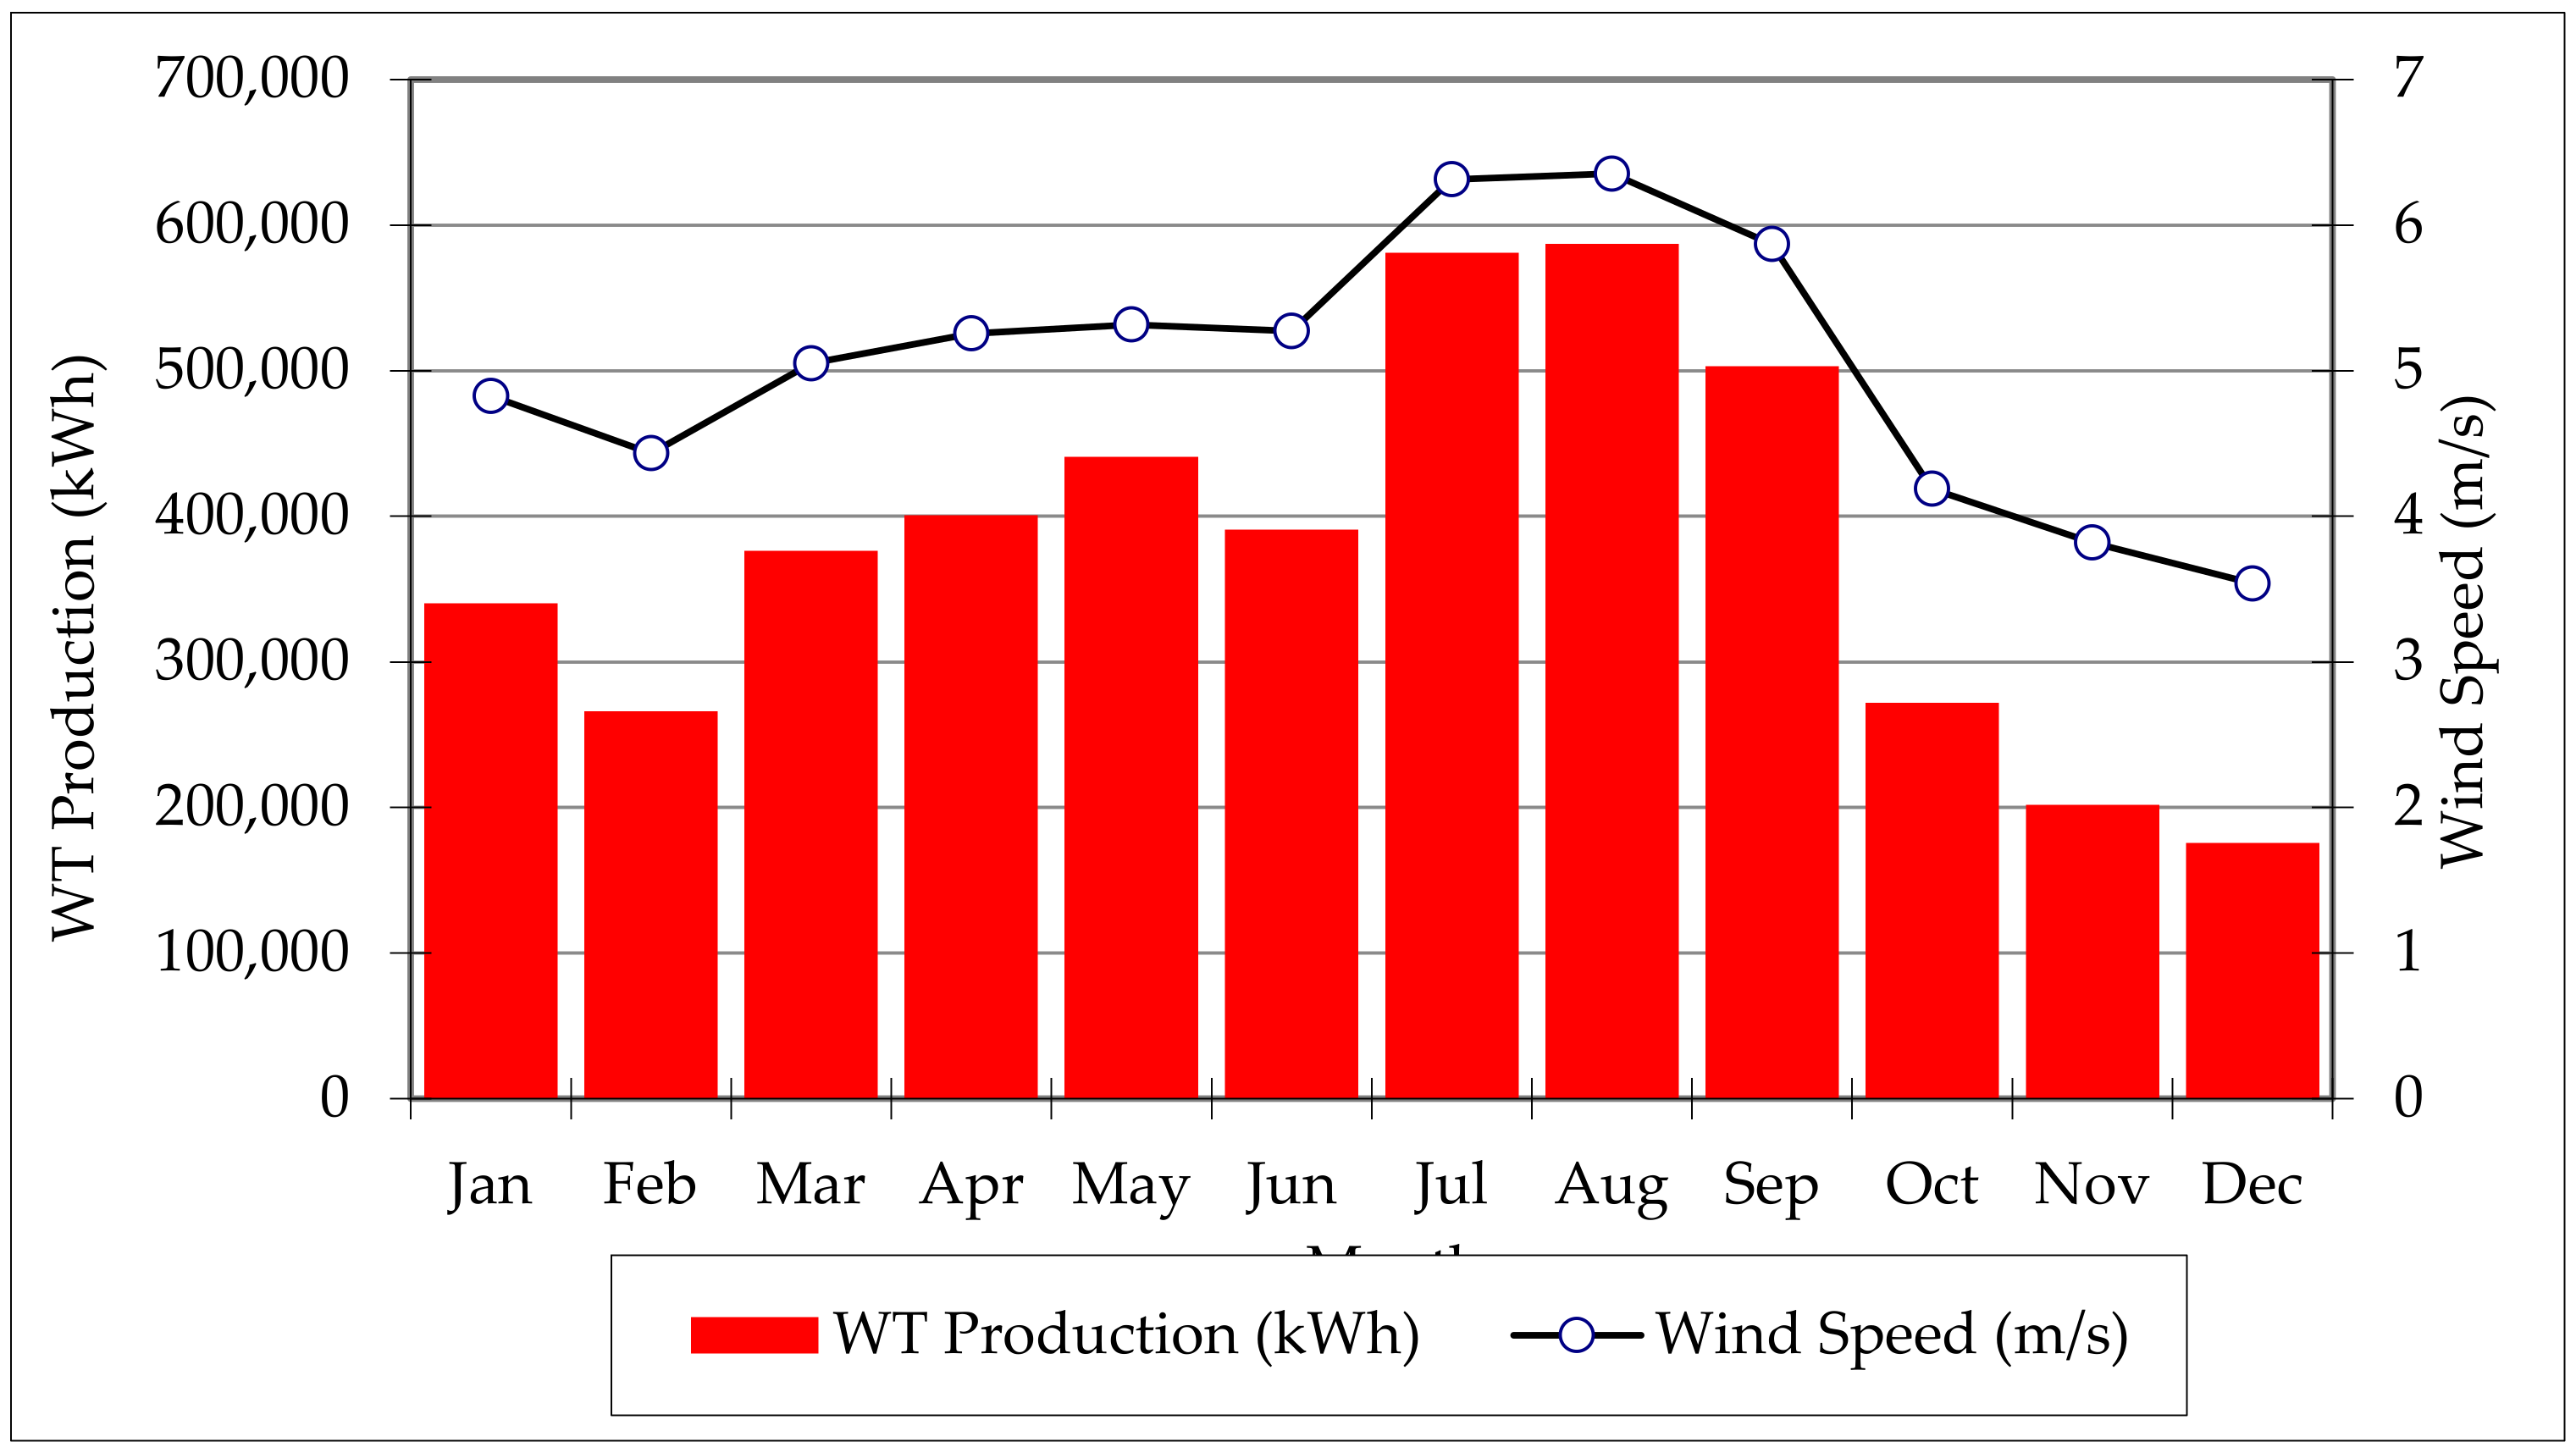
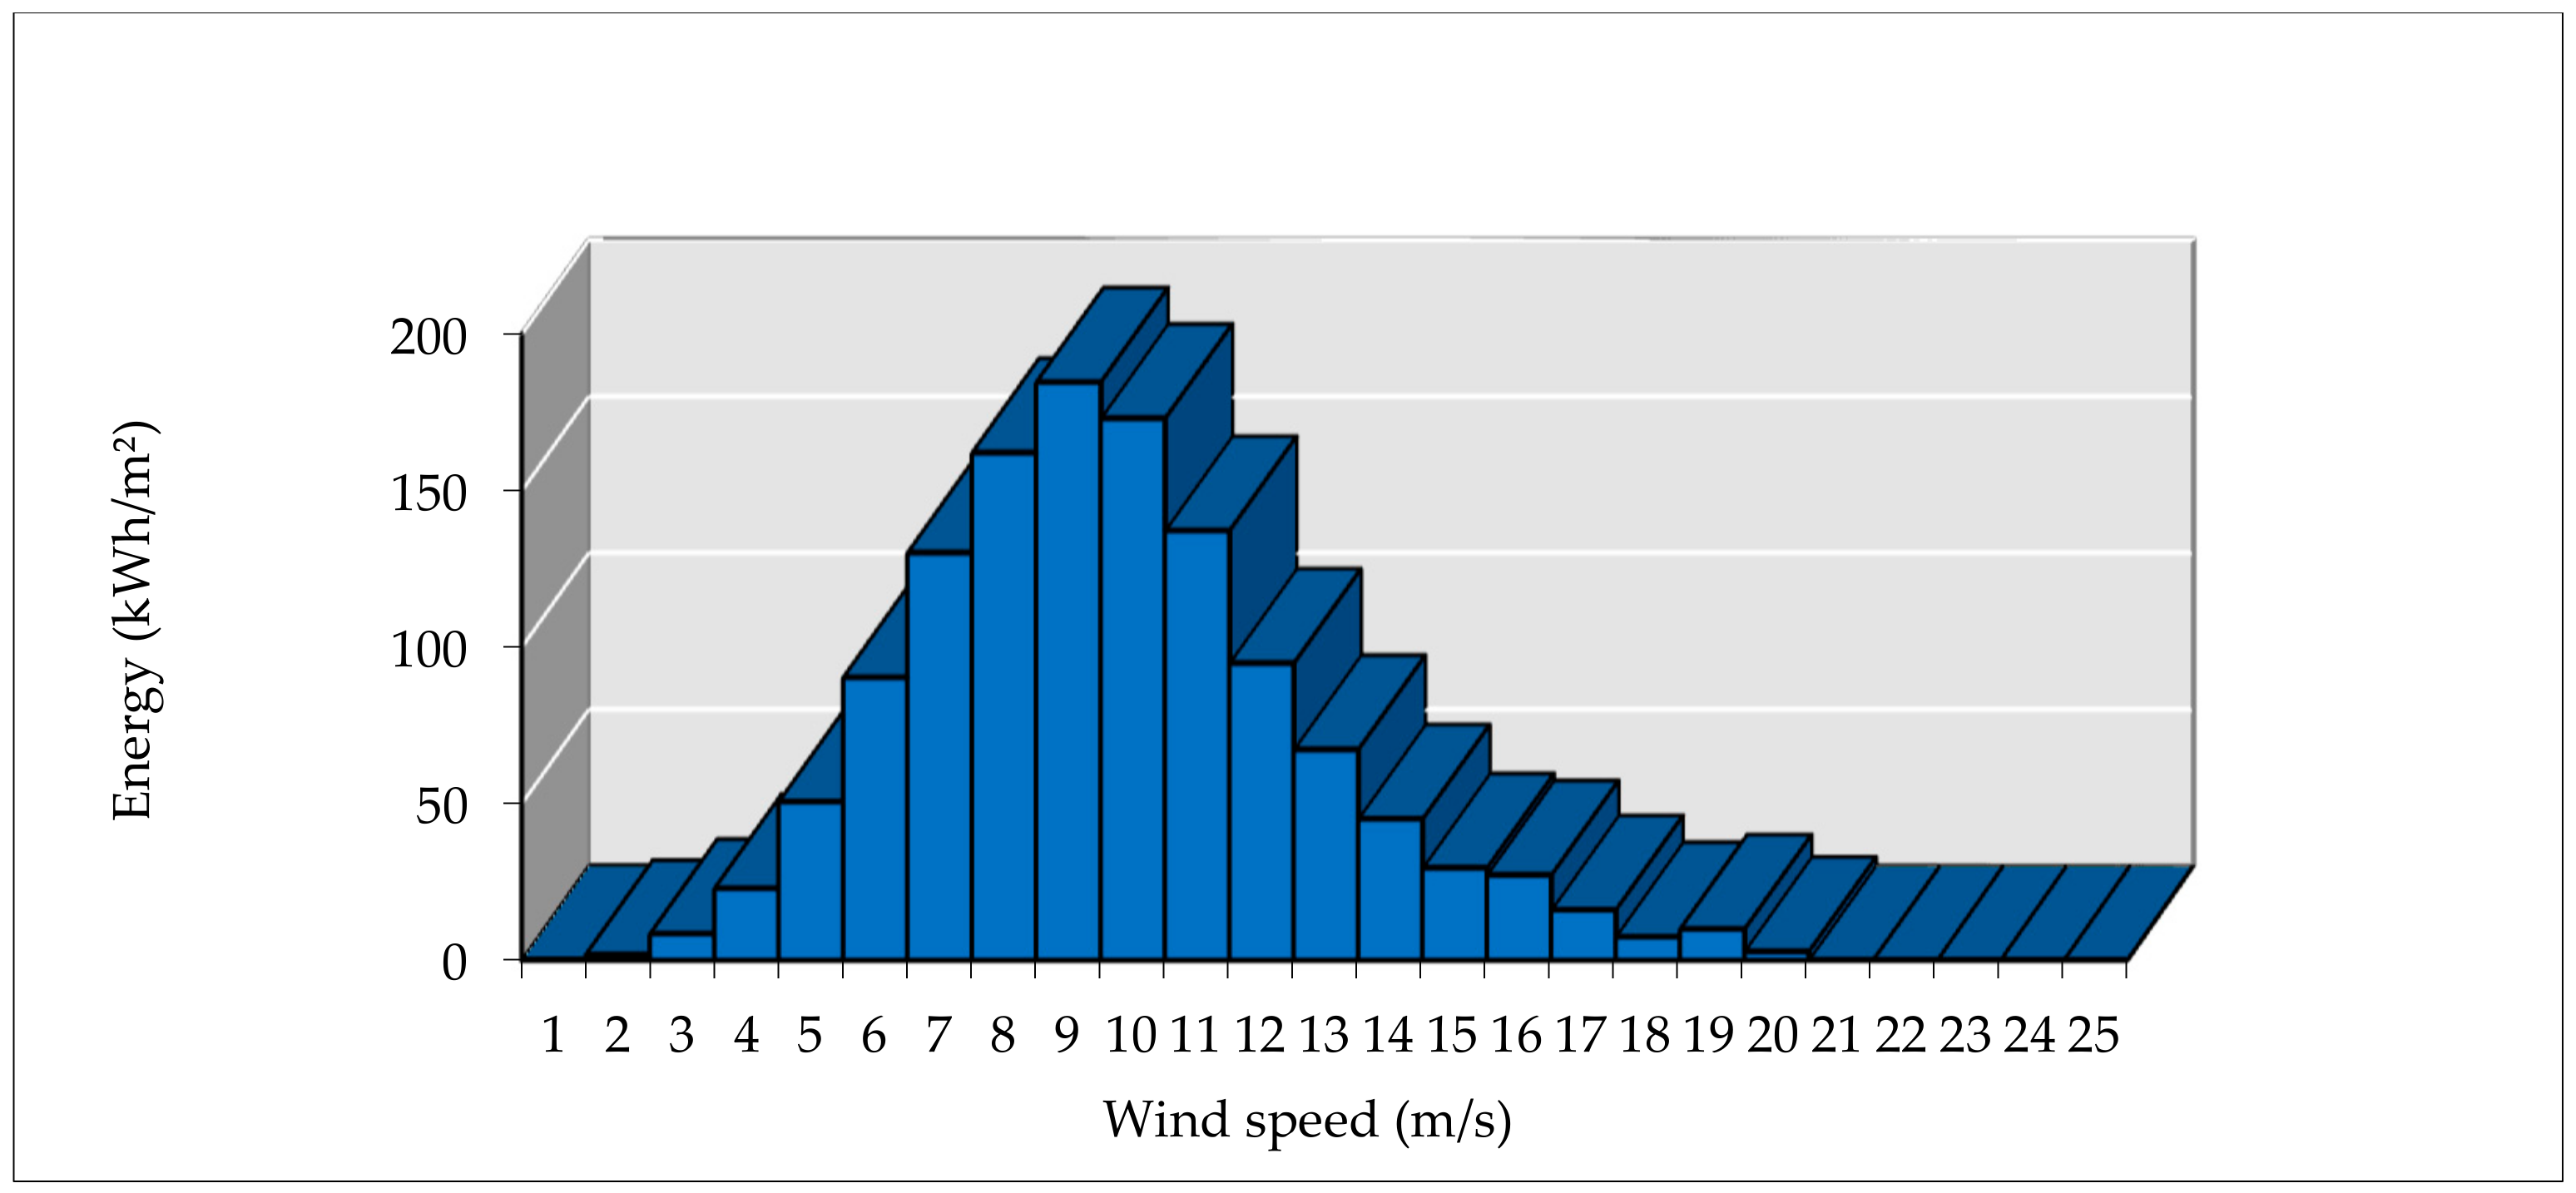
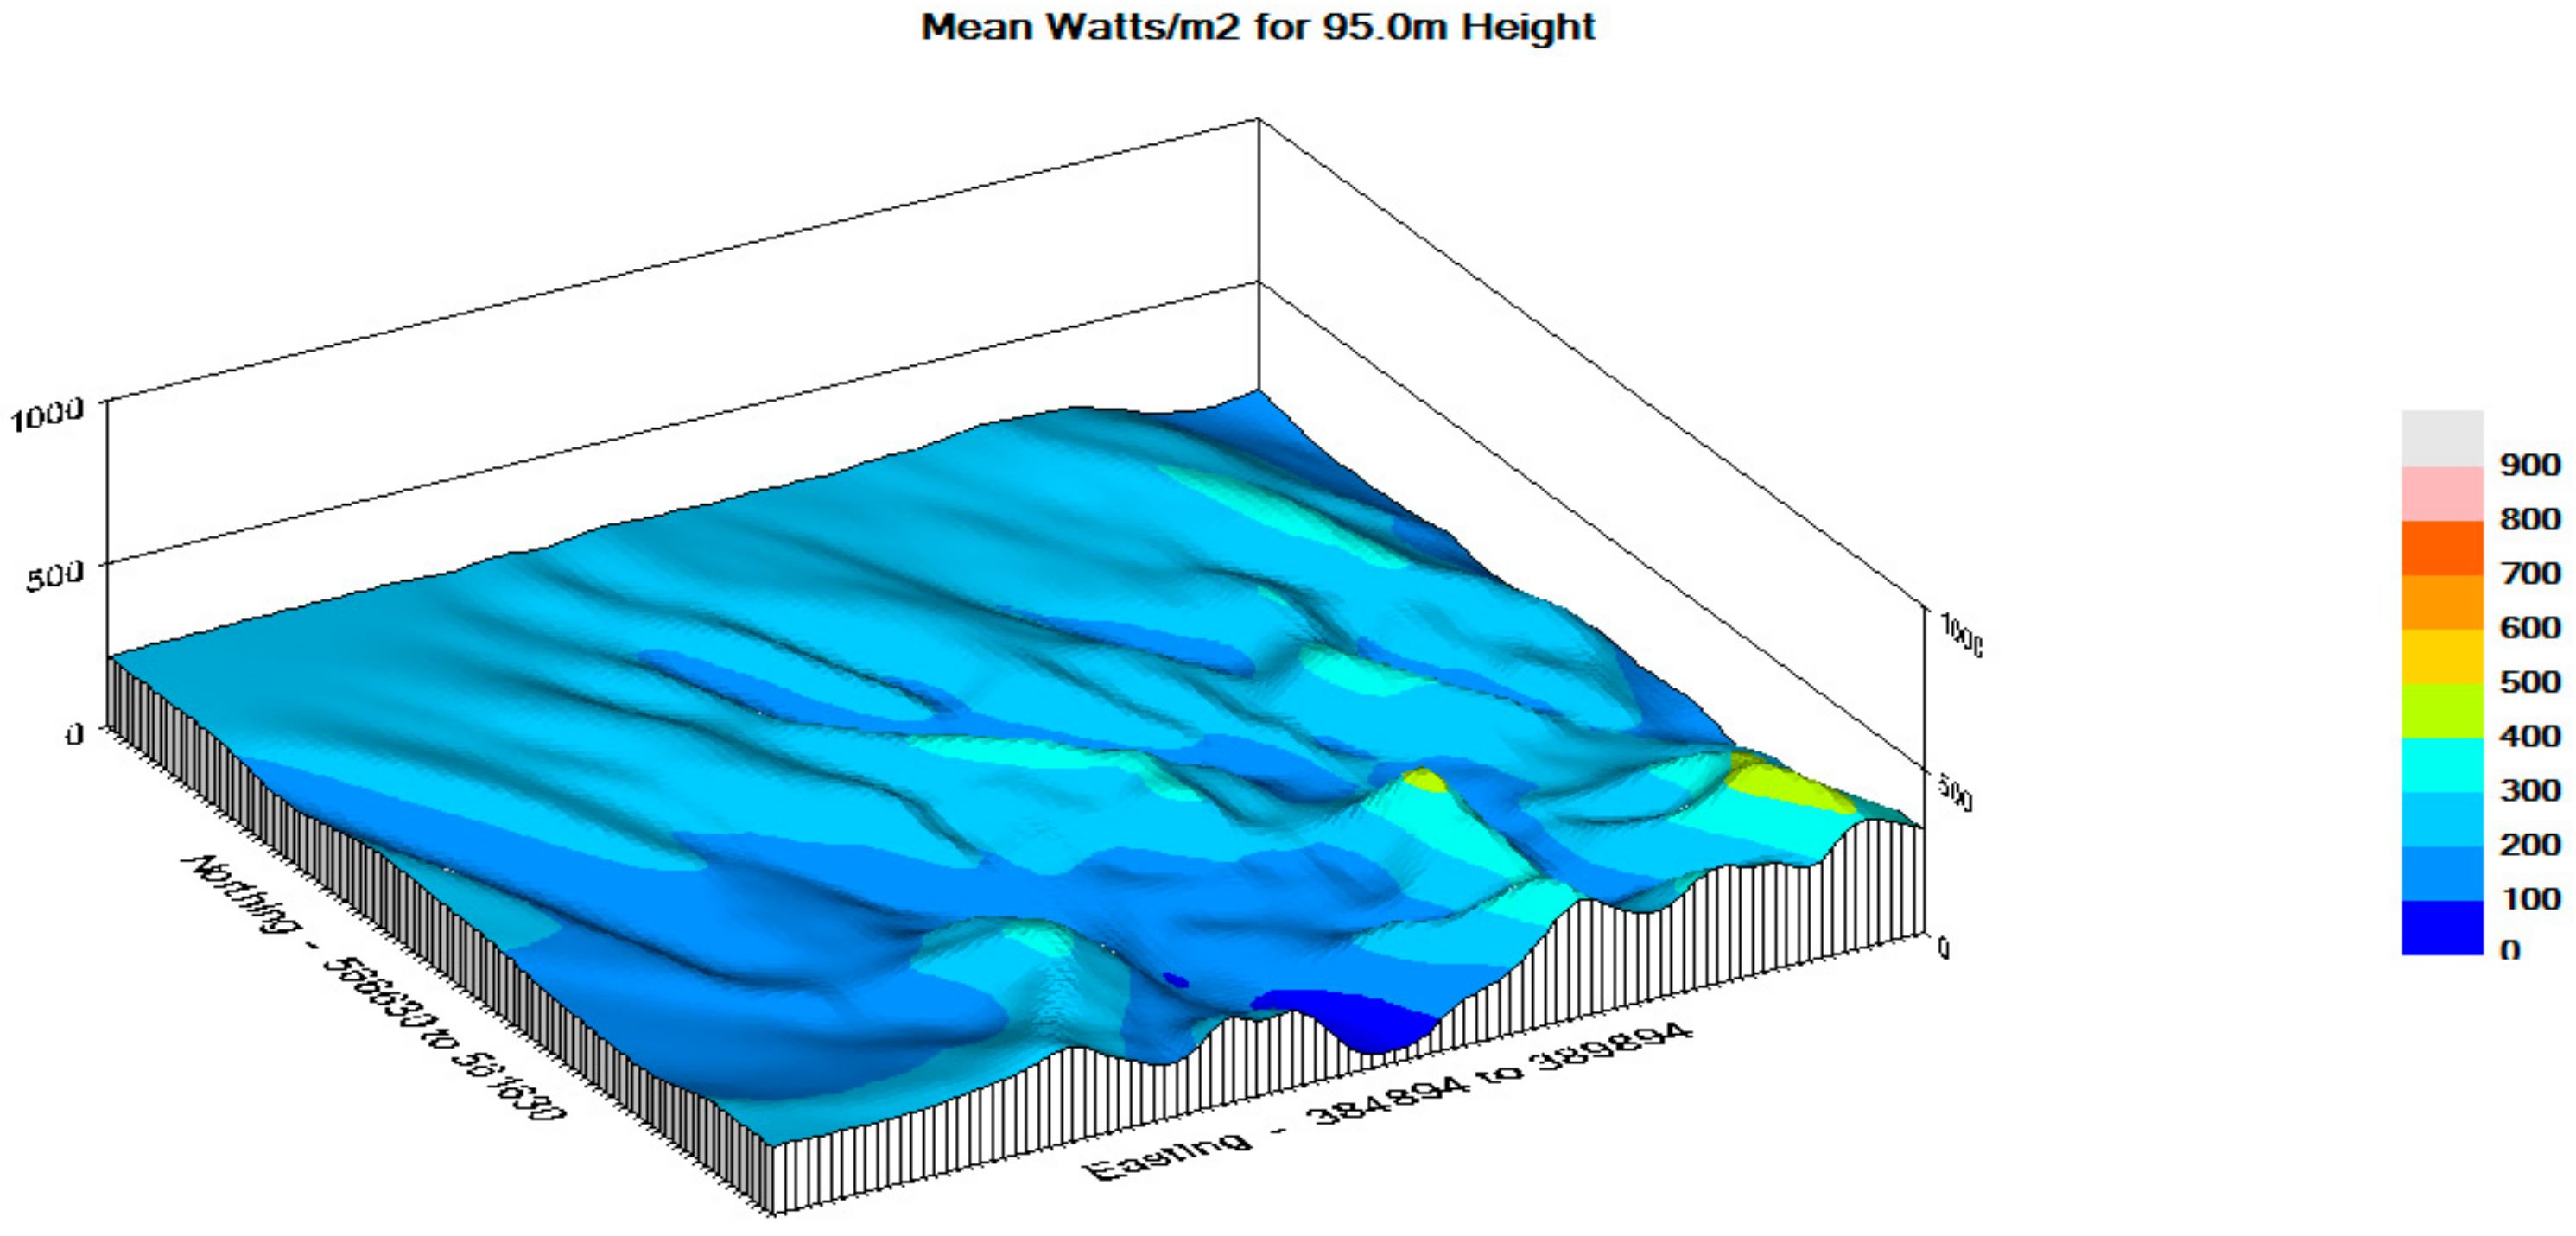
5.1. Expected Wind Energy Production
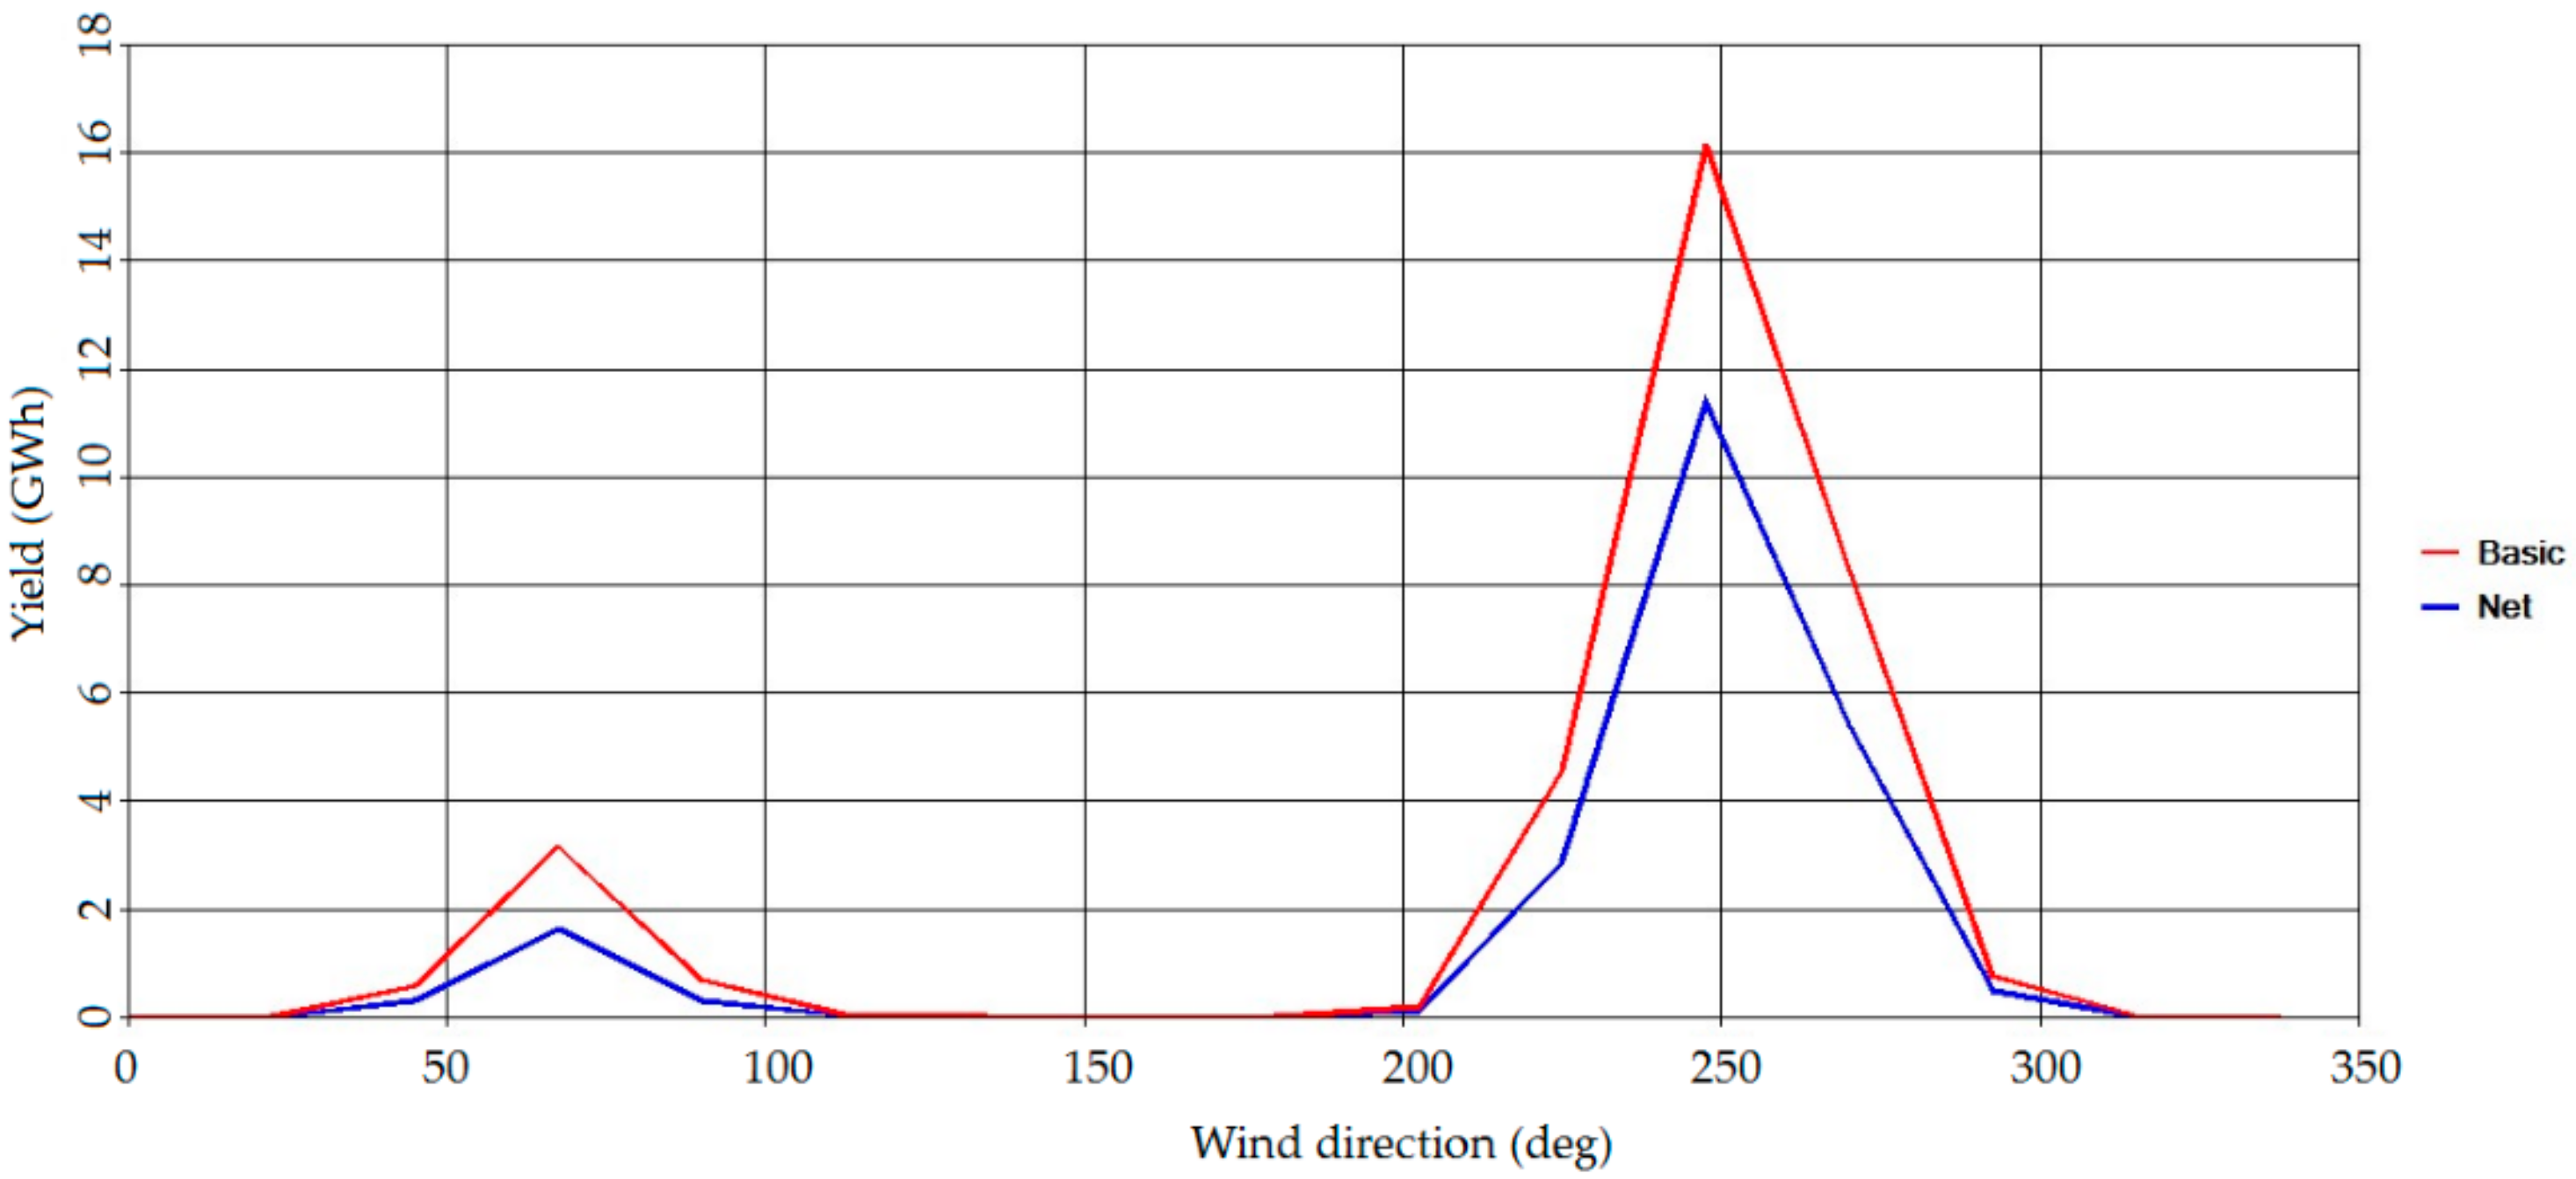
5.2. Energy Yield
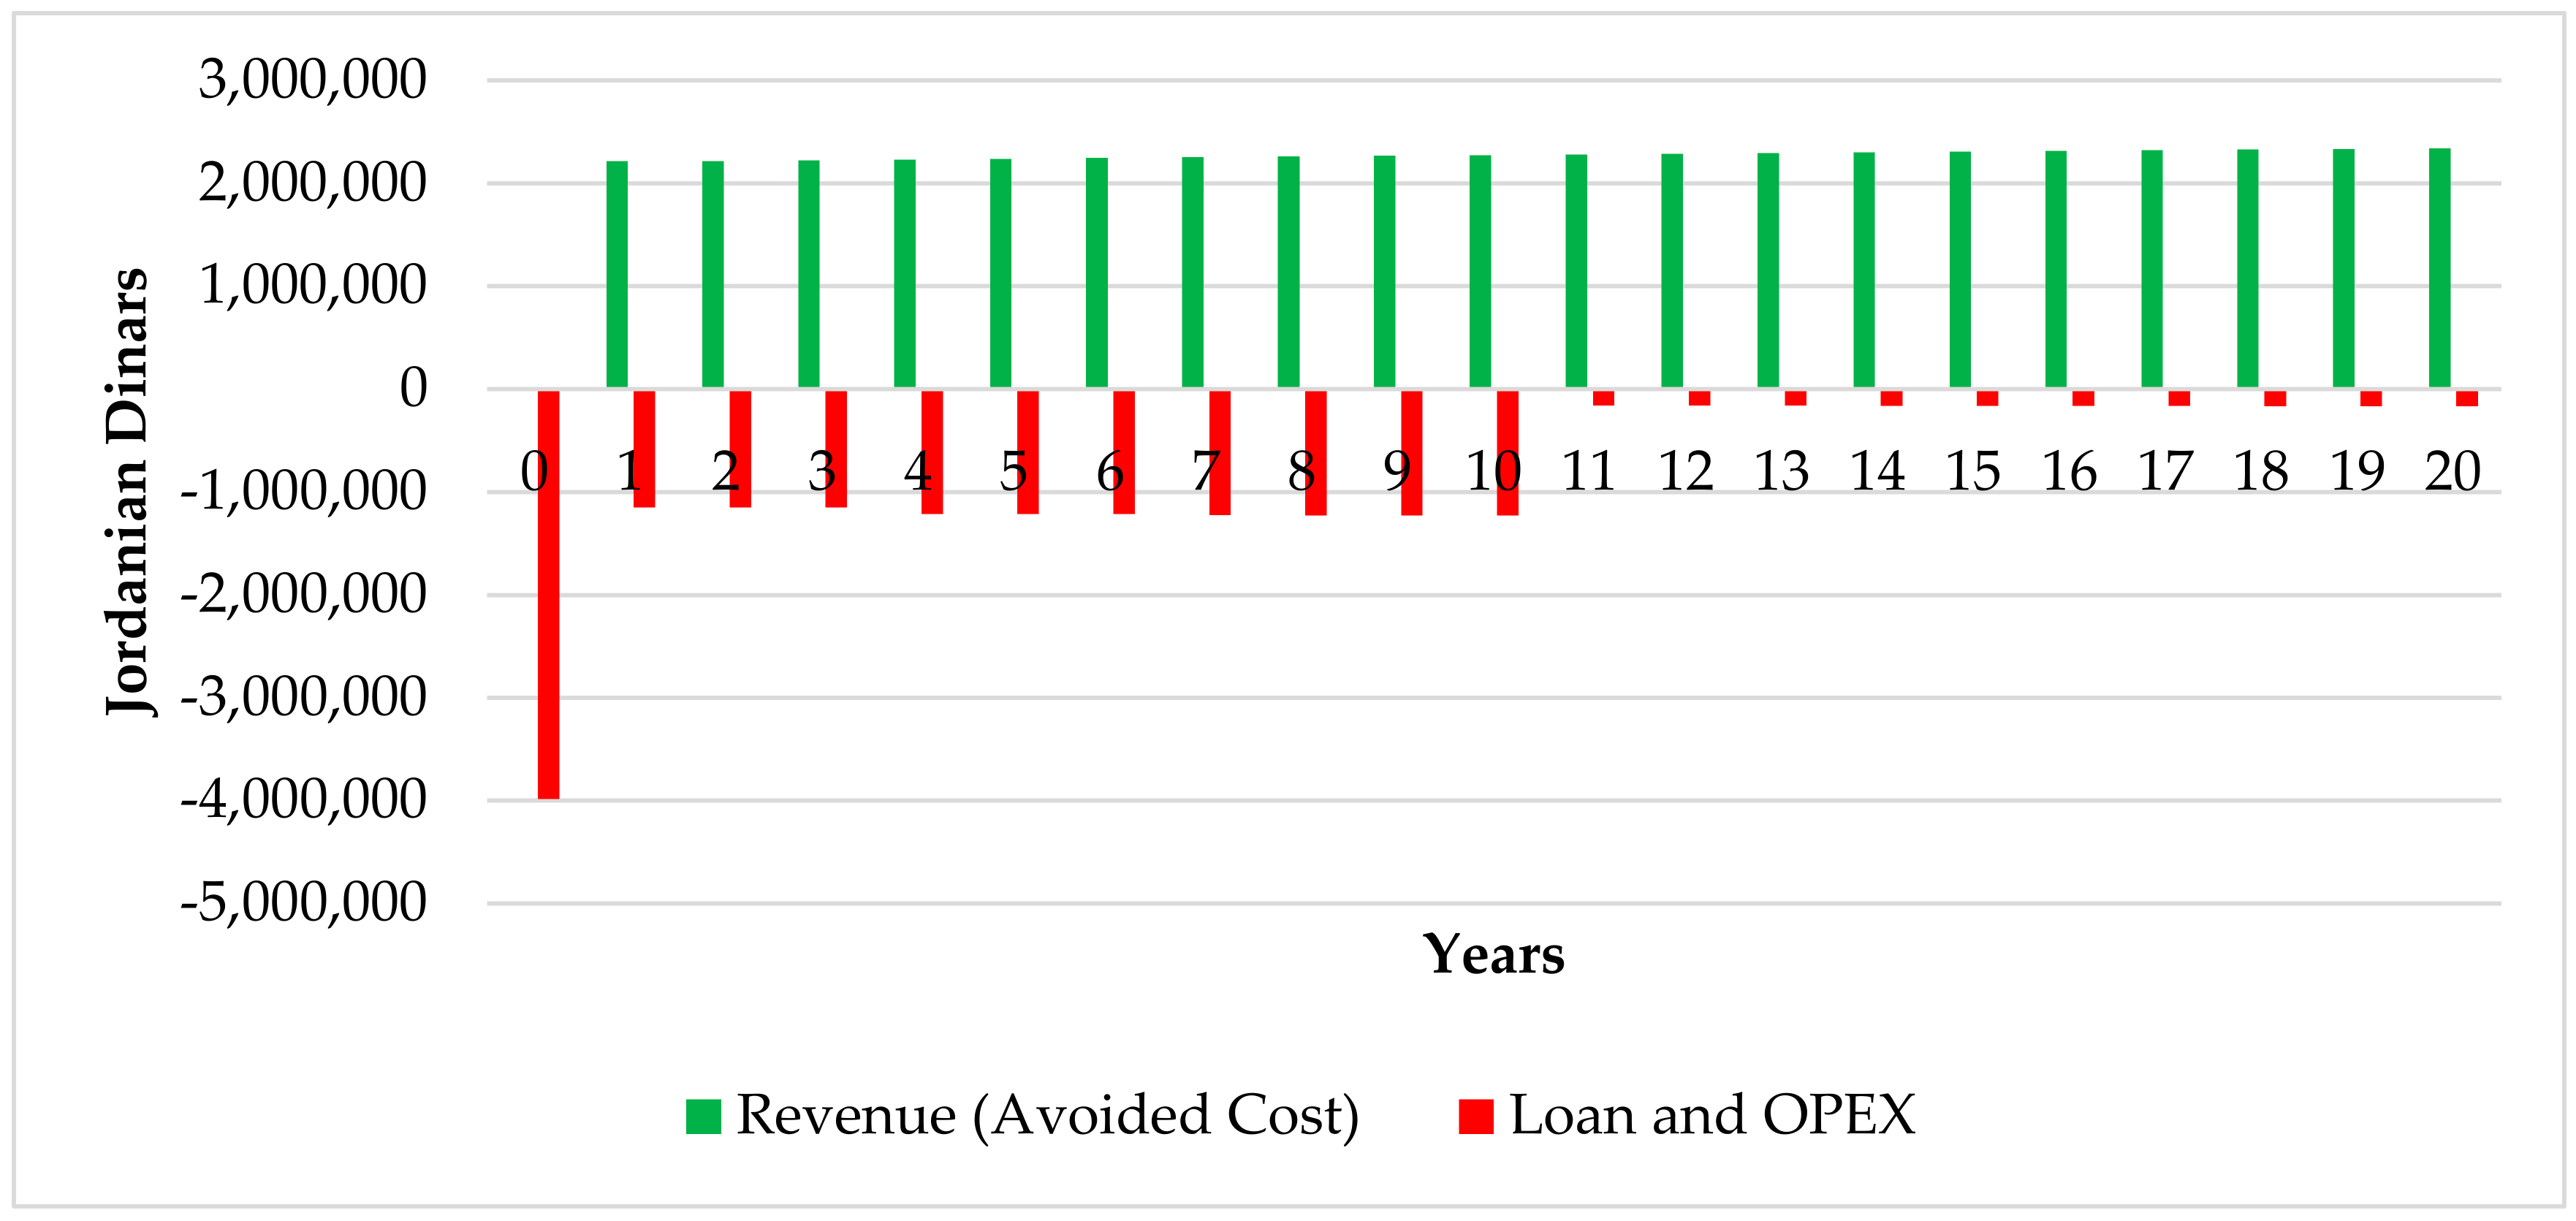
5.3. Economic Results
- Availability of the initial percentage of the grant.
- Availability of the lending institute (bank) providing the long-term loan estimated interest rate for the initial cost.
- The technical capability of the technical team in NEPCO to operate and maintain the system.
- Stability of the selling energy price for the entire project lifetime.
- The cost of the spare parts if needed during the lifetime of the project.
6. Conclusions
Author Contributions
Funding
Acknowledgments
Conflicts of Interest
References
- Jordanian Ministry of Environment. Jordan’s Third National Communication on Climate Change 2014; Jordanian Ministry of Environment: Amman, Jordan, 2014. Available online: https://unfccc.int/resource/docs/natc/jornc3.pdf (accessed on 15 March 2020).
- Jordanian Ministry of Energy and Mineral Resources. Energy Annual Report in 2016; Jordanian Ministry of Energy and Mineral Resources: Amman, Jordan, 2016. Available online: https://www.greengrowthknowledge.org/sites/default/files/downloads/policy-database/JORDAN%29%20The%20Ministry%20of%20Energy%20and%20Mineral%20Resources%2C%20Annual%20Report%202016.pdf (accessed on 15 March 2020).
- Rehman, S.; Al-Hadhrami, L.M.; Alam, M.M. Pumped Hydro Energy Storage System: A Technological Review. Renew. Sustain. Energy Rev. 2015, 44, 586–598. [Google Scholar] [CrossRef]
- Deane, J.P.; Gallachóir, Ó.B.P.; McKeogh, E.J. Techno-Economic Review of Existing and New Pumped Hydro Energy Storage Plant. Renew. Sustain. Energy Rev. 2010, 14, 1293–1302. [Google Scholar] [CrossRef]
- Ibrahim, H.; Ilinca, A.; Perron, J. Energy Storage Systems—Characteristics and Comparisons. Renew. Sustain. Energy Rev. 2008, 12, 1221–1250. [Google Scholar] [CrossRef]
- Katsaprakakis, D.A.; Christakis, D.G.; Zervos, A.; Papantonis, D.; Voutsinas, S. Pumped Storage Systems Introduction in Isolated Power Production Systems. Renew. Energy 2008, 33, 467–490. [Google Scholar] [CrossRef]
- EIA. Annual Energy Review 2008; Energy Information Administration, Official Energy Statistics from the US Government; EIA: Washington, DC, USA, 2008. Available online: https://www.eia.gov/totalenergy/data/annual/archive/038408.pdf (accessed on 15 March 2020).
- The Federation of Electricity Companies of Japan. (FEPC). Available online: http://www.fepc.or.jp/english/library/electricity_eview_japan/index.html (accessed on 13 March 2020).
- Briongos, F.; Platero, C.A.; Sánchez-Fernández, J.A.; Nicolet, C. Evaluation of the Operating Efficiency of a Hybrid Wind–Hydro Powerplant. Sustainability 2020, 12, 668. [Google Scholar] [CrossRef]
- Li, R.; Wu, B.; Li, X.; Zhou, F.; Li, Y. Design of wind-solar and pumped-storage hybrid power supply system. In Proceedings of the 2010 3rd IEEE International Conference on Computer Science and Information Technology (ICCSIT), Chengdu, China, 9–11 July 2010; Volume 5, pp. 402–405. [Google Scholar]
- Pérez-Díaz, J.I.; Perea, A.; Wilhelmi, J.R. Optimal short-term operation and sizing of pumped storage power plants in systems with high penetration of wind energy. In Proceedings of the 2010 7th International Conference on the European Energy Market (EEM), Madrid, Spain, 23–25 June 2010; pp. 1–6. [Google Scholar]
- Islam, M.R.; Mekhilef, S.; Saidur, R. Progress and recent trends of wind energy technology. Renew. Sustain. Energy Rev. 2013, 21, 456–468. [Google Scholar] [CrossRef]
- Al-Masri, H.M.K.; Al-Quraan, A.; AbuElrub, A.; Ehsani, M. Optimal Coordination of Wind Power and Pumped Hydro Energy Storage. Energies 2019, 12, 4387. [Google Scholar] [CrossRef]
- Bessa, R.; Moreira, C.; Silva, B.; Matos, M. Handling renewable energy variability and uncertainty in power systems operation. Wiley Interdiscip. Rev. Energy Environ. 2014, 3, 156–178. [Google Scholar] [CrossRef]
- Anagnostopoulos, J.S.; Papantonis, D.E. Simulation and size optimization of a pumped–storage power plant for the recovery of wind-farms rejected energy. Renew. Energy 2008, 33, 1685–1694. [Google Scholar] [CrossRef]
- Bueno, C.; Carta, J.A. Wind Powered Pumped Hydro Storage Systems, a Means of Increasing the Penetration of Renewable Energy in the Canary Islands. Renew. Sustain. Energy Rev. 2006, 10, 312–340. [Google Scholar] [CrossRef]
- Papaefthymiou, S.V.; Karamanou, E.G.; Papathanassiou, S.A.; Papadopoulos, M.P. A Wind-Hydro-Pumped Storage Station Leading to High RES Penetration in the Autonomous Island System of Ikaria. IEEE Trans. Sustain. Energy 2010, 1, 163–172. [Google Scholar] [CrossRef]
- Kapsali, M.; Anagnostopoulos, J.S.; Kaldellis, J.K. Wind Powered Pumped-Hydro Storage Systems for Remote Islands: A Complete Sensitivity Analysis Based on Economic Perspectives. Appl. Energy 2012, 99, 430–444. [Google Scholar] [CrossRef]
- Connolly, D.; Lund, H.; Mathiesen, B.V.; Pican, E.; Leahy, M. The Technical and Economic Implications of Integrating Fluctuating Renewable Energy Using Energy Storage. Renew. Energy 2012, 43, 47–60. [Google Scholar] [CrossRef]
- Deshmukh, M.K.; Deshmukh, S.S. Modeling of Hybrid Renewable Energy Systems. Renew. Sustain. Energy Rev. 2008, 12, 235–249. [Google Scholar] [CrossRef]
- Tilahun, M.A. Feasibility Study of Pumped Storage System for Application in Amhara Region, Ethiopia. Master’s Thesis, Department of Energy Technology, Division of Heat and Power Technology, Royal Institute of Technology, Stockholm, Sweden, 2012. [Google Scholar]
- Ma, T.; Yang, H.; Lu, L. Feasibility study and economic analysis of pumped hydro storage and battery storage for a renewable energy powered island. Energy Convers. Manag. 2014, 79, 387–397. [Google Scholar] [CrossRef]
- Al-Addous, M.; Saidan, M.; Bdour, M.; Dalala, Z.; Albatayneh, A.; Class, C.B. Key Aspects and Feasibility Assessment of a Proposed Wind Farm in Jordan. Int. J. Low-Carbon Technol. 2019, 15, 97–105. [Google Scholar] [CrossRef]
- Saidan, M.N.; Drais, A.A.; Al-Manaseer, E. Solid waste composition analysis and recycling evaluation: Zaatari Syrian refugees camp, Jordan. J. Waste Manag. 2017, 61, 58–66. [Google Scholar] [CrossRef] [PubMed]
- Hadadin, N. Dams in Jordan Current and Future Perspective. Can. J. Pure Appl. Sci. 2015, 9, 3279–3290. [Google Scholar]
- Sahil, B.M. Design and Analysis of a Hybrid Power System (Wind-Hydroelectric with Water Pumping Storage). Master Thesis, German Jordanian University, Amman, Jordan, 2018. [Google Scholar]
- WindFarm Version 4; Computer Program; ReSoft Ltd., Chester House: London, UK, 2018.
- Al-Addous, M.; Jaradat, M.; Albatayneh, A.; Wellmann, J.; Al Hmidan, S. The Significance of Wind Turbines Layout Optimization on the Predicted Farm Energy Yield. Atmosphere 2020, 11, 117. [Google Scholar] [CrossRef]
- Kaldellis, J.K. The contribution of small hydro power stations to the electricity generation in Greece: Technical and economic considerations. Energy Policy 2007, 35, 2187–2196. [Google Scholar] [CrossRef]
- Montgomery, D.C. Design and Analysis of Experiments, 8th ed.; Arizona State University John Wiley & Sons, Inc.: Hoboken, NJ, USA, 2012. [Google Scholar]
- Sullivan, W.G.; Wicks, E.M.; Koelling, C.P. Engineering Economy, 16th ed.; Pearson/Prentice Hall: Upper Saddle River, NJ, USA, 2014. [Google Scholar]


| Parameter | Specification | |
|---|---|---|
| Cost (Million JD) | 34 | |
| Commissioning Date | 1977 | |
| Dam Body | Dam Type | Earth fill |
| Dam Height (m) | 108 | |
| Dam Length, Width-at the top of the dam (m) | 350, 11.5 | |
| Concrete Rubble Volume (million m3) | 5.7 | |
| Fluid Discharge Power (m3/s) | 4500 | |
| Dam Spillway Width, DS slope m/m (m) | 35, 1.7/1 | |
| Dam Lake | Dam Lake Area (km2) | 4.8 |
| Storage Capacity (million m3) | 75 | |
| Annual Rate of Evaporation (million m3) | 4.3 | |
| Hydrology | Pond area (km2) | 3700 |
| Average Annual Precipitation of the basin (mm) | 250 | |
| River Name | Zarqa | |
| Parameter | Specifications | |
|---|---|---|
| WIND TURBINE Vestas V90 | 90,0000 JOD/MW | |
| Total Cost for 10 MW | Cost per MW | |
| Lump Sum for Transportation | 309,350 | 30,935 |
| Lump Sum for Wind Turbine Generator WTG Erection | 250,000 | 25,000 |
| Lump Sum for Electrical Engineering | 189,302 | 18,930 |
| Lump Sum for Substation Civil Works | 98,430 | 9843 |
| Aqaba Port Storage Cost | 17,000 | 1700 |
| Lump Sum for WTG Civil Works | 923,566 | 92,357 |
| Total | 1,787,647 | 178,765 |
| Total Estimation Cost per MW | 1,078,765 | |
| Pumping Size 5.20 MW | Cost per MW | |
|---|---|---|
| Electrical Cost JOD | 800,000 | 153,846.15 |
| Mechanical Cost | 700,000 | 134,615.38 |
| Project Management Cost | 40,000 | 7,692.31 |
| Commissioning Cost | 30,000 | 5,769.23 |
| Civil Works: | 600,000 | 115,384.62 |
| Labor Cost | 180,000 | 34,615.38 |
| Development Cost | 141,000 | 27,115.38 |
| Total Cost | 2,491,000 | 479,038.46 |
| Parameter | Value | |
|---|---|---|
| Wind park size | 10 MW | |
| Pumping Storage system | 5.2 MW | |
| Land Cost (100 decacre) | 0 JD | |
| Total Estimated Cost of Wind Park | 10,787,647 JD | |
| Pumping storage system estimated Cost | 2,491,000 JD | |
| Total Investment for Hybrid system | 13,278,647 JD | |
| Total Investment | Loan | Grant |
| 60% | 40% | |
| System life expectancy | 20 years | |
| Energy generation—Hybrid System | 26,663,938 KWh | |
| Selling price saving cost NEPCO-IDECO JOD/KWh | 0.08272 JD/kWh | |
| Annual inflation in tariff “estimated” | 0.5% | |
| Annual Growth rate in O&M cost | 0.6% | |
| Insurance “estimated” | 0.1% | |
| Annual Growth rate in Insurance | 0.3% | |
| Electromechanical (EM) components for depreciation | 90% | |
| Depreciation percentage of EM | 5% | |
| Cost of money | ||
| Loan Annual Reducing Interest Rate | 6% | |
| Discount Rate Capital | 6% | |
| Loan Period | 10 years | |
| Payments per Year | 12 | |
| Wind Turbine Identifier | Base Yield GWh | Topographic Effects % Change | Wake Losses % Loss | Total Yield GWh |
|---|---|---|---|---|
| 1 | 6.89 | −33.41 | −2.70 | 4.47 |
| 2 | 6.89 | −26.71 | −5.50 | 4.77 |
| 3 | 6.89 | −16.33 | −4.00 | 5.54 |
| 4 | 6.89 | −53.50 | −1.44 | 3.19 |
| 5 | 6.89 | −30.88 | −1.02 | 4.72 |
| Total | 34.45 | −32.17 | −3.11 | 22.69 |
| Parameter | Value | Value |
|---|---|---|
| Discount Rate | 3% | 6% |
| Payback Period | 10.26 Years | 8.59 Years |
| NPV | 13,207,457 JD | 9,644,455 JD |
| IRR | 9.42% | 9.79% |
© 2020 by the authors. Licensee MDPI, Basel, Switzerland. This article is an open access article distributed under the terms and conditions of the Creative Commons Attribution (CC BY) license (http://creativecommons.org/licenses/by/4.0/).
Share and Cite
Al-Addous, M.; Al Hmidan, S.; Jaradat, M.; Alasis, E.; Barbana, N. Potential and Feasibility Study of Hybrid Wind–Hydroelectric Power System with Water-Pumping Storage: Jordan as a Case Study. Appl. Sci. 2020, 10, 3332. https://doi.org/10.3390/app10093332
Al-Addous M, Al Hmidan S, Jaradat M, Alasis E, Barbana N. Potential and Feasibility Study of Hybrid Wind–Hydroelectric Power System with Water-Pumping Storage: Jordan as a Case Study. Applied Sciences. 2020; 10(9):3332. https://doi.org/10.3390/app10093332
Chicago/Turabian StyleAl-Addous, Mohammad, Sahil Al Hmidan, Mustafa Jaradat, Emil Alasis, and Nesrine Barbana. 2020. "Potential and Feasibility Study of Hybrid Wind–Hydroelectric Power System with Water-Pumping Storage: Jordan as a Case Study" Applied Sciences 10, no. 9: 3332. https://doi.org/10.3390/app10093332
APA StyleAl-Addous, M., Al Hmidan, S., Jaradat, M., Alasis, E., & Barbana, N. (2020). Potential and Feasibility Study of Hybrid Wind–Hydroelectric Power System with Water-Pumping Storage: Jordan as a Case Study. Applied Sciences, 10(9), 3332. https://doi.org/10.3390/app10093332