Article

Characterization of Shear Strain on PDMS: Numerical and Experimental Approaches

1
Instituto Politécnico de Bragança (IPB), 5300-253 Bragança, Portugal
2
Centro Federal de Educação Tecnológica Celso Suckow da Fonseca campus Angra dos Reis (CEFET/RJ), Angra dos Reis 23953-030, Rio de Janeiro, Brazil
3
CIMO, Instituto Politécnico de Bragança, 5300-253 Bragança, Portugal
*
Author to whom correspondence should be addressed.
Appl. Sci. 2020, 10(9), 3322; https://doi.org/10.3390/app10093322
Submission received: 24 April 2020 / Accepted: 30 April 2020 / Published: 10 May 2020
(This article belongs to the Section Mechanical Engineering)

Abstract

:
Polydimethylsiloxane (PDMS) is one of the most popular elastomers and has been used in different fields, especially in biomechanics research. Among the many interesting features of this material, its hyperelastic behavior stands out, which allows the use of PDMS in various applications, like the ones that mimic soft tissues. However, the hyperelastic behavior is not linear and needs detailed analysis, especially the characterization of shear strain. In this work, two approaches, numerical and experimental, were proposed to characterize the effect of shear strain on PDMS. The experimental method was implemented as a simple shear testing associated with 3D digital image correlation and was made using two specimens with two thicknesses of PDMS (2 and 4 mm). A finite element software was used to implement the numerical simulations, in which four different simulations using the Mooney–Rivlin, Yeoh, Gent, and polynomial hyperelastic constitutive models were performed. These approaches showed that the maximum value of shear strain occurred in the central region of the PDMS, and higher values emerged for the 2 mm PDMS thickness. Qualitatively, in the central area of the specimen, the numerical and experimental results have similar behaviors and the values of shear strain are close. For higher values of displacement and thicknesses, the numerical simulation results move further away from experimental values.

1. Introduction

In recent decades, elastomers have been studied by many researchers due to their interesting characteristics, such as chemical stability, flexibility, and corrosion resistance. Among them, polydimethylsiloxane (PDMS) is one of the most studied because it has many applications in several industrial areas, from mechanics and electronics to the biomedical area, because it is an optically transparent material [1], biocompatible [2], chemically and thermally stable, highly flexible and viscoelastic [3]. PDMS has a high range of applications in mechanical sensors [4], flexible electronic components [5], electrochemical sensors [6] and the biomedical field [7] and it is also frequently found in microfluidic circuits [8], among others. In many of these applications, the elements are subjected to shear stresses, such as sealing gaskets [9], microfluidic channels [10], aneurysm studies [11], tactile sensors [12], robotics [13] and electronic components [14]. Among these, an area that recently gained significant interest was the flexible microfluids and milifluids, where it is possible to analyze the interaction between fluid and structure, which is an emerging area that may affect several areas of research, such as electronics, biology and medicine [15]. These channels are subject to shear forces. Rodrigues et al. [11] carried out studies on flexible PDMS models to study the interaction between fluids (blood analog) and the structure of the intracranial aneurysm. From this study, it was found that the displacement value on the channel wall was very low, thus showing the need to determine values for shear and tensile tests for small deformations. Therefore, there is a need to study and characterize the mechanical behavior of PDMS under shear stress action and, in this sense, research work has been developed [16,17] that refers to the implementation of tensile tests on simple lap joints associated with digital image correlation (DIC) as well as the determination of their shear modulus [18].
To characterize the mechanical behavior of a material when it is subject to a shear loading, it is usually required to perform shear tests. Typically, shear tests were implemented using specimens that are fixed in two holding grips and incremental displacement values are applied in one of the holding grips. Usually, the main objective of this test is to determine the shear strength, which corresponds to the maximum shear stress that the material can withstand before rupture. However, in the study of materials with high elasticity, as in the case of the hyperelastic materials, there is a great interest in understanding how its deformation occurs when subjected to shear forces. In this case, it is necessary to accompany the deformation during the test before breaking visually. Experimental optical techniques are an interesting alternative. These techniques have the advantage of accessing displacement and strain fields, are non-contact techniques, have high resolution and can use white light or laser illumination. Optical methods, such as DIC [19], geometric or interferometric Moiré [20], and speckle or holographic interferometry [21], are available with resolution up to the laser wavelength. Despite high resolution of all interferometric techniques, image decorrelation for high deformation values frequently occurs. This phenomenon usually occurs in tests of hyperelastic materials, as such, they are inadequate for studying these materials. In contrast, DIC allows the measurement of displacement and strain fields for high deformation values.
The experimental characterization of the mechanical behavior of hyperelastic materials, when subjected to the action of shear forces, has the advantage of allowing more accurate and realistic results; however, its implementation requires laboratory facilities and costly equipment. On the other hand, there has been an exponential growth in the use of numerical tools based on the finite element method (FEM) [22,23]. The appearance of computational tools applied to hyperelastic materials is due to lower costs of the method and the increase in the calculation capacity of the computers. For numerical simulation with hyperelastic materials, it is necessary to use constitutive models that are adequate to the material under study and tensile tests (uni or biaxial) are usually required to better characterize this material [24]. Considering the advantages of each approach, both experimental and numerical, some researchers have developed hybrid methods that use experimental information in numerical simulations [25].
The purpose of this work is to characterize the mechanical behavior of PDMS through an experimental method using 3D DIC and comparing it with four different numerical constitutive models. For this, two models with varying thicknesses of simple lap joints with PDMS were developed, and the results of the experimental tests were compared with the numerical simulation. Thus, the information contained in this work will serve to support the development of devices made in PDMS that are subject to shear loads, as for example in recent applications in flexible microfluids [15].

2. Numerical Constitutive Models

Currently, FEM has been used to study the mechanical behavior of hyperelastic materials. These studies are based on mechanical models obtained from experimental uniaxial tests. To numerically reproduce the nonlinear hyperelastic behavior of this material, it is necessary to develop new and more accurate constitutive models. The developments of hyperelastic models are supported in two different theories, the micromechanical and macro mechanical models. Micromechanical models are developed from chemical manufacture and are based on the concept of the unit cell. The second theory, phenomenological models are based on the material behavior observed during experimental tests. For developing these models, it is necessary to know the mechanical behavior of the material through the experimental tensile test [26].
Hyperelastic materials are known to have a nonlinear relationship between stress and strain. Thus, hyperelastic material behavior is usually defined based on strain energy or stored energy.
Hyperelastic materials are commonly defined as having nonlinear mechanical properties, presenting high deformation rates. The theory of hyperelastic material behavior, also known as Green elastic material, is defined as a function of the Helmholtz free energy, also called the strain energy or stored energy (Ψ). This describes the behavior of this class of materials in terms of mechanical energy and can be defined according to the following equation:
P = Ψ F
or, more generally:
P = p F T + Ψ F
where P is the first stress tensor of Piola-Kirchhoff, FT is the transposed deformation gradient and p is a multiple of Lagrange obtained according to the state of tension T.
Helmholtz free energy (Ψ) is a thermodynamic potential that measures the useful work for a closed thermodynamic system with constant temperature and volume [27].
A model of hyperelastic materials depends on the definition of the strain energy function, which assumes different shapes, according to the material or class of materials considered. This function is obtained from symmetry and thermodynamic energy considerations [27].
For simplicity, it is assumed that the material is isotropic and incompressible. As an isotropic material, the strain energy function (Ψ) depends on the invariants of the deformation:
Ψ i s o t r o p i c = Ψ ( I 1 , I 2 , I 3 )
where the invariants are defined as:
I 1 = i = 1 3 λ i 2 I 2 = i , j = 1 3 λ i 2 λ j 2   i j I 3 = i = 1 3 λ i 2
where λ1, λ2 and λ3 are the principal deformations.
If the material is too incompressible, the third invariant, I3, is 1 and Equation (5) is defined as:
Ψ 1 = Ψ ( I 1 , I 2 )
The constitutive equations of hyperelastic models are determined from the Cauchy tensor equation and the calibration of the main experimental tensile tests (uniaxial and biaxial). There are several constitutive equations for hyperelastic models, the most used models being the Yeoh, Mooney–Rivlin, polynomial, and Gent models.
Yeoh’s constitutive model is the most suitable for situations of an incompressible material, it was first presented in the early 1990s [28]. Moreover, the Yeoh model of hyperelastic materials has proved popular because it depends only on the first invariant deformation, (I1).
The Yeoh energy density function is given by [29]:
Ψ = i = 1 3 C i ( I 1 3 ) i
where C1, C2 and C3 are constants of the material that are determined from the experimental tests.
The Mooney–Rivlin model is one of the most known and used hyperelastic models, mainly in numerical simulations of rubbers and their derivates. This model is very widespread because it presents good convergence for a relatively large range of deformation [30].
Besides that, the classical Mooney–Rivlin stress-energy formula is used for incompressible hyperelastic materials and in the description of the behavior of incompressible isotropic materials like soft tissue [31].
The constitutive law Mooney–Rivlin derived for hyperelastic incompressible material is described as follows [31]:
Ψ = C 10 ( I 1 3 ) + C 01 ( I 2 3 )
where Ψ is the strain energy density function, I1 and I2 are the constant strain and C10 and C01 are the material constants.
The Ogden model is used to describe the nonlinear behavior of complex materials such as rubber, polymers and biological tissues. This model is described by the following expression:
Ψ = i = 1 N μ i α i ( λ 1 α i + λ 2 α i + λ 3 α i 3 )
where N is the total number of terms in the series and µi and αi are material constants that can be positive, negative, integer or not.
The polynomial model is also called the generalized Rivlin model [32,33]; this model was introduced by Rivlin and Saunders (1951). It was formulated in terms of two strain invariants, I1 and I2, of the left Cauchy-Green deformation tensor, with Cij denoting material constants. The strain energy is given by [34]:
Ψ = µ 2 J m ln ( 1 I 1 3 J m )
where µ is the initial shear modulus and Jm is the constant limiting value for I1 − 3.

3. Materials and Methods

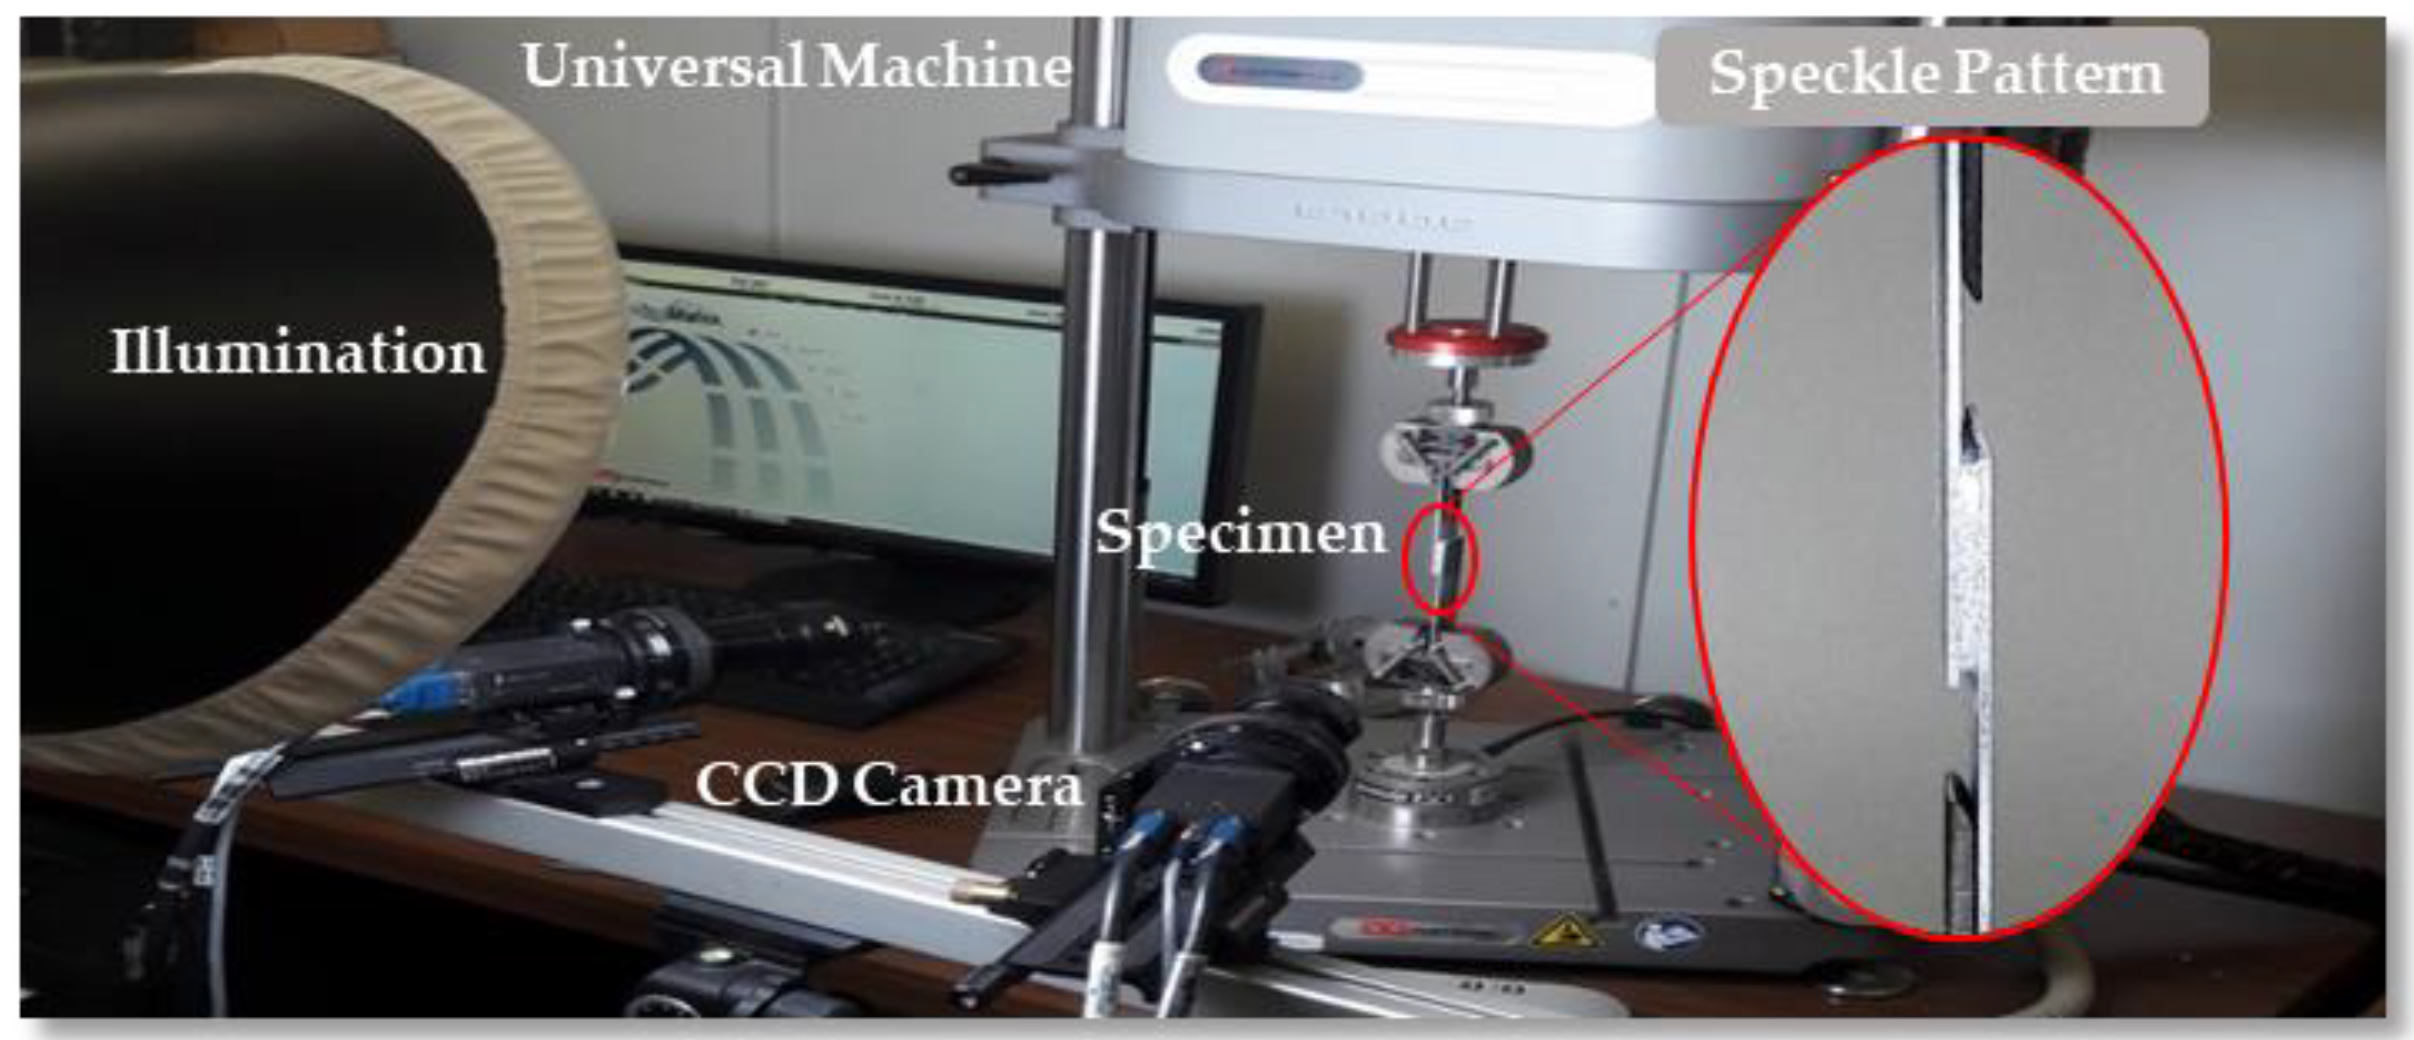
3.1. Experimental Tests

It was necessary to manufacture two molds in which the resin of the elastomeric polymer will be cast before polymerization to produce the tensile and shear specimens. The molds to obtain tensile and shear specimens were manufactured in an aluminium alloy (2011-T3) by a CNC milling machine (Deckel Maho—DMU 60 T from Germany); each mold had three and two cavities for tensile and shear specimens, respectively. The geometry and dimensions of tensile specimens were chosen to match the American Society for Testing of Materials ASTM D412 TYPE C standard [35].
The accuracy of tensile testing results is very depending of the dimensional and geometric precision of the specimen [36,37] which is depending of the stress state of the material namely the level of residual stresses of the material that will be machining. There are some authors who showed that for materials with a high level of residual stresses after a machining process the final dimensions and geometry could change significantly [38]. For this reason, after mold machining was controlled dimensional accuracy, surface finish and defects follow the recommendations of Dixit et al. [39]. This evaluation allows us to guarantee that the geometric and dimensional tolerances are within those recommended by the ASTM D412 TYPE C standard.
The polydimethylsiloxane (PDMS) used was Sylgard 184 ® by enterprise Dow Corning from Wiesbaden, Germany, To obtain the PDMS resin, it was necessary to mix the curing agent with the prepolymer; for each 10 g of prepolymer, 1 g of the curing agent was added (10: 1).
The mixture was placed under vacuum conditions for 40 min in a desiccator connected to a vacuum pump to eliminate air bubbles present in the uncured mixture. After removing all air bubbles, the mixture was poured into the tensile and shear molds, and the molds were placed back in the desiccator for approximately 30 min to ensure that all remaining bubbles were removed entirely. Part of this PDMS mixture was taken to measure the density using the pycnometer method, and the value of 1059 (kg/m3) was determined which is very similar to other references [40].
At the end of the process, the tensile and shear molds were taken to a temperature- and time-controlled oven, the mixture was cured at 80 °C for 45 min. A total of 3 samples were prepared for the tensile tests and three samples for each thickness of the simple shear test.
To verify the absence of voids (bubbles) with sizes that could influence the experimental tests, a scan was made in different regions of the specimen to identify any bubbles present inside it. For this, an inverted microscope CKX41 by Olympus Iberia from Japan, with an objective lens NCHROPLAN, 32× by ZEISS from Oberkochen (Germany) was used. After the images obtained, the imageJ software was used to check the bubble sizes found in the specimen, Figure 1 shows the microbubbles found. Through this test, it was found that the dimensions of the bubbles found were small (<5 µm), not significantly influencing the results obtained in the tensile tests.

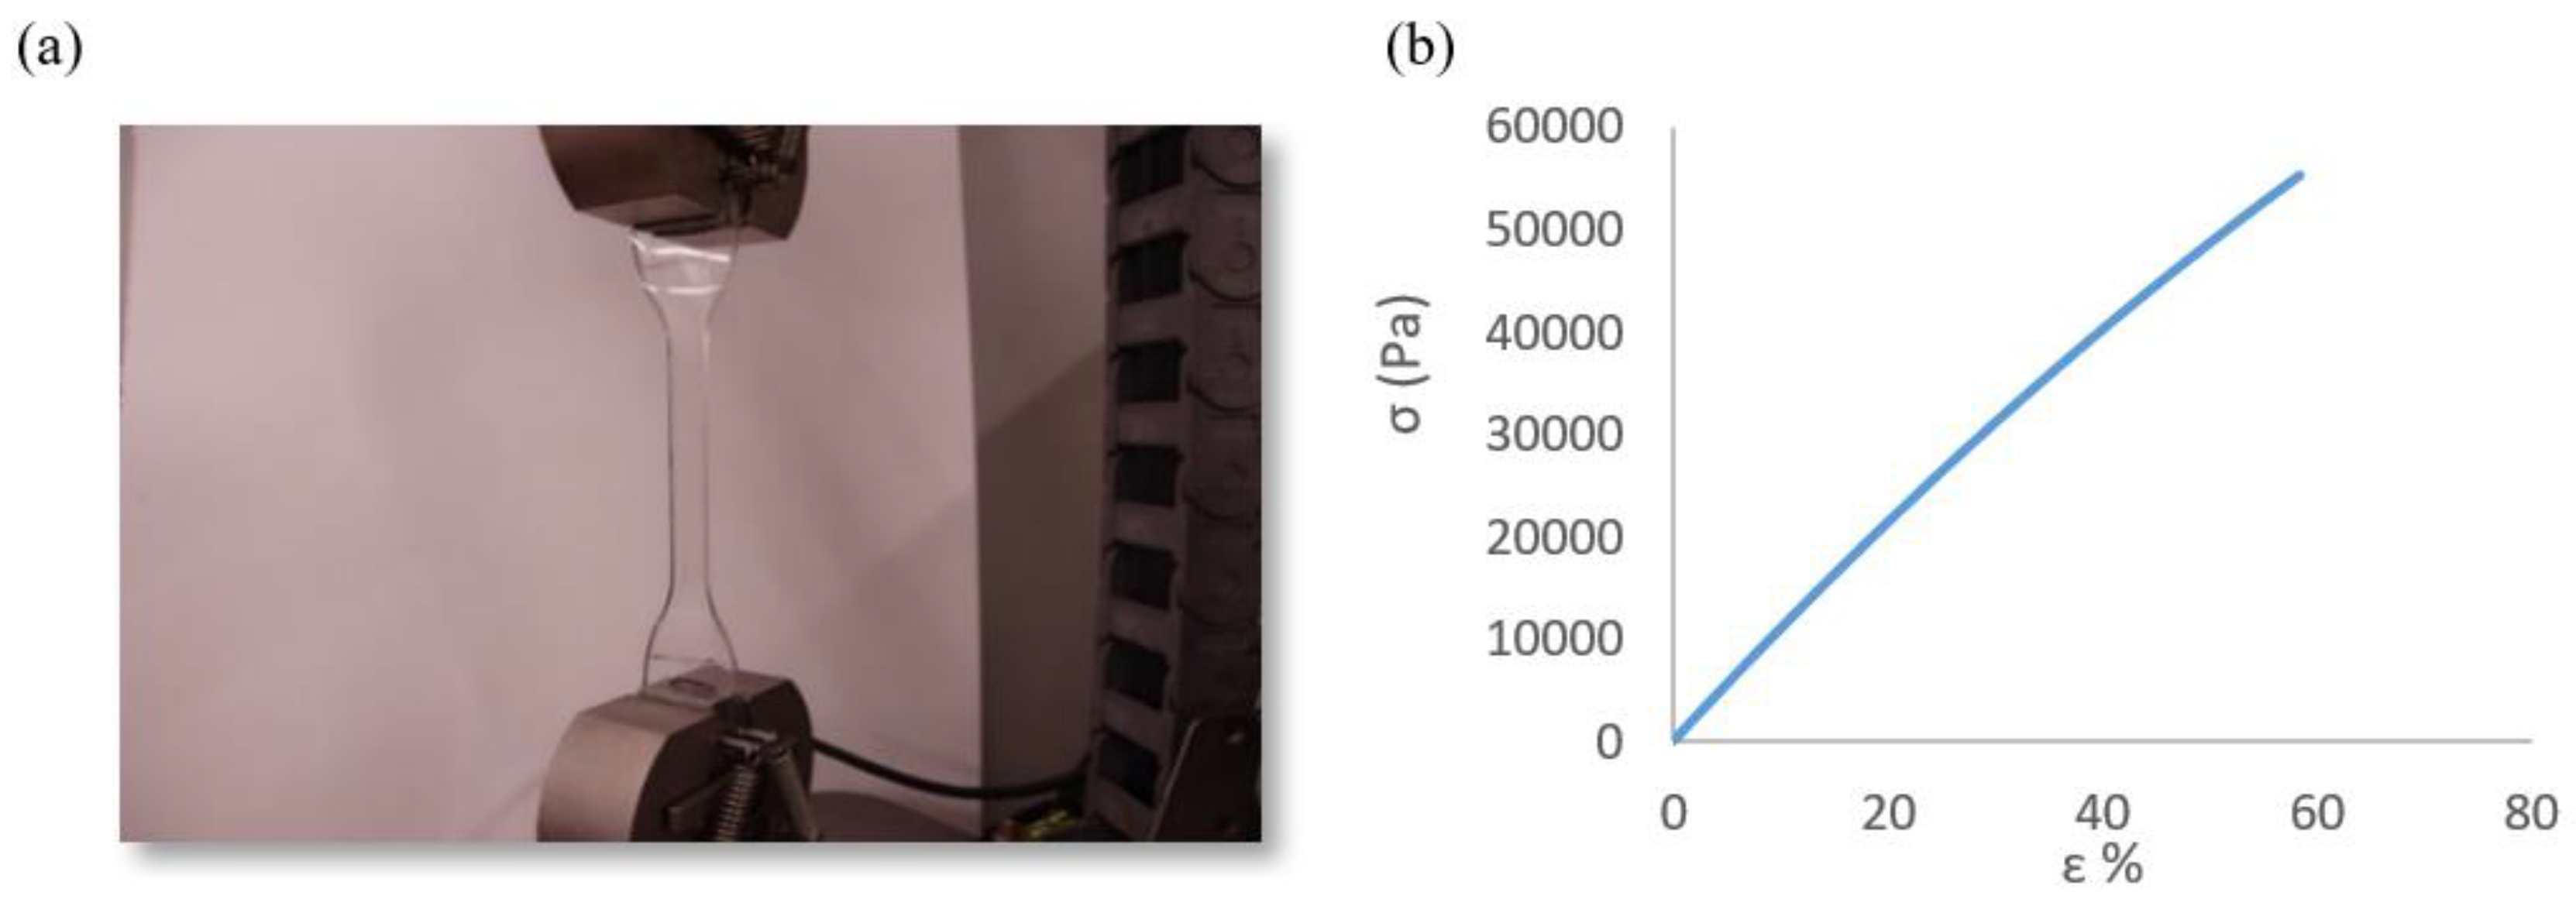
3.1.1. Tensile Testing

Adequate deformation measurement techniques are required to identify the mechanical properties of the materials. This test aims to characterize the mechanical behavior of the PDMS relative to the stress-strain curve and verify that it is non-linear and hyperelastic behavior.
The tensile test was started by placing the test specimen in the holding grip on both sides of the universal INSTRON E1000 tensile test machine from Norwood, United States of America (Figure 2a). The height was manually adjusted, ensuring that the test body was not drawn, that the claws were aligned, and that there was no force acting on the body. The test speed was 2 mm/min. Three tensile tests were implemented, and the average curve was used in the simulations, and a very similar trend was verified.
From the stress-strain curve analysis, the tested material (PDMS) has a high deformation at relatively low-stress levels (ex. 20,000 Pa imposes 18.5% of strain), which corresponds to the characteristic behavior of a hyperelastic material. Figure 2b shows the stress-strain curve of one of the tensile tests that was compared with the numerical tests.
The tensile test did not occur until rupture because the expected values of stress in shear tests were lower than the ultimate strength [20] and the most important reason to implement this test is to obtain the tensile stress-strain curve for use in numerical simulations of the shear test.

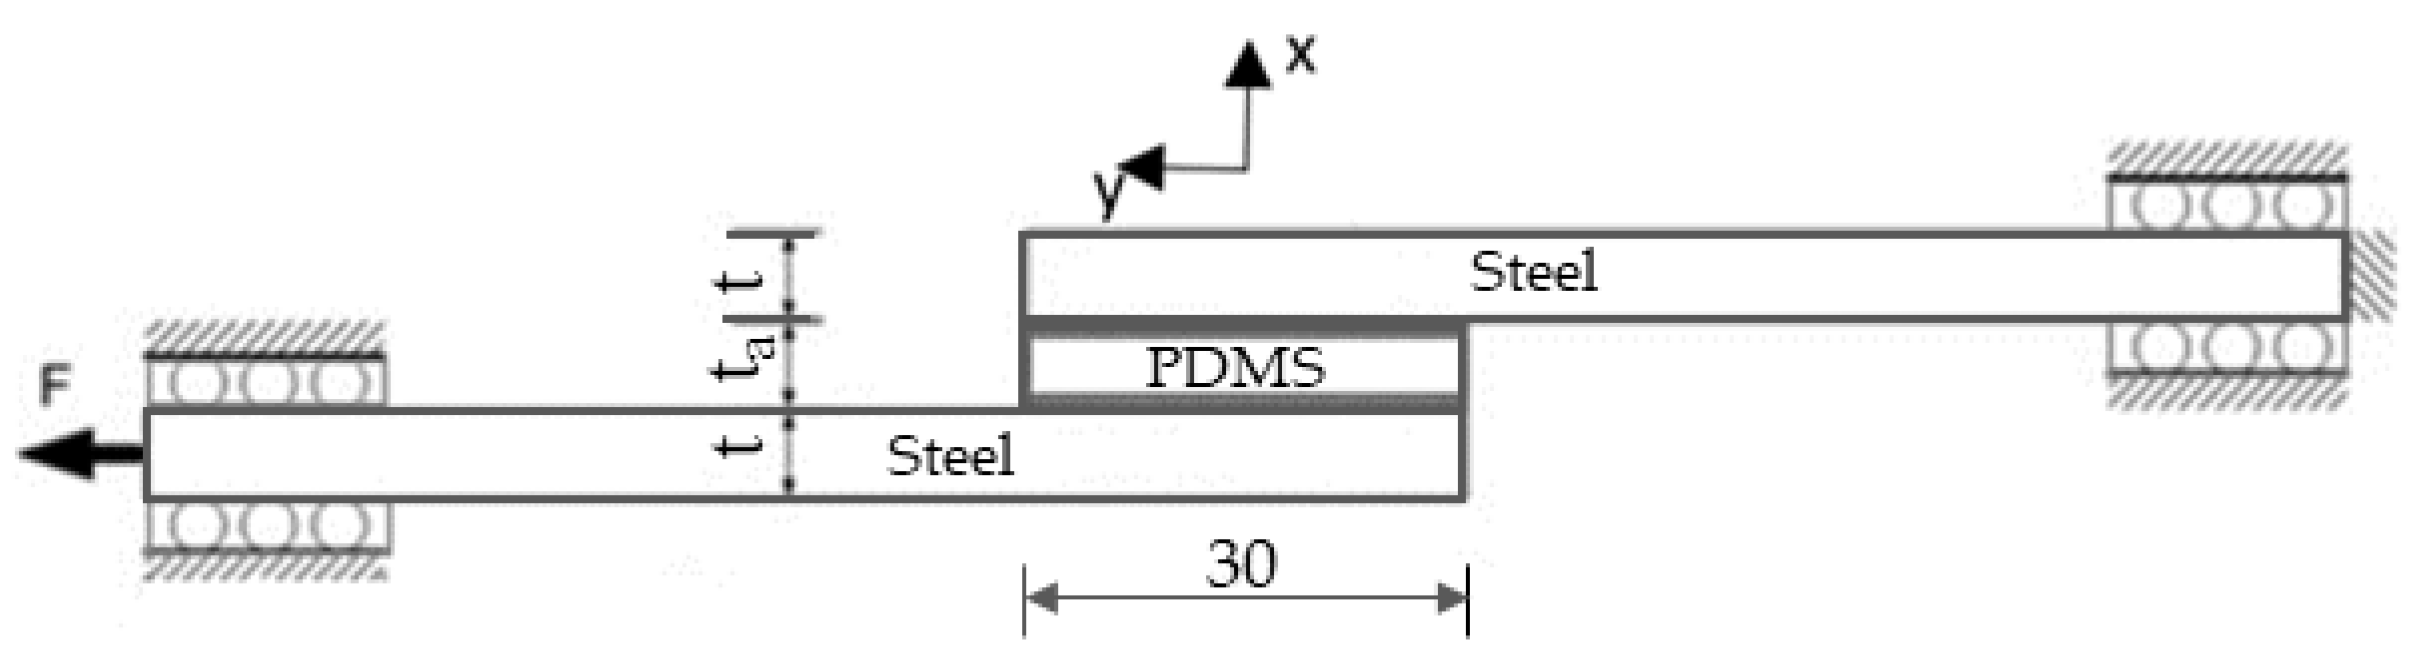
3.1.2. Shear Testing

In preparing the shear test specimen, two steel (DIN-Ck45) bars with 100 × 20 × 1.5 mm3 dimensions were used. The bars’ surfaces were sanded and degreased with acetone to improve the adhesion of the PDMS to the steel. After the cleaning, the PDMS bonding was done using a cyanoacrylate structural adhesive Locttice Super Glue 3 (Germany), presenting the following configuration Figure 3.
The bonded region of the steel plates had a superficial treatment. The process consisted of abrading the steel plate surfaces at the overlap region with fine sandpaper and cleaning with acetone before the application of the cyanoacrylate adhesive. To control and guarantee adhesive thickness, the test specimen (single-lap joint) was manufactured in a mold. The applied cure cycle was 24 h at room temperature.
For this test, two PDMS test samples with different thicknesses (2 and 4 mm) were tested. The equipment and procedure were like the tensile test, distinguished in that this test used different test pieces (simple lap joints). During the tensile test of the samples, a commercial Vic-3D by Correlated Solutions ® DIC system made it Dutchman Blvd. Irmo, SC, USA was used to measure the strain field in-plane and out-plane of the PDMS surface.
The DIC equipment used consisted of two high-resolution digital cameras (Point Gray GZL-CL-41C6M-C 2048 × 2048 pixels), using 80 mm LINOS objective lenses, a computer with Vic- 3D and a cold lighting bulb. The experimental set up used in this assay is shown in Figure 4.
For a good use of the DIC method, the specimen must be covered with a speckle pattern [41]. A random speckle pattern was artificially created on the PDMS specimen surface. The speckle pattern was produced using an airbrush with an internal mixture of air and paint, connected to a low-pressure compressor. First, the specimen surface was covered with white matte paint (the airbrush nozzle was adjusted to be approximately 0.3 m from the specimen). After drying the first layer, a second fine layer of small black paint dots was applied with the airbrush to produce the high-contrast speckle pattern. The size and density of the speckle were defined to guarantee high fluctuation of the image intensity; thus, higher accuracy measurements could be obtained.
System calibration was done first; this procedure is necessary to provide numerical factors that will aid in the analysis of the data and to size the displacement unit. However, the calibration process of the VIC-3D system is direct and almost automatic. For 3D fields, it is necessary to use a standard calibration target; this target is positioned in front of the cameras in different positions, and several images are captured that are used to calculate the intrinsic and extrinsic parameters of the cameras. This procedure removes distortions of the lenses and defines a three-dimensional coordinate system on the surface of the sample. These parameters will subsequently be used to determine the displacement values. The two CCD cameras were positioned at 341 millimetres and a 12.5° angulation of the specimen, and the correlation equipment was adjusted so that two photos of the sample were captured per second. Once the adjustment was made, the specimen was clamped between the universal machine claws. Two alignment guides were positioned to restrict lateral movement, thus ensuring that the deformation occurred only in the PDMS plane.
Then, the tensile test was carried out until specimen rupture occurred. The software that controls the universal test machine controlled the speed of the test (2 mm/min). The room temperature was 25 °C. The DIC system was synchronized with the universal machine, the reference image was captured a few seconds before the shear test, and the cameras’ triggers were initiated when the test began, at an acquisition rate of two images per second. The captured images were saved to the hard-disc of the DIC computer.
To analyse the influence of cyanoacrylate in rupture process was implemented a shear test using a similar specimen (simple overlap joint). The adherents have the same dimensions and material (steel) and the adhesive was the same type of cyanoacrylate (Locttice Super Glue 3) with a thickness of 0.3 mm. Was applied the speed test of 2 mm/min and the test occurred until the rupture. Were implemented two tests.

3.2. Numerical Simulation

The numerical simulation was executed using a commercial finite element method (FEM) software ANSYS ® R18.1 academic research mechanical license.
A model with a geometry similar to the specimens, boundary conditions matching the experimental testing and a discretized domain finite element mesh were required to perform the numerical simulation. The loading and kinematic conditions were identical to those used in the experimental test. Nonlinear hyperelastic behaviors based on the constitutive models of Mooney–Rivlin, Yeoh, polynomial and Gent were considered for the PDMS material. Many authors recommend these models for simulating PDMS materials [19,42]. The application of these models required determining several constants, which were identified from the experimental curves of the tensile tests. However, the steel bars were considered to have a linear elastic behavior and the mechanical properties used were Young’s modulus of 210 GPa and Poisson’s ratio of 0.3. In the present simulation, the PLANE183 element considering the plane stress condition was used. PLANE183 is a higher-order 2-D, 8-node element with two degrees of freedom at each node and a quadratic displacement behavior well suited for the hyperelastic application and modelling irregular meshes.
As with the previous equations, all the present constitutive models need to have specific constants and coefficients determined, and for that, the experimental stress-strain curve is used. The constants and coefficients of the material are estimated from hyperelastic curve-fitting. Figure 5 shows the curve-fitting for the constitutive models used in this work. The black circle represents the experimental data, and the others represent the constitutive models.
The geometry of the specimen was experimentally tested to implement the numerical solution. With the same dimensions and conditions as the experimental study, the boundary conditions were the bottom edge clamped and constant displacements in the vertical direction on the upper edge of the model.
Table 1 presents the applied displacements in the numerical simulations for both geometries. Numerical simulation 1 corresponds to the 2 mm PDMS thickness and numerical simulation 2 is 4 mm PDMS thickness. The displacement values were the same that were used in experimental tests.
For the shear-stress study, the four constitutive models presented before were used to describe the properties of the sample, Mooney–Rivlin 3 parameter, Yeoh 3rd Order, polynomial 3rd Order, and Gent. All the models converged to a similar response.
For this study, as the focus is on the reaction of the central region of PDMS to the shear test, a path operation command was defined in the numerical simulation. This function makes it possible to trace a path and analyse the mechanical behavior in a specific region. The defined path is shown in Figure 6, where XY shear strain was studied in both samples, on the 41 nodes selected.
The numerical simulations were used as a mesh divergence with 20 finite elements horizontally spaced equally in the PDMS region. Five different areas were created in the geometric model to obtain a better result refinement at the sample.
In the discretization of the areas adjacent to the PDMS, a 0.5 mm ratio was used for the elements to create a greater convergence in the model. The mesh has 1000 elements and 3161 nodes.
In the analysis option, the large displacement static was chosen because the maximum number of sub-steps was defined as 150 and the minimum as 100.
It is necessary to define a convergence criterion to solve this type of nonlinear structural analysis. In the present study, convergence was met by combining the static modal forces through the Newton–Raphson method.

4. Results and Discussion

4.1. Experimental

Figure 7 shows the force-displacement curves obtained from the shear tests. The red line represents the results of the specimen with 4 mm PDMS thickness, and the blue one corresponds to the 2 mm thickness. The rupture of the specimen with 4 mm PDMS thickness occurred at higher values of force and displacement, 154 N and 2.8 mm, respectively. The specimen with 2 mm PDMS thickness, broke up for low values of force and displacement, 80 N and 0.8 mm, respectively. Despite the linear curve for both specimens, in the specimen with 2 mm, PDMS thickness an initial disruption happened before the complete rupture of the specimen.
Figure 8 and Figure 9 show the details of the PDMS region of the specimens for different test phases. Figure 8a and Figure 9a are the images of the specimens before the deformation (reference image), Figure 8b and Figure 9b show the beginning of rupture and, finally, Figure 8c and Figure 9c present the specimen after rupture.
For both specimens, the rupture happened in the interface between the metallic plate and the PDMS surface. That is, the rupture occurs in the adhesive region, which is the weakest element of the specimens. It was verified that all ruptures occurred in the interface between the PDMS and the cyanoacrylate. However, for cyanoacrylate shear tests the average of rupture force obtained was 1715 N which indicates that the cyanoacrylate strength is higher when the interface is the steel than when the interface is the PDMS. Another detail was that the rupture always happened in the PDMS surface that was in contact with air, not the surface in contact with the mold, probably because the surface roughness was lower. The authors believe that if they used a primer on the PDMS surface plate, the mechanical strength could improve. However, the goal of this work only analysed the displacement and shear strain before the rupture.
Figure 10a,b presents the shear strain field for the specimens with a 2 mm thickness PDMS plate and with a 4 mm thickness PDMS plate, respectively. These two images were captured in two different moments of the shear test or, in other words, for two different values of displacement. Figure 10a was obtained when the shear test reached 0.5 mm displacement, and Figure 10b shows the shear test when the displacement value was 0.2 mm. From Figure 10, the maximum shear strain happened in the central region of PDMS for both thicknesses of PDMS plate. However, the maximum shear strain values are different. That is, on the specimen with the smallest thickness, the value was −0.1025 [mm/mm], while the values decreased to −0.0213 [mm/mm] for the specimen with a 4 mm PDMS thickness.

4.2. Numerical

As previously mentioned, the four constitutive models presented were implemented in the numerical analysis. Although all the hyperelastic constitutive models present similarities in their results, it is essential to highlight the main differences. For example, Figure 11 shows the shear strain field determined numerically (Mooney–Rivlin constitutive model) for both simulations (2 mm and 4 mm of PDMS thickness). The steel is much more rigid than PDMS, and for this reason, the values of shear strain in the steel plates are small when compared with the PDMS plate. The values of shear strain in the top and bottom of the PDMS plate are lower than in the central region due to the edge effect.
Figure 12 shows the evolution of shear strain (Exy) along y-direction for 2 mm PDMS thickness. The average value for shear strain from the Yeoh, polynomial, and Gent models presented the same result, −0.09680. However, the Mooney–Rivlin constitutive model resulted in −0.09684, a difference of 0.4 × 10⁻³.
Figure 13 shows the results found of shear strain for a 4 mm thickness PDMS. The constitutive models of Yeoh, polynomial and Gent presented the same result, −0.02060. While the Mooney–Rivlin Model gives −0.02056, again showing the same difference as the previous simulation.
The results of maximum, minimum, and average values of shear strain found in the FEM simulation are shown in Table 2. For the simulation with 2 mm of PDMS, the highest and lowest values of shear strain were found for the polynomial 3rd Order constitutive model. In the case of the simulation involving 4 mm of PDMS, all constitutive models presented the same maximum and minimum value for the shear strain. In terms of percentage is possible is possible to observe that for simulation with 2 mm of PDMS have an average around 9.968% while for 4 mm of PDMS the average shear strain decreases to 2.056%.
It is important to emphasize, as shown in Figure 5, the most suitable hyperelastic models are the Mooney–Rivlin and polynomial models. The constitutive model of Gent tends to move away at the end of the curve, which means that the values of shear strain found by the hyperelastic Gent model can be higher than the experimental ones, and some points are slightly above or below the experimental result at the end of the Yeoh curve. However, the results from in the Mooney–Rivlin and polynomial hyperelastic models more adequately characterize the hyperelastic behavior when compared with the experimental specimens. This statement is corroborated by other studies [42,43].

4.3. Comparison

The comparison between the numerical and experimental results was made along the y-direction for the specimens (experimental) and the models (numerical), Figure 10 and Figure 11, respectively. Figure 12 and Figure 13 show that, qualitatively, the numerical and experimental results are close. However, the maximum relative error between the numerical and experimental results is very different for the two thickness values. For the 2 mm PDMS, the maximum relative error is 4.1%, and for the 4 mm thickness, it is 31.4%. This result shows that, for higher values of displacement and thicknesses, the numerical simulation results move further away from experimental values.

5. Conclusions

In this work, by the mechanical behavior of PDMS was characterized through an experimental method associating 3D DIC and compared with numerical simulations using four different numerical constitutive models. The main points that we have conclude were:
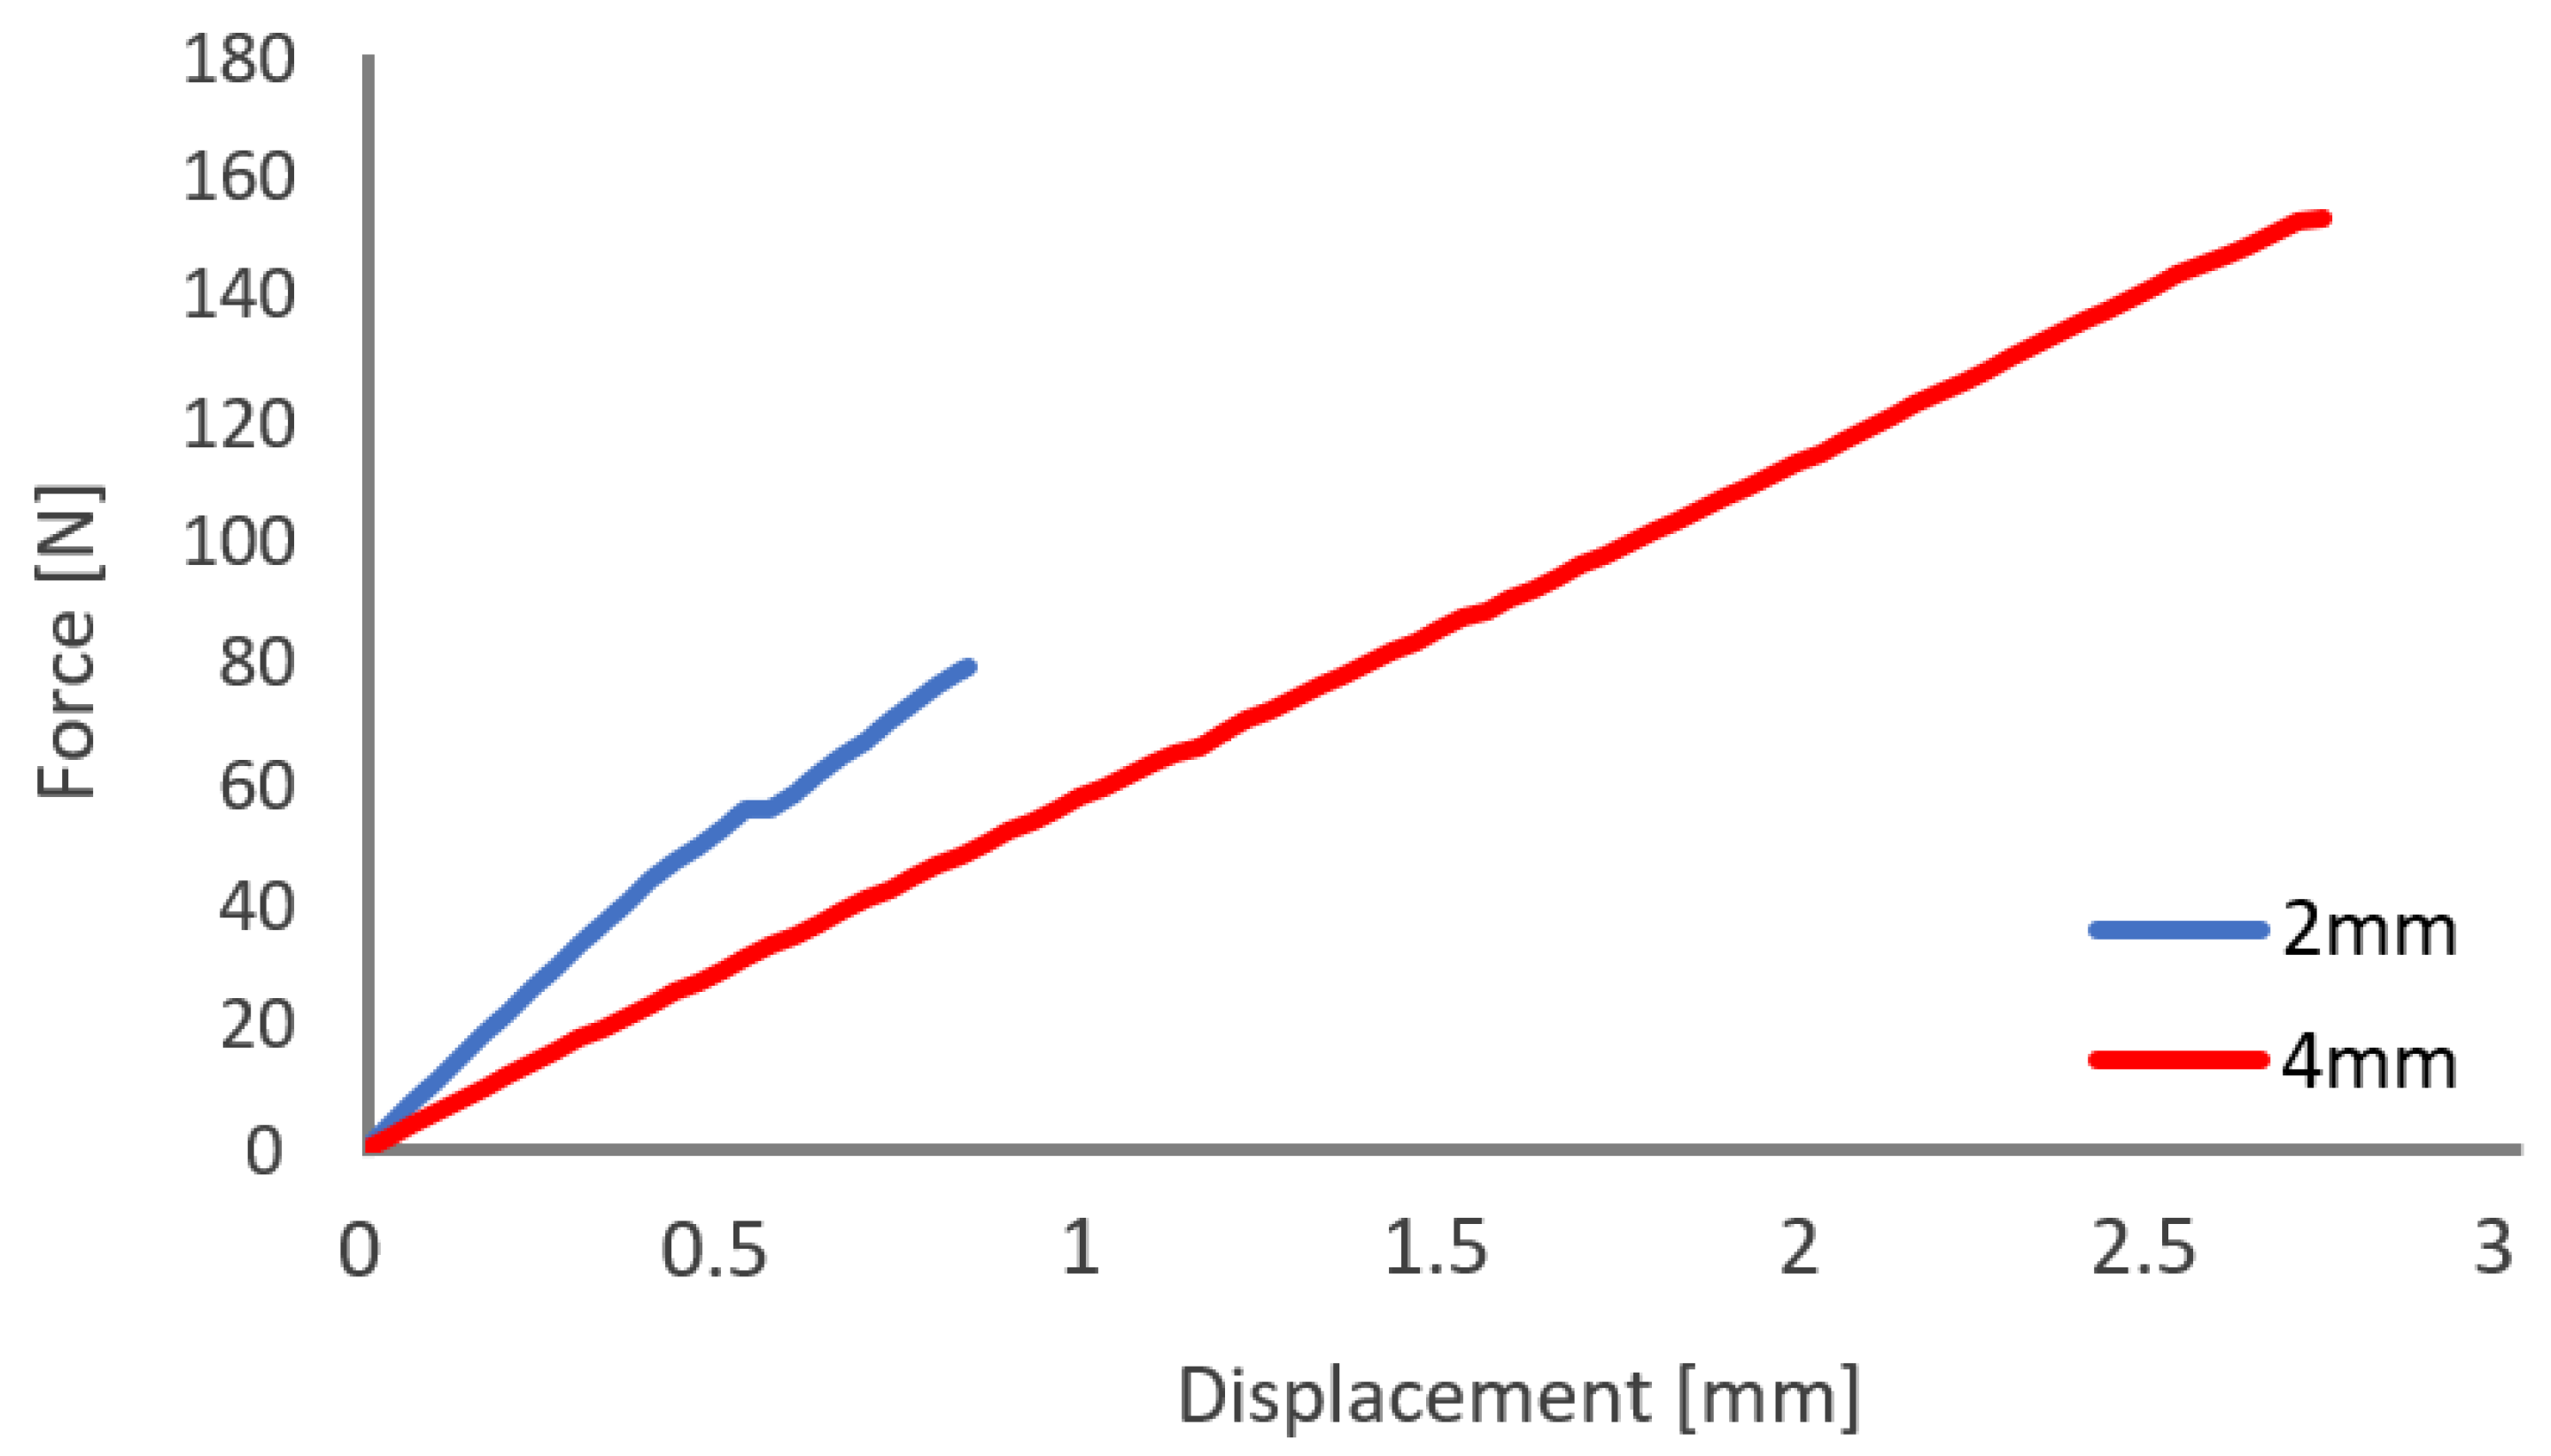
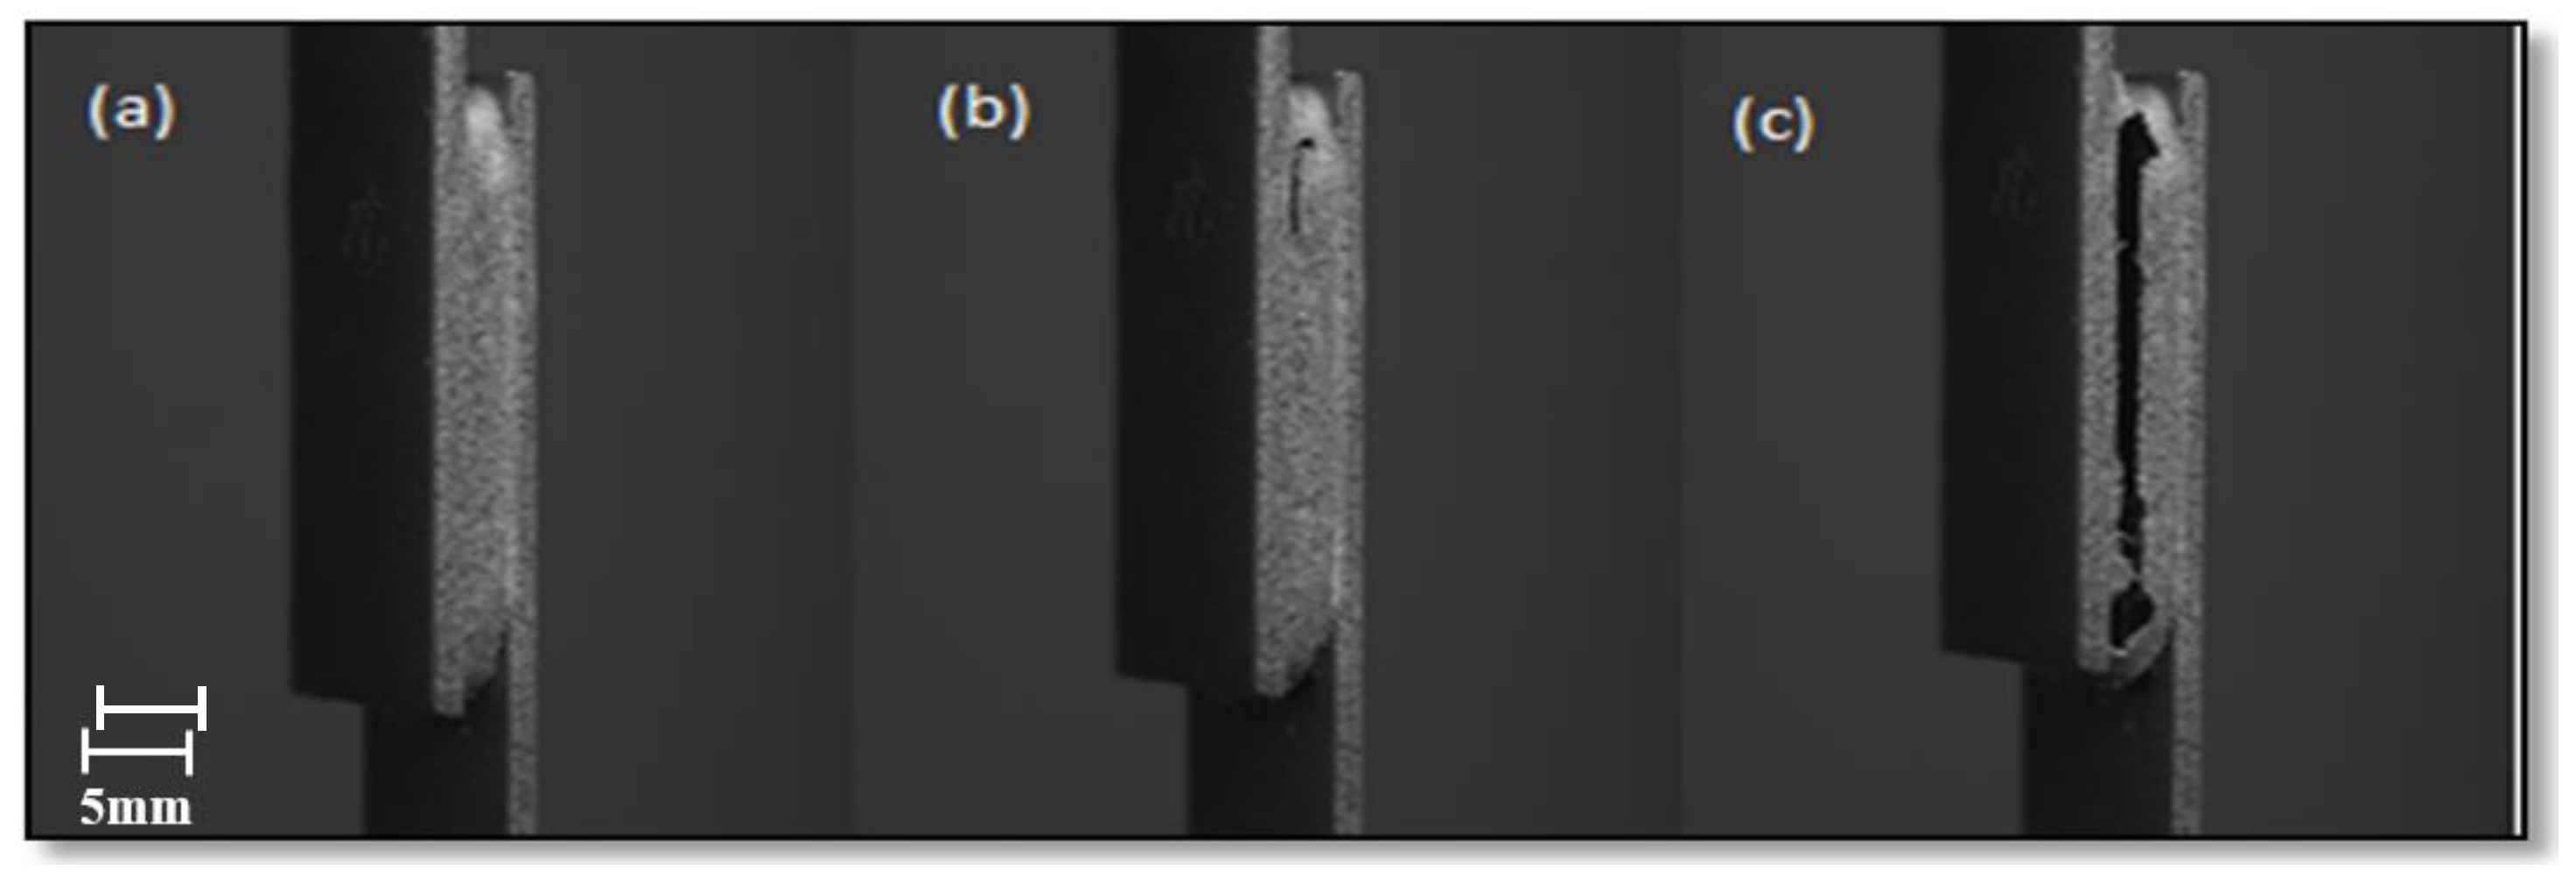
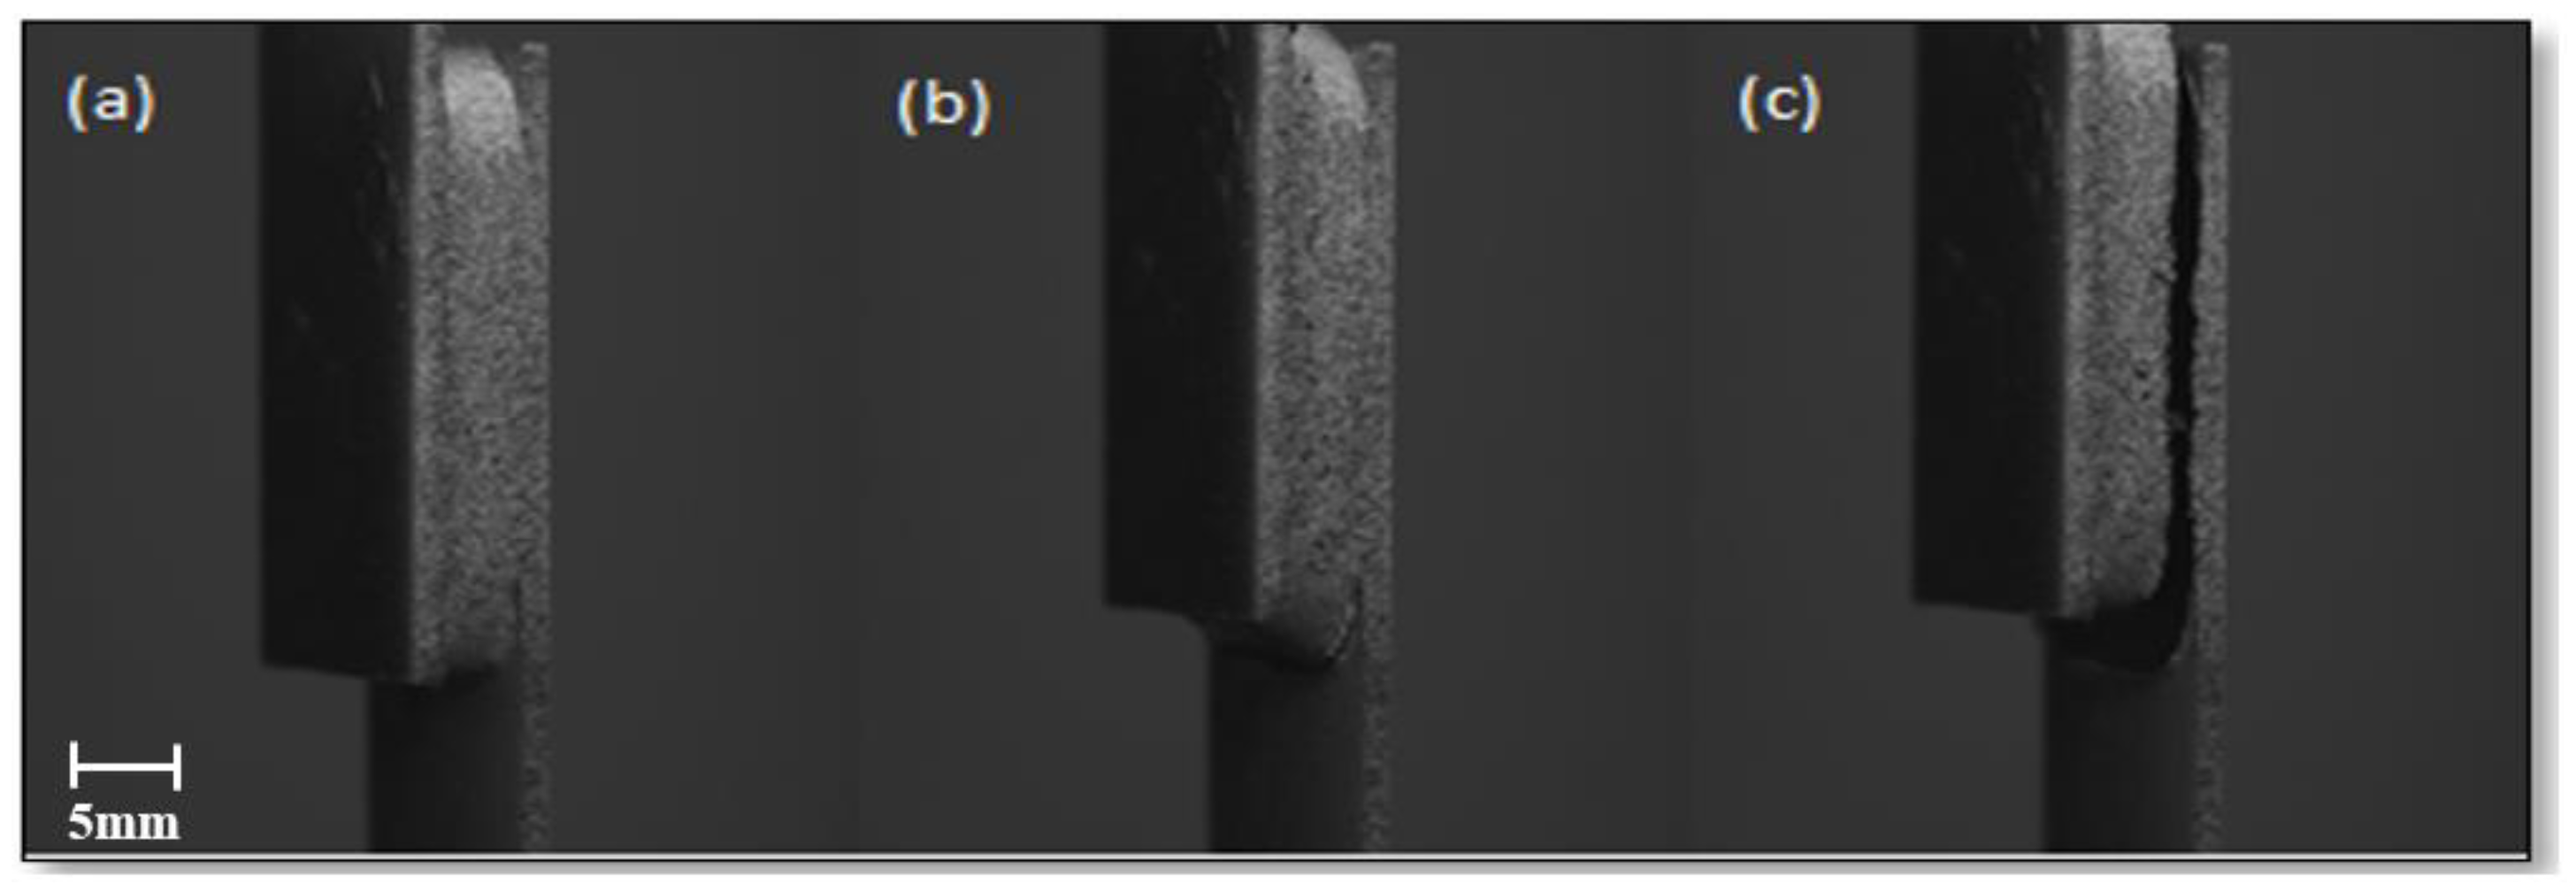
  • From experimental tests, the hyperelastic behavior of PDMS was verified using a simple shear test. The DIC tests showed that the most significant shear strain occurred in the centre of the PDMS plate. These experimental tests also verified that the PDMS rupture occurred at the bonding interface between the steel and PDMS plates. The rupture happened for different PDMS thicknesses. For 4 mm of PDMS, the specimen broke up at a 154 N of shear force. The specimen with 2 mm of PDMS suffered rupture at a shear force of 80 N. For an equal value of shear force, a higher value of displacement happened for the higher PDMS thickness.
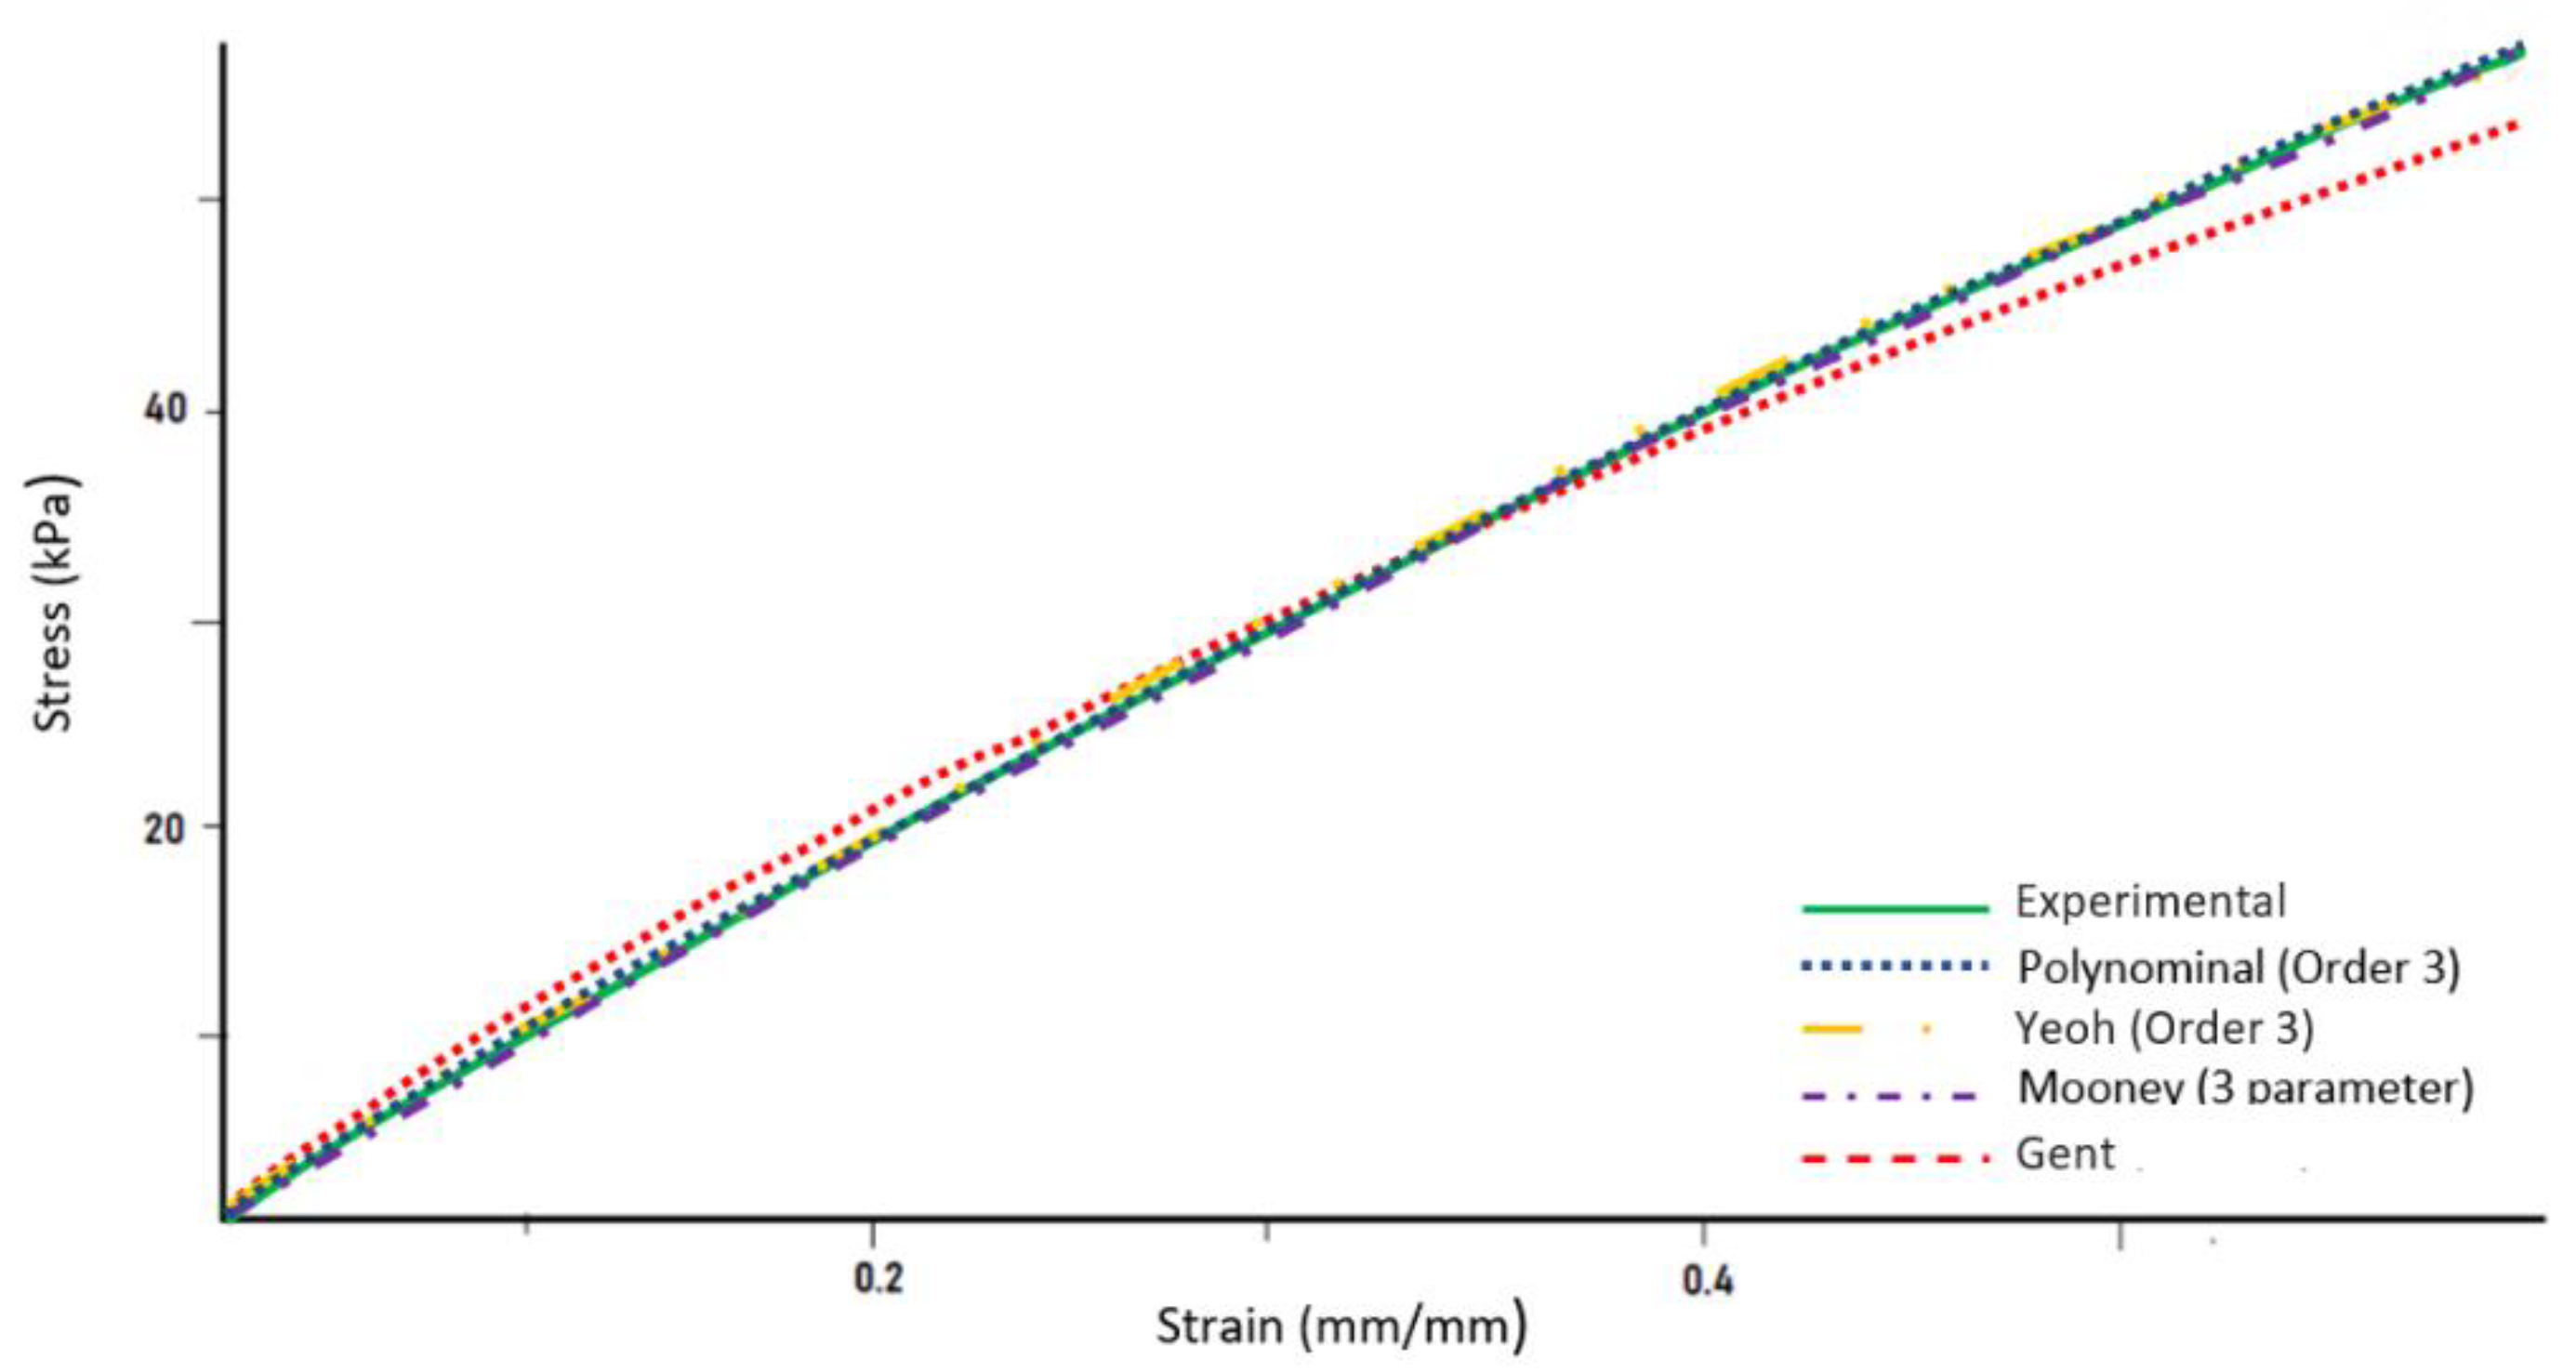
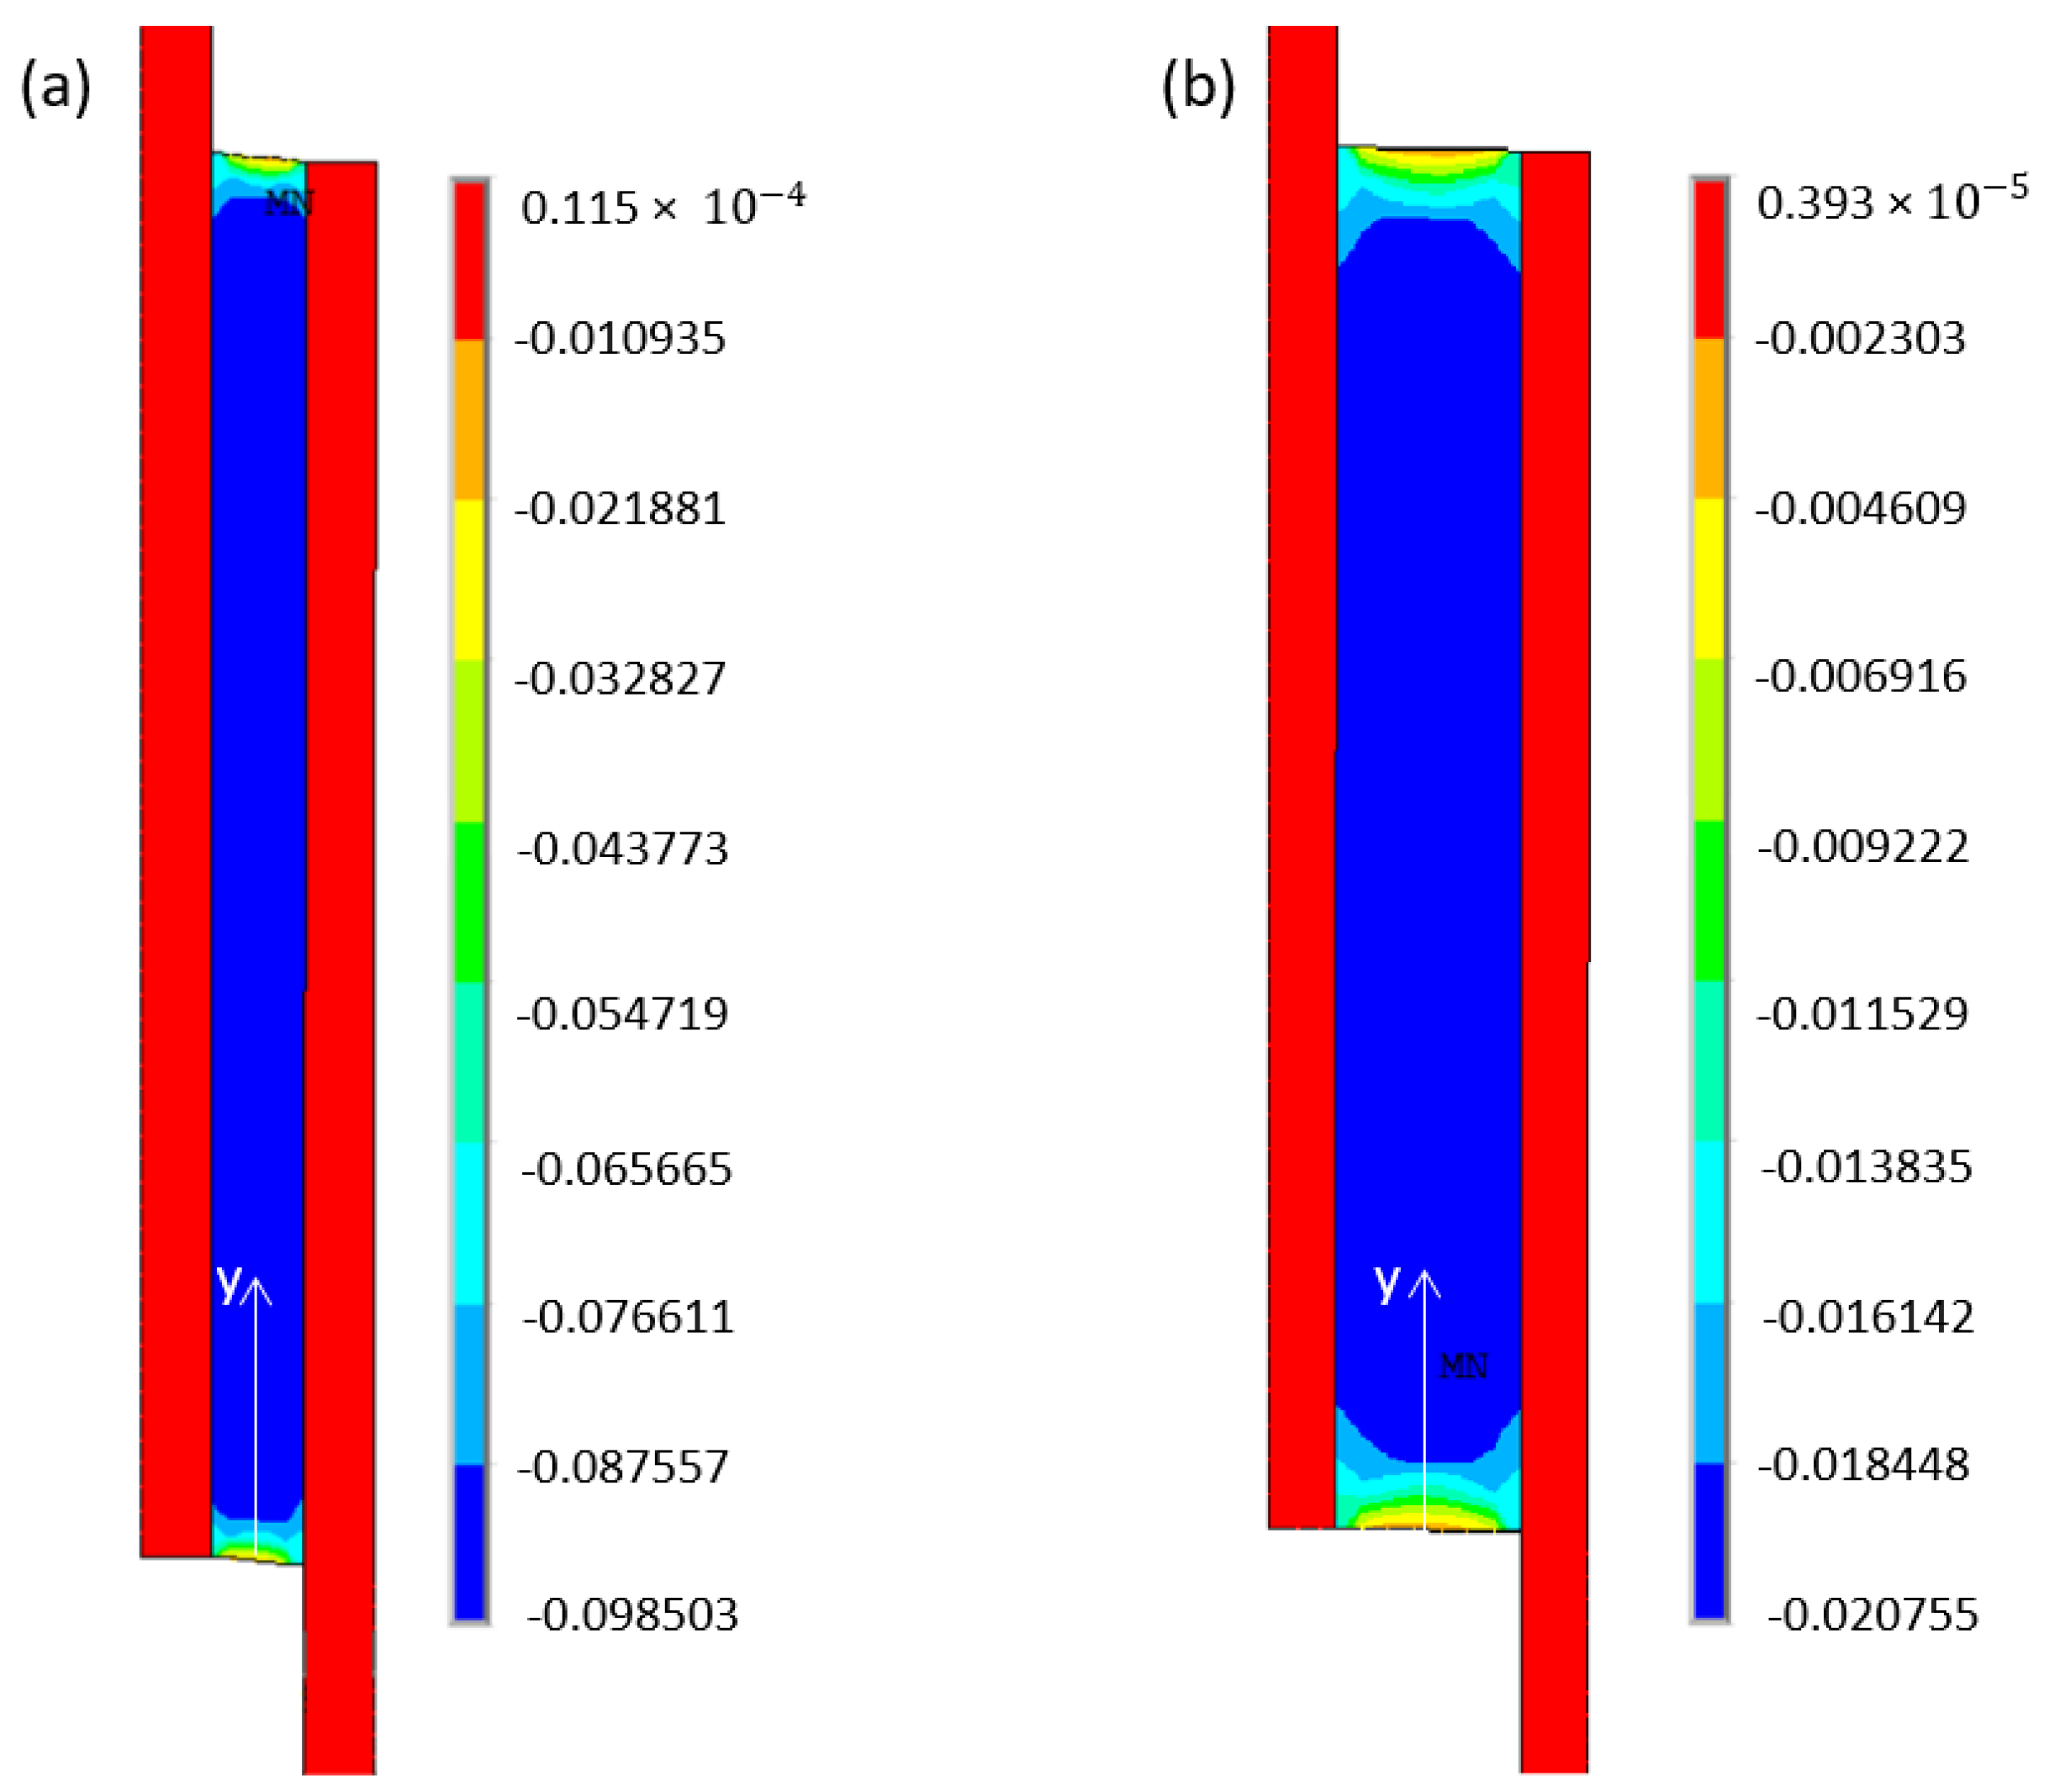
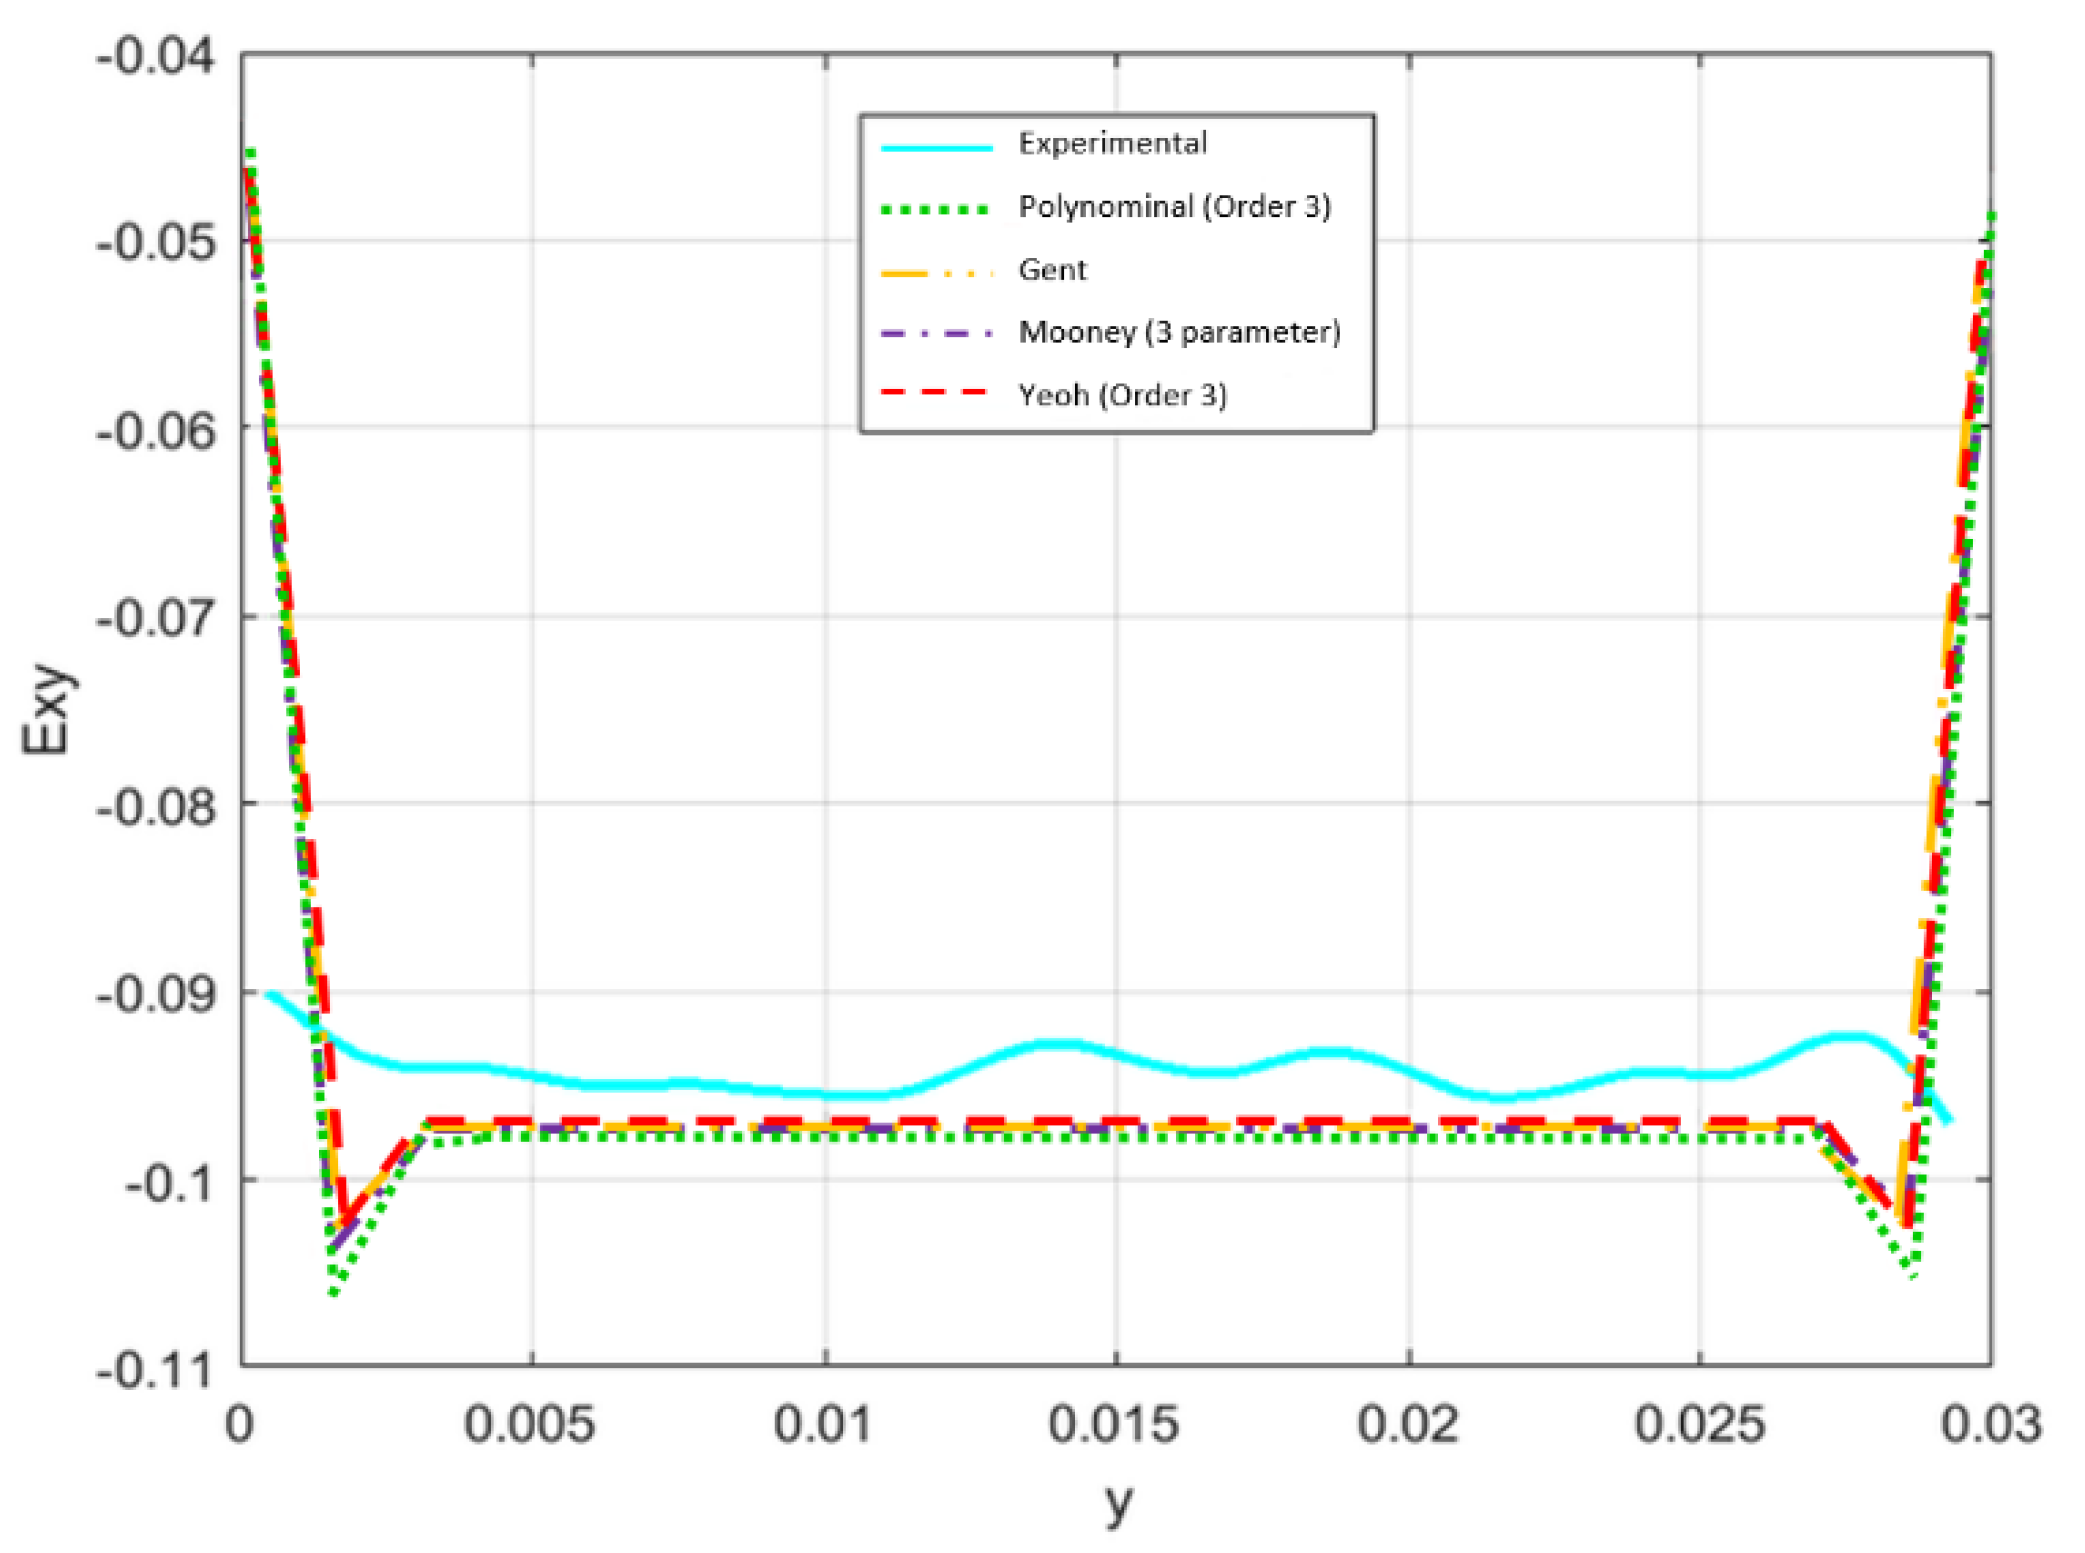
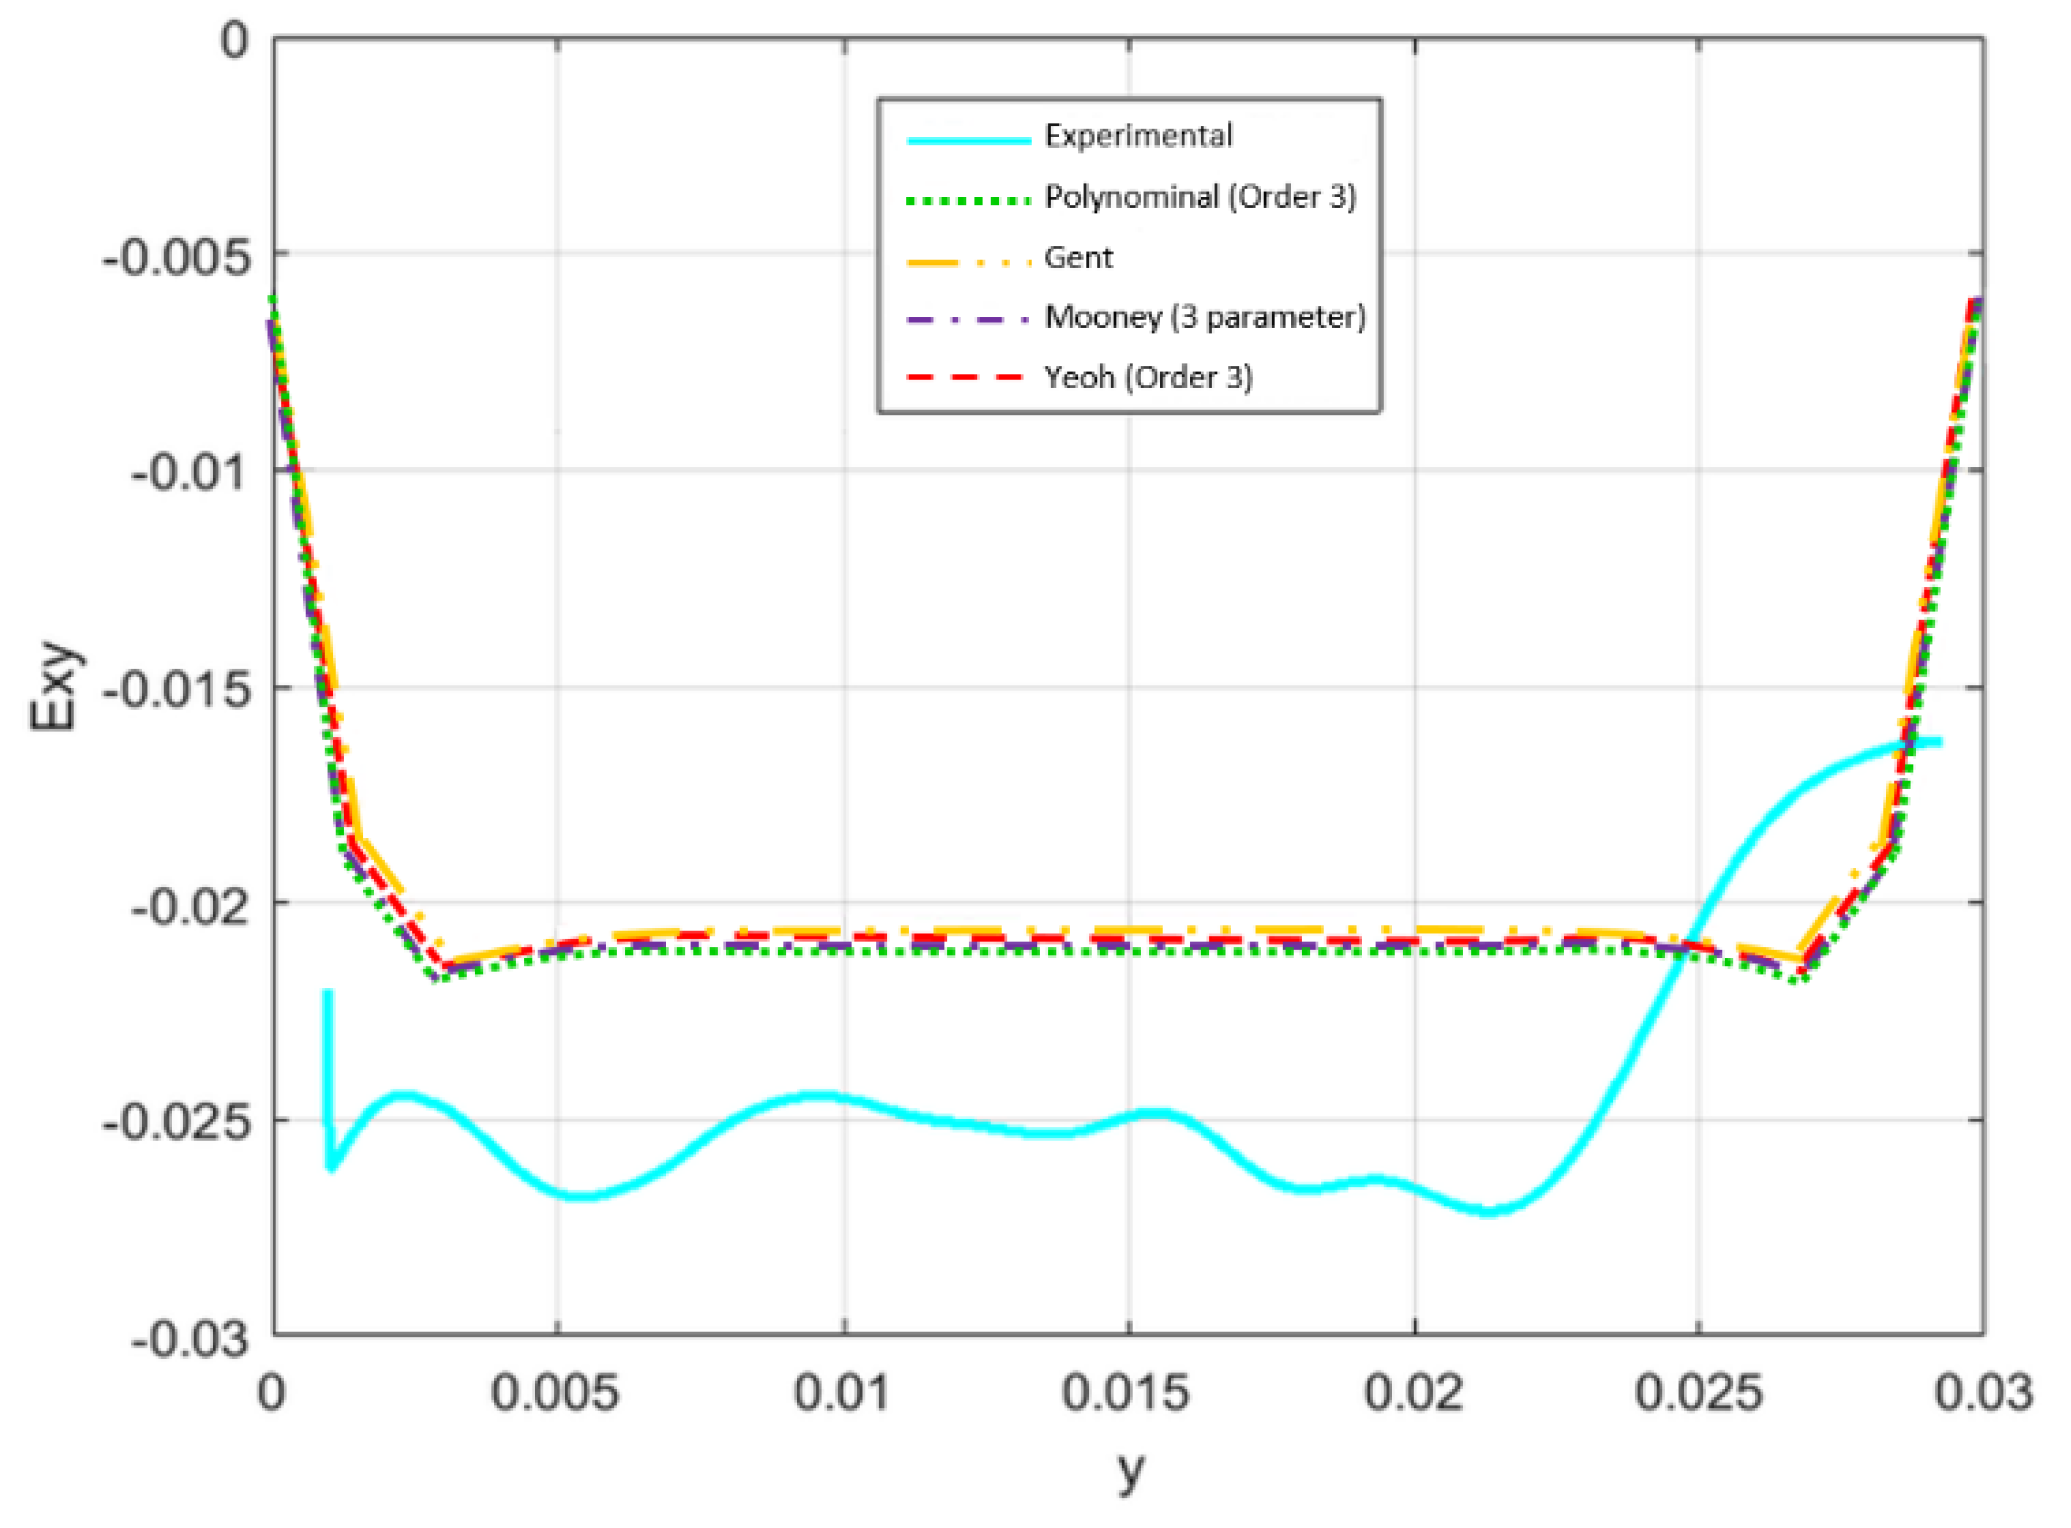
  • The numerical simulations were done using four hyperelastic constitutive models (Mooney–Rivlin, Yeoh, Gent and polynomial). All the hyperelastic constitutive models presented similar results despite some critical differences. The main reason to obtain similar results in shear stress was due to the appliance of low displacement values and the constitutive models, for this displacement level, have identical behavior. The values that show a greater difference in shear strain occurred for the Mooney–Rivlin constitutive model when compared with the other constitutive models (see Table 2). The numerical model with 2 mm of PDMS results in higher values of shear strain than with 4 mm. So, for low displacement levels it is possible to use any of the hyperelastic constitutive to simulate the shear test.
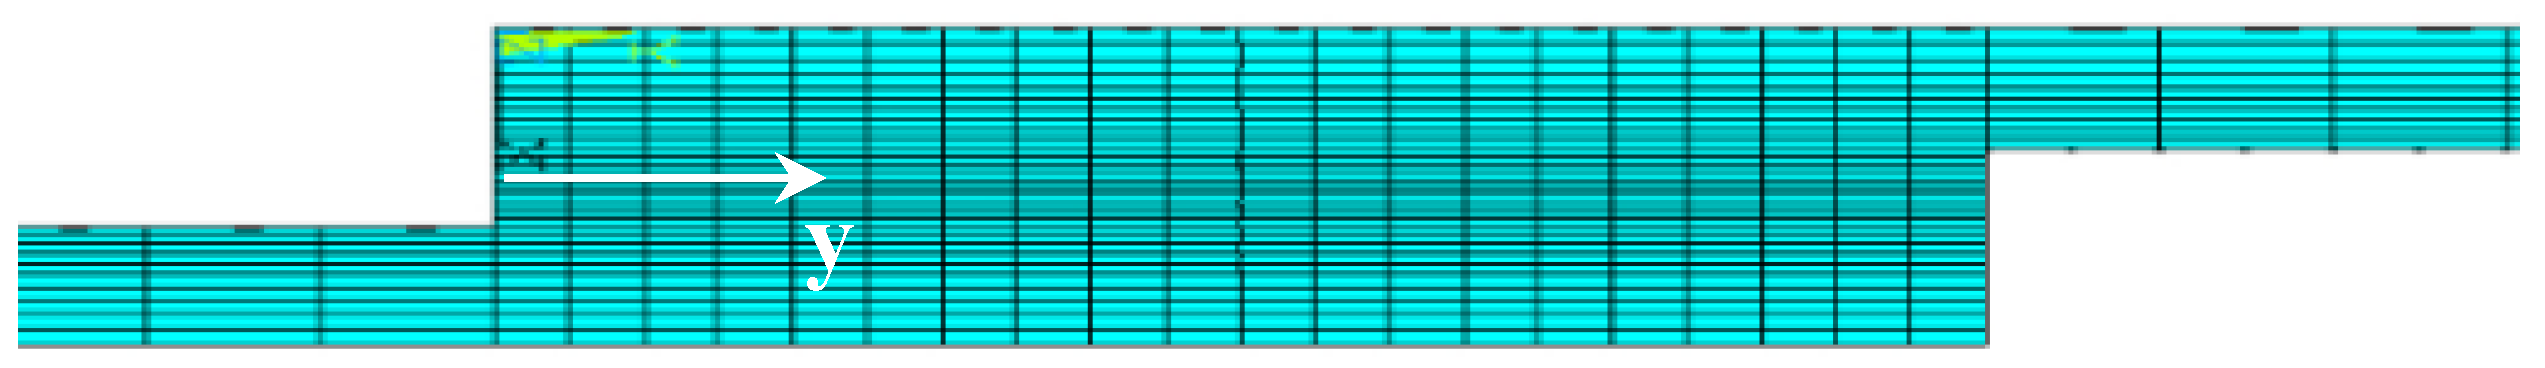
  • Qualitatively, in the central region of the specimen, the numerical and experimental results have similar behavior, and the values of shear strain are close. Nevertheless, the maximum relative error between the numerical and experimental results is very different for the two thickness values. It is possible to conclude that, for higher values of displacement and thicknesses, the numerical simulation results move further away from experimental values.

Author Contributions

Conceptualization, J.R. and A.S.; methodology, J.R.; software, E.M. and C.B.; validation, A.S., E.M. and C.B.; formal analysis, J.R.; investigation, A.S.; resources, J.R.; data curation, C.B.; writing—original draft preparation, A.S. and E.M.; writing—review and editing, J.R. and A.S.; visualization, A.S.; supervision, J.R.; project administration, J.R.; funding acquisition, J.R. All authors have read and agreed to the published version of the manuscript.

Acknowledgments

This work has been supported by FCT – Fundação para a Ciência e Tecnologia within the R&D Units Project Scope: CIMO (UIDB/00690/2020).

Conflicts of Interest

The authors declare no conflict of interest.

References

  1. Martin, S.; Bhushan, B. Transparent, wear-resistant, superhydrophobic and superoleophobic poly(dimethylsiloxane) (PDMS) surfaces. J. Coll. Int. Sci. 2017, 488, 118–126. [Google Scholar] [CrossRef] [PubMed]
  2. Hassler, C.; Boretius, T.; Stieglitz, T. Polymers for neural implants. J. Polym. Sci. Part B Polym. Phys. 2011, 49, 18–33. [Google Scholar] [CrossRef]
  3. Roh, C.; Lee, J.; Kang, C. Physical Properties of PDMS (Polydimethylsiloxane) Microfluidic Devices on Fluid Behaviors: Various Diameters and Shapes of Periodically-Embedded Microstructures. Materials 2016, 9, 836. [Google Scholar] [CrossRef] [PubMed] [Green Version]
  4. Kim, J.H.; Lau, K.T.; Shepherd, R.; Wu, Y.; Wallace, G.; Diamond, D. Performance characteristics of a polypyrrole modified polydimethylsiloxane (PDMS) membrane based microfluidic pump. Sens. Actuators A Phys. 2008, 148, 239–244. [Google Scholar] [CrossRef]
  5. Lin, Y.H.; Kang, S.W.; Wu, T.Y. Fabrication of polydimethylsiloxane (PDMS) pulsating heat pipe. Appl. Therm. Eng. 2009, 29, 573–580. [Google Scholar] [CrossRef]
  6. Casanova-Moreno, J.; To, J.; Tony Yang, C.W.; Turner, R.F.; Bizzotto, D.; Cheung, K.C. Fabricating devices with improved adhesion between PDMS and gold-patterned glass. Sens. Actuators B Chem. 2017, 246, 904–909. [Google Scholar] [CrossRef]
  7. Jewkes, R.; Burton, H.; Espino, D. Towards Additive Manufacture of Functional, Spline-Based Morphometric Models of Healthy and Diseased Coronary Arteries: In Vitro Proof-of-Concept Using a Porcine Template. J. Funct. Biomater. 2018, 9, 15. [Google Scholar] [CrossRef] [Green Version]
  8. Teixeira, A.; Hernández-Rodríguez, J.; Wu, L.; Oliveira, K.; Kant, K.; Piairo, P.; Diéguez, L.; Abalde-Cela, S. Microfluidics-Driven Fabrication of a Low Cost and Ultrasensitive SERS-Based Paper Biosensor. Appl. Sci. 2019, 9, 1387. [Google Scholar] [CrossRef] [Green Version]
  9. Farfán-Cabrera, L.I.; Pascual-Francisco, J.B.; Gallardo-Hernández, E.A.; Susarrey-Huerta, O. Application of digital image correlation technique to evaluate creep degradation of sealing elastomers due to exposure to fluids. Polym. Test. 2018, 65, 134–141. [Google Scholar] [CrossRef]
  10. Bashirzadeh, Y.; Qian, S.; Maruthamuthu, V. Non-intrusive measurement of wall shear stress in flow channels. Sens. Actuators A. Phys. 2018, 271, 118–123. [Google Scholar] [CrossRef]
  11. Rodrigues, R.O.; Pinho, D.; Bento, D.; Lima, R.; Ribeiro, J. Wall expansion assessment of an intracranial aneurysm model by a 3D Digital Image Correlation System. Measurement 2016, 88, 262–270. [Google Scholar] [CrossRef] [Green Version]
  12. Huang, Y.M.; Tsai, N.C.; Lai, J.Y. Development of tactile sensors for simultaneous, detection of normal and shear stresses. Sens. Actuators A Phys. 2010, 159, 189–195. [Google Scholar] [CrossRef]
  13. Unver, O.; Uneri, A.; Aydemir, A.; Sitti, M. Geckobot: A Gecko Inspired Climbing Robot Using Elastomer Adhesives. In Proceedings of the 2006 IEEE International Conference on Robotics and Automation (2006 ICRA), Orlando, FL, USA, 15–19 May 2006. [Google Scholar]
  14. Xu, F.; Li, X.; Shi, Y.; Li, L.; Wang, W.; He, L.; Liu, R. Recent Developments for Flexible Pressure Sensors: A Review. Micromachines 2018, 9, 580. [Google Scholar] [CrossRef] [PubMed] [Green Version]
  15. Fallahi, H.; Zhang, J.; Phan, H.-P.; Nguyen, N.-T. Flexible Microfluidics: Fundamentals, Recent Developments, and Applications. Micromachines 2019, 10, 830. [Google Scholar] [CrossRef] [Green Version]
  16. Banea, M.; Silva, L. The effect of temperature on the mechanical properties of adhesives for the automotive industry. Proc. Inst. Mech. Eng. Part L J. Mat. Des. Applic. 2010, 224, 51–62. [Google Scholar] [CrossRef]
  17. Moreira, D.; Nunes, L. Comparison of simple and pure shear for an incompressible isotropic hyperelastic material under large deformation. Polym. Test. 2013, 32, 240–248. [Google Scholar] [CrossRef] [Green Version]
  18. Nunes, L.S. Shear modulus estimation of the polymer polydimethylsiloxane (PDMS) using digital image correlation. Mater. Des. 2010, 31, 583–588. [Google Scholar] [CrossRef]
  19. Nunes, L.S. Mechanical characterization of hyperelastic polydimethylsiloxane by simple shear test. Mater. Sci. Eng. A 2011, 528, 1799–1804. [Google Scholar] [CrossRef]
  20. Post, D.; Han, B.; Ifju, P. High Sensitivity Moiré: Experimental Analysis for Mechanics and Materials; Springer: Berlin/Heidelberg, Germany, 1997; ISBN 978-1-4612-4334-2. [Google Scholar]
  21. Wang, Y.; Gao, X.; Xie, X.; Wu, S.; Liu, Y.; Yang, L. Simultaneous dual directional strain measurement using spatial phase-shift digital shearography. Opt. Las. Eng. 2016, 87, 197–203. [Google Scholar] [CrossRef]
  22. Ribeiro, J.; Fernandes, C.S.; Lima, R. Numerical Simulation of Hyperelastic Behaviour in Aneurysm Models. In Lecture Notes Computational Vision and Biomechanics; Springer: Cham, Switzerland, 2017; pp. 937–944. [Google Scholar] [CrossRef] [Green Version]
  23. Xue, L.; Pham, J.T.; Iturri, J.; Del Campo, A. Stick-Slip Friction of PDMS Surfaces for Bioinspired Adhesives. Langmuir 2016, 32, 2428–2435. [Google Scholar] [CrossRef]
  24. Besson, J.; Cailetaud, G.; Chaboche, J.; Forest, S.; Blétry, M. Non-Linear Mechanics of Materials; Springer: London, UK, 2010. [Google Scholar] [CrossRef]
  25. Ribeiro, J.; Lopes, H.; Martins, P. A hybrid method to characterize the mechanical behaviour of biological hyperelastic tissues. Comp. Meth. Biomech. Biomed. Eng. Imag. Vis. 2017, 5, 157–164. [Google Scholar] [CrossRef]
  26. Holzapfel, G. Nonlinear Solid Mechanics: A Continuum Approach for Engineering; John Wiley & Sons Ltd.: New York, NY, USA, 2000; ISBN 978-0-471-82319-3. [Google Scholar]
  27. Wriggers, P. Nonlinear Finite Element Methods; Springer: Berlin/Heidelberg, Germany, 2008; ISBN 978-3-540-71000-4. [Google Scholar]
  28. Yeoh, O.H. Some forms of the strain energy function for rubber. Rubber Chem. Technol. 1993, 66, 754–771. [Google Scholar] [CrossRef]
  29. Bhowmick, A.K. Rubber Products Manufacturing Technology; CRC Press: New York, NY, USA, 1994; ISBN 9780824791124. [Google Scholar]
  30. Guo, Z.; Sluys, J. Application of a new constitutive model for the description of rubber-like materials under monotonic loading. Int. J. Solid Struct. 2006, 43, 2799–2819. [Google Scholar] [CrossRef] [Green Version]
  31. Proulx, T. Mechanics of Biological Systems and Materials. In Proceedings of the Annual Conference on Experimental and Applied Mechanics, Uncasville, CT, USA, 13–16 June 2011; Springer Science & Business Media: New York, NY, USA, 2011. [Google Scholar]
  32. Laksari, K.; Shafieian, M.; Darvish, K. Constitutive model for brain tissue under finite compression. J. Biomech. 2012, 45, 642–646. [Google Scholar] [CrossRef]
  33. Hartmann, S.; Neff, P. Polyconvexity of generalized polynomial-type hyperelastic strain energy functions for near-incompressibility. Int. J. Solid Struct. 2003, 40, 2767–2791. [Google Scholar] [CrossRef]
  34. Ritto, T.G.; Nunes, L.S. Bayesian model selection of hyperelastic models for simple and pure shear at large deformations. Comput. Struct. 2015, 156, 101–109. [Google Scholar] [CrossRef]
  35. ASTM D412-0:2011. Standard Test Methods for Vulcanized Rubber and Thermoplastic Elastomers—Tension; ASTM International: West Conshohocken, PA, USA, 2016. [Google Scholar]
  36. Krahmer, D.M.; Polvorosa, R.; Lacalle, L.N.; Alonso-Pinillos, U.; Abate, G.; Riu, F. Alternatives for Specimen Manufacturing in Tensile Testing of Steel Plates. Exp. Tech. 2016, 40, 1555–1565. [Google Scholar] [CrossRef]
  37. Silva, C.M.A.; Rosa, P.A.R.; Martins, P.A.F. Innovative Testing Machines and Methodologies for the Mechanical Characterization of Materials. Exp. Tech. 2016, 40, 569–581. [Google Scholar] [CrossRef]
  38. Dixit, U.S.; Joshi, S.N.; Davim, J.P. Incorporation of material behavior in modeling of metal forming and machining processes: A review. Mater. Des. 2011, 32, 3655–3670. [Google Scholar] [CrossRef]
  39. Aurrekoetxea, M.; Lacalle, L.N.; Llanos, I. Machining Stresses and Initial Geometry on Bulk Residual Stresses Characterization by On-Machine Layer Removal. Materials 2020, 13, 1445. [Google Scholar] [CrossRef] [Green Version]
  40. López, M.; Rubio, M.; Sadek, S.H.; Veja, E.J. A simple emulsification technique for the production of micro-sized flexible powder of polydimethylsiloxane (PDMS). Pow. Tecnh. 2020, 306, 610–616. [Google Scholar] [CrossRef]
  41. Zhang, J.; Sweedy, A.; Gitzhofer, F.; Baroud, G. A novel method for repeatedly generating speckle patterns used in digital image correlation. Opt. Las. Eng. 2018, 100, 259–266. [Google Scholar] [CrossRef]
  42. Cardoso, C.; Fernandes, C.; Lima, R.; Ribeiro, J. Biomechanical analysis of PDMS channels using different hyperelastic numerical constitutive models. Mech. Res. Commun. 2018, 90, 26–33. [Google Scholar] [CrossRef] [Green Version]
  43. Ribeiro, J.; Lopes, H.; Martins, P.; César, M.B. Mechanical analysis of PDMS material using biaxial test. AIMS Mater. Sci. 2019, 6, 97–110. [Google Scholar] [CrossRef]
Figure 1. Bubbles measurement in the specimen.
Applsci 10 03322 g001
Figure 2. (a) specimen positioned on the tensile machine. (b) PDMS stress-strain curve.
Applsci 10 03322 g002
Figure 3. The specimen used in the simple shear test.
Applsci 10 03322 g003
Figure 4. Experimental set-up of 3D digital image correlation.
Applsci 10 03322 g004
Figure 5. Stress-strain curve solution for different constitutive hyperelastic mathematical models.
Applsci 10 03322 g005
Figure 6. Discretization of nodes and elements for simulation.
Applsci 10 03322 g006
Figure 7. Force-displacement curve for the shear test.
Applsci 10 03322 g007
Figure 8. Image of 2 mm polydimethylsiloxane (PDMS) thickness: (a) before deformation; (b) beginning of rupture; (c) after rupture.
Applsci 10 03322 g008
Figure 9. Image of 4 mm PDMS thickness: (a) before deformation; (b) beginning of rupture; (c) after rupture.
Applsci 10 03322 g009
Figure 10. (a) Shear strain field for a 2 mm thickness PDMS plate; (b) Shear strain field for a 4 mm thickness PDMS plate.
Applsci 10 03322 g010
Figure 11. Shear strain field obtained by numerical simulation using the Mooney–Rivlin constitutive model. (a) 2 mm and (b) 4 mm of PDMS thickness.
Applsci 10 03322 g011
Figure 12. Shear strain obtained numerically and experimentally along the y-direction for 2 mm of PDMS.
Applsci 10 03322 g012
Figure 13. Shear strain obtained numerically and experimentally along the y-direction for 4 mm of PDMS.
Applsci 10 03322 g013
Table 1. Displacements for the numerical simulations.
Numerical SimulationDisplacement [mm]
10.5
20.2
Table 2. Average, maximum and minimum shear strain values obtained by simulation.
Constitutive ModelAverageMinimumMaximum
Mooney-Rivlin 3 parameter−0.09684−0.04678−0.10238PDMS Thickness 2 mm
Yeoh 3rd Order−0.09680−0.04722−0.10237
Polynomial 3rd Order−0.09680−0.04362−0.10514
Gent−0.09680−0.04709−0.10240
Mooney-Rivlin 3 parameter−0.02056−0.00585−0.02128PDMS Thickness 4 mm
Yeoh 3rd Order−0.02060−0.00585−0.02128
Polynomial 3rd Order−.02060−0.00585−0.02128
Gent−0.02060−0.00585−0.02128

