Article

An Integrated System of Artificial Intelligence and Signal Processing Techniques for the Sorting and Grading of Nuts

by
Morteza Farhadi
1,
Yousef Abbaspour-Gilandeh
1,*,
Asghar Mahmoudi
2 and
Joe Mari Maja
3,*
1
Department of Biosystems Engineering, College of Agriculture and Natural Resources, University of Mohaghegh Ardabili, Ardabil 56199-11367, Iran
2
Department of Biosystems Engineering, Faculty of Agriculture, University of Tabriz, Tabriz 51666-16471, Iran
3
Department of Agricultural Science, Clemson University, 240 McAdams Hall, Clemson, SC 29634, USA
*
Authors to whom correspondence should be addressed.
Appl. Sci. 2020, 10(9), 3315; https://doi.org/10.3390/app10093315
Submission received: 28 March 2020 / Revised: 8 May 2020 / Accepted: 8 May 2020 / Published: 10 May 2020
(This article belongs to the Special Issue Applied Artificial Neural Networks)

Abstract

:
The existence of conversion industries to sort and grade hazelnuts with modern technology plays a vital role in export. Since most of the hazelnuts produced in Iran are exported to domestic and foreign markets without sorting and grading, it is necessary to have a well-functioning smart system to create added value, reduce waste, increase shelf life, and provide a better product delivery. In this study, a method is introduced to sort and grade hazelnuts by integrating audio signal processing and artificial neural network techniques. A system was designed and developed in which the produced sound, due to the collision of the hazelnut with a steel disk, was taken by the microphone placed under the steel disk and transferred to a PC via a sound card. Then, it was stored and processed by a program written in MATLAB software. A piezoelectric sensor and a circuit were used to eliminate additional ambient noise. The time-domain and wavelet domain features of the data were extracted using MATLAB software and were analyzed using Artificial Neural Network Toolbox. Seventy percent of the extracted data signals were used for training, 15% for validation, and the rest of the data was used to test the artificial neural network (Multilayer Perceptron network with Levenberg-Marquardt Learning algorithm). The model optimization and the number of neurons in the hidden layer were conducted based on mean square error (MSE) and prediction accuracy (PA). A total of 2400 hazelnuts were used to evaluate the system. The optimal neural network structure for sorting and grading hazelnuts was 4-21-3 (four neurons in input layers, 21 neurons in the hidden layer, and three outputs which are the desired classification). This neural network (NN) was used to classify hazelnut as big, small, hollow, or damaged. Results showed 96.1%, 89.3%, and 93.1% accuracy for big/small, hollow, or damaged hazelnuts were obtained, respectively.

1. Introduction

Hazelnut (Corylus avellana) is a shrub with nearly 2 m height reaching to 6 m in suitable areas [1]. Due to its high export value, the improvement and processing of this product is of high importance. Sorting and grading operation before packaging is one of the most important and decisive factors affecting supply trends and success in the market. Thus, a solution to this problem is of great interest. According to FAO (Food and Agriculture Organization of the United Nations) 2018 statistics, Iran is ranked eighth in the production of hazelnuts in the world. Turkey, Italy, the United States, Azerbaijan, Georgia, Spain, and China are the top producers of hazelnuts in the world [2].
An artificial neural network is a network or circuit of neurons composed of artificial neurons or nodes, which is used for artificial intelligence (AI) [3]. The scope of neural network applications has expanded in different fields. It has been used to classify four types of carbon fiber fabrics [4], to predict the stability number of breakwater armor stones [5], etc. In a recent application, Freeman et al. [6] used deep convolutional neural networks (CNNs) to detect water stress in ornamental plants. Unlike linear algorithms, CNNs can model complex non-linear correlations between the independent variables and the dependent variable by transforming data through multiple layers of increasingly abstract representation [7].
Ghazanfari et al. [7] used artificial neural networks to classify four cultivars of Iranian pistachio nuts according to their 2D shapes. They used the shape recognition methods to classify pistachios into four different classes. For this purpose, the Fourier descriptors were used as a distinctive feature of the different groups of pistachios. The Fisher criterion for image separation and selection, together with the Gaussian classification method, was used to separate a subset of Fourier descriptors from the original set. Thus, seven descriptors were selected, and using a feedforward neural network, the separation rate of 94.8% was obtained. Pearson [8] used audio data in the time domain and diagnostic analysis to separate closed and open-shell pistachio nuts. According to this research, the separation accuracy of closed and open-shell pistachio nuts was about 97%. Cetin et al. [9] carried out the sound recognition technique to separate closed and open-shell pistachio nuts. Also, they used a linear combination of Mel-Sepstrum vectors and the main components of principal component analysis (PCA) data from the sampled audio in the time domain for classification of pistachios and obtained a system accuracy of about 99%. Mahmoudi et al. [10] developed an acoustic system to classify pistachio. They integrated their system with an artificial neural network and obtained an accuracy of 97.3%, 96.7%, and 93.1 % for open, closed, and half-closed shell pistachio nuts, respectively. Using the same system, they detected and separated four types of Iranian pistachio nuts called Kalleh Ghounchi, Akbari, Badami, and Ahmad Aghaei with the accuracy of 96.9%, 97.6%, 96.4%, and 99.1%, respectively. Moisture content of nuts is one of the important factors affecting the impact sound. Kurtulmuş et al. [11] developed a prototype system for classification of chestnuts using impact sound and computational intelligence methods based on moisture contents. Three different moisture contents (35%, 45%, and 55%) of Chestnut were used in classification applications. The highest classification rate of 88% was achieved for the SVM-RFE algorithm. Agrawal et al. [12] on the other hand used non-destructive acoustics to correlate it to moisture measurement using a pattern matching technique. The group observed that raw cashew nuts when colliding with each other produced a unique sound, and the sound profile and spectrogram for dry and wet cashews showed a unique plot. Hosseinpour et al. [13] studied the isolation of the clod of potatoes by an acoustic response test. In this research, samples of potatoes and clods were placed on a conveyor and were allowed to collide with a steel disk when the conveyor started to move. The characteristics of samples were extracted while the sounds produced by the impact of potatoes and clods were recorded and processed in the time and frequency domains. A multilayer neural network was used as a decision-making unit to speed up system detection and flexibility. The test was repeated at four different speeds of the conveyor to study the effect of the impact speed in the accuracy of detection and determination of the system isolation capacity. When the conveyor was moving at the speed of 1 m/s, system detection accuracy was obtained as 97.3% and 97.6% for potatoes and clods, respectively. With increasing conveyor speed, system detection accuracy decreased. Khalesi et al. [14] stabilized an experimental system to investigate the use of acoustic response test to separate the genotypes of Kaghazi and Sanghi walnuts. In this study, 2000 walnuts of each genotype were tested (for a total of 4000 walnuts, and their genotypic characteristics were obtained through analyzing the received signal in time and frequency domain and statistical application of PCA. In total, 47 characteristics of walnut genotypes were selected, normalized, and used to the artificial neural network (ANN) as input vectors. The output vectors of the network consisted of two neurons for the classification of genotypes. Several different models of ANNs with a different number of neurons in the hidden layer were trained to determine the desired structure. The number of hidden layer neurons was selected based on multiple tests, and the results of calculating the MSE and correlation coefficient (r). The neural network model with the structure of 47-18-2 was chosen to isolate genotypes. The proper isolation for genotypes of both Kaghazi and Sanghi walnuts obtained as 99.64% and 96.56%, respectively. In addition, mean squared error (MSE) for these walnuts were 0.0217 and 0.0185, respectively.

Conceptual Model of the System

Since sorting and grading operations of agricultural and horticultural products such as hazelnuts can play an important role economically, the present study attempts to describe the design, construction, and development of a sorting and grading system. The system consists of a rolling distributor mechanism and uses an acoustic signal processing technique as well as signals characteristic obtained by the wavelet transform method. In addition, the technique of sorting and grading of big and small hazelnuts will be presented, including the incorporation of sorting and grading operations on hazelnut (Figure 1).

2. Materials and Methods

In this study, the feasibility of an intelligent acoustic technique for sorting and grading hazelnuts through the design, construction, and evaluation of a system was studied. For this purpose, a device shown in Figure 2 was designed using 3D CAD software (Solid Works 2016, Dassault Systemes, Vélizy, France) and then built to place samples on a steel plate and record the impact noise that distinguishes large and small hazelnuts through data processing. The parts and components of the system are shown in Figure 2. The device was fed through a reservoir connected to a rolling distributor. There were 10 holes on the rolling distributor (its diameter was about 13 cm), where it kept the hazelnuts from moving. The distance between the rolling distributor and its covering was approximately 10 mm, so that large and small hazelnuts could lie on holes without falling. The rolling distributor was powered by a 12V electric motor with variable speed so that the samples could be fed precisely. The audio system included a microphone (MIC COND ANALOG OMNI -42DB, Model VM-034CY, Panasonic, Osaka, Japan), an acoustic chamber, piezoelectric sensors, an audio signal circuit, and a disk. A microphone was placed under the disk within the acoustic chamber, which was isolated by an insulator to capture the sound.
A galvanized and polished disk with dimensions of 120 mm × 120 mm and thickness of 1 mm was installed on the acoustic chamber. The angle and height of the disk are adjustable. After preliminary tests, an angle and height of 30° and 35 cm were selected, respectively. A Piezoelectric sensor was placed at the center of the disk to record the impact of the nuts. The same sensor was connected to a circuit with a microcontroller where the received impact signal was processed and noise was filtered to only capture the impact signal. The circuit was connected to a laptop audio jack port where a PC program was written using MATLAB (Matlab 2015, The MathWorks Inc., Natick, MA, USA).

2.1. Materials, Design, and Construction Method

2.1.1. Hazelnuts

In this study, hazelnuts (Figure 3) were prepared from Rezvanshahr, Gilan Province, Iran (37.5712703, 49.1714149) and dried to reach less than 10% moisture content. Iran National Standard (ISIRI 247; ICS: 67.080.10) [15] 800 was used to grade the hazelnuts as big, small, hollow, or damaged (Table 1). There were a total of 2400 nuts selected. The selected samples were separated based on their weights, and 800 (small, big, hollow, or damaged hazelnut for two sizes) samples were determined as reference.
Iran National Standard (ISIRI 247; ICS: 67.080.10) were used to grade hazelnuts based on size, as indicated in Table 1. Thus, hazelnuts were classified into three grades; super grade (d > 16 mm), first grade (12 mm < d < 16 mm), and second grade (d < 12 mm) [15].

2.1.2. System Components

  • The frame was made of a 30 mm × 30 mm steel profile, as shown in Figure 2.
  • The reservoir kept and stored the hazelnuts. The reservoir outlet was designed and made in such a way that it prevented nuts from accumulating on a rolling distributor and allowed them to move in a single row. In addition, the distance of the reservoir outlet was equal to the highest diameter of the biggest hazelnut.
  • An acoustic chamber was designed to avoid the effects of external noise (Figure 4). Sound insulating materials (Isoham insulation) were used in the interior chamber structure. The microphone was placed about 5 mm below the disk. An acoustic chamber was placed on a hinge joint so that the desired angle could be adjusted. This prevented the hazelnuts from moving outside due to collision with the disk. Since the distance between the distributor and the acoustic chamber affected the quality of the signal received by hazelnuts, the platform jack was used to change this distance to optimize the received signals.
  • One of the most important parts of the system is where hazelnuts were transferred and graded individually. Thus, a rolling distributor was used, which is simple and inexpensive, to receive hazelnuts individually from the reservoir and transfers them to the outlet (Figure 5).
After determining the hazelnut dimensions, the size of the holes in the rolling distributor was set to 24 mm, which is equal to the diameter of the largest hazelnut. A rolling distributor with a 130 mm diameter and 38 mm thickness was made from Teflon. This setup held only one hazelnut inside the hole. The hazelnuts sitting on the holes are led toward the outlet where it comes out onto the intended surface. Figure 6a shows the complete housing. The nut holder, as shown in Figure 6b, contains a rolling distributor and acts as a pullover edge. If more than one hazelnut passes this point, other hazelnuts are slipped to the side and will move upward. Another critical parameter is the tolerance of distance between the rolling distributor and its housing, so that both large and small hazelnuts can go through the distributor. To achieve this purpose, the dimensions of hazelnuts were measured, and the tolerance was determined to be about 10 mm.
In order to rotate the rolling distributor, a 12 V electric motor equipped with a gearbox was used to turn the rolling distributor through a shaft. One of the essential parameters in the selection of the electric motor was its rotational speed (speed: 40~55 rpm; voltage consumed: 12 V; torque lock: 20~30 Nm; engine power: 55~100 w). Motor speed can be controlled using pulse generation using a timer-integrated chip (555, NXP Semiconductor, 5656 AE EINDHOVEN, Netherlands). If the rotational speed of the electric motor is high, the hazelnut will stick between pullover edge and rolling distributor holes. Besides, high speed does not give enough time to the rolling distributor to be completely filled. Therefore, a gearbox electric motor with a maximum speed of 40 rpm was used.
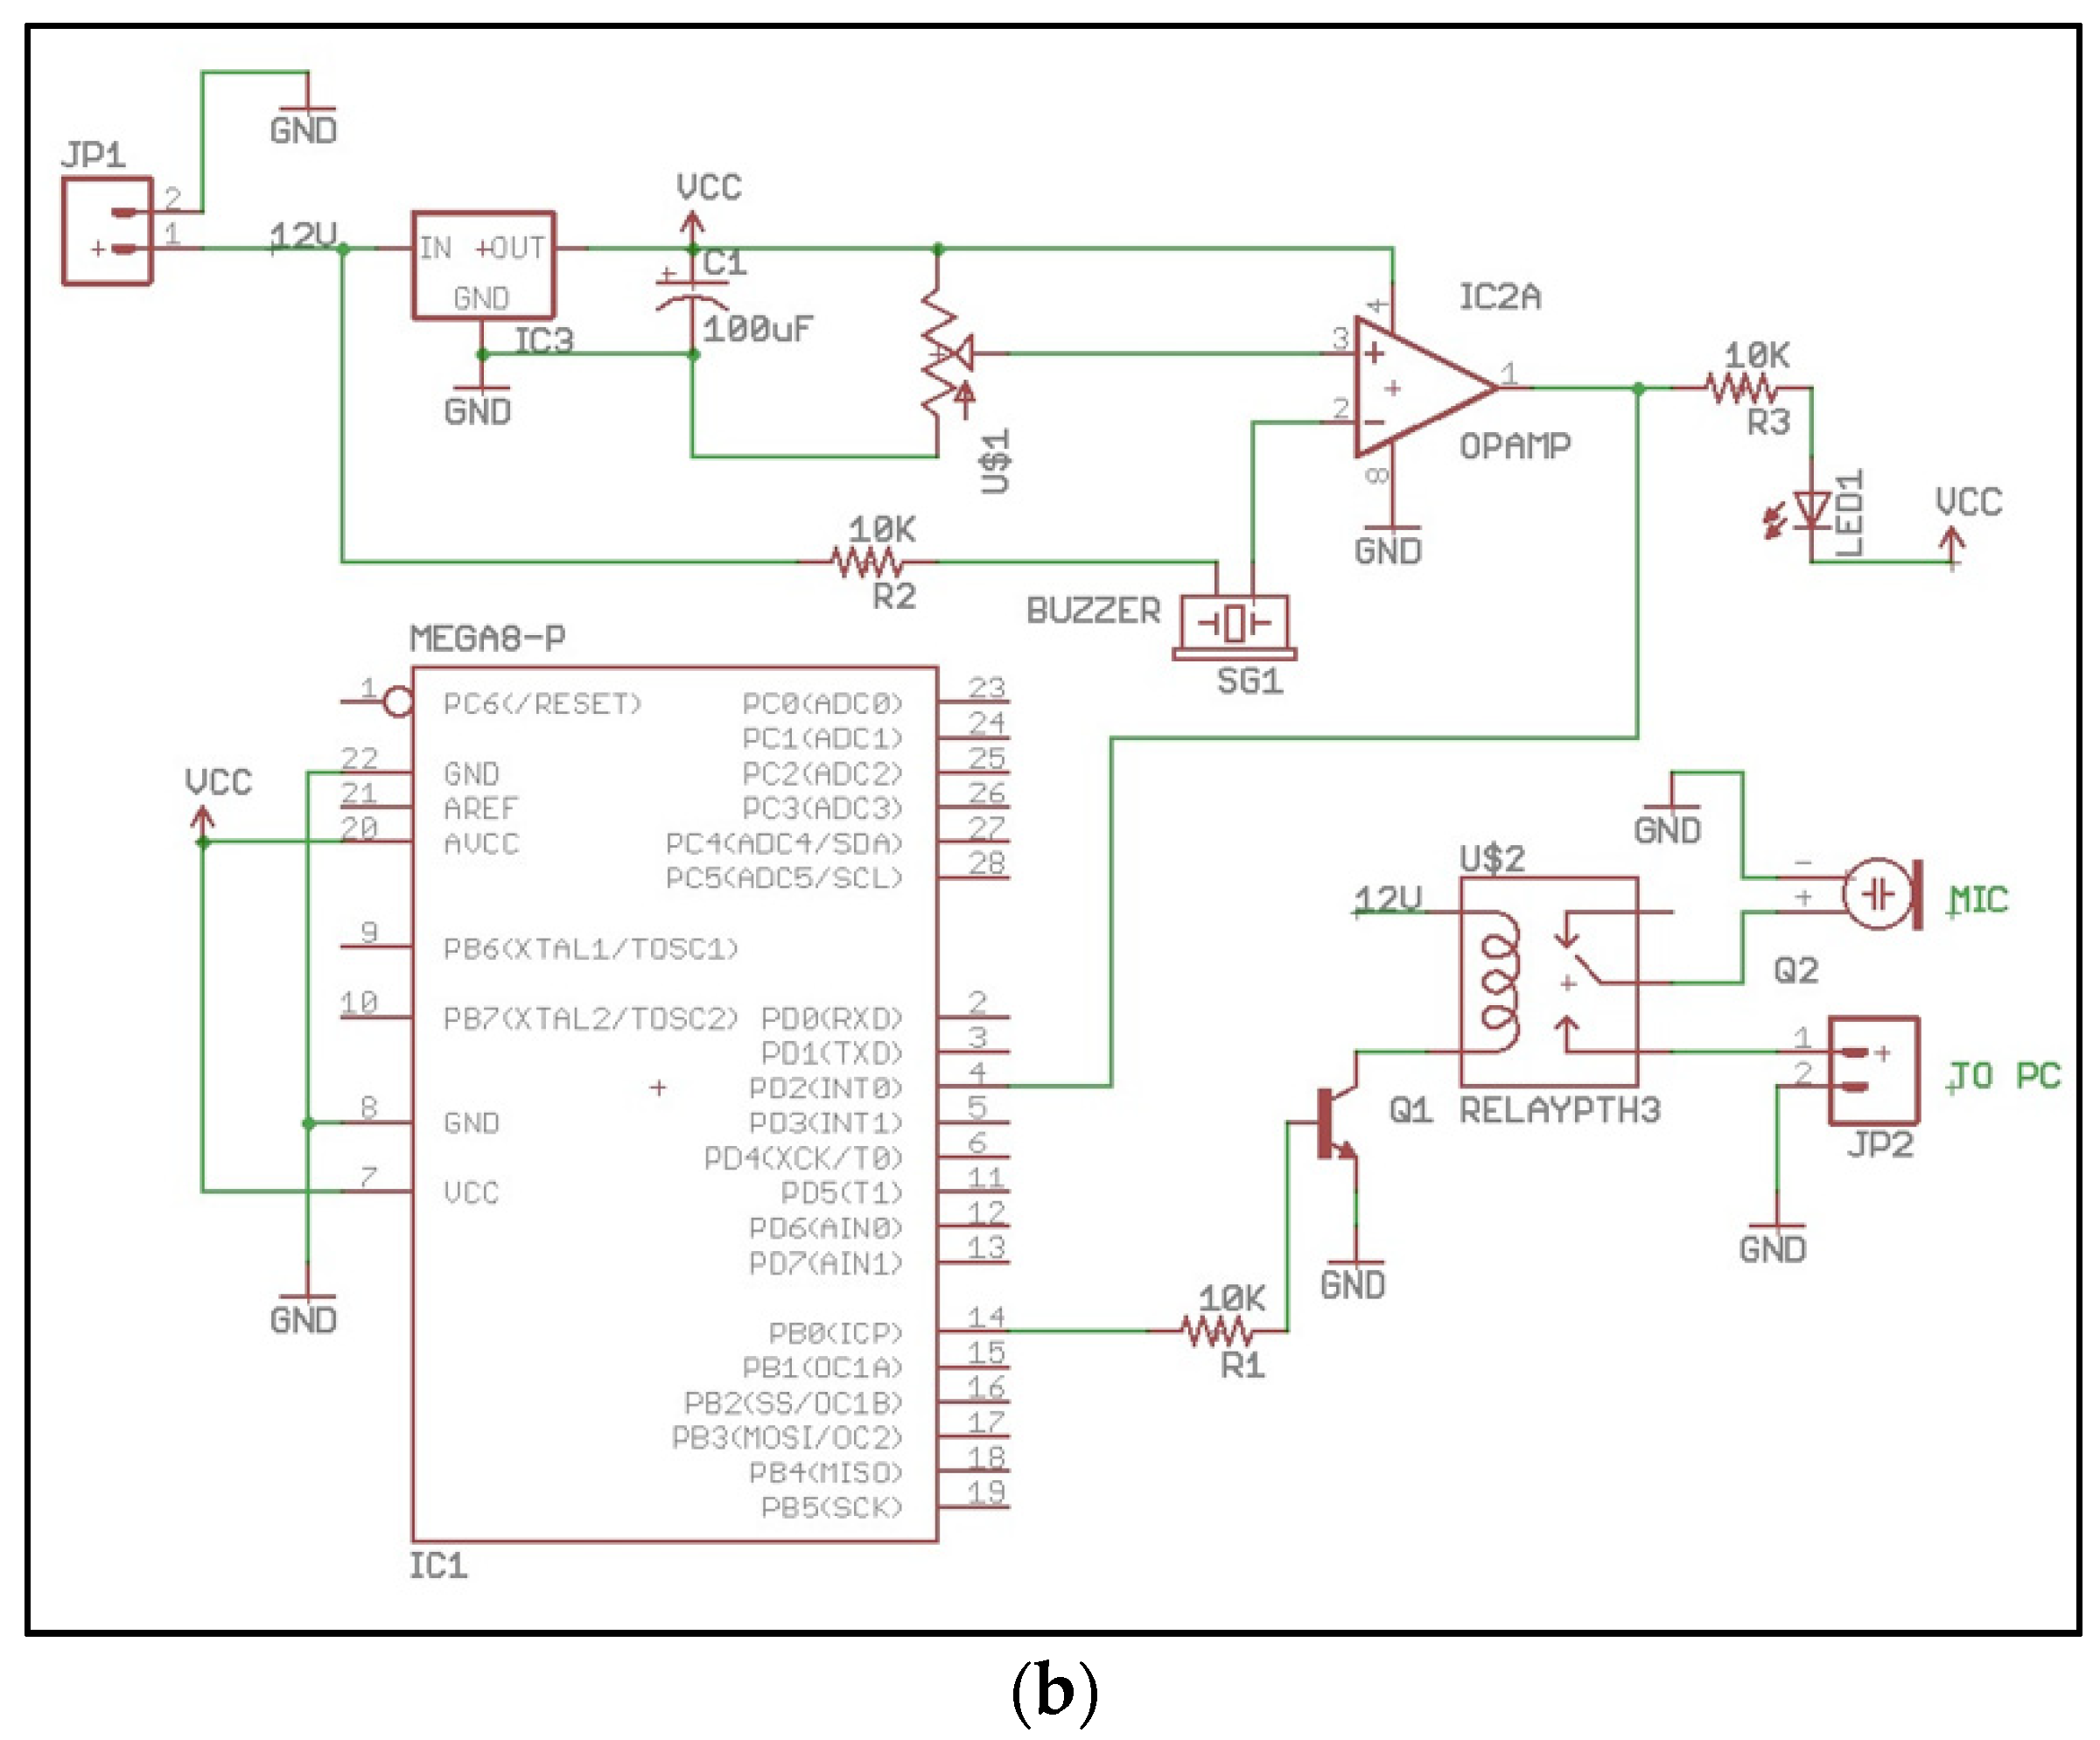
  • The components of the audio circuit are shown in Figure 7a,b. The audio signal circuit provides microphone connectivity to the sound card of the computer. The sampling input rate of audio signal was 44,100 times per second (44.1 kHz), with16-bit accuracy in a maximum range of –1 to +1 volts. Due to the impact of the hazelnut on the metal disk, which is located on the upper surface of the acoustic chamber, the computer program was activated, and time was taken for the verification of the impact by the microcontroller.
An AVR-type microcontroller (ATMEGA8, Microchip, USA) with 1 MHz operational clock pulse frequency, was used in this study (Figure 7b). A basic program was written using BASCOM AVR (V2.0.5.0., MCS Electronics, 1351 JJ Almere, Netherlands). A pressure-sensitive piezoelectric sensor converts variations pressure into voltage. If the piezoelectric sensor voltage exceeds the set threshold/trigger voltage, the microcontroller detects it as an impact signal. Once the impact signal is detected, it will close the relay so the audio lines from the computer will be connected. The set threshold voltage can be adjusted using the potentiometer of the circuit.
  • A geared electric DC motor used in the study had a maximum speed of 40 rpm. Since this speed was not suitable to move the rolling distributor and the nuts could not be optimally fed, a circuit was designed to change the motor speed (Figure 8a,b).

2.1.3. Principles and Methods of Software Design:

Figure 9 shows the block diagram describing the classification system.

Vector data with Microphone

The microphone was selected due to factors such as no contact with the product, high sensitivity, low cost, and easy to calibrate. The microphone transmits the sound produced from the impact of hazelnuts on the steel disk to the primary processing section via a sound card.
In this study, 800 Hazelnuts from each group were randomly selected and were individually release by the rolling distributor. The data obtained from audio signals in the time domain were stored for subsequent analysis using MATLAB software. A computer sound card was defined as an analog input and as an object (in Matlab) when collecting hazelnuts’ signals. This object was adjusted on trigger state and parameters like the required voltage to trigger programs related to sampling, the number of samples, the slope of signal, and program name were defined as follows:
Trigger voltage level = 0. 99 V or 990 mV
Rising = trigger condition
Samples per trigger = 700
With this operation, a 1 × 700 matrix or a row vector with normalized values was obtained, which contained the impact data. This matrix can be used for a variety of digital signal processing methods. According to the steps described in an online survey of 2400 hazelnuts, the obtained data from the impact of hazelnuts and the metal surface was automatically stored within a matrix with 700 × 2400 dimensions for further processing [16,17].

Signal Processing

In the primary processing of the signal, operations like analog-to-digital signal conversion and data normalization were carried out. In addition, the omission of signal noise was conducted by wavelet transform (Figure 10).

Features Extraction

The purpose of feature extraction was to select the significant features existing in the received signals, which are required for proper sorting and grading. The input signal in the feature extraction block indicates the digital signal in the time domain, and the output signal indicates the features vector. The values of signal range in the time domain and signal values in the wavelet domain were considered as input features (Figure 10) [17].
Wavelet analysis, similar to Fourier analysis, is a modified and scaled version of the original wavelet. In fact, the wavelet theory was introduced to overcome the Fourier transform problems. In wavelet analysis, the signals are subdivided into different segments and solved using scale factor and function transformation, and the results are obtained as a set of argument frequency data. In this case, a fully scalable modular window is used to solve the signal cut-off problem. The spectrum is calculated for each situation when the window moves along with the signal. This process is repeated with a window slightly shorter or longer for each new cycle. Finally, a set of time-frequency signal time-frequency representations will have resulted in different resolutions. A discrete wavelet transform is a series of wavelets that results from continuous wavelet transform. In discrete wavelet transforms, different frequencies are analyzed by transmitting signals from the high pass and low pass filters. In addition, in this transform, the signal resolution is controlled by the performance of the filters, and the scale is changed by down-sampling or up-sampling [17,18].

The Discrete Wavelet Transform Process

The scaling function can be expressed in the wavelet from minus infinity to a certain scale. If the wavelet spectrum is added to the scaling function spectrum, the new scaling performance is obtained with a double-width spectrum. We can express this relation in the so-called multiresolution formulation or two-scale relation (Figure 11) [19,20]:
φ ( 2 j t ) = k h j + 1 ( k ) φ ( 2 j + 1 t k ) .
The two-scale relation states that the scaling function at a certain scale can be expressed in terms of translated scaling functions with more detail. The first scaling function replaced a set of wavelets, and therefore, it can be expressed in terms of translated scaling functions at the next scale. More specifically, it can be written for the wavelet at level j (Figure 11):
ψ ( 2 j t ) = k g j + 1 ( k ) φ ( 2 j + 1 t k )
which is the two-scale relation between the scaling function and the wavelet. Signal ƒ(t) can also be expressed in terms of dilated and translated scaling functions at a scale j:
f ( t ) = k λ j ( k ) φ ( 2 j t k )
By considering a scale to j − 1 in this equation, the wavelets are added in order to keep the same level of detail. The signal ƒ(t) is expressed as follows:
f ( t ) = k λ j 1 ( k ) φ ( 2 j 1 t k ) + k γ j ( k ) ψ ( 2 j 1 t k )
If the scaling function φ j , k ( t ) and the wavelets ψ j , k ( t ) are orthonormal or a tight frame, then the coefficients λ j 1 ( k ) and γ j 1 ( k ) are found by taking the inner products;
λ j 1 ( k ) = f ( t ) , φ j , k ( t )
γ j 1 ( k ) = f ( t ) , ψ j , k ( t )
If φ j , k ( t ) is replaced with ψ j , k ( t ) in the inner products by suitably scaled and translated versions of (19) and (20), the following equations are resulted [21]:
λ j 1 ( k ) = m h ( m 2 k ) λ j ( m )
γ j 1 ( k ) = m g ( m 2 k ) λ j ( m )
These two equations state that by calculating the sum weighted sum of the scaling function coefficient from the previous scale, we can find wavelet and scaling function coefficients at the specified scale. Figure 12 and Figure 13 indicate a discrete wavelet transform for an arbitrary signal in three stages [17,21,22,23].
For this work, the peak values of signal range (v), in the time domain for each signal at 15.8 milliseconds were sampled. Then, based on the specified number of samples, these values at first were stored in a vector, and later approximation coefficients (CA) and detailed coefficients (CD) obtained from signal wavelet transform were calculated using MATLAB software. The wavelet transform was calculated through wavedec MATLAB code. The calculated coefficients were considered as signal features [17,18].

Sorting and Grading by an Artificial Neural Network

In order to sort and grade hazelnuts, multilayer perceptron (MLP) neural networks with a backpropagation learning method were used. The neural network program was written in MATLAB using a wavelet toolbox. The approximation coefficients (ACs) and detailed coefficients (DCs) obtained from the wavelet transform of each hazelnut signal were selected as network inputs to classify the hazelnuts into three groups [16,17].
In this network, iteration numbers and MSE of the learning data were considered powerful validation criteria because they impact the selection of the best training in optimal generalization point, the reduction of experimental errors, and the prevention of overtraining data. The Levenberg–Marquardt algorithm was used to train the network. In order to find the optimal value of the structure neural network, the k-fold cross validation was applied to perform the classification. For this example, 70%, 15%, and 15% of the data were selected for training, testing, and cross-validation (in this network, respectively). The number of neurons in the hidden layer was changed from 10 to 30 neurons, and the optimal number of neurons was obtained through trial and error. The least error was obtained for 21 neurons in the hidden layer (Figure 14) [22,24].

Sample Signal and Transform Wavelet Signal

For sorting and grading hazelnuts by audio processing, 2400 (total number of nuts) audio signals (700 samples from each signal) were taken at 15.8 milliseconds (Figure 15). Then, using a wavelet transform for each signal, the approximation and detailed coefficients were calculated (Figure 16). These coefficients and the details of 2400 signals were used as input features to ANN.
In order to classify hazelnuts by the features of the wavelet domain, a multilayer perceptron (MLP) neural network was used. Networks were trained by the use of a backpropagation algorithm and the Levenberg–Marquardt algorithm. The number of input neurons indicates the number of data obtained from the wavelet transform. The hidden layer usually consists of several neurons that represent the nonlinear system of the network. The artificial neural network was used to sort the hazelnuts; the intended error rate with minimum iteration can be achieved. For optimal network training, the network parameters were adjusted, so that the best weights for the network were stored when an MSE related to network validation for various iterations was the least.

3. Results and Discussion

The neurons of the hidden layer in the structure of the artificial neural networks were determined by trial and error method. Since the ultimate goal was to classify hazelnuts into three classes, the outer layer included three neurons. Network performance was determined using the rate of correct identification and the mean squared error (MSE) for network training and validation. The least mean square error for network validation was used as a base to select the number of neurons in hidden layers. Also, equation (9) was used to calculate MSE:
M S E = j = 0 P i = 0 N ( D i j Y i j ) 2 N P
where
Y i j is the network output (real output) for the sample of i in neuron j;
D i j is the optimal output for the sample of i in neuron j;
P is the number of neurons in the outer layer, and N is the number of samples in the training set.
To determine the number of neurons in the middle layer for different iterations, the minimum mean squared error (MSE) was considered for the network validation. It was more stable and was selected as the optimal network for hazelnut classification.
The number of neurons in hidden layer was changed from 10 to 30 neurons, and the optimal number of neurons was obtained through trial and error. The least error was obtained for 21 neurons in the hidden layer. The output layer consisted of three neurons to reach the desired target. To determine the number of neurons in the hidden layer, as shown in Figure 17 and Figure 18. For different epochs and neurons, the minimum of MSE was used to validate the network. According to the results of Figure 17 and Figure 18, the least-squares error values (MSE) were obtained for neurons 10 to 30, which resulted in better performance for the network with 21 neurons in the hidden layer.
After network training and validation (Figure 18), the correct sorting for big, small, hollow, or damaged hazelnuts was determined as 96.1%, 89.3%, and 93.1%, respectively. Also, the overall accuracy for these hazelnuts with the 4-21-3 model was 92.8%.

4. Conclusions

In this study, a new device was designed and constructed for sorting and grading hazelnuts. This device consisted of two main systems; a mechanical system operated by a rolling distributor machine and an electrical system integrating audio signal processing and a neural network. The simultaneous sorting and grading of hazelnuts were investigated. There were 2400 signals in time domain gathered and converted into wavelet domain using discrete wavelet transform. The obtained features were considered as inputs of the neural network. In this research, a multilayer perceptron network was used. Moreover, the 4-21-3 structure for neural network was presented with an accuracy of 96.1%, 89.3%, and 93.1% for big/small, hollow, or damaged hazelnuts, respectively. In general, the overall accuracy of the system was 92.8%.
With the results of a built-in device based on acoustic signal processing in the laboratory, the use of industrial signal processing can certainly enhance the capabilities of smart devices made in the food industry. Future work will focus on further testing and collaboration with the industry to test the system in the industry setting.

Author Contributions

Conceptualization, Y.A.-G., A.M., and M.F.; methodology, Y.A.-G., A.M., and M.F.; software, Y.A.-G., M.F., and A.M.; validation, Y.A.-G., and J.M.M.; formal analysis, M.F., Y.A.-G., and A.M.; investigation, Y.A.-G., A.M., M.F., and J.M.M.; resources, Y.A.-G. and M.F.; data curation, M.F.; writing—original draft preparation, Y.A.-G., and M.F.; writing—review and editing, Y.A.-G. and J.M.M.; visualization, Y.A.-G., A.M.; supervision, Y.A.-G.; project administration, Y.A.-G.; funding acquisition, Y.A.-G. and J.M.M. All authors have read and agreed to the published version of the manuscript.

Funding

This study was financially supported by the University of Mohaghegh Ardabili and is based on work supported by NIFA/USDA under project numbers SC-1700540 and SC-1700543.

Conflicts of Interest

The authors declare no conflicts of interest. The funders had no role in the design of the study; in the collection, analyses, or interpretation of data; in the writing of the manuscript, or in the decision to publish the results.

References

  1. Mozaffarian, V. Trees and Shrubs of Iran; Farhang Moaser Publ.: Tehran, Iran, 2005. [Google Scholar]
  2. FAO; WFP; UNICEF. The State of Food Insecurity in the World 2018. In Building Climate Resilience for Food Security and Nutrition; FAO/WFP: Rome, Italy; UNICEF: New York, NY, USA, 2018; Available online: http://www.fao.org/3/i9553en/i9553en.pdf (accessed on 28 September 2019).
  3. Hopfield, J.J. Neural networks and physical systems with emergent collective computational abilities. Proc. Natl. Acad. Sci. USA 1982, 79, 2554–2558. [Google Scholar] [CrossRef] [PubMed] [Green Version]
  4. Zhao, M.; Li, Z.; He, W. Classifying four carbon fiber fabrics via machine learning: A comparative study using ANNs and SVM. Appl. Sci. 2016, 6, 209. [Google Scholar] [CrossRef] [Green Version]
  5. Lee, A.; Geem, Z.W.; Suh, K.-D. Determination of optimal initial weights of an artificial neural network by using the harmony search algorithm: Application to breakwater armor stones. Appl. Sci. 2016, 6, 164. [Google Scholar] [CrossRef] [Green Version]
  6. Freeman, D.; Gupta, S.; Smith, D.H.; Maja, J.M.; Robbins, J.; Owen, J.S.; Peña, J.M.; de Castro, A.I. Watson on the Farm: Using Cloud-Based Artificial Intelligence to Identify Early Indicators of Water Stress. Remote Sens. 2019, 11, 2645. [Google Scholar] [CrossRef] [Green Version]
  7. Ghazanfari, A.; Irudayaraj, J.; Kusalik, A.; Romaniuk, M. Machine vision grading of pistachio nuts using Fourier descriptors. J. Agric. Eng. Res. 1997, 68, 247–252. [Google Scholar] [CrossRef]
  8. Pearson, T. Detection of pistachio nuts with closed shells using impact acoustics. Appl. Eng. Agric. 2001, 17, 249. [Google Scholar] [CrossRef]
  9. Cetin, A.E.; Pearson, T.; Tewfik, A.H. Classification of closed-and open-shell pistachio nuts using voice-recognition technology. Trans. Asae 2004, 47, 659. [Google Scholar] [CrossRef]
  10. Mahmoudi, A.; Omid, M.; Aghagolzadeh, A.; Borgayee, A. Grading of Iranian’s export pistachio nuts based on artificial neural networks. Int. J. Agric. Biol. 2006, 8, 371–376. [Google Scholar]
  11. Kurtulmuş, F.; Öztüfekçi, S.; Kavdır, İ. Classification of chestnuts according to moisture levels using impact sound analysis and machine learning. J. Food Meas. Charact. 2018, 12, 2819–2834. [Google Scholar] [CrossRef]
  12. Agrawal, A.; Nagaraj, K.; Karthik, R. Non-destructive acoustic based moisture measurement system for cashew nuts. In Proceedings of the ETFA, Toulouse, France, 5–9 September 2011; pp. 1–5. [Google Scholar]
  13. Hosseinpour, A.; Seifi, E.; Javadi, D.; Ramezanpour, S.S.; Molnar, T.J. Nut and kernel characteristics of twelve hazelnut cultivars grown in Iran. Sci. Hortic. 2013, 150, 410–413. [Google Scholar] [CrossRef]
  14. Khalesi, S.; Mahmoudi, A.; Hosainpour, A.; Alipour, A. Detection of walnut varieties using impact acoustics and artificial neural networks (ANNs). Mod. Appl. Sci. 2012, 6, 43. [Google Scholar] [CrossRef] [Green Version]
  15. Immigration and Naturalization Service. Hazelnuts—Specifications and Test Methods; Immigration and Naturalization Service: Washington, DC, USA, 2017; Volume ISIRI 247, pp. 1–23.
  16. Beale, M.; Hagan, M.; Demuth, H. Neural Network Toolbox: MATLAB User’s Guide; Mathworks Inc.: Natick, MA, USA, 2017; version 11; p. 512. [Google Scholar]
  17. Misiti, M. Wavelet Toolbox for Use with MATLAB: User’s Guide; Version 2; Computation, Visualization, Programming; MathWorks Incorporated: Natick, MA, USA, 2000. [Google Scholar]
  18. Kaiser, G. A friendly Guide to Wavelets; Springer Science & Business Media: Berlin, Germany, 2010. [Google Scholar]
  19. Heil, C.E.; Walnut, D.F. Continuous and discrete wavelet transforms. Siam Rev. 1989, 31, 628–666. [Google Scholar] [CrossRef] [Green Version]
  20. Oppenheim, A.V. RW Schafer Digital Signal Processing; Prentice-Hall: Englewood Cliffs, NJ, USA, 1975; Volume 6, pp. 125–136. [Google Scholar]
  21. Sidney Burrus, C.; Gopinath, R.A.; Guo, H. Introduction to wavelets and wavelet transforms. In A Primer; Prentice Hall: Upper Saddle River, NJ, USA, 1998. [Google Scholar]
  22. Gurney, K. An Introduction to Neural Networks; CRC Press: Boca Raton, FL, USA, 2014. [Google Scholar]
  23. Torrence, C.; Compo, G.P. A practical guide to wavelet analysis. Bull. Am. Meteorol. Soc. 1998, 79, 61–78. [Google Scholar] [CrossRef] [Green Version]
  24. Priddy, K.L.; Keller, P.E. Artificial Neural Networks: An Introduction; SPIE Press: Bellingham, WA, USA, 2005; Volume 68. [Google Scholar]
Figure 1. Schematic of the system.
Applsci 10 03315 g001
Figure 2. The designed system and its components.
Applsci 10 03315 g002
Figure 3. (a) Hollow or damaged hazelnut for two size; (b) small intact and (c) big intact hazelnuts.
Applsci 10 03315 g003
Figure 4. Acoustic chamber.
Applsci 10 03315 g004
Figure 5. Rolling distributor and coating.
Applsci 10 03315 g005
Figure 6. (a) Lining the housing and its different sections; (b) rolling distributor.
Applsci 10 03315 g006
Figure 7. (a) The sound collecting circuit and (b) the schematic diagram of the circuit.
Applsci 10 03315 g007aApplsci 10 03315 g007b
Figure 8. (a) Direct Current (DC) motor speed controller circuit and (b) its schematic diagram.
Applsci 10 03315 g008
Figure 9. Block diagram of system software.
Applsci 10 03315 g009
Figure 10. Wavelet transform.
Applsci 10 03315 g010
Figure 11. Decomposition at level 3: f(t) = d1 + d2 + d3 + a3.
Applsci 10 03315 g011
Figure 12. Wavelet block diagram of filter analysis—three level filter bank.
Applsci 10 03315 g012
Figure 13. Representation of three-step discrete wavelet transforms calculation using a filter bank idea for a desired signal (s = d1 + d2 + d3 + a3).
Applsci 10 03315 g013
Figure 14. The relationship between the different parts of system, software and hardware.
Applsci 10 03315 g014
Figure 15. Signal curve of a hazelnut in the time domain.
Applsci 10 03315 g015
Figure 16. Signal curve of a hazelnut in the wavelet domain.
Applsci 10 03315 g016
Figure 17. Mean square error curve with the increased neurons in the hidden layer.
Applsci 10 03315 g017
Figure 18. Network learning curve for the structure of 4-21-3 for 167 epochs.
Applsci 10 03315 g018
Table 1. Mean dimensions of 100 samples of each group of hazelnuts.
LengthWidthThicknessMean
Large(a)20.53 mm19.35 mm17.80 mm19.23 mm
Small(b)16.24 mm16.21 mm14.78 mm15.75 mm

