Article

Effects of Incoherent Front Cover Glass on Current-Voltage Characteristics of Cu(In,Ga)Se2 Solar Cells: Investigation into Calculation Accuracy for Cover Glass Modeled as Optically Coherent or Incoherent

1
Department of Information Display, Kyung Hee University, Seoul 02447, Korea
2
Department of Information and Communications Engineering, Myongji University, Gyeonggi-do 17058, Korea
*
Author to whom correspondence should be addressed.
These authors contributed equally to this work.
Appl. Sci. 2020, 10(9), 3312; https://doi.org/10.3390/app10093312
Submission received: 24 February 2020 / Revised: 4 May 2020 / Accepted: 6 May 2020 / Published: 9 May 2020
(This article belongs to the Section Optics and Lasers)

Abstract

:
We numerically investigate the effects of an incoherent front cover glass on the current–voltage (J–V) characteristics of a Cu(In,Ga)Se2 (CIGS) solar cell using an integrated optoelectronic model. A 3-mm cover glass—the thickness of which was larger than the coherence length of sunlight—was incoherently modeled based on the equispaced thickness averaging method, where coherent simulation results of the wave equation were averaged over a set of equispaced phase thicknesses. The changes in optical power dissipation, absorptivity and electron–hole pair generation rate were calculated depending on the variation of the equispaced phase thickness. The calculation results of the J–V curves were obtained through numerical solutions of the coupled Poisson and continuity equations. By comparing the J–V curves calculated between coherently and incoherently modeled cover glass, we obtained a maximum ±0.54% deviation of the short-circuit current density. This demonstrates that the front cover glass should be modeled as optically incoherent to improve the calculation accuracy of the electrical J–V curves as well as the optical absorption characteristics in the optoelectronic modeling of CIGS solar cells.

Graphical Abstract

1. Introduction

Thin-film solar cells based on a Cu(In,Ga)Se2 (CIGS) absorption material have been intensively investigated as an auspicious alternative to traditional silicon-based solar cells owing to their low cost and high efficiency [1,2,3]. Because of their high optical absorption coefficient, CIGS solar cells with a wide absorption spectrum and high stability reached a power conversion efficiency of 19.9% in 2008 [1] and beyond 20% in more recent years [2,3]. In general, a CIGS solar cell consists of multiple sub-micrometer layers, which range from a metal back contact to transparent conducting oxide (TCO) top contact layers. In the module configuration, millimeter-thick front encapsulation and cover glass layers are added on the TCO top contact layer to implement glass–glass encapsulating technology, which can provide a higher mechanical durability and operational stability [4].
Because the coherence length of sunlight is approximately 0.6 μm [5] (preserving the phase information of the optical field), the multilayer structure of a CIGS solar cell module can be treated as mixed coherent and incoherent layers in optical modeling. Inside the coherent multilayer structure, the thickness of which is much less than the coherence of sunlight, the optical interference effect plays an important role in the optical characteristics of the reflectivity and absorptivity [6]. By contrast, light experiences a random phase change at each coherence length, such that the optical interference effect, on average, disappears in the incoherent layer [7,8]. Thus, this mixed coherent-incoherent multilayer structure of a CIGS solar cell greatly affects the absorption characteristics and has to be thoroughly considered in optoelectronic modeling.
There have been several studies conducted on the optoelectronic modeling of a CIGS solar cell, which have provided the current–voltage (J–V) characteristics obtained through the combination of optical and electrical simulations [9,10,11,12,13]. However, the previous optoelectronic modeling results of CIGS solar cells have not included the incoherent front encapsulation or cover glass layers in the optical modeling. Instead, they assumed sunlight to be directly incident from the air into the multilayer structure of the CIGS solar cell. The analytical formulation of a 2 × 2 transfer matrix method (TMM) based on the thin-film optics was used to calculate the optical interference effect within the coherent multilayer structure, which ranged from the TCO top contact layer to the metal back contact layer [11,12,13]. Thus, the previous optoelectronic modeling methods were insufficient when considering the realistic aspect of the optical and electrical characteristics of a CIGS solar cell because the optical effect of the incoherent front layer was not considered.
According to thin-film optics, the absorption spectrum of the mixed coherent-incoherent layer structure of organic solar cells was calculated based on the generalized transfer matrix method (GTMM). Here, the optical behavior of the electric field amplitude in the coherent multilayer was described by the 2 × 2 TMM, and the optical behavior of the electric field intensity in the incoherent layer was modeled by the 2 × 2 intensity matrix formulation [14,15]. In numerical methods, such as rigorous coupled-wave analysis (RCWA) and finite element method (FEM), coherent simulation results (obtained through the numerical solution of the wave equation in a small mesh or grid) were averaged out to provide the incoherent characteristics of light propagation in a mixed coherent-incoherent multilayer structure [16,17,18]. The effects of the incoherent front layer on the reflection spectrum of the CIGS solar cell were calculated based on the spectral averaging method in combination with the RCWA [16,17].
We recently used the equispaced thickness averaging method (ETAM) to efficiently calculate the effect of the incoherent front layer on the reflection spectra of a CIGS solar cell [19]. In the ETAM, coherent simulation results (obtained based on a set of equispaced phase thicknesses added to the initial thickness of the incoherent layer) were averaged to optically model the mixed coherent-incoherent multilayer structure. However, the above-mentioned optical modeling methods, which can only consider the effects of the incoherent layer on the absorption characteristics, were also insufficient to obtain the realistic J–V characteristics of a CIGS solar cell owing to their limitations in the electrical model. In addition, it has yet to be investigated how the optical effect of the front incoherent layer affects the J–V characteristics of a CIGS solar cell.
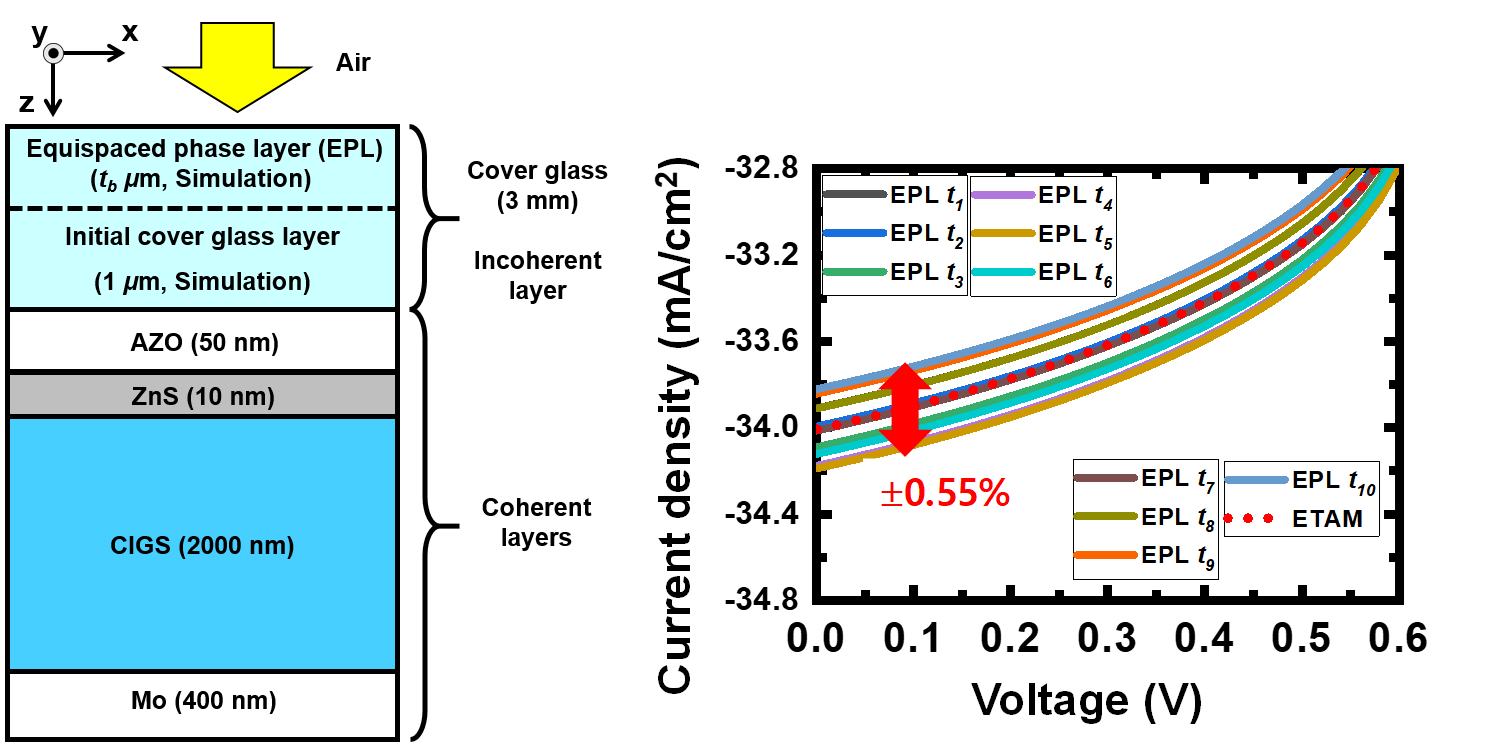
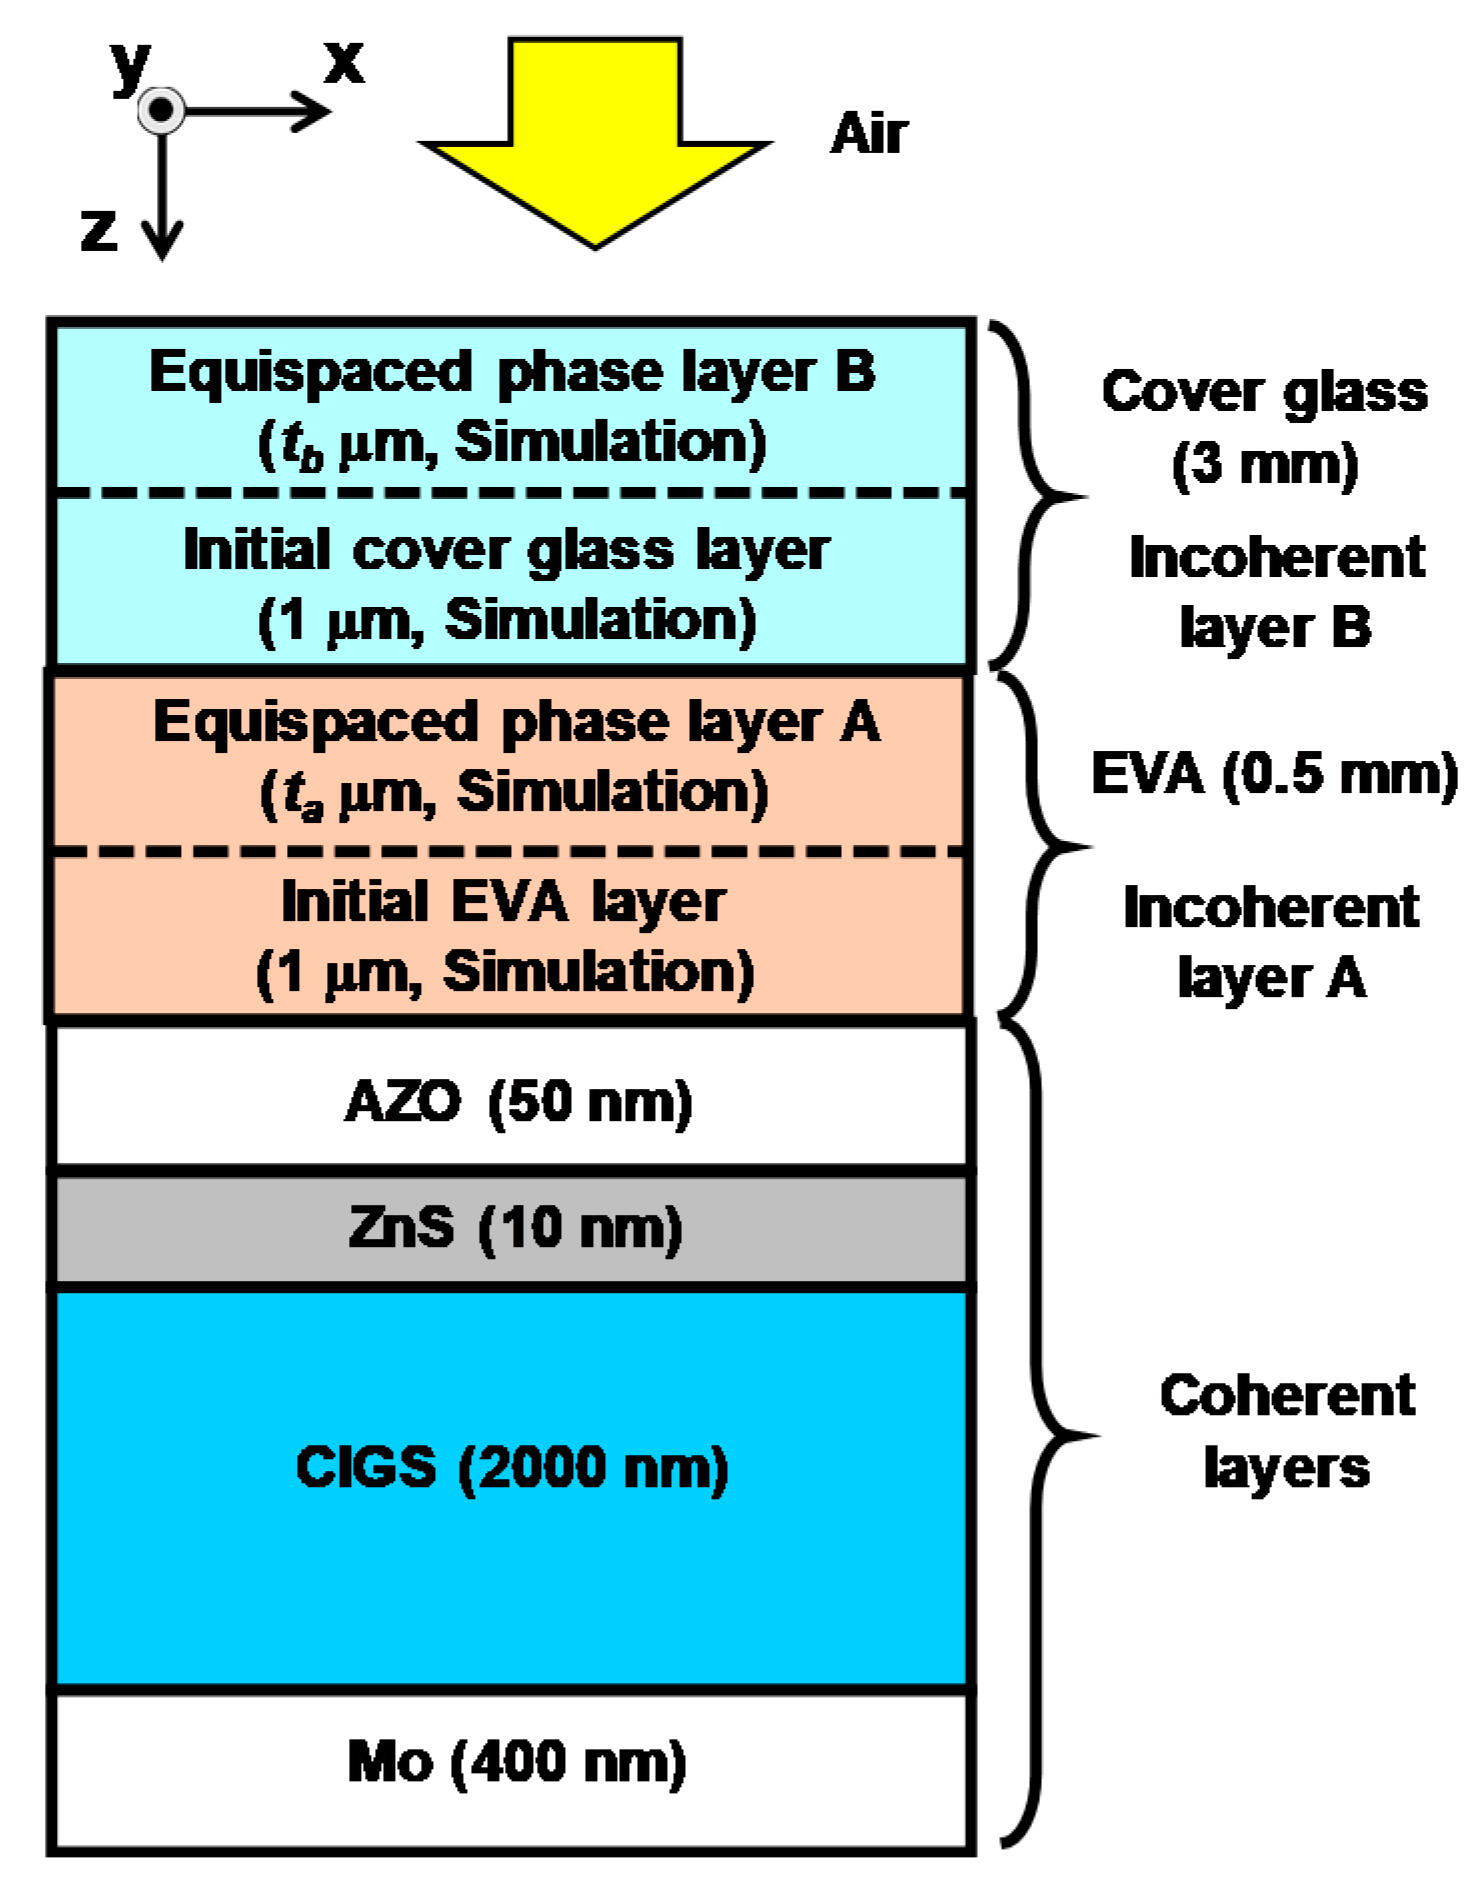
In this study, we investigated the effects of the incoherent front cover glass on the J–V characteristic of a CIGS solar cell. An incoherent cover glass was optically modeled as a 1-μm initial layer plus a set of equispaced phase layers (EPLs), the thicknesses of which are determined based on the ETAM. Both the optical and electrical characteristics of a CIGS solar cell were numerically calculated using an FEM-based integrated optoelectronic model. The changes in the optical power dissipation, absorptivity, and electron–hole pair generation rates were calculated depending on the variation of the equispaced phase thickness of the EPL. To obtain the ETAM-applied calculation, which includes the incoherent property of a thick cover glass layer, coherent optical simulation results were averaged over 10 equispaced phase thicknesses of the EPL. By comparing the J–V characteristics of the CIGS solar cell calculated between coherently and incoherently modeled cover glass layers, we calculated the percent of deviation of the short-circuit current density (JSC) and open-circuit voltage (VOC), which can be considered to be the inaccuracy of the calculation when a thick cover glass layer is inappropriately modeled as a coherent layer.

2. Optoelectronic Modeling Methods

2.1. Optical Modeling

Figure 1 shows a schematic diagram of the multilayer structure of the CIGS solar cell used in this study [17,19]. It comprises a cover glass (3 mm) at the top, aluminum-doped zinc oxide (AZO) (50 nm) as a TCO, zinc sulfide (ZnS) (10 nm) as an n-doped layer, CIGS (2 μm) as a p-doped layer and molybdenum (Mo) (400 nm) as a bottom contact layer. The bottom glass substrate is omitted because it does not affect the optical and electrical characteristics of the CIGS solar cell.
Sunlight is assumed to have a spectral irradiance of air mass (AM) 1.5 sunlight S ( λ ) with a total power of S0 = 100 mW/cm2. Sunlight is assumed to be normally incident from the air into the CIGS solar cell, which can be optically modeled as a mixed incoherent-coherent multilayer structure. The 3-mm cover glass, the thickness of which is larger than the coherence length of sunlight (~0.6 μm), is considered optically incoherent. In optical modeling based on the ETAM, the thickness of the transparent incoherent layer can be converted into the corresponding optical phase change, which has a period of 2π. Thus, the thickness of the transparent cover glass used in the simulation does not require an actual thickness of 3 mm [18,19]. To reduce the computation time, we use a 1-μm-thick initial cover glass layer in addition to the EPL, the role of which is to efficiently model a random phase change of light in the incoherent layer through a set of equispaced phase thicknesses in the EPL [18]. The remaining four layers were treated as coherent layers. Nearly all incident lights were absorbed around the interface between the ZnS and CIGS layers and there is no optical interference effect on the light absorption characteristics of the CIGS layer, which will be explained later. Thus, the CIGS layer can be treated as optically coherent although its 2-μm thickness is greater than the coherence length of sunlight.
In the optical modeling, we assume that all materials used in the CIGS solar cell were non-magnetic, linear, isotropic and homogeneous media with an instantaneous response. If r = x a ^ x + z a ^ z indicates the position on the x-z plane in Figure 1, the wave equation can be written as
× [ × E ( r , λ ) ] k 0 2 n ˜ 2 E ( r , λ ) = 0 ,
where E ( r , λ ) is the electric field amplitude at a wavelength of λ, and k 0 = 2 π / λ is the wave number of the free space. The complex refractive index of the materials is expressed as n ˜ = n ¯ j κ , where n ¯ and κ were the refractive index and extinction coefficient, respectively. If tb represents the equispaced phase thickness of the EPL in Figure 1, the numerical solution of the wave equation in Equation (1) depends on the value of tb. The time-averaged Poynting vector S ( r , λ , t b ) , indicating the amount of the optical power flow, is given by
S ( r , λ , t b ) = 1 2 Re { E ( r , λ , t b ) × H * ( r , λ , t b ) } ,
where H * ( r , λ , t b ) is the complex conjugate of the magnetic field amplitude. The amount of optical absorption is described by the optical power dissipation, which is given by
Q ( r , λ , t b ) = S ( r , λ , t b ) .
The absorptivity can then be obtained by taking the integration over the optical power dissipation within the entire region of the CIGS solar cell in reference to the wavelength-dependent incident power from the uppermost boundary, which corresponds to the solar irradiance of AM 1.5 sunlight. Thus, the absorptivity is written as
A ( λ , t b ) = 1 S ( λ ) Q ( r , λ , t b ) d r .
According to the ETAM, the effect of the incoherent layer can be modeled by averaging the coherent simulation results over a set of equispaced phase thicknesses [18,19]. In the coherent simulations, the set of equispaced phase thicknesses of the EPL used in the cover glass layer is matched with the equally spaced optical phase changes ranging between 0 and 2π, which provide different optical calculation results of the CIGS solar cell. However, if the cover glass is appropriately modeled as optically incoherent, all calculation results with respect to the set of equispaced phase thicknesses should be equal to the ETAM-applied incoherent calculation result irrespective of these equispaced phase thicknesses. Thus, coherent simulation results over the set of equispaced phase thicknesses of the EPL can be interpreted as the variation of the calculation inaccuracy when an incoherent cover glass layer is inappropriately modeled as optically coherent. Then, the ETAM-applied optical power dissipation and absorptivity, which include the effect of the incoherent cover glass layer, can then be expressed as
Q E T A M ( r , λ ) = 1 N b = 1 N Q ( r , λ , t b ) ,
A E T A M ( λ ) = 1 S ( λ ) Q E T A M ( r , λ ) d r ,
where N indicates the number of equispaced phase thicknesses. Finally, the optical power dissipation Q ( r , λ , t b ) is related with the generation rate of the electron–hole pair, which will be used as one of the input parameters in the continuity equation of the electrical modeling. The electron–hole–pair generation rate G ( r , t b ) , depending on the thickness of the EPL, is given by
G ( r , t b ) = S ( λ ) Q ( r , λ , t b ) h c / λ d λ ,
where h is the Plank constant and c is the speed of light in a free space. When the optically incoherent characteristics of the thick cover glass were considered, the ETAM-applied generation rate of the electron–hole pair G E T A M ( r ) is written as
G E T A M ( r ) = S ( λ ) Q E T A M ( r , λ ) h c / λ d λ .

2.2. Electrical Modeling

Electrical modeling is applied based on the drift–diffusion model, which is widely used in the electrical modeling of CIGS solar cells [9]. The drift–diffusion model consists of coupled Poisson and continuity equations for the electrons and holes. First, the electron current density J n ( r ) and hole current density J p ( r ) , composed of the drift and diffusion components, were
J n ( r ) = q μ n n ( r ) V ( r ) + q D n n ( r ) ,
J p ( r ) = q μ p p ( r ) V ( r ) q D p p ( r ) ,
where q is the basic electric charge and V ( r ) is the electric potential. The terms n ( r ) and p ( r ) indicate the electron and hole concentrations, respectively. When μn and μp represent the electron and hole mobilities, D n and D p indicate the diffusion coefficients for the electrons and holes, which were obtained based on the Einstein relation D n ( p ) = μ n ( p ) k B T / q . Here, kB is the Boltzmann constant and T is the absolute temperature. The Poisson equation is expressed as
ε 0 [ ε r V ( r ) ] = q [ n ( r ) p ( r ) + N A ( r ) N D + ( r ) ] ,
where ε 0 is the electric permittivity in a free space and ε r is the dielectric constant, whereas the acceptor and donor densities were N A ( r ) and N D + ( r ) . Finally, the continuity equation is given by
1 q J n ( r ) = [ G ( r ) R ( r ) ] ,
1 q J p ( r ) = G ( r ) R ( r ) ,
where G ( r ) indicates the generation rate of the electron–hole pair, which is determined through Equations (7) or (8) depending on whether the thick cover glass is considered to be coherent ( G ( r , t b ) ) or incoherent ( G E T A M ( r ) ), respectively. The term R ( r ) represents the recombination rate of the electron–hole pair, where we include the non-radiative Shockley–Read–Hall (SRH) and radiative recombination processes through R ( r ) = R S R H ( r ) + R r a d ( r ) in this calculation.
The non-radiative SRH recombination rate is expressed as
R S R H ( r ) = n ( r ) p ( r ) n i 2 ( r ) τ p ( r ) [ n ( r ) + n 1 ( r ) ] + τ n ( r ) [ p ( r ) + p 1 ( r ) ] ,
where n i ( r ) is the intrinsic carrier concentration when τ p ( r ) and τ n ( r ) represent the carrier lifetimes of the electron and hole, respectively. The intrinsic carrier concentration is different in each material and can be obtained by
n i ( r ) = N c ( r ) N v ( r ) exp [ E g ( r ) 2 k B T ] ,
where N c ( r ) and N v ( r ) were the effective density of states in the conduction and valence bands, respectively, when E g ( r ) represents the band gap energy of the material. The electron and hole concentrations at the trap energy level of E t ( z ) were expressed as n 1 ( r ) = n i ( r ) exp { [ E t ( r ) E i ( r ) ] / k B T } and p 1 ( r ) = n i ( r ) exp { [ E i ( r ) E t ( r ) ] / k B T } , where E i ( r ) represents the intrinsic Fermi energy level. In addition, the radiative recombination rate is written as
R r a d ( r ) = R B [ n ( r ) p ( r ) n i 2 ( r ) ] ,
where R B is the coefficient of the radiative recombination.

3. Simulation Results

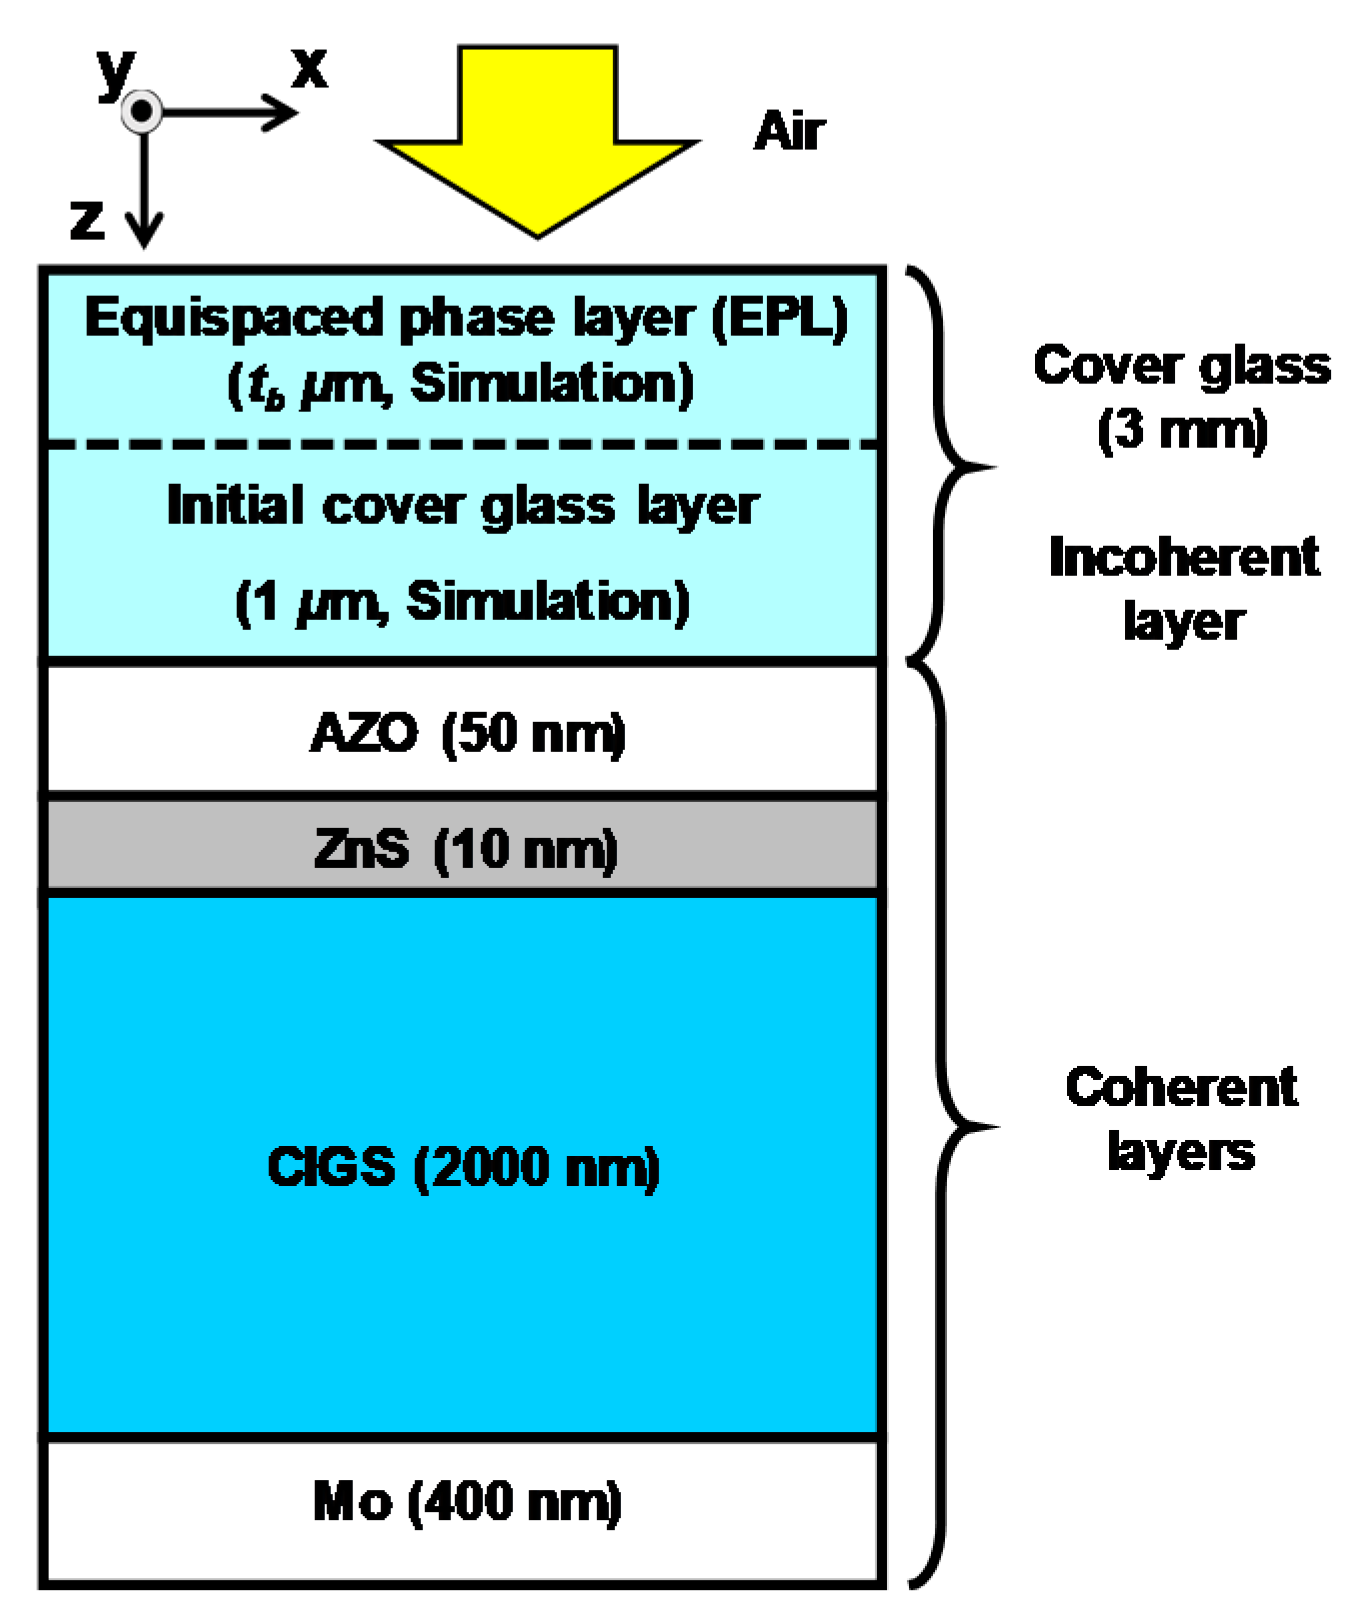
The optical modeling of the CIGS solar cell in Figure 1 was conducted based on the two-dimensional (2D) FEM, which was implemented using the RF module of COMSOL Multiphysics [
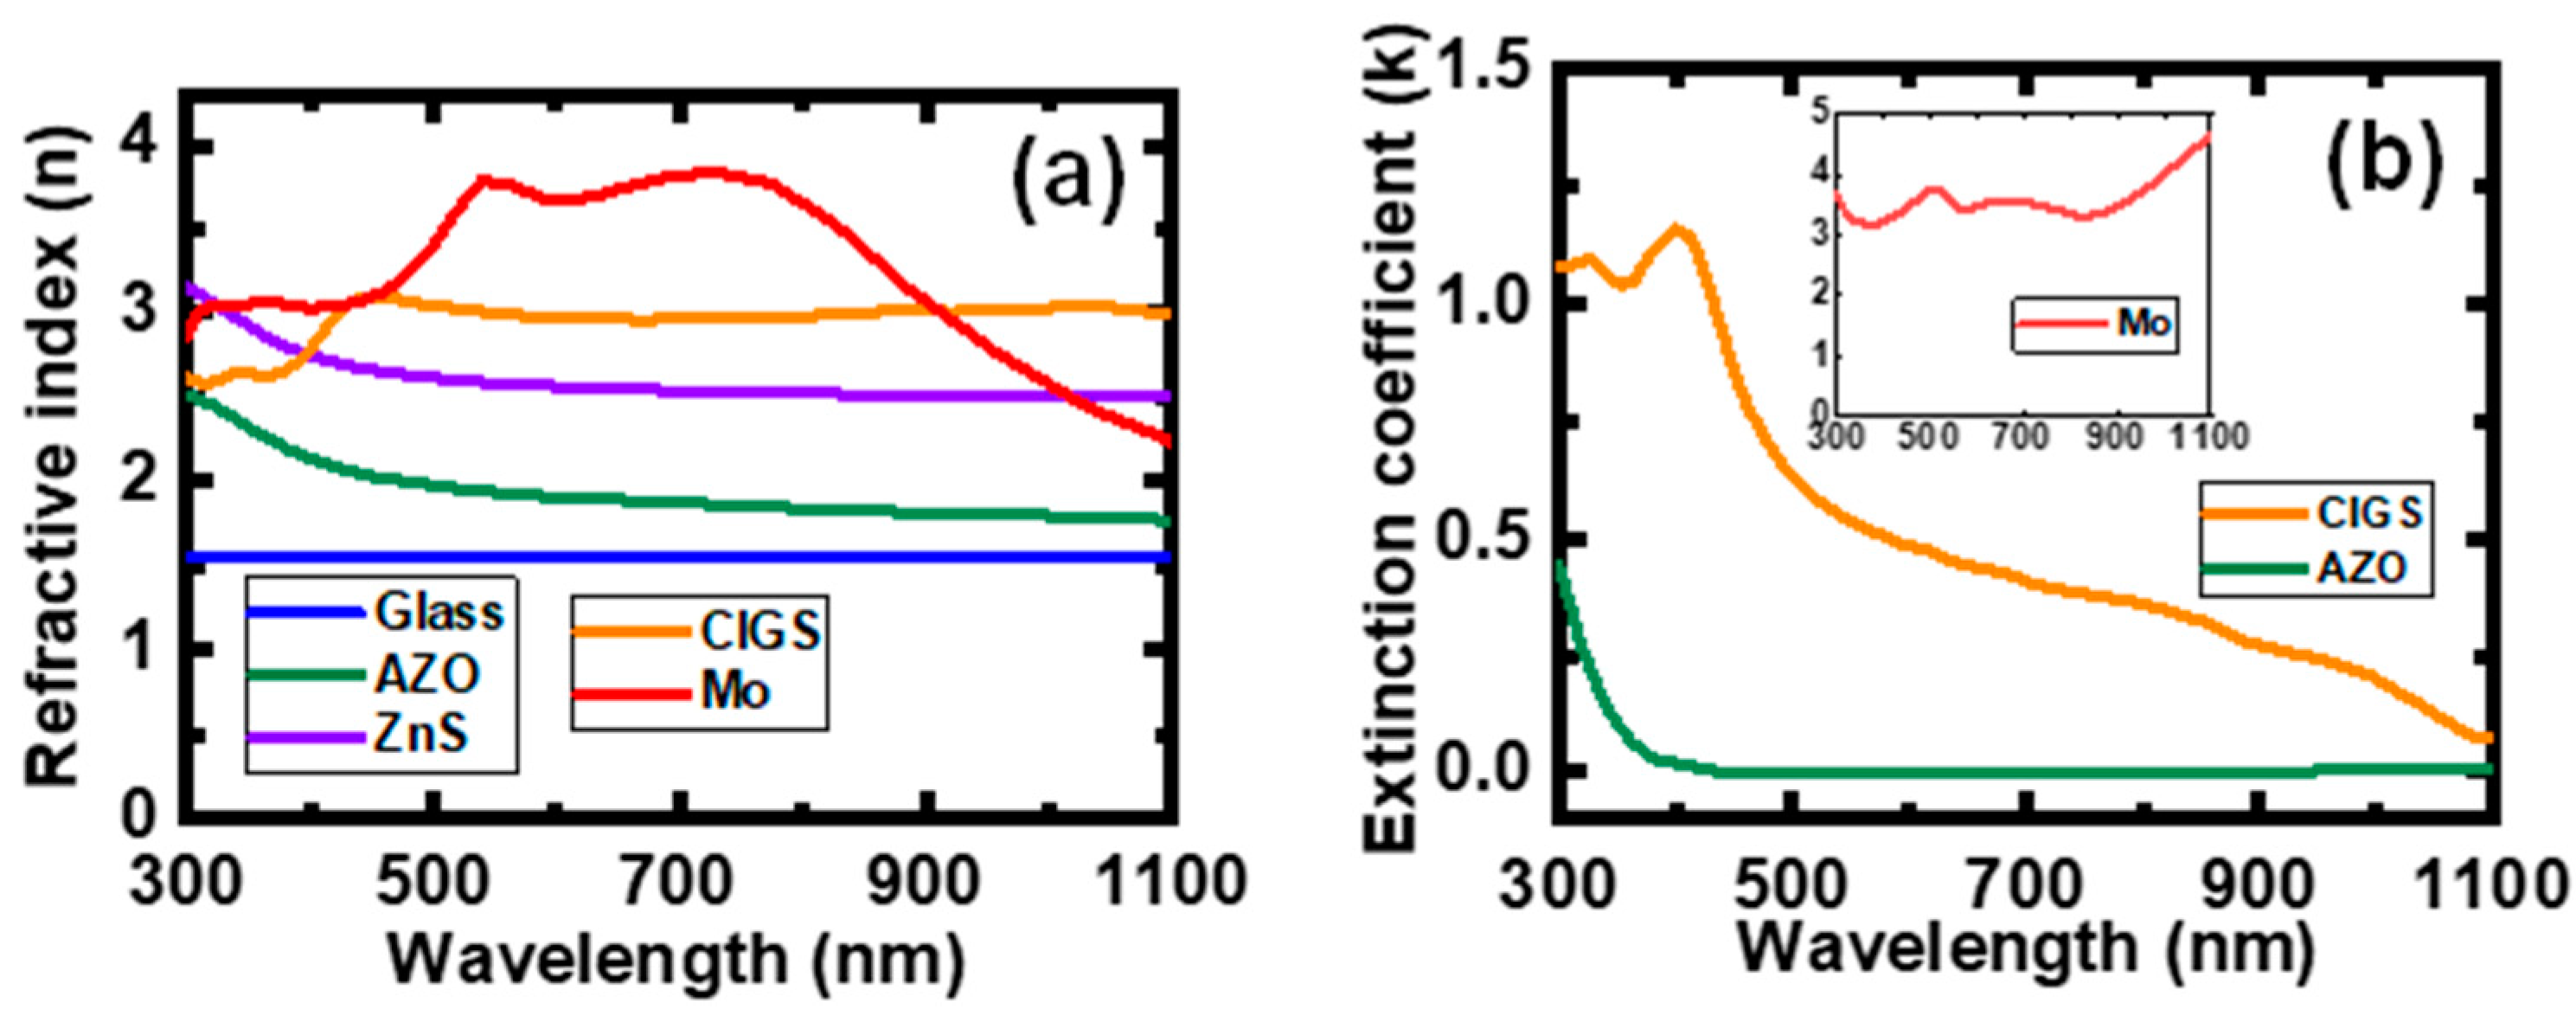
20]. The complex refractive index spectra of the materials, which were taken from [21,22,23], are shown in Figure 2. In the FEM simulation, wave equations shown in Equation (1) were numerically solved at very small meshes of the calculation domains with appropriate boundary conditions. We use the port boundary condition at the uppermost boundary of the air domain to generate a plane wave with a wavelength of λ, which was normally injected into the multilayer structure of the CIGS solar cell. In addition, the Floquet periodic boundary conditions were used at the leftmost and rightmost boundaries of the simulation domain.
If the refractive index of the transparent incoherent cover glass was ng, the equispaced phase thickness of the EPL can be determined by
t b = λ 2 n g ( b 1 ) N ,   b = 1 ,   2 ,   ,   ( N 1 ) ,   N .
When the ETAM is applied to the incoherent modeling of a planar organic solar cell, the accuracy of the calculation results converge if the number of the equispaced phase thicknesses is greater than five [18]. In this calculation, we set the number of equispaced phase thicknesses to 10. Hence, the corresponding equispaced phase thicknesses of the EPL were
t 1 = 0 , t 2 = λ 20 n g , t 3 = 2 λ 20 n g ,   ,   t 9 = 8 λ 20 n g , t 10 = 9 λ 20 n g .
Figure 3 shows the calculated 2D spatial profiles of the electric field amplitude, time-averaged Poynting vector, and optical power dissipation when the equispaced phase thickness of the EPL was set to t1 = 0 nm. All calculation results were obtained at a wavelength of λ = 400 nm, where the extinction coefficient of the CIGS material was the largest, as shown in Figure 2b. In Figure 3, all calculation results depend only on the longitudinal z-direction and have no spatial dependence of the transverse x-direction, which results from the Floquet periodic boundary condition applied to the leftmost and rightmost boundaries in the optical simulation domain. In Figure 3b, the time-averaged Poynting vector remains unchanged at the transparent cover glass layer, but continues decreasing at the AZO, ZnS and CIGS layers owing to the gradual light absorption at these layers. Because of the very high absorption coefficient at the 2-μm thick CIGS layer, the optical power dissipation in Figure 3c was significant near the ZnS/CIGS interface and there was no light absorption near the CIGS/Mo interface. Hence, the CIGS layer can be optically modeled as a coherent layer although its 2-μm thickness was larger than the coherence length of sunlight.
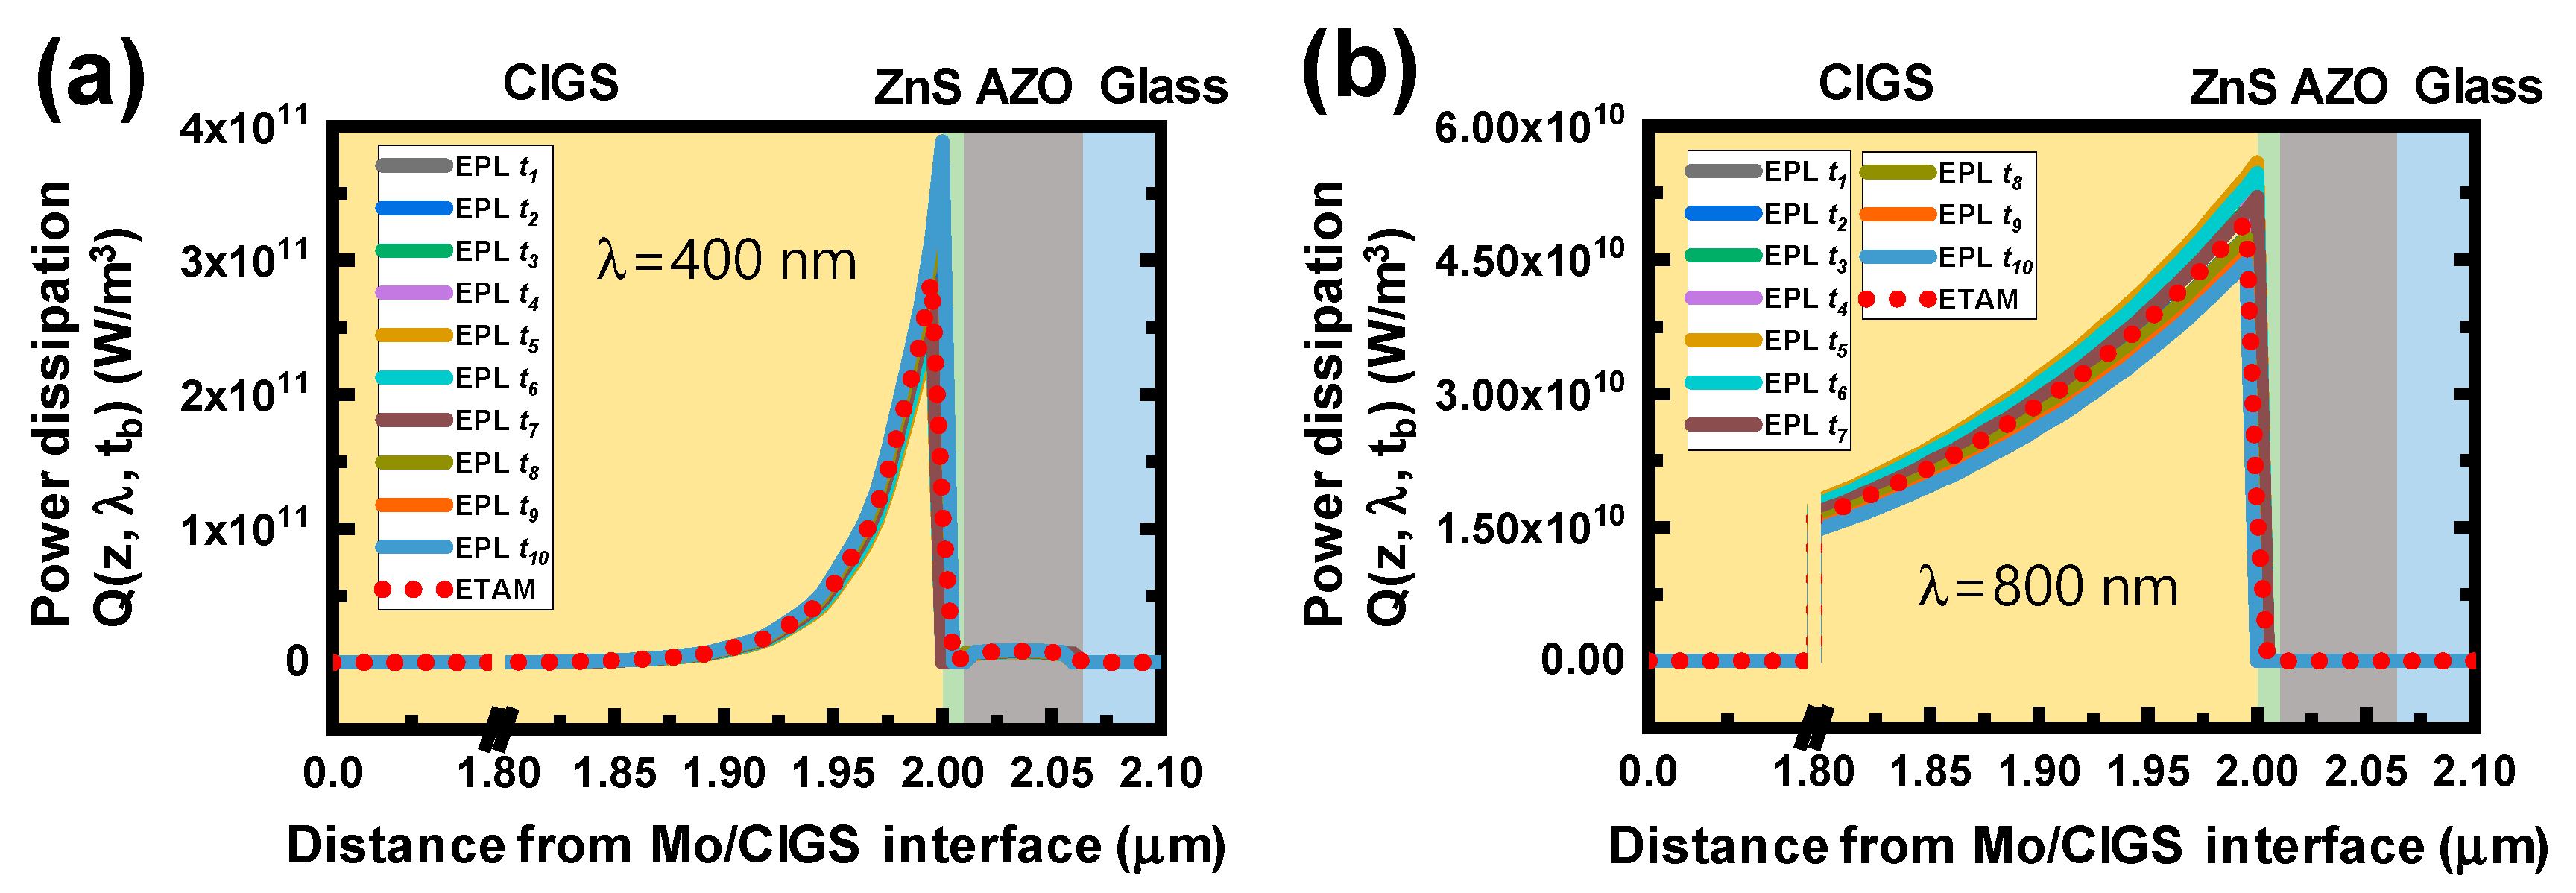
To investigate how the light absorption within the CIGS solar cell was changed depending on the equispaced phase thickness of the EPL, the spatial profiles of the optical power dissipations were calculated at 10 different equispaced phase thicknesses of t1, t2, ⋅⋅⋅ and t10 when the wavelengths of sunlight were 400 and 800 nm. Because the 2D calculation results obtained through the optical modeling, as shown in Figure 3, depend only on the longitudinal z-direction owing to the periodic boundary condition applied to the transverse x-direction, the calculated spatial profiles in Figure 4 were plotted in the longitudinal z-direction. In Figure 4a, the overall exponentially decaying shapes of the optical absorption calculated at different thicknesses of the EPL were comparable to each other except for their relative magnitudes. This was ascribed to the difference in the optical phase change induced by the respective thickness of the EPL in the cover glass layer. The ETAM-applied optical power dissipation, which includes the optically incoherent characteristics of the cover glass layer, lies in the middle of the 10 coherent calculation results. If the cover glass was considered optically incoherent, all the spatial profiles of the optical power dissipations calculated at 10 different equispaced phase thicknesses will be the same as the ETAM-applied calculation result. By comparing the aggregate sums of the optical power dissipations distributed at the CIGS layer between the coherent and ETAM-applied models, we obtain a deviation within the range of −9.65% to +10.22%, which can be considered as the inaccuracy of the calculation when a thick cover glass was inappropriately modeled as the coherent layer.
The variations in the optical power dissipations depending on the equispaced phase thickness of the EPL were also calculated in Figure 4b when the wavelength of sunlight was 800 nm. The overall shapes of the calculation results in Figure 4b are comparable to those in Figure 4a. When the aggregate sums of the optical power dissipations positioned at the CIGS layer were compared between the coherent and ETAM-applied models, a deviation of −9.60% to +10.17% was obtained. It was noticeable that the calculated optical power dissipations in Figure 4b decrease more slowly from the ZnS/CIGS interface toward the CIGS layer than the calculated optical power dissipations in Figure 4a. This can be explained by the fact that the extinction coefficient of the CIGS layer, which can be seen in Figure 2b, decreases as the wavelength increases from 400 to 800 nm.
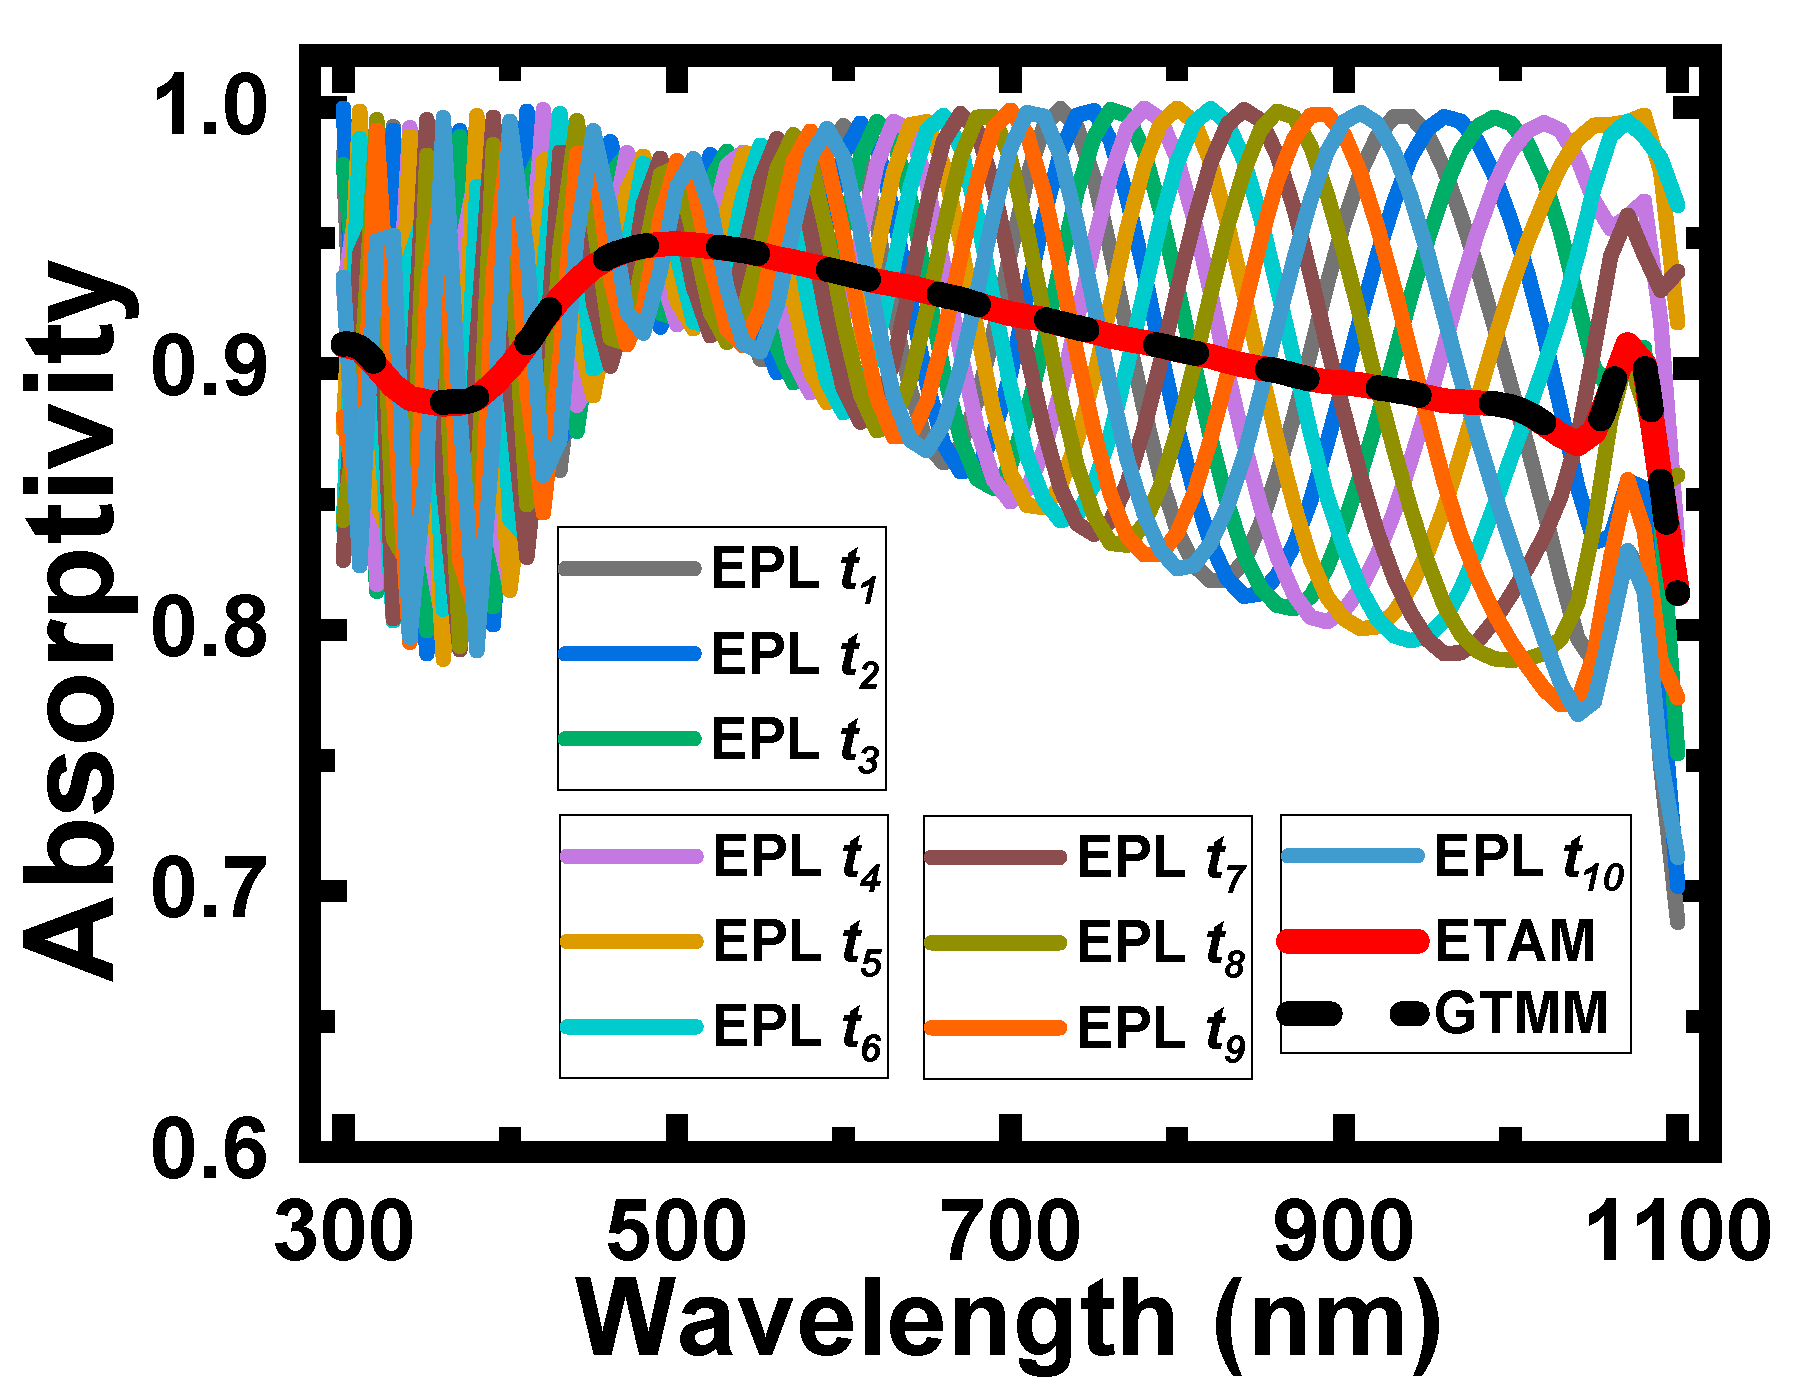
Figure 5 shows the calculation results of the absorptivity spectra depending on 10 different equispaced phase thicknesses of t1, t2, ⋅⋅⋅ and t10 along with the ETAM-applied absorptivity. According to Equations (4) and (6), the absorptivity corresponds to the accumulated sum of the optical power dissipation in the longitudinal z-direction at a given wavelength. As indicated in Figure 5, the absorptivity spectrum calculated at each equispaced phase thickness shows a respective ripple. This results from the fact that the wave vector of k 0 = 2 π / λ and the complex refractive index in Figure 2 depend on the wavelength of light, which causes a wavelength-dependent optical phase change and an optical interference effect. Owing to the additional optical phase change induced by the different thicknesses of the EPL tb in Figure 1, the spectral positions of the peaks and valleys were shifted in the absorptivity spectra calculated at different equispaced phase thicknesses of t1, t2, ⋅⋅⋅ and t10. However, these ripples in the absorptivity spectra disappear in the calculation results obtained by the ETAM, where the calculation results of 10 coherently calculated absorptivity spectra were averaged to include the optically incoherent characteristics of the cover glass layer. For comparison, the absorptivity was also calculated based on the GTMM, which was considered another analytical model to include the incoherent effect of the cover glass layer. The numerical results based on the ETAM were in agreement with the analytical results based on the GTMM, which verifies the validity of the calculation results obtained using the ETAM. In addition, the ETAM-applied absorptivity spectrum has the average value among the 10 coherently modeled absorptivity spectra. At a wavelength of 400 nm, as shown in Figure 5, the variation of the coherently modeled absorptivity in reference to the ETAM-applied absorptivity was observed to be within the range of −9.52% to +10.44%, which was close to the range of the deviation of the optical power dissipation shown in Figure 4a.
The final step of the optical modeling was to calculate the spatial profile of the generation rate of the electron–hole pair, which was one of the input parameters of the continuity equation in the electrical modeling. According to Equations (7) and (8), the generation rate of the electron–hole pair was obtained by integrating the optical power dissipation weighted by the spectral irradiance of AM 1.5 sunlight, as shown in Figure 6a. Figure 6b shows the calculated spatial profiles of the generation rate in the longitudinal z-direction G ( z , t b ) with respect to 10 different equispaced phase thicknesses of t1, t2, ⋅⋅⋅ and t10. To include the incoherent effect of the thick cover glass, the ETAM-applied generation rate in the longitudinal z-direction G E T A M ( z ) was also plotted in the red dotted line. The overall exponentially decaying shapes of the generation rates in Figure 6b were comparable to those of the optical power dissipations in Figure 4. In comparison with the aggregate sums of the generation rates between the coherent and ETAM-applied models, the deviation was calculated to be between −0.67% and +0.9%. This value was much smaller than the maximal absolute deviations calculated under the optical power dissipations shown in Figure 4a (10.22%) and the absorptivity in Figure 5 (10.44%), which results from the significant dependence of both the wavelength of sunlight and the thickness of the EPL. By contrast, the generation rate corresponds to the accumulated sum of the optical power dissipation within the wavelength region ranging between 300 and 1100 nm. Thus, the generation rate calculated at each equispaced phase thickness was less sensitive to the change in wavelength, which causes a reduction of the percentage variation of the electron–hole pair generation rate.
To obtain the J–V characteristics of a CIGS solar cell, the coupled drift–diffusion and continuity equations, shown in Equations (9)–(16), were numerically solved through the use of the semiconductor module of COMSOL multiphysics [20]. In the 2D simulation domain of the CIGS solar cell in Figure 1, we only consider the regions containing the ZnS and CIGS layers for the electrical modeling. Both the bottom cathode terminal of the Mo/CIGS interface and the top anode terminal of the AZO/ZnS interface were assumed to be ideal Schottky contacts. In accordance with the Floquet periodic boundary condition in the optical modeling, the periodic conditions were used at the leftmost and rightmost boundaries of the simulation domain in the electrical modeling. The FEM-based electrical modeling was performed under the same mesh configuration as the FEM-based optical modeling to minimize the error of a mismatch. The simulation parameters used in the electrical modeling are shown in Table 1 [24].
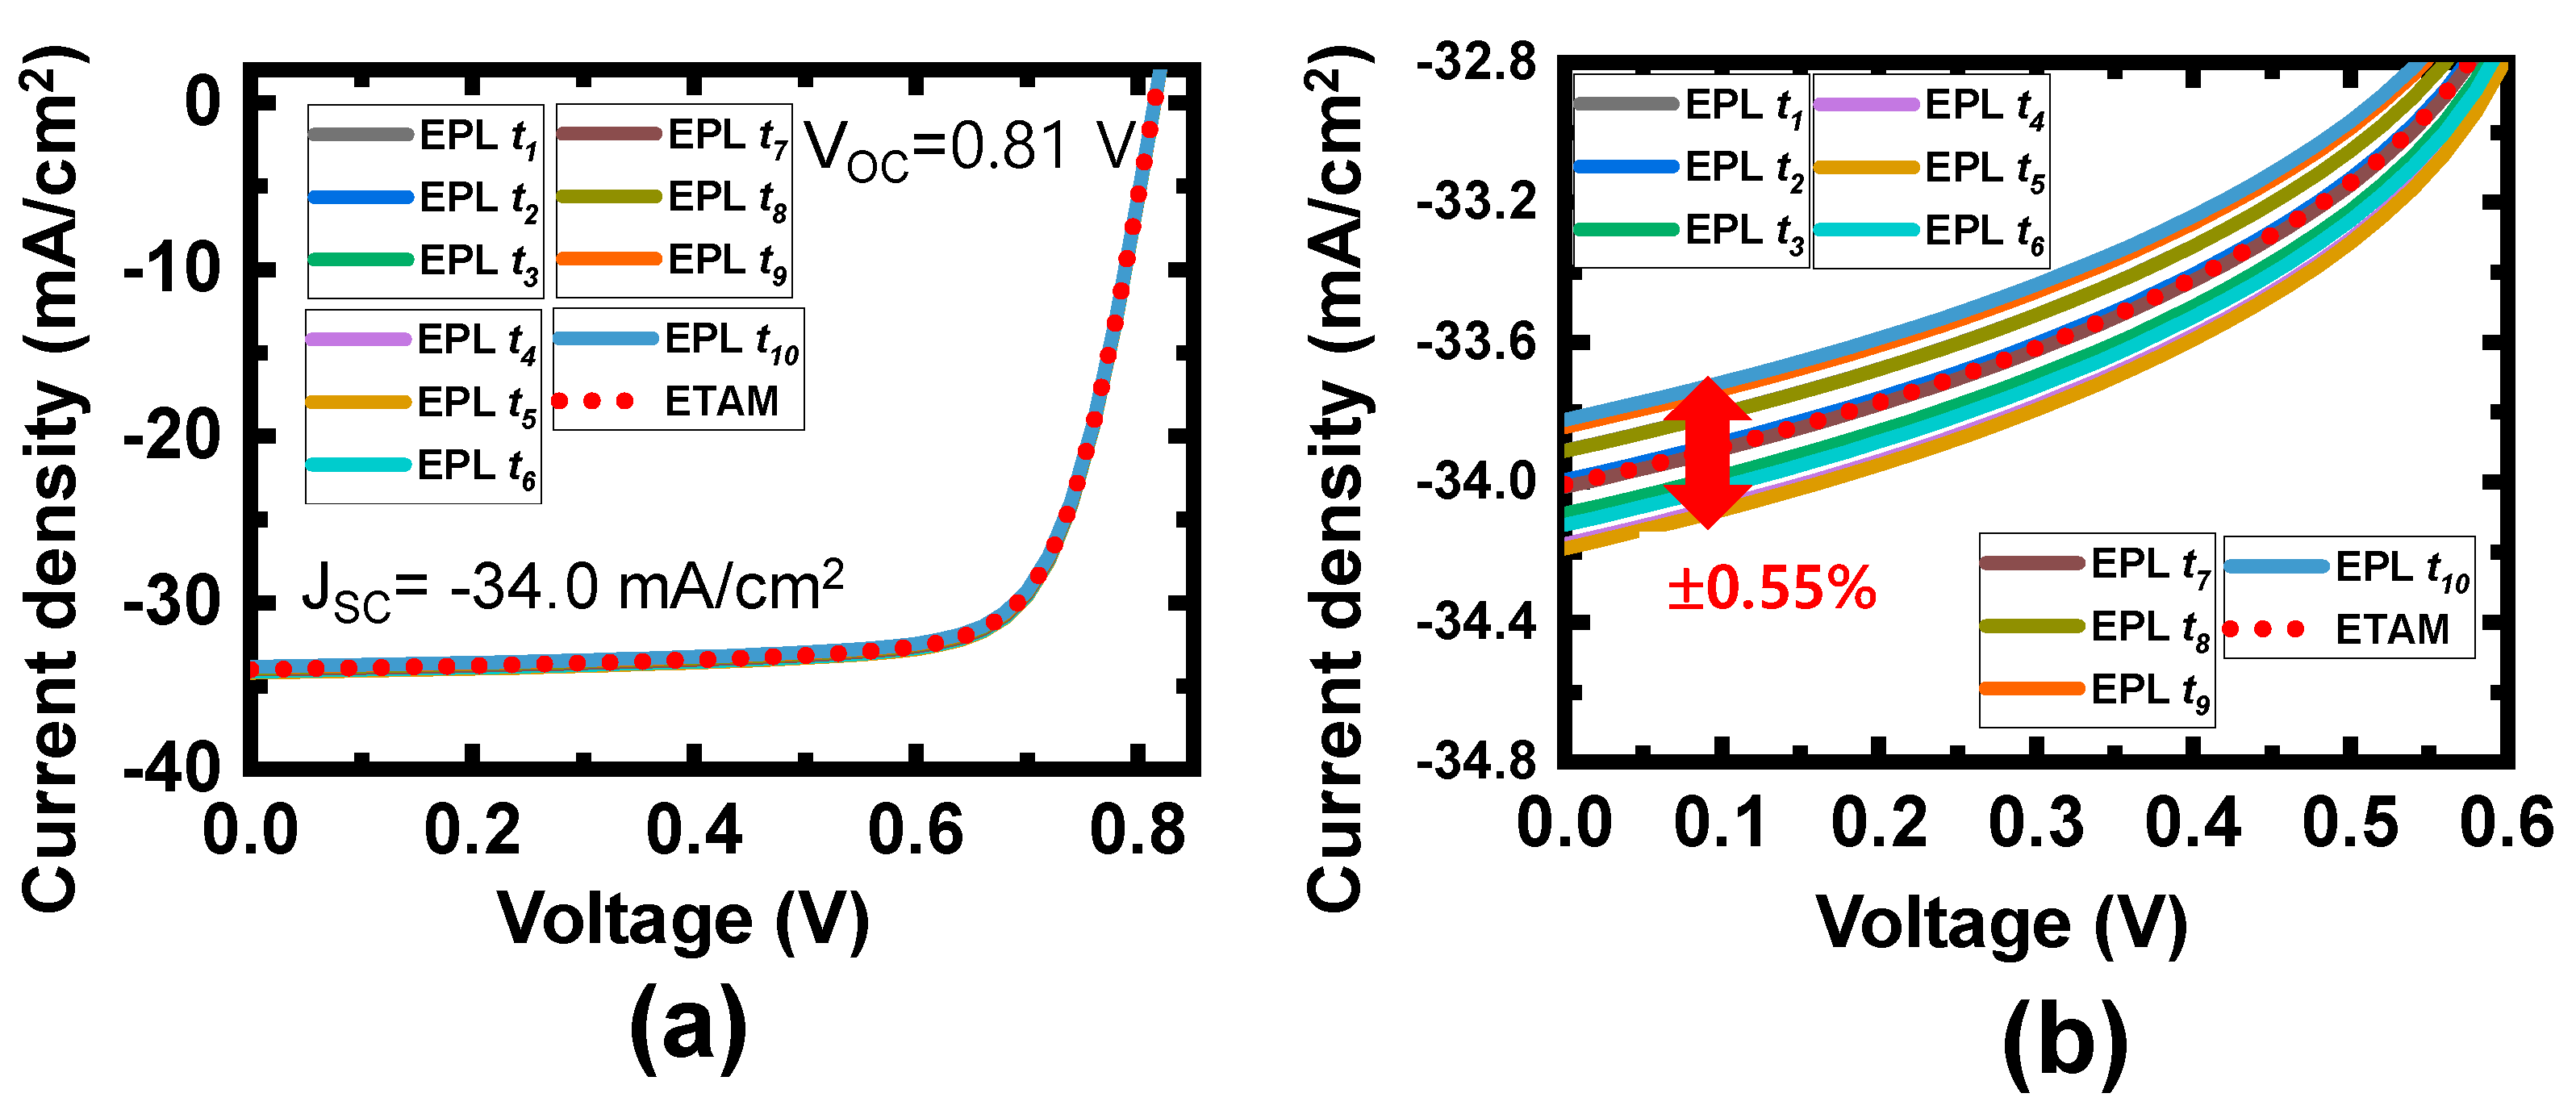
Figure 7a shows the calculated J–V characteristics of a CIGS solar cell depending on the equispaced phase thickness of the EPL. In addition, the ETAM-applied J–V curve, where the ETAM-applied generation rate was used in the electrical modeling, was also plotted along the red dotted line. None of the eleven calculation results of the J–V curves can be distinguished in Figure 7a due to their extremely small differences at this J–V scale. In the ETAM-applied J–V curve, the calculated values of JSC and VOC were −34.0 mA/cm2 and 0.81 V, respectively, which were close to other calculation results of JSC and VOC in a similar CIGS solar cell structure [25]. A close view of the J–V characteristics at near the zero applied voltage is shown in Figure 7b. The deviation of JSC calculated between the coherent and ETAM-applied models lies within the range of −0.54% to +0.54%, which was close to the −0.67% to +0.9% deviation obtained by the aggregate sums of the electron–hole pair generation rates between the coherent and ETAM-applied models. In addition, the maximal deviation of VOC was as small as ± 0.017%, which was ascribed to the fact that VOC has a logarithmic dependence on the carrier density [26].
It is notable that the ±0.54% maximal percent deviation of JSC can be understood to be the inaccuracy of the calculation when a thick cover glass layer was inappropriately modeled as a coherent layer. An arbitrarily determined thickness of the coherently modeled cover glass can provide a random optical phase change ranging between 0 and 2π. This will result in a different optical interference effect in the multilayer structure of a CIGS solar cell and affect all of the calculation results, such as the optical power dissipation in Figure 4, the generation rate in Figure 6b, and the J–V characteristics in Figure 7. Because 10 equispaced phase thicknesses of the EPL used in the ETAM correspond to equally spaced optical phase changes ranging between 0 and 2π, 10 coherent calculation results of the optical power dissipations, electron–hole pair generation rates and J–V characteristics with respect to the equispaced phase thicknesses of the EPL can be speculated to represent the range of variation of the calculation inaccuracy caused by the equispaced phase thicknesses of the coherently modeled cover glass. By contrast, the optical modeling of the ETAM-applied cover glass provides the exact solution to the optical power dissipation, generation rate and J–V characteristic, despite the thickness of the cover glass layer being arbitrarily determined. Therefore, the front cover glass must be modeled as optically incoherent to improve the calculation accuracy of the J–V and optical absorption characteristics in the optoelectronic modeling of a CIGS solar cell.

4. Discussion

To investigate which wavelength affects the variation of JSC in Figure 7 further, we calculate the EPL-thickness dependence of absorptivity in the CIGS absorber layer and external quantum efficiency (EQE), which are shown in Figure 8. The absorptivity in the CIGS absorber layer was obtained by integrating the optical power dissipation in the longitudinal z-direction over the CIGS absorber layer and was written as
A C I G S ( λ , t b ) = 1 S ( λ ) C I G S Q ( r , λ , t b ) d r .
The EQE was defined as the ratio of the number of charge carriers collected by the solar cell to the number of incident photons shining on the solar cell outside. In this calculation, the EQE spectra was expressed as
E Q E ( λ , t b ) = J S C ( λ , t b ) / q S ( λ ) / ( h c / λ ) ,
where J S C ( λ , t b ) indicates the EPL-thickness-dependent spectral short-circuit current density, which was obtained by the numerical solution of the coupled drift–diffusion and continuity equations when the incident optical power was set to the spectral irradiance of AM 1.5 sunlight S ( λ ) . In Figure 8, the ETAM-applied calculation results were obtained by averaging 10 coherent calculation results over the equispaced phase thicknesses. According to the calculated EQE spectra in Figure 8b, the variation of the EQE with respect to the EPL thickness was noticeable around the wavelength range between 600 and 1000 nm.
Figure 9a shows the ETAM-applied calculation results of absorptivity in the entire multilayer structure, the absorptivity in the CIGS absorber layer and the EQE, where a significant reduction of the EQE was observed within the relatively short (300–450 nm) and long (1000–1100 nm) wavelength ranges. First, the reduction of the EQE between 300 and 450 nm was ascribed to the optical absorption in the AZO-based TCO layer, which has a high extinction coefficient within the short wavelength range, as shown in Figure 2b. Hence, the difference in the absorptivity between the entire multilayer structure and the CIGS absorber layer becomes very high within the wavelength range of 300–450 nm. This fact was also confirmed by the ETAM-applied spatial profiles of the optical power dissipations shown in Figure 9b, where the optical power dissipation at the AZO layer was observed at wavelengths of 300, 350 and 400 nm. Second, the difference between the absorptivity and EQE in Figure 9a increases as the wavelength increases from 500 to 1100 nm. As shown in Figure 9b, this can be explained by the fact that the optical absorption, taking place farther away from the interface between the p-doped CIGS and n-doped ZnS layers at a longer wavelength, contributes less to the electric current at a longer wavelength due to the low diffusion length of the minority electron carriers [26].
In the actual module configuration of the CIGS solar cell, the front encapsulation layer, made of ethylene vinyl acetate (EVA), lies between the front cover glass and the TCO top contact layer [4]. Figure 10 shows a modified schematic diagram of the CIGS solar cell, where a 0.5-mm EVA encapsulation layer was added into the multilayer structure of the CIGS solar cell shown in Figure 1 [17,19]. Because the thickness of the EVA layer (0.5 mm) was much larger than the coherence length of sunlight (~0.6 μm), the EVA layer should also be considered optically incoherent. The EVA layer was assumed to be transparent with a constant refractive index of 1.49 between 300 and 1100 nm [19]. According to the optical modeling based on the ETAM, the incoherent cover glass and EVA layers can be modeled as an initial 1-μm layer plus the EPL layer, respectively. The optically incoherent characteristics of the cover glass/EVA layer can then be considered by averaging the coherent simulation results over all combinations of the equispaced phase thicknesses in two incoherent layers [19]. For instance, the ETAM-applied optical power dissipation, which includes the effect of the incoherent cover glass/EVA layer, can be obtained by
Q E T A M ( r , λ ) = 1 M × N b = 1 N a = 1 M Q ( r , λ , t a , t b ) ,
where M and N indicate the number of equispaced phase thicknesses in the EVA and cover glass layers, respectively. If the number of equispaced phase thicknesses was set to 10 for both incoherent layers, the ETAM-applied optical power dissipation can be calculated by averaging the coherent calculation results Q ( r , λ , t a , t b ) over 100 combinations of the equispaced phase thicknesses in two incoherent layers.
Figure 11 shows the calculation results of the ETAM-applied absorptivity spectra and J–V characteristics of a CIGS solar cell having only a cover glass (Figure 1) or a cover glass/EVA as an incoherent layer (Figure 10). In Figure 11a, the absorptivity spectra calculated by the GTMM show a good agreement with those obtained by the ETAM, which verifies the validity of the calculation results obtained using the ETAM. There was a slight difference between the two calculation results of absorptivity because the difference in the refractive index between the cover glass (1.55) and EVA (1.49) was very small. Hence, the calculated values of JSC between the cover glass/AZO/ZnS/CIGS/Mo (−34 mA/cm2) and cover glass/EVA/AZO/ZnS/CIGS/Mo (−33.91 mA/cm2) structures were very close and deviate by 0.26%. This indicates that the addition of the incoherent EVA encapsulation layer into the multilayer structure of the CIGS solar cell in Figure 1 will provide little change in either the optical or electrical calculation results shown in Figure 3, Figure 4, Figure 5, Figure 6 and Figure 7, where only a cover glass was considered as the incoherent layer.

5. Conclusions

We numerically investigated the effect of the incoherent front cover glass on the J–V characteristics of a CIGS solar cell using an FEM-based integrated optoelectronic model. The incoherent property of the 3-mm cover glass was optically modeled as a 1-μm initial layer plus the EPL, the thickness of which was determined based on the ETAM. Various absorption characteristics such as the optical power dissipation, absorptivity and electron–hole pair generation rate were calculated at 10 equispaced phase thicknesses when the cover glass was modeled as the coherent layer. The ETAM-applied calculation results were also obtained by averaging the coherent simulation results over 10 equispaced phase thicknesses. By comparing the J–V characteristics calculated between coherently modeled and ETAM-applied cover glasses, we obtained a maximum ±0.54% deviation of JSC, which can be considered a calculation inaccuracy when a thick cover glass layer was inappropriately modeled as the coherent layer. Therefore, it is important to treat the front cover glass as optically incoherent to improve the calculation accuracy of both the optical absorption and J–V characteristics in the optoelectronic modeling of the CIGS solar cell.

Author Contributions

Conceptualization, J.K.; methodology, J.B., J.P., G.L. and J.K.; software, J.B., J.P., G.L. and S.K.; validation, J.B., J.P., G.L., S.K. and J.K.; formal analysis, J.B., J.P. and J.K.; investigation, J.B., J.P., G.L., S.K. and J.K.; writing—original draft preparation, J.K.; writing—review and editing, J.B, J.P., G.L., S.K. and J.K.; visualization, J.B. and J.K.; supervision, S.K. and J.K.; project administration, S.K. and J.K.; funding acquisition, S.K. and J.K. All authors have read and agreed to the published version of the manuscript.

Funding

This research was supported by the Korea Electric Power Corporation (Grant Number: R17XA05–14) and by the Basic Science Research Program through the National Research Foundation of Korea (NRF) funded by the Ministry of Education (Grant Number: NRF-2018R1D1A1B07047249).

Conflicts of Interest

The authors declare no conflict of interest.

References

  1. Repins, I.; Contreras, M.A.; Egaas, B.; DeHart, C.; Scharf, J.; Perkins, C.L.; To, B.; Noufi, R. 19.9%-efficient ZnO/CdS/CuInGaSe2 solar cell with 81.2% fill factor. Prog. Photovolt. Res. Appl. 2008, 16, 235–239. [Google Scholar] [CrossRef] [Green Version]
  2. Chirilǎ, A.; Reinhard, P.; Pianezzi, F.; Bloesch, P.; Uhl, A.R.; Fella, C.; Kranz, L.; Keller, D.; Gretener, C.; Hagendorfer, H.; et al. Potassium-induced surface modification of Cu(In,Ga)Se2 thin films for high-efficiency solar cells. Nat. Mater. 2013, 12, 1107–1111. [Google Scholar] [CrossRef]
  3. Jackson, P.; Wuerz, R.; Hariskos, D.; Lotter, E.; Witte, W.; Powalla, M. Effects of heavy alkali elements in Cu(In,Ga)Se2 solar cells with efficiencies up to 22.6%. Phys. Status Solidi Rapid Res. Lett. 2016, 10, 583–586. [Google Scholar] [CrossRef] [Green Version]
  4. Giovannetti, F.; Kirchner, M.; Albert, M. Design options for uncovered photovoltaic-thermal glass-glass panels. In Proceedings of the Euro Sun 2016 Conference, Palma de Mallorca, Spain, 11–14 October 2016. [Google Scholar]
  5. Donges, A. The coherence length of black-body radiation. Eur. J. Phys. 1998, 19, 245–249. [Google Scholar] [CrossRef]
  6. Pettersson, L.A.A.; Roman, L.S.; Inganäs, O. Modeling photocurrent action spectra of photovoltaic devices based on organic thin films. J. Appl. Phys. 1999, 86, 487–496. [Google Scholar] [CrossRef]
  7. Mitsas, C.L.; Siapkas, D.I. Generalized matrix method for analysis of coherent and incoherent reflectance and transmittance of multilayer structures with rough surfaces, interfaces, and finite substrates. Appl. Opt. 1995, 34, 1678–1683. [Google Scholar] [CrossRef] [PubMed]
  8. Katsidis, C.C.; Siapkas, D.I. General transfer-matrix method for optical multilayer systems with coherent, partially coherent, and incoherent interference. Appl. Opt. 2002, 41, 3978–3987. [Google Scholar] [CrossRef] [PubMed]
  9. Krc, J.; Cernivec, G.; Campa, A.; Malmström, J.; Edoff, M.; Smole, F.; Topic, M. Optical and electrical modeling of Cu(In,Ga)Se2 solar cells. Opt. Quantum Electron. 2006, 38, 1115–1123. [Google Scholar] [CrossRef]
  10. Bednar, N.; Severino, N.; Adamovic, N. Optical simulation of light management in CIGS thin-film solar cells using finite element method. Appl. Sci. 2015, 5, 1735–1744. [Google Scholar] [CrossRef]
  11. Chang, Y.-J. Suppressing lossy-film-induced angular mismatches between reflectance and transmittance extrema: Optimum optical designs of interlayers and AR coating for maximum transmittance into active layers of CIGS solar cells. Opt. Express 2014, 22, A167–A178. [Google Scholar] [CrossRef]
  12. Poncelet, O.; Kotipalli, R.; Vermang, B.; Macleod, A.; Francis, L.A.; Flandre, D. Optimisation of rear reflectance in ultra-thin CIGS solar cells towards >20% efficiency. Sol. Energy 2017, 146, 443–452. [Google Scholar] [CrossRef] [Green Version]
  13. Huang, C.Y.; Parashar, P.; Chou, H.M.; Lin, Y.S.; Lin, A. A path-finding toward high-efficiency penternary Cu(In,Ga)(Se,S)2 thin film solar module. Optik 2019, 179, 837–847. [Google Scholar] [CrossRef]
  14. Jung, S.; Kim, K.Y.; Lee, Y.I.; Youn, J.H.; Moon, H.T.; Jang, J.; Kim, J. Optical modeling and analysis of organic solar cells with coherent multilayers and incoherent glass substrate using generalized transfer matrix method. Jpn. J. Appl. Phys. 2011, 50, 122301. [Google Scholar]
  15. Lee, S.; Jeong, I.; Kim, H.P.; Hwang, S.Y.; Kim, T.J.; Kim, Y.D.; Jang, J.; Kim, J. Effect of incidence angle and polarization on the optimized layer structure of organic solar cells. Sol. Energy Mater. Sol. Cells 2013, 118, 9–17. [Google Scholar] [CrossRef]
  16. Lee, W.; Lee, S.-Y.; Kim, J.; Kim, S.C.; Lee, B. A numerical analysis of the effect of partially-coherent light in photovoltaic devices considering coherence length. Opt. Express 2012, 20, A941–A953. [Google Scholar] [CrossRef]
  17. Kim, S.C. Simulation of rough surface of CIGS (CuInGaSe) solar cell by RCWA (rigorous coupled wave analysis) considering the incoherency of light. J. Opt. Soc. Korea 2014, 18, 180–183. [Google Scholar] [CrossRef] [Green Version]
  18. Kang, K.; Lee, S.; Kim, J.; Kim, S.; Han, Y.; Baek, S. A simple numerical modeling of the effect of the incoherent thick substrate in thin-film solar cells based on the equispaced thickness method. IEEE Photonics J. 2016, 8, 8400312. [Google Scholar] [CrossRef]
  19. Kang, K.; Kim, S.; Kim, J. Numerical modeling of the effect of multiple incoherent layers in Cu(In,Ga)Se2 solar cells based on the equispaced thickness averaging method. Appl. Opt. 2018, 57, 2758–2765. [Google Scholar] [CrossRef]
  20. Comsol Inc. Burlington, MA, USA. COMSOL Multiphysics, Version 4.4a. 2013. Available online: http://www.comsol.com (accessed on 22 February 2020).
  21. Paulson, P.D.; Birkmire, R.W.; Shafarman, W.N. Optical characterization of CuIn1-xGaxSe2 alloy thin films by spectroscopic ellipsometry. J. Appl. Phys. 2003, 94, 879–888. [Google Scholar] [CrossRef]
  22. Seiler, D.G.; Zollner, S.; Diebold, A.C.; Amirtharaj, P.M. Optical Properties of Semiconductors. In Handbook of Optics, 3rd ed.; Bass, M., Li, G., Stryland, E.V., Eds.; McGraw-Hill: New York, NY, USA, 2009; Volume 4, pp. 5.1–5.91. [Google Scholar]
  23. Richter, M.; Schubbert, C.; Eraerds, P.; Riedel, I.; Keller, J.; Parisi, J.; Dalibor, T.; Avellán-Hampe, A. Optical characterization and modeling of Cu(In,Ga)(Se,S)2 solar cells with spectroscopic ellipsometry and coherent numerical simulation. Thin Solid Films 2013, 535, 331–335. [Google Scholar] [CrossRef]
  24. Hosen, M.B.; Bahar, A.N.; Ali, M.K.; Asaduzzaman, M. Modeling and performance analysis dataset of a CIGS solar cell with ZnS buffer layer. Data Br. 2017, 14, 246–250. [Google Scholar] [CrossRef] [PubMed]
  25. Dabbabi, S.; Nasr, T.B.; Kamoun-Turki, N. Parameters optimization of CIGS solar cell using 2D physical modeling. Results Phys. 2017, 7, 4020–4024. [Google Scholar] [CrossRef]
  26. Streetman, B.G.; Banerjee, S.K. Solid State Electronic Devices, 6th ed.; Prentice Hall: Upper Saddle River, NJ, USA, 2006; pp. 380–384. [Google Scholar]
Figure 1. Schematic diagram of multilayer structure of the Cu(In,Ga)Se2 (CIGS) solar cell used in this study. The 3-mm cover glass, the thickness of which is larger than the coherence length of sunlight (~0.6 μm), is considered as incoherent, and the remaining layers are modeled as coherent. Because the 3-mm cover glass has no absorption, the incoherent cover glass can be modeled as a 1-µm initial cover glass layer plus an equispaced phase layers (EPLs) whose thickness tb is determined based on Equation (17) when the equispaced thickness averaging method (ETAM) is applied to calculate the effect of the incoherent front glass layer in the simulation.
Applsci 10 03312 g001
Figure 2. Complex refractive index spectra of the materials used in the CIGS solar cell, of which the real and imaginary parts are (a) the refractive index (b) extinction coefficient, respectively.
Applsci 10 03312 g002
Figure 3. Calculated 2D spatial profiles of (a) the electric field amplitude, (b) time-averaged Poynting vector and (c) optical power dissipation at a wavelength of λ = 400 nm. The equispaced phase thickness of the EPL was set to t1 = 0 nm.
Applsci 10 03312 g003
Figure 4. Calculated spatial profiles of the optical power dissipations in the longitudinal z-direction Q ( z , λ , t b ) with respect to 10 different equispaced phase thicknesses of t1, t2, ⋅⋅⋅ and t10. The calculation results were obtained at wavelengths of (a) 400 and (b) 800 nm. To consider the effect of the incoherent cover glass, the ETAM-applied optical power dissipation Q E T A M ( z , λ ) , obtained by averaging the 10 coherent calculation results, was designated by the red dotted line.
Applsci 10 03312 g004
Figure 5. Calculation results of the absorptivity spectra A ( λ , t b ) depending on 10 different equispaced phase thicknesses of t1, t2, ⋅⋅⋅ and t10. The ETAM-applied absorptivity spectrum A E T A M ( λ ) was obtained by averaging 10 coherent calculation results over the equispaced phase thickness. The absorptivity spectrum calculated by another analytical model of the generalized transfer matrix method (GTMM) shows a good agreement with that obtained based on the ETAM, which verifies the validity of the calculation results obtained using the ETAM.
Applsci 10 03312 g005
Figure 6. (a) Spectral irradiance of air mass (AM) 1.5 sunlight ranging between 300 and 1100 nm used in this calculation. (b) Calculated spatial profiles of the generation rate in the longitudinal z-direction G ( z , t b ) with respect to 10 different equispaced phase thicknesses of t1, t2, ⋅⋅⋅ and t10. The ETAM-applied generation rate in the longitudinal z-direction G E T A M ( z ) was plotted along the red dotted line. The generation rate was obtained by integrating the optical power dissipation weighted by the spectral irradiance of AM 1.5 sunlight.
Applsci 10 03312 g006
Figure 7. (a) Calculated J–V characteristics of a CIGS solar cell depending on the equispaced phase thickness of the EPL along with the ETAM-applied calculation result. None of the calculation results of the J–V characteristics can be distinguished due to the extremely small difference among the eleven calculation results in the J–V scale. (b) Close view of the J–V characteristics near the zero applied voltage. The maximal percent deviation of JSC calculated between the coherent and ETAM-applied models was ± 0.54%, the value of which can be understood to be the calculation inaccuracy when the thick cover glass layer was inappropriately modeled as the coherent layer.
Applsci 10 03312 g007
Figure 8. EPL-thickness dependence of (a) absorptivity in the CIGS absorber layer A C I G S ( λ , t b ) and (b) external quantum efficiency (EQE). ETAM-applied calculation results were obtained by averaging 10 coherent calculation results over the equispaced phase thicknesses.
Applsci 10 03312 g008
Figure 9. (a) ETAM-applied calculation results of absorptivity in the entire multilayer A, absorptivity in the CIGS absorber layer ACIGS and EQE. (b) ETAM-applied spatial profiles of the optical power dissipations in the longitudinal z-direction at several wavelengths.
Applsci 10 03312 g009
Figure 10. Modified schematic diagram of CIGS solar cell, where a 0.5-mm EVA encapsulation layer was added into the multilayer structure of the CIGS solar cell in Figure 1. Because the thickness of the EVA layer (0.5 mm) was larger than the coherence length of sunlight (~0.6 μm), the EVA layer should also be considered optically incoherent. Because both a cover glass and EVA have no absorption, two incoherent layers can be modeled as a 1-μm initial layer plus the EPL, whose respective thicknesses of ta and tb can be determined based on Equation (17) to include the effect of the incoherent cover glass/EVA layers on the optical characteristics based on the ETAM.
Applsci 10 03312 g010
Figure 11. Calculation results of the ETAM-applied (a) absorptivity spectra and (b) J–V characteristics at the CIGS solar cell having an incoherent layer of only a cover glass (Figure 1) or cover glass/EVA (Figure 10). The absorptivity spectra calculated using the GTMM show a good agreement with the results obtained using the ETAM. The inset shows a close view of the J–V characteristics at near a zero applied voltage.
Applsci 10 03312 g011
Table 1. Simulation parameters used in the electrical modeling [24].
Parametersn-ZnSp-CIGS
Dielectric constant, εr8.2813.60
Band gap, Eg (eV)3.681.21
Electron affinity, χe (eV)4.134.21
Valence band effective density of states, Nv (cm−3)2.4 × 10191.6 × 1019
Conduction band effective density of states, Nc (cm−3)1.7 × 10182 × 1018
Electron mobility, μn (cm2 V−1 s−1)250100
Hole mobility, μp (cm2 V−1 s−1)7025
Electron lifetime, τn (s)2 × 10−81 × 10−18
Hole lifetime, τp (s)6 × 10−85 × 10−8
Donor concentration, Nd (cm−3)5 × 10¹⁶-
Acceptor concentration, Na (cm−3)-3 × 10¹⁶
Radiative recombination rate, RB (cm−3 s−1)10−1010−10

