Article

Effect of Exercise on Athletes Performing in Fencing Uniforms: Methodology and Preliminary Results of the Use of Infrared Thermography to Detect the Thermal Behaviour of Fencers

DESTEC, Dept. of Energy, Systems, Territory and Constructions Engineering, School of Engineering, University of Pisa, Largo Lucio Lazzarino, 56122 Pisa, Italy
*
Author to whom correspondence should be addressed.
Appl. Sci. 2020, 10(9), 3296; https://doi.org/10.3390/app10093296
Submission received: 9 April 2020 / Revised: 4 May 2020 / Accepted: 7 May 2020 / Published: 9 May 2020

Abstract

:

Featured Application

This investigation has a potential application in the field of sport science, in order to improve the performance of fencing athletes.

Abstract

In recent times, infrared thermography has been often applied to sport science, in order to evaluate athletes’ performance in relation to their thermal behaviour. As there is a lack of studies for the sport of fencing, this paper aims to provide preliminary results showing the thermal behaviour of fencers of different competitive level and to provide a methodology for its assessment. In particular, thermal images were acquired before, during and after the training, as well as the metabolic rate and the rate of perceived exertion, for eight fencers with different competitive levels (international/national/veteran). Results showed that in moderate environments there was any correlation between the environmental parameters and temperature trend on athletes’ bodies, while competitive level and thermal behaviour were connected. The presence of thermal asymmetries was also detected. In general, from these preliminary results, professional athletes presented the same temperature trend. Therefore, further studies should be carried out in order to investigate these findings on a larger sample of elite athletes, as their thermal response may be important for improving their performance.

1. Introduction

In recent times, infrared thermography (IRT) has been frequently applied to the human body, in order to detect skin temperature, as it is a non-invasive method that is not influenced by the presence of probes, which may modify the values of temperature through conduction or radiation [1]. IRT allows a complete temperature map of all the components of the subject considered and its variations [2]. The first thermal images applied to biomedical sciences are reported in the period between 1959 and 1961 [3], although the applicability of the method to the human body was proved by the work of the American physiologist, J. Hardy [4]. Several reviews regarding the use of infrared imaging in medicine [5,6,7] show the importance of this technique.
IRT has been also applied to sport science. The first research on this topic dates back to 1975 and it consisted of a study on injuries occurring in athletes due to sportive activity [8]. Later, the importance of detecting the skin temperature trend was evaluated by Clark and Mullan [9]. Currently, the number of publications regarding the use of IRT in sport science has rapidly increased, also as a result of the cost reduction of infrared cameras. This technique has been applied to outdoor and indoor sports, such as soccer [10,11], cycling [12,13], running [14,15], swimming [12,16] or combat sports [17].
There are several fields of application of IRT to sport science [18]. The most common is thermophysiology, which studies the effects of exercise on skin temperature between diverse groups of athletes (e.g., professional/amatorial, old/young, male/females, etc.) [19]. Other studies were focused on the prevention of injuries during exercise [20], on the relationship between animals’ thermal profile and their performance [21] or on the evaluation of sportive clothing during exercise [22,23]. Finally, methodologies for the use of IRT applied to different sports, in terms of the definition of the regions of interest (ROIs), assessment protocol and data analysis [24] were studied.
The application of IRT to sport performance is particularly relevant, as it allows the understanding of the thermal response during exercise, considering that the individual response can be affected by several factors, such as the environmental conditions, the presence of clothing, etc. [25]. Several thermophysiological studies show that the knowledge of skin temperature for athletes during intense activity is fundamental to understand the sustainability of muscular work, as well to deduce a possible association between the thermoregulatory response and the athletic performance [26]. In fact, the time evolution of skin temperature can provide important information on the performance and the level of training efficiency [27,28]. To investigate this relation, it is important to consider the environmental conditions in which the test is carried out, as large variations in the environmental parameters may influence the interpretation of the results [15]. Some studies were then focused on the determination of the thermal profile of different types of sport (e.g., soccer [29] and judo [30]), in order to correlate the thermal behaviour with the sport performance. In fact, especially for elite athletes, it is important to be aware of the comparison between the thermal behaviour of the single athlete and the common thermal profile of the sport performance. Other aspects that should be evaluated are the presence of thermal asymmetries and the thermal values of the single ROIs, especially the ones that present a greater physical load.
Even if an increasing number of studies can be detected in this direction, studies regarding the sport of fencing are very rare and usually limited to medical aspects [31] or to qualitative analysis. This is probably due to the difficulties in detecting body temperature in fencing, as athletes must perform this sport wearing uniforms according to the regulations by Fédération Internationale d’Escrime (FIE). Some companies developing fencing equipment provided qualitative analysis regarding the application of IRT for the comparison between different types of fencing uniforms and masks [32]. However, the results do not provide a solid scientific base, as the correlation between the measured temperature map of the exercising body and the performance of the fencers was not evaluated. The aim of this paper is to provide a preliminary analysis of the evaluation of the thermal profile of fencers, considering the environmental conditions and the competitive level of fencers, considering that during fencing athletes cannot remove their protective clothing, and since information loss would occur due to the time needed for their removal. As the methodology of data acquisition and analysis can have a large influence on the results, a protocol for the assessment of the physiological response of fencers during training, that is currently lacking, was developed.

2. Materials and Methods

In order to reduce the error of measurement of the infrared camera and to increase the reproducibility of this kind of evaluation, several organizations proposed guidelines and recommendations for the application of IRT to human bodies. However, due to the difficulties and to the variability that different activities may present, several authors designed different methodologies that should be adopted when considering a specific activity. With regard to fencing, a methodology has not yet been developed; therefore, the aim of this paragraph was to report a standardized protocol that could be applied in this sport, based on previous studies and researches.

2.1. Selection of Participants

This investigation was conducted in the fencing hall Club Scherma Pisa Antonio Di Ciolo, a pillar of national and international fencing. This panorama gave the authors the possibility to work with a wide variety of athletes, of different ages and training level. Of the whole number of athletes, eight fencers (with different competitive level, i.e., international, national and veteran) were chosen in order to guarantee a various selection of athletes, according to the following factors:
-
Sex;
-
Age;
-
Body surface;
-
Injuries;
-
Level of competition (physical fitness level);
-
Weapon performed.
These criteria are fundamental, as factors such as sex and age may influence core and skin temperatures, due to the variation of metabolic rate. Body surface plays a key role in the capability of heat dissipation, as subjects with a greater body surface are able to lose a higher amount of heat [33]. Athletes participating in this investigation were not presenting any injury in the previous months, as traumas may affect the local blood flow, determining alteration of the temperature recorded in the regions involved by the injuries. Physical fitness level is another factor that largely influences the heat exchange between the body and the environment and therefore the temperature recorded on the body. In general, trained people present a higher capability to transfer heat from the core to the skin due to the high blood flow and the low body fat [24]. Participants were all well-trained athletes, who were training regularly from 4 to 10 sessions per week. Part of them were professional athletes, participating in international competitions. They were used to training two times per day, with a total of 10 sessions per week, 2 hours in the morning (fitness training) and 2.30 h in the evening (fencing). Some took part in the Italian Championships, while others used to participate in National Veteran Tournaments, and they were training 4–5 times per week. The weapon performed was another factor considered, as it may involve modifications in the energy expenditure and in the physiological response. In the case study, athletes were foil or epee fencers. For the investigation, the athletes of three different groups were selected: international, national and veteran, according to the level of competition that they performed (defined by the Italian Fencing Federation, FIS).
Characteristics of the participants (sex, age, height, weight, body surface area (BSA) and body mass index (BMI)), weapon performed, and level of competition are summarized in Table 1.
There is to notice that fencers perform using protective uniforms, according to FIE’s regulations [34], and the characteristics of which must be considered. In fact, the presence of the uniforms may affect the heat exchange between the body and the environment, as they constitute an additional layer. In particular, the foil uniforms presented an overall thermal resistance RCT≈0.15 m2K/W and a vapour resistance RET≈35 m2Pa/W, while the epee uniform had RCT ≈ 0.13 m2K/W and RET ≈ 33 m2Pa/W [32]. The infrared emissivity of skin was set at 0.98 [7], of the fencing clothing at 0.90, and of the electric jacket at 0.59.

2.2. Evaluation of the Measurements’ Location

Considering the place in which the measurements are carried out, the main features to examine are the space, temperature and relative humidity of the room and the presence of infrared radiation sources. In particular, the room should not be smaller than 6–9 m2, air temperature should range between 18 and 25 °C, relative humidity is recommended in a range of 40%–70%, and the presence of infrared radiation sources should be prevented [24].
The test was performed in the fencing hall Club Scherma Pisa Antonio Di Ciolo, located in Pisa, Italy. The fencing hall is characterised by a rectangular area of about 390 m2, with a ridge height of 5.9 m and a volume of about 2000 m3. It is a tensile structure with laminated wood beams and steel columns, covered with a white double membrane of PVC polyester fabric.
Since body temperature is considerably influenced by environmental factors, during the test probes measuring air temperature and relative humidity were located inside and outside the fencing hall. In particular, the test was performed on Wednesdays and Thursdays (the days of the maximum occupancy of the fencing hall) of four different weeks during spring 2019, from 18:00 to 21:00, when the athletes were training. During the measurement period, the average ranges of air temperature and relative humidity stayed within the recommended ranges (tA,AV = 18.6 °C, RHAV = 67.8%).

2.3. Selection of the Measuring Equipment

For the detection of the thermal images, the choice of the thermal camera has a fundamental role. In particular, the minimum number of pixels to determine the temperature of a ROI is considered to be 25, according to the international standard [24]. In this research, the thermal images were taken using a digital infrared camera model PCE-TC 30 [35], with technical specifications summarized in Table 2. Since environmental parameters play a key role in determining the temperature evaluated with the thermal camera, values of air temperature and relative humidity were recorded with probes model PCE-HT110 [36].

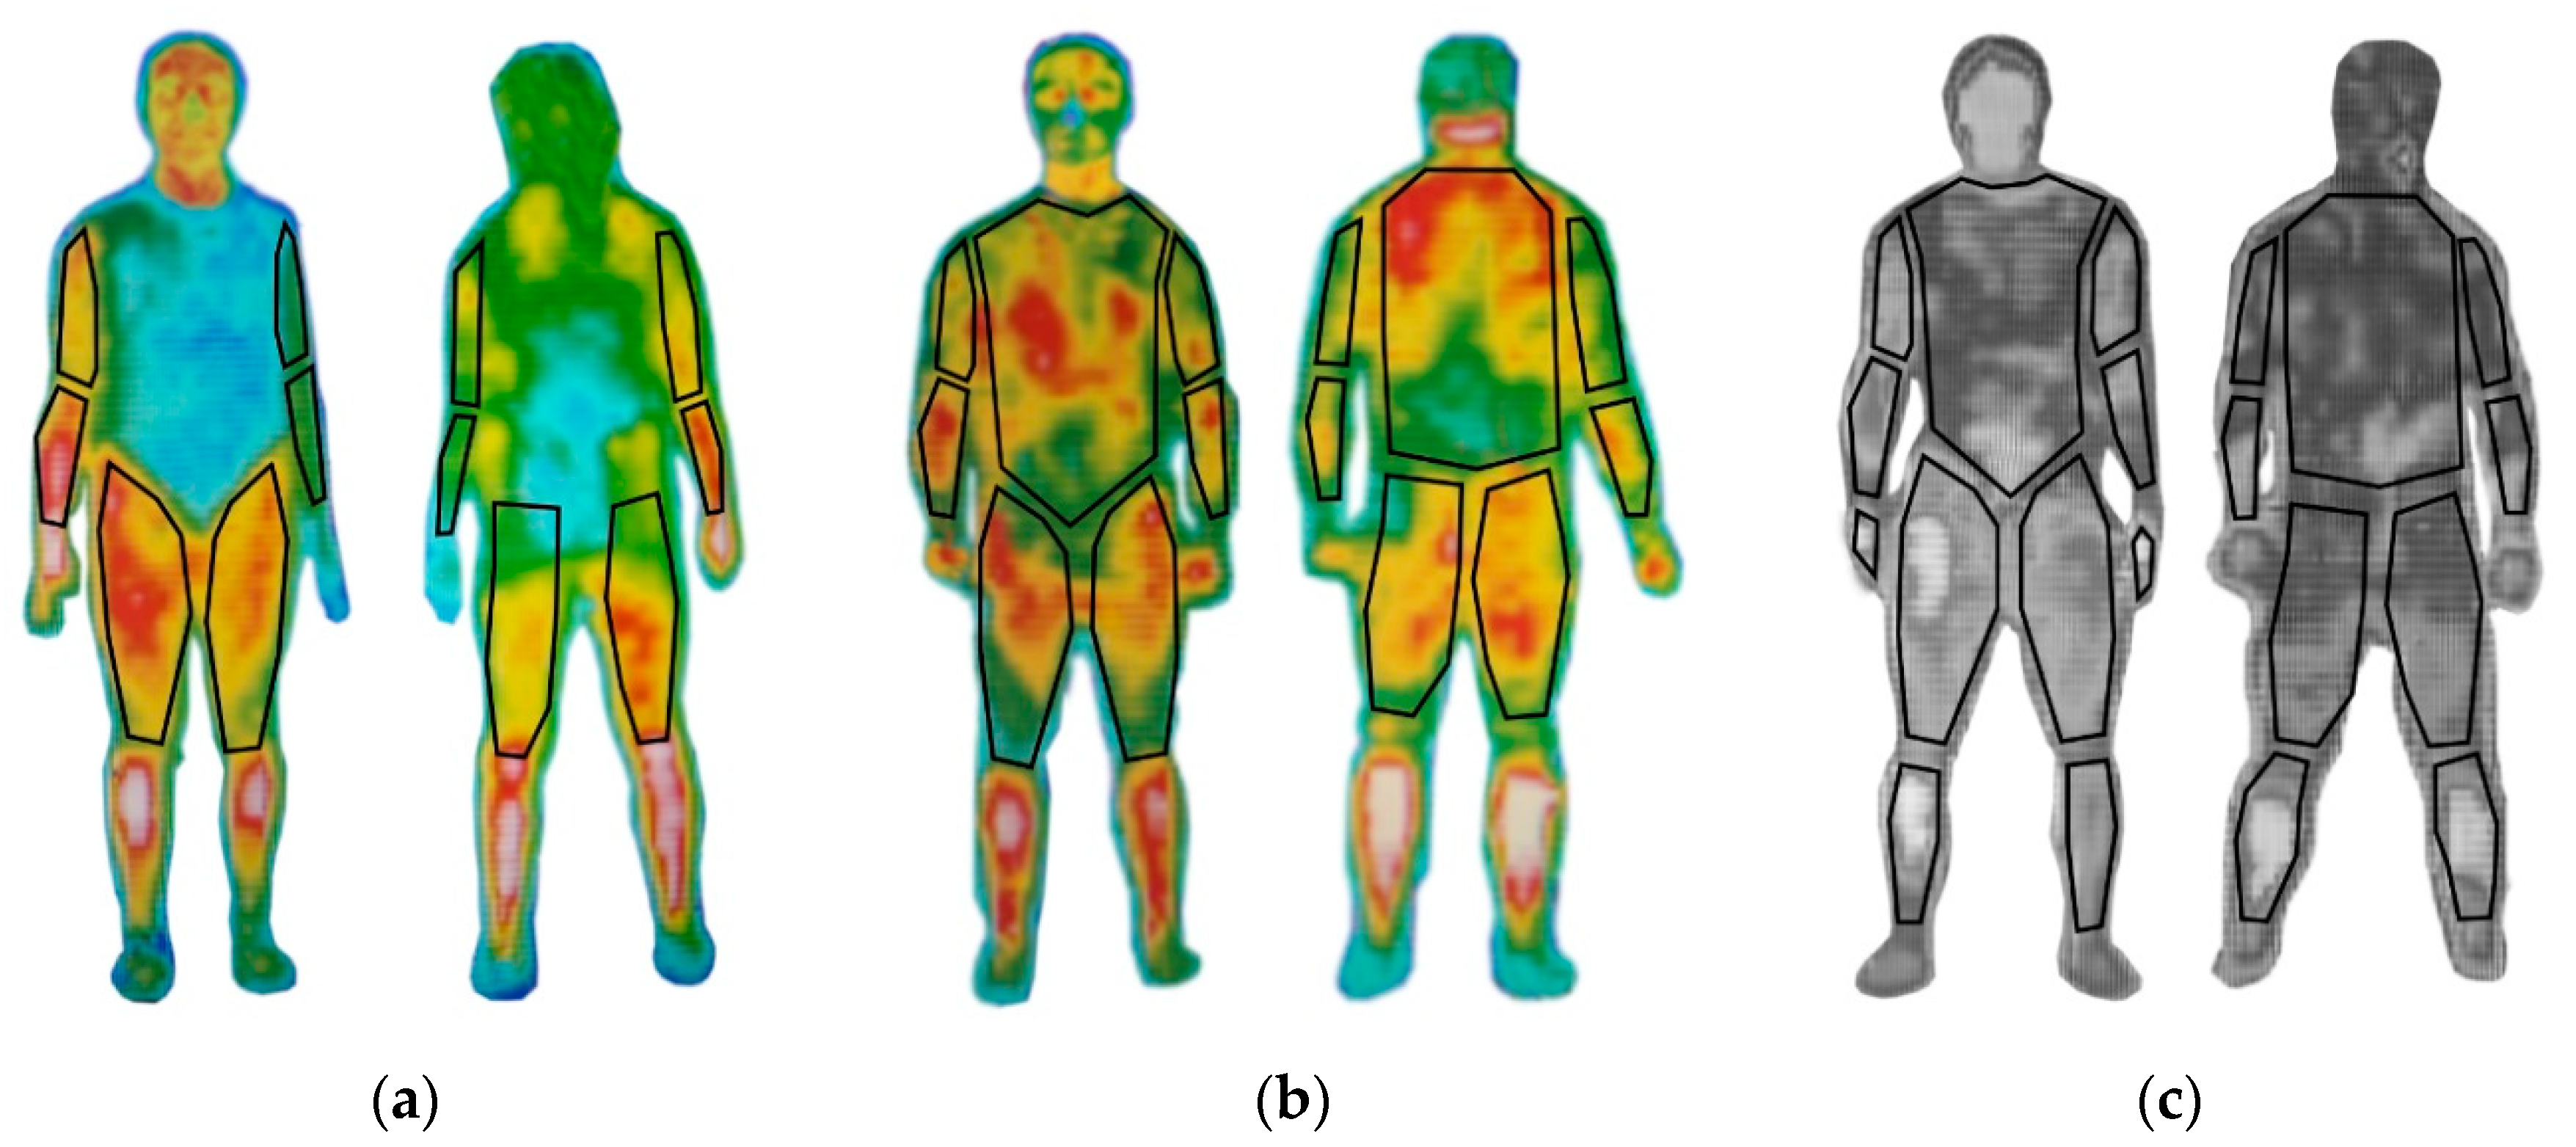
2.4. Definition of the Regions of Interest (ROIs)

After the thermal images acquisition, the body of the athletes was divided into several regions of interest (ROIs). The definition of ROIs largely affects the result and it varies among different studies [37]. Indications regarding how to choose these areas [38] and to calculate properly the temperature of a specific region [1] have been often proposed. The different clothing of the fencers and the consequent diverse emissivity make it impossible to use standard shapes for choosing the ROI.
The ROI associated with a specific part of the body was selected considering a representative area of each body region. Each ROI was defined through the software Infrared Report Express–PCE, which provides also the calculation of the maximum, minimum and mean temperature of the ROI. For this research, as it was focused on the temperature evolution on the athletes’ bodies, only the mean temperature of the selected area was considered, which was evaluated as the arithmetic mean of all the pixels inside the ROI. Particular attention was given to ensure that each ROI was the same for all the subjects and that the pixels along the contour line were excluded from the calculation of the temperature of the ROI.
In particular, this research was focused on evaluating the mean temperature of the whole body over the fencing uniform, calculated with the definition of ROIs shown in Figure 1a-b and on the estimation of the mean temperature of the single body parts, defined by the ROIs shown in Figure 1c. Moreover, as fencing is not a sport in which muscles work symmetrically, the ROIs associated with the left and the right part were considered separately. The head was not included in the ROIs, as athletes use a protective mask during fencing. As it was not possible to distinguish the anterior to the posterior part of the hands, only the anterior part was considered.

2.5. Measurement Procedure

Before starting the measurement, participants received the instructions regarding the procedures. In particular, athletes performed a warm-up session before starting the fencing training clothed with common sportswear (not in fencing uniform). Then, they wore the fencing uniform and entered the fencing hall, where they remained in standing position for ten minutes, to get acclimatized to the environment. After ten minutes, the first thermal image was acquired (“Before the training”). Later, they started fencing with maximal exertion and low rest (4–5 assaults) for one hour. After that, they stopped training to let the second thermal image (“During the training”) be acquired. Then they continued fencing for another hour, but with lower effort (taking a fencing lesson, longer rest between the assaults, etc.). Finally, they stopped and stayed in passive recovery, sitting for ten minutes in the thermoneutral environment of the fencing hall, after which the last thermal image (“After the training”) was acquired.
During the measurements, athletes were wearing the uniform, as fencing cannot be performed without protective clothing. Since the position of the camera may affect the measurements, its location was fixed at 1.5 m from the body, perpendicularly to the ROIs. Therefore, images of the front and of the back part of the body were recorded. Thermal images were detected always in the same location, in front of a flat and temperature-uniform surface where the athletes were standing, so that the background did not interfere with the calculation of the temperatures on the uniform. As an error in the focus of the camera may lead to imprecisions in the calculation of the temperature, particular attention was given to its adjustment. The thermal camera was switched on 10 min before the start of the measurements, for the stabilization of this instrument.
There is to notice that fencing is not a sport that is performed continuously, but it consists of intermittent assaults, therefore athletes were asked to respond the Borg’s scale [39], for the determination of the rate of perceived exertion (RPE), before the images were acquired. The activities performed during the training by the eight athletes were also considered and the heart rate was measured.

2.6. Methodology of Data Elaboration
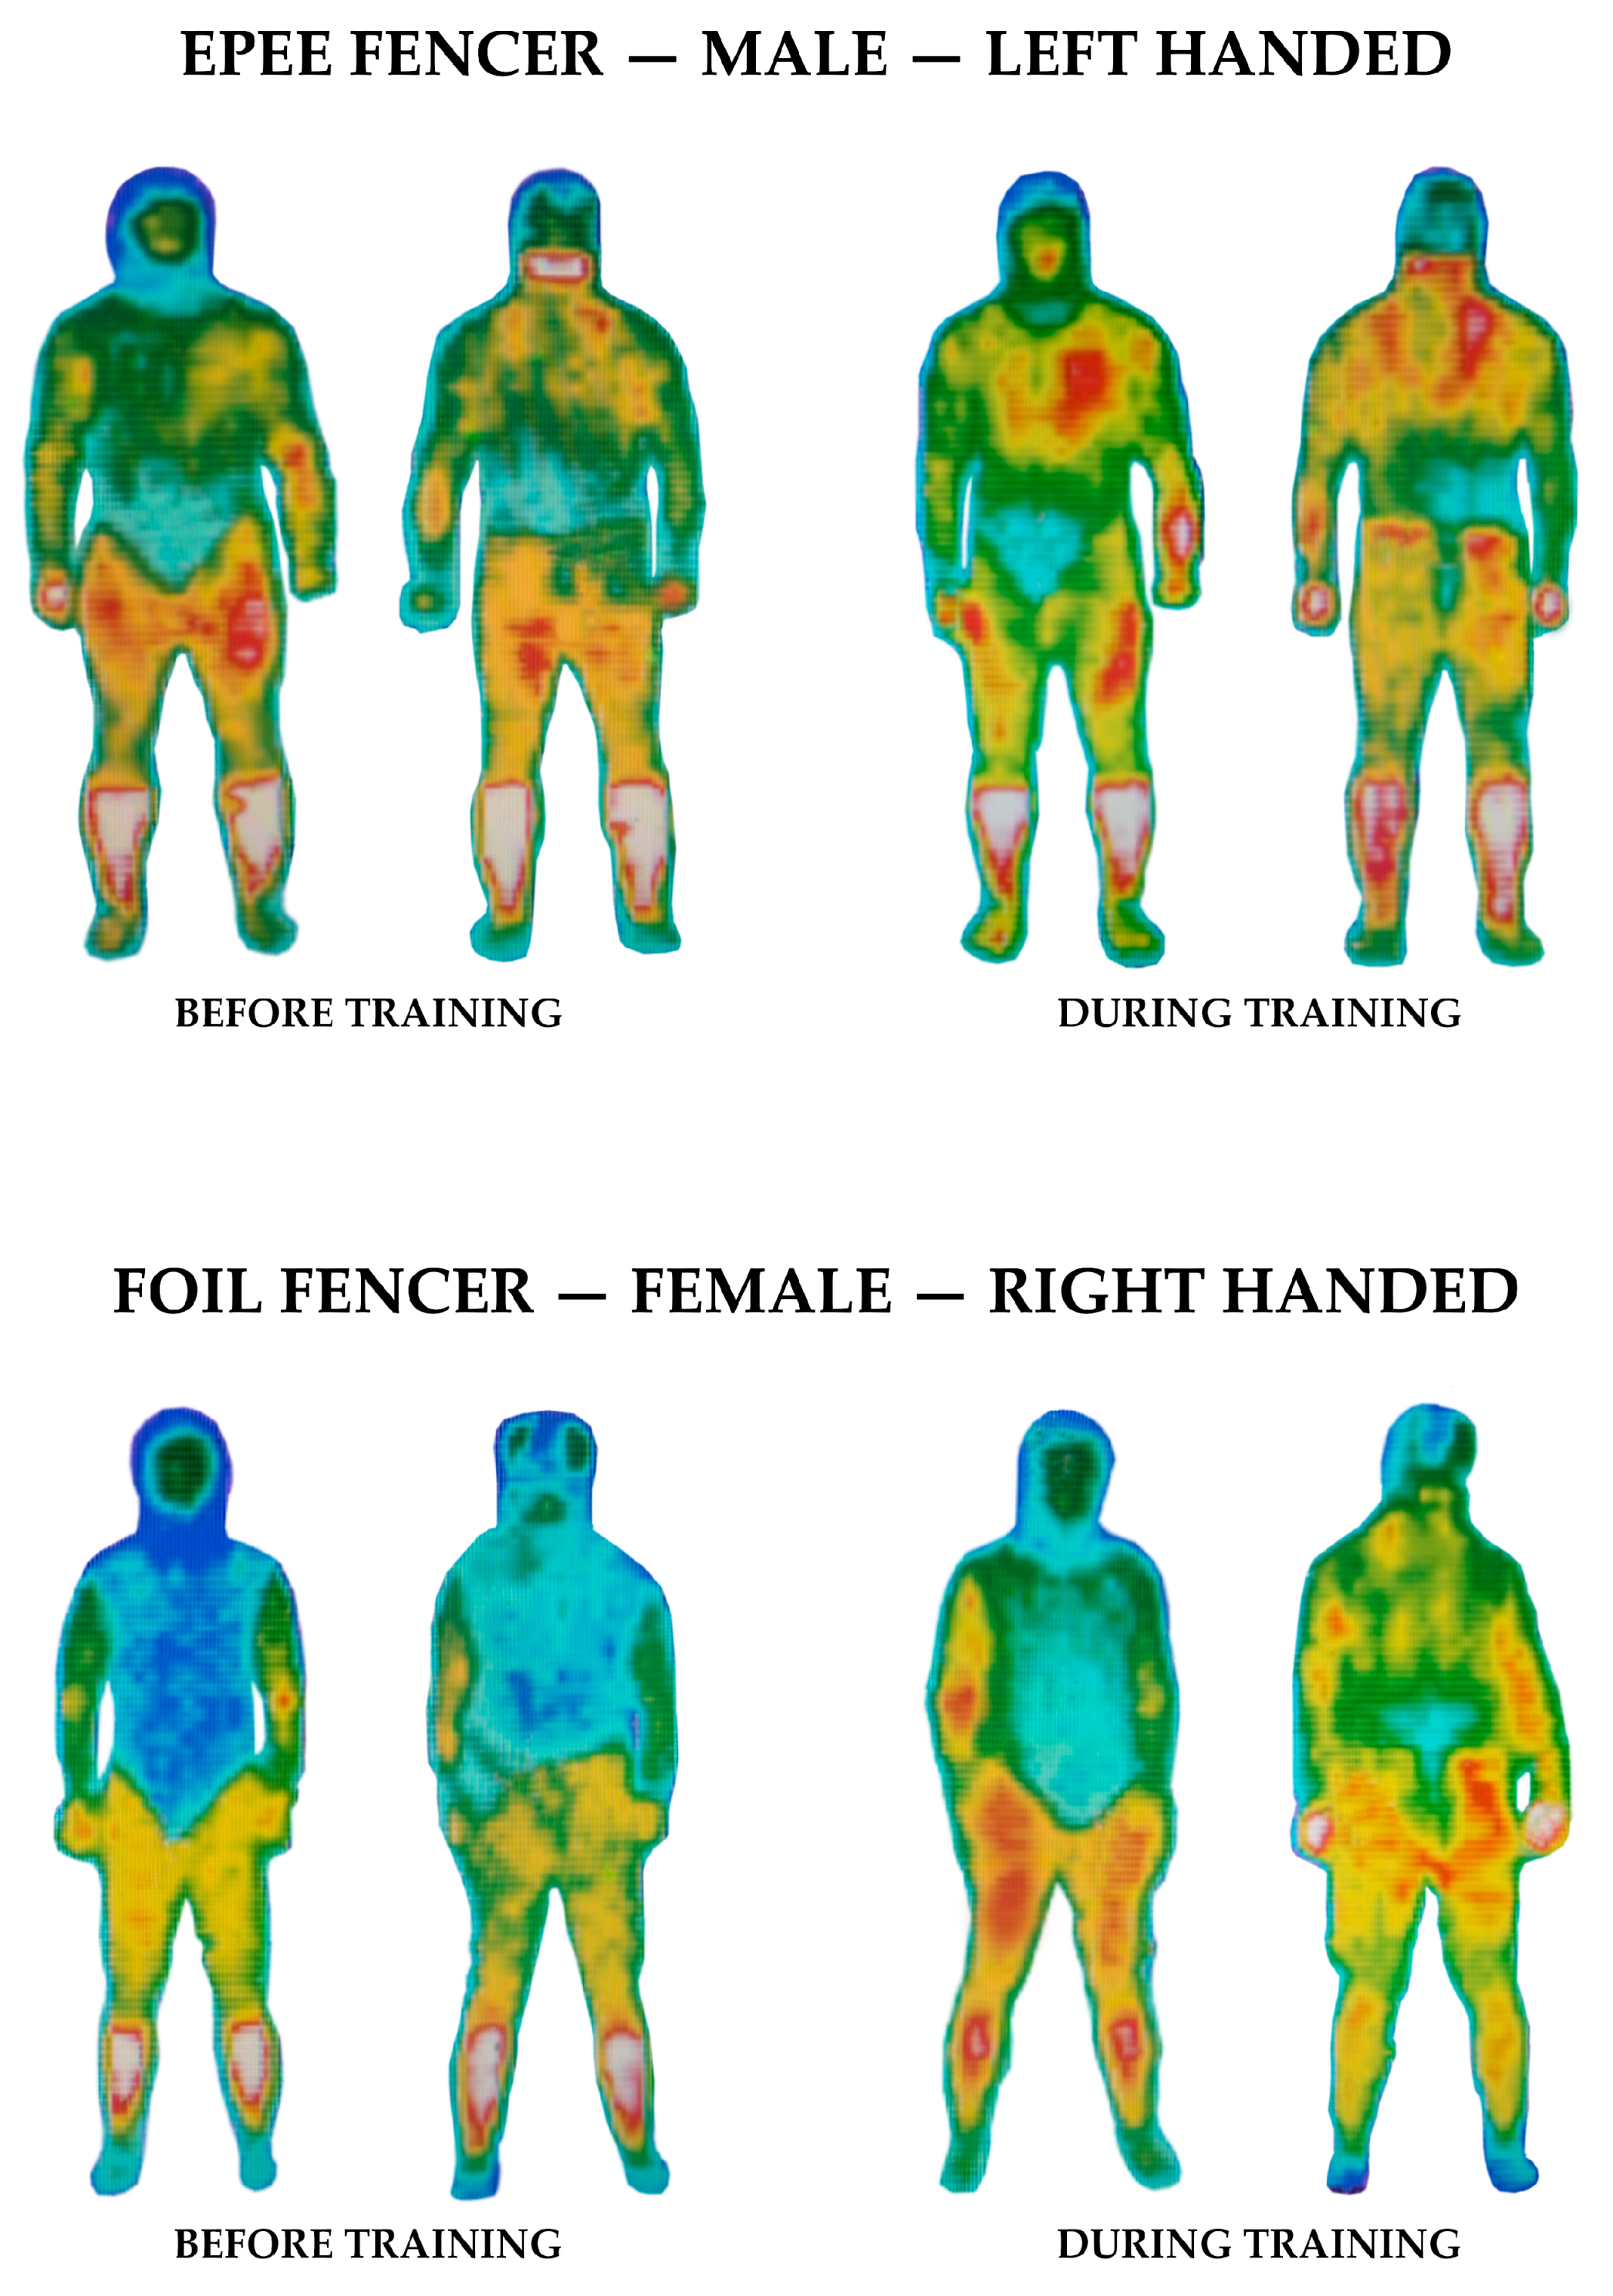
After the acquisition of the data, the thermal images were analysed with the software Infrared Report Express–PCE. As previously stated, the investigation was focused first on the determination of the mean temperature of the whole body and then on the temperature on the single ROIs (measured on the fencing uniforms).
According to the investigation carried out for subjects at rest [2] and to the research performed on exercising athletes [15] the mean temperature on the fencing uniform was calculated as following:
TMEAN = Σ TROI/n
with: n, the number and TROI, the temperature of ROIs shown in Figure 1a,b. For the calculation of the temperature of the single body parts corresponding to the ROIs shown in Figure 1c, the average value calculated as the arithmetic mean of the temperatures in the selected area given by the software was considered.
In order to evaluate the effect of exercise on fencers during training, temperature variations between the three phases in which thermal images were recorded have been calculated as following:
ΔT12 = T2 − T1,
ΔT23 = T3 − T2,
with: T1, temperature measured before starting the training, 10 min after entering the hall; T2, temperature measured after 1 hour of training and T3, temperature measured 10 min after the training.

3. Results

The thermal images were analysed according to the procedure shown in Section 2.6. In particular, the mean temperature difference on the fencing uniform was calculated considering the ROIs shown in Figure 1a,b, while the variation of temperature of the single body part was determined for the ROIs shown in Figure 1c.

3.1. Estimation of the Metabolic Rate

The metabolic rate is a function of the activities carried out during the training. For this reason, the activities performed during the measurement campaign and their duration was considered for each athlete (Table 3). The detection of the heart rate was performed in three different times, before the training (10 min after entering the fencing hall), during the training (after 1 h of fencing) and after the training (10 min after the end of the training).
The selection of the measurement time was carried out to evaluate the time-evolution of temperature during fencing. In particular, for the assessment of heart rate during exercise, athletes briefly interrupted their training. The heart rate recorded for all the athletes is reported in Table 4. The results indicate that the physical demand of fencing is relatively moderate for skilled fencers, as demonstrated also in other studies [40,41].

3.2. Rate of Perceived Exertion (RPE)

The Borg RPE scale consists of a 15-points scale for assessing the perceived exertion, from 6 (no exertion at all) to 20 (maximal exertion) [39]. Values of RPE were detected for all the eight athletes before training (10 min after the athletes were entering the fencing hall), after one hour of training (maximum exertion) and finally, 10 min after the end of the training (Table 5). It can be noticed that when the athletes were entering the fencing hall, their RPE was quite low (it ranged between 7 and 8), as they were in resting conditions. After one hour of training, the RPE results were high (it ranged between 16 and 19), showing that after one hour the exertion reached the highest values, as in the first hour athletes were fencing almost without rest (usually 4–5 assaults). Finally, at the end of the training after 10 min of rest, RPE was again quite low, showing the good training conditions of the fencers. The low values of RPE at the end of the training are probably related to different factors. First, to the physical condition of all the athletes that were in general good: the sample included all well-trained fencers that need less time to recover. Second, we need to consider that the first RPE was measured before the fencing training but after the warm-up, while the last RPE was acquired after the end of the training, when the heart rate was in most cases again quite low. This is probably because, after the first hour, when the intense exercises are carried out, it follows another hour of low-intensity training (fencing lessons, longer rest between the assaults, etc.) that added to the 10 min of rest sitting in the hall, allowing the recovery of the athletes. These factors may have produced a final RPE that was similar to the one before the training.

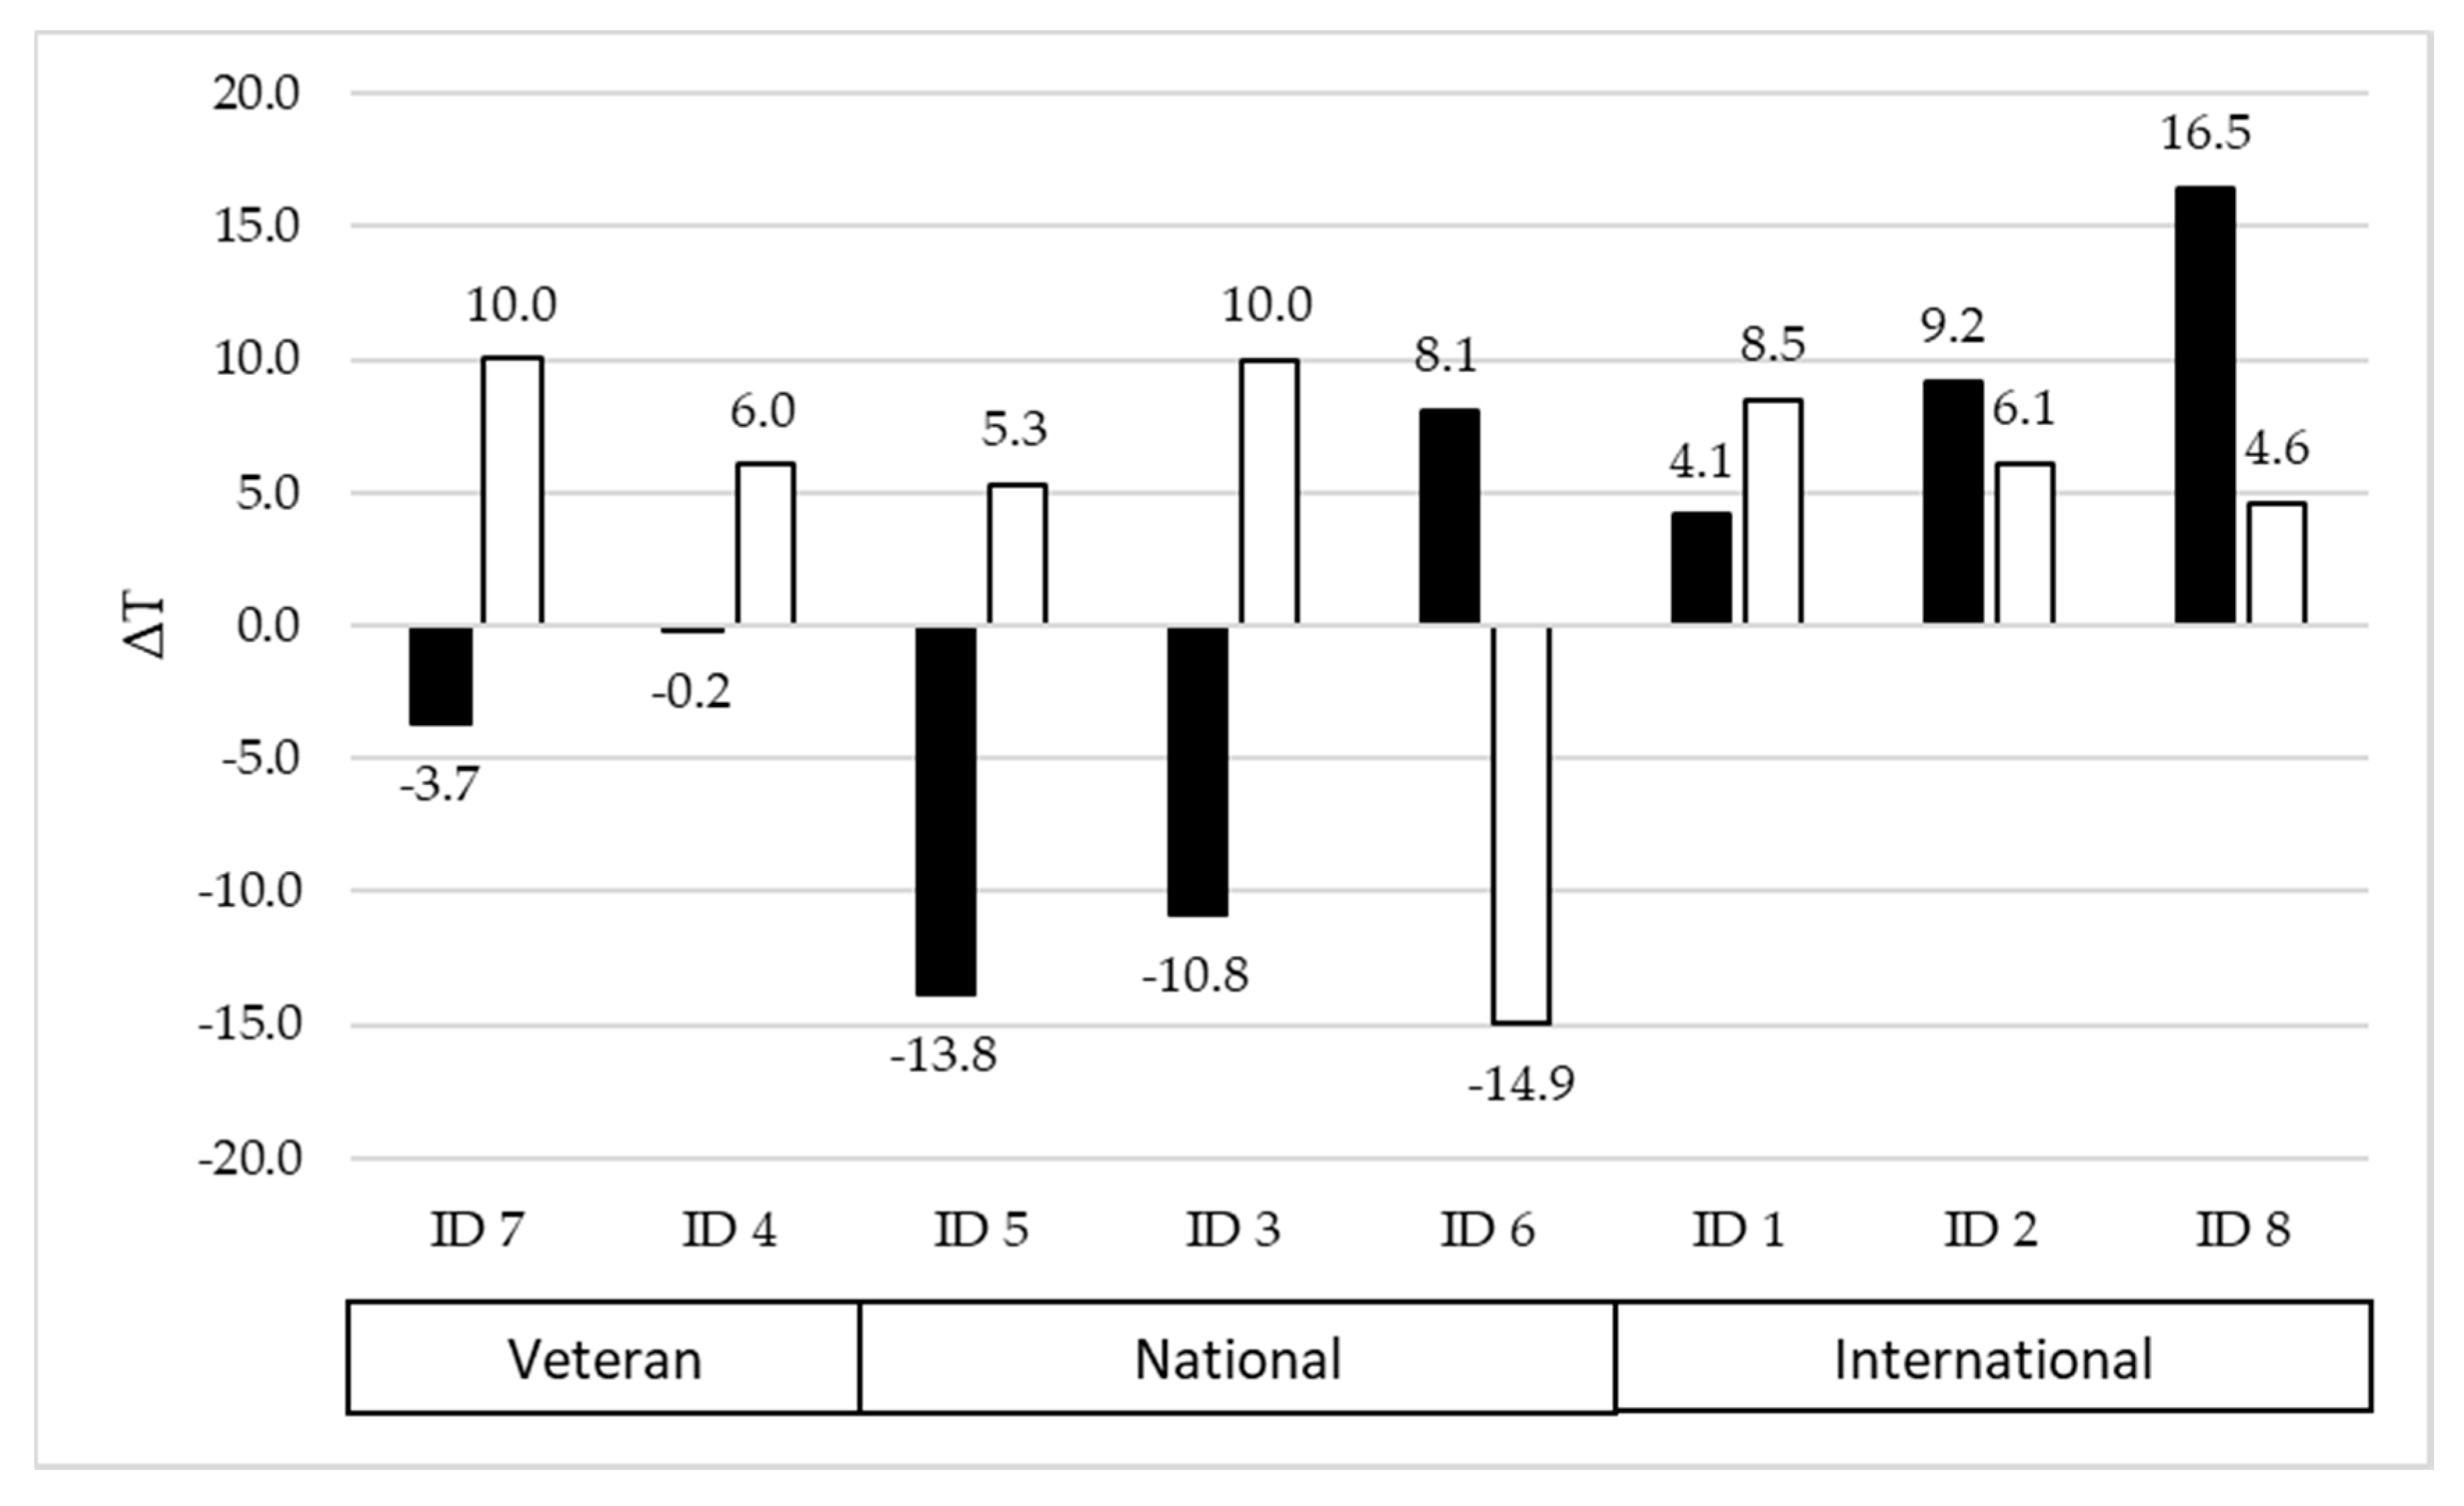
3.3. Mean Temperature Differences of the Whole Body

To calculate the mean temperature differences on the fencing uniform, the ROIs shown in Figure 1a,b were considered. Analysing foil and epee fencers collectively, 50% presented first a decrease of temperature between the start and the middle of the training and then an increase from the middle to the end of the training. The remaining 50% was divided in 38% presenting always an increase of temperature from the start to the end of the training and 13% that had first an increase and later a decrease of temperature.
This temperature trend can be attributed to the individual response of the athletes. During the investigation, the air temperature stayed in the recommended range of 18–25 °C that does not affect the thermoregulation mechanisms related to shivering or sweating [24]. Further evidence of the independence from the environmental parameters was given by the calculation of the correlation between the temperature difference recorded in the air and on the fencing uniform. Any correlation was found between these parameters (R2 < 0.01), showing that during fencing the main cause of the temperature increase or decrease is related to thermoregulatory processes occurring while practising this sport.
High-temperature variations were recorded during the test, as it is shown in Figure 2. There is to consider that this is not the skin temperature variation, but the difference of temperature on the fencing uniform, which may vary in a larger range. ΔT higher than 10 °C would not be realistic on the skin, but the external surface of the protective clothing is usually colder than the internal part, and therefore much colder than the skin temperature.
It was possible to recognise a correspondence between the competition level (and therefore the fitness level) and the thermal behaviour of the athletes, which shows that professional athletes, who were participating in international competitions, were the only ones showing a constant increase of temperature in the measurement phases (ΔT12 > 0, ΔT23 > 0). Veteran athletes showed first a decrease and a later increase in temperature (ΔT12 < 0, ΔT23 > 0), but lower ΔT were detected when compared to national and international athletes. Finally, most of the national athletes were presenting first a decrease and a later increase of temperature (ΔT12 < 0, ΔT23 > 0), with the exception of only one fencer, who was showing the opposite trend (ΔT12 > 0, ΔT23 < 0). This is because the heat produced by this athlete was already given up to the environment, therefore the temperature on the fencing uniform was already low.

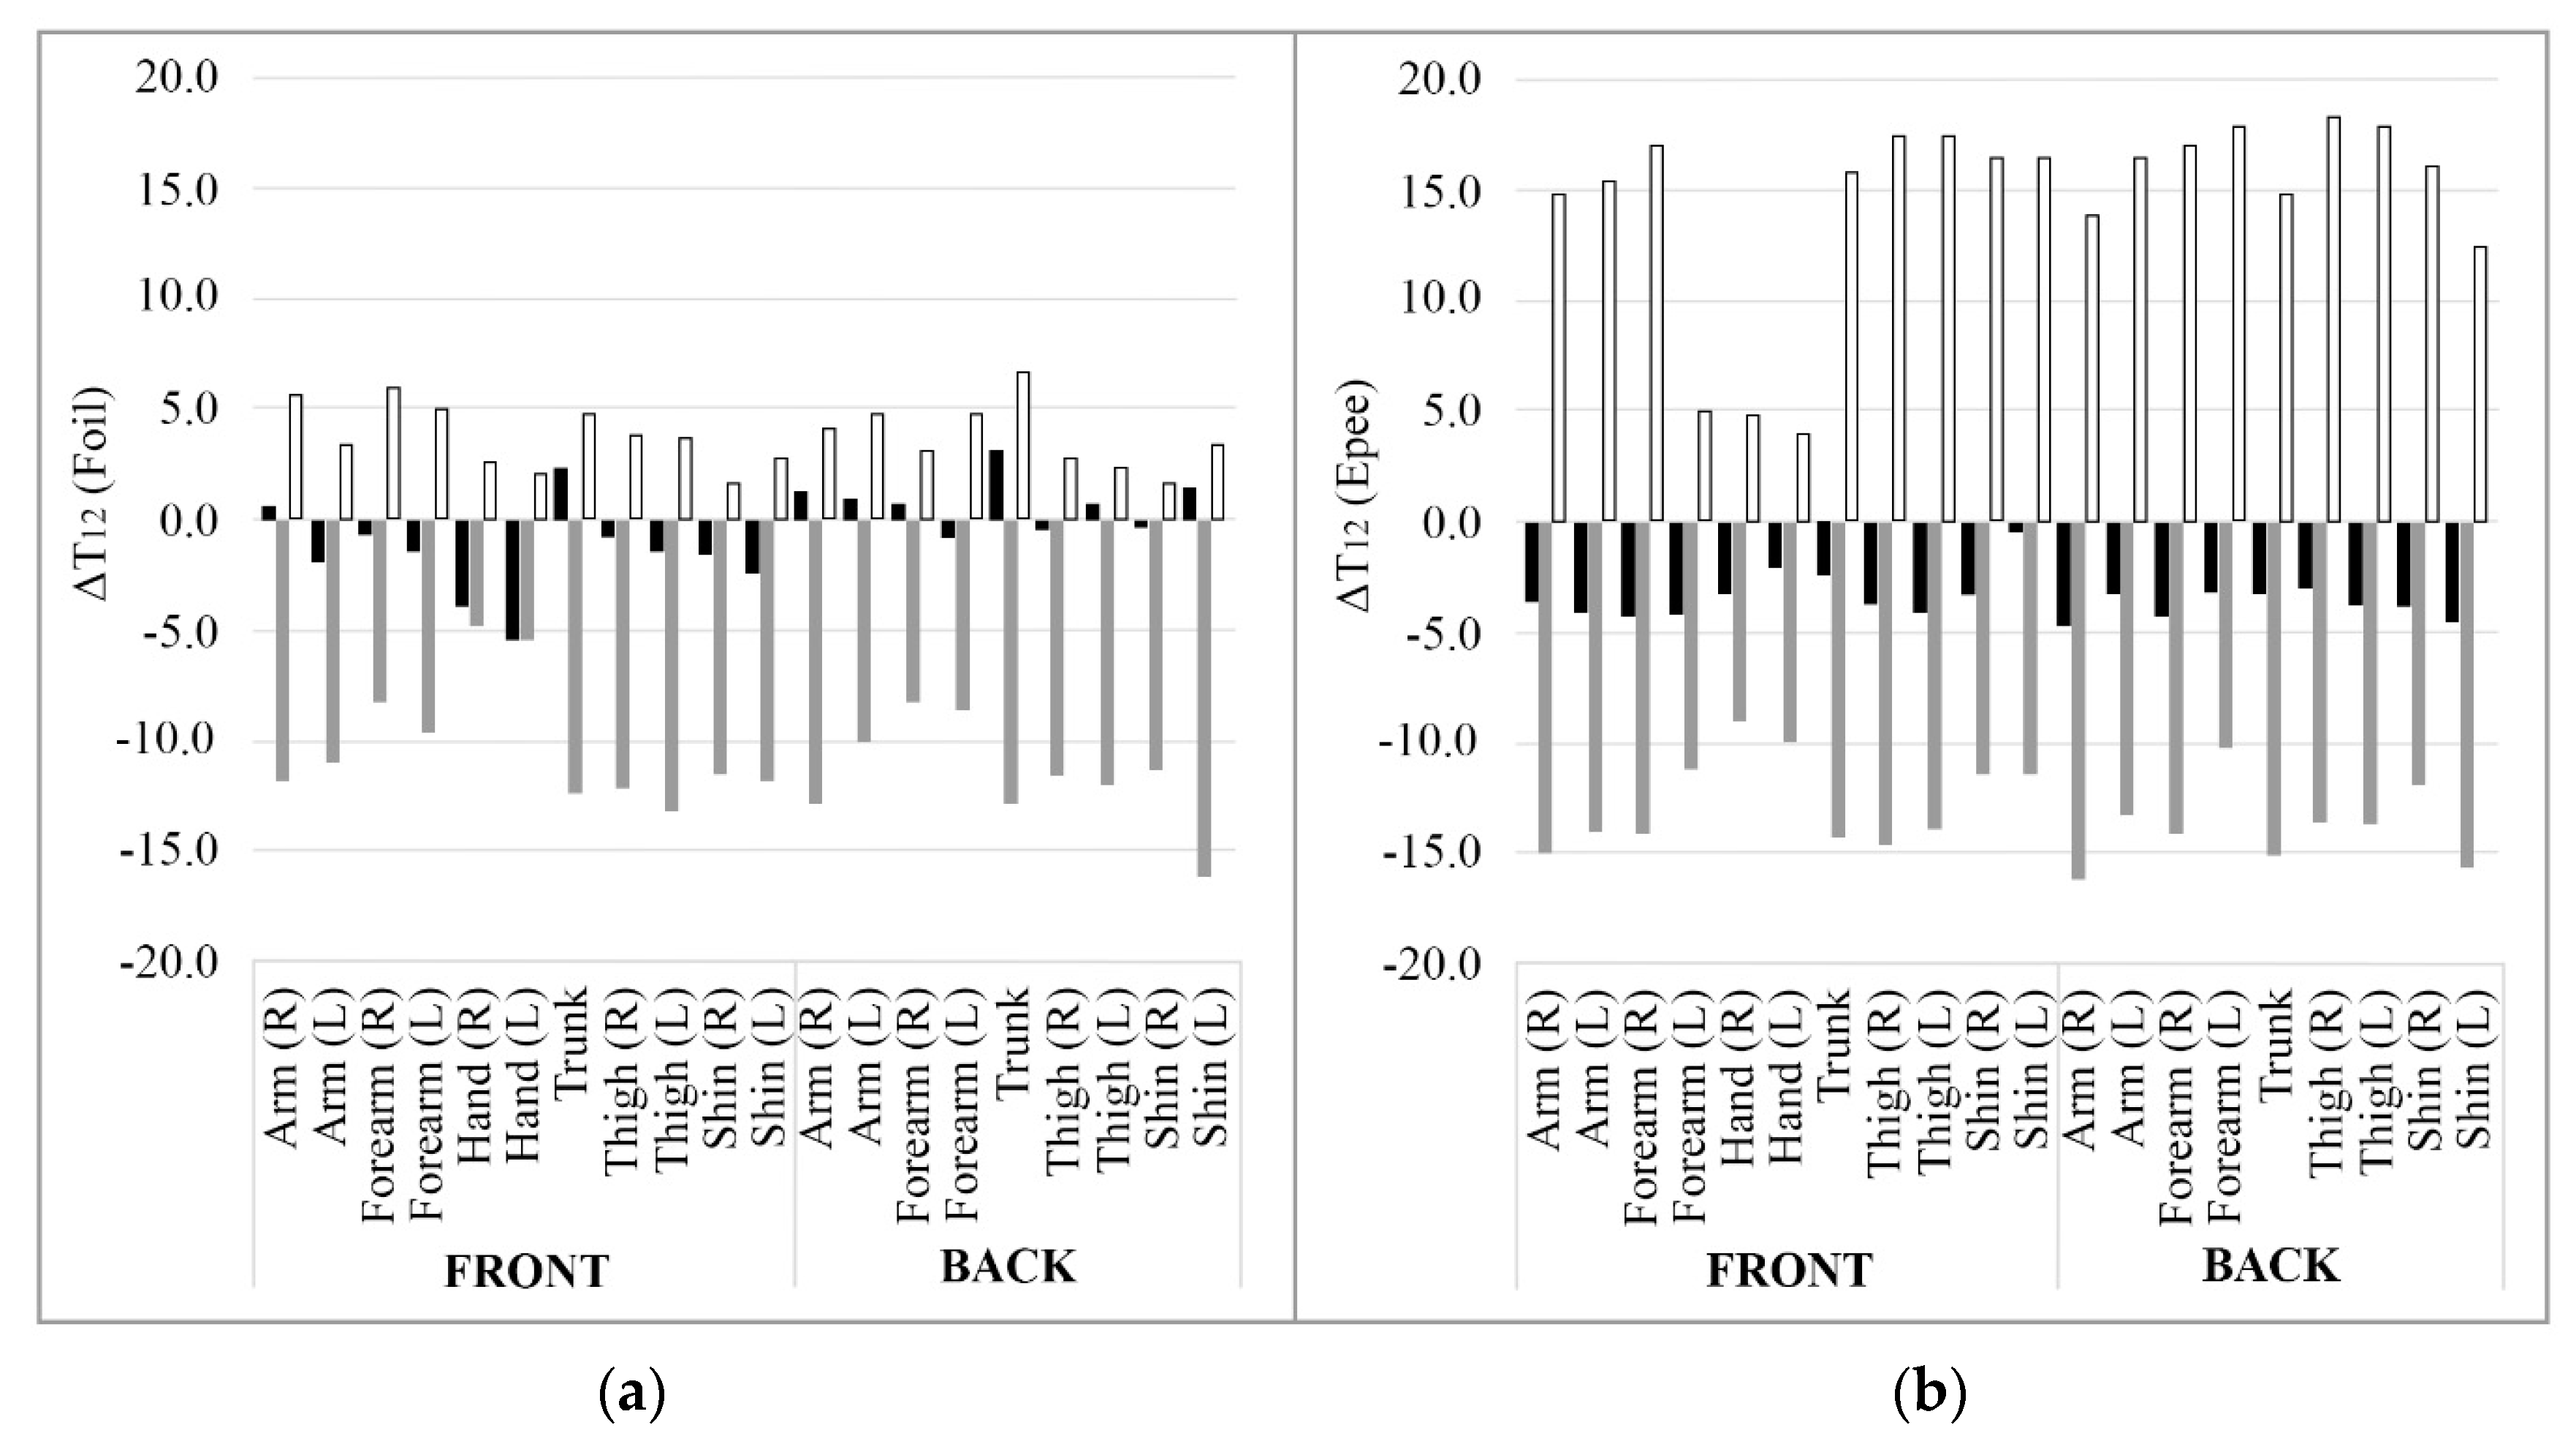
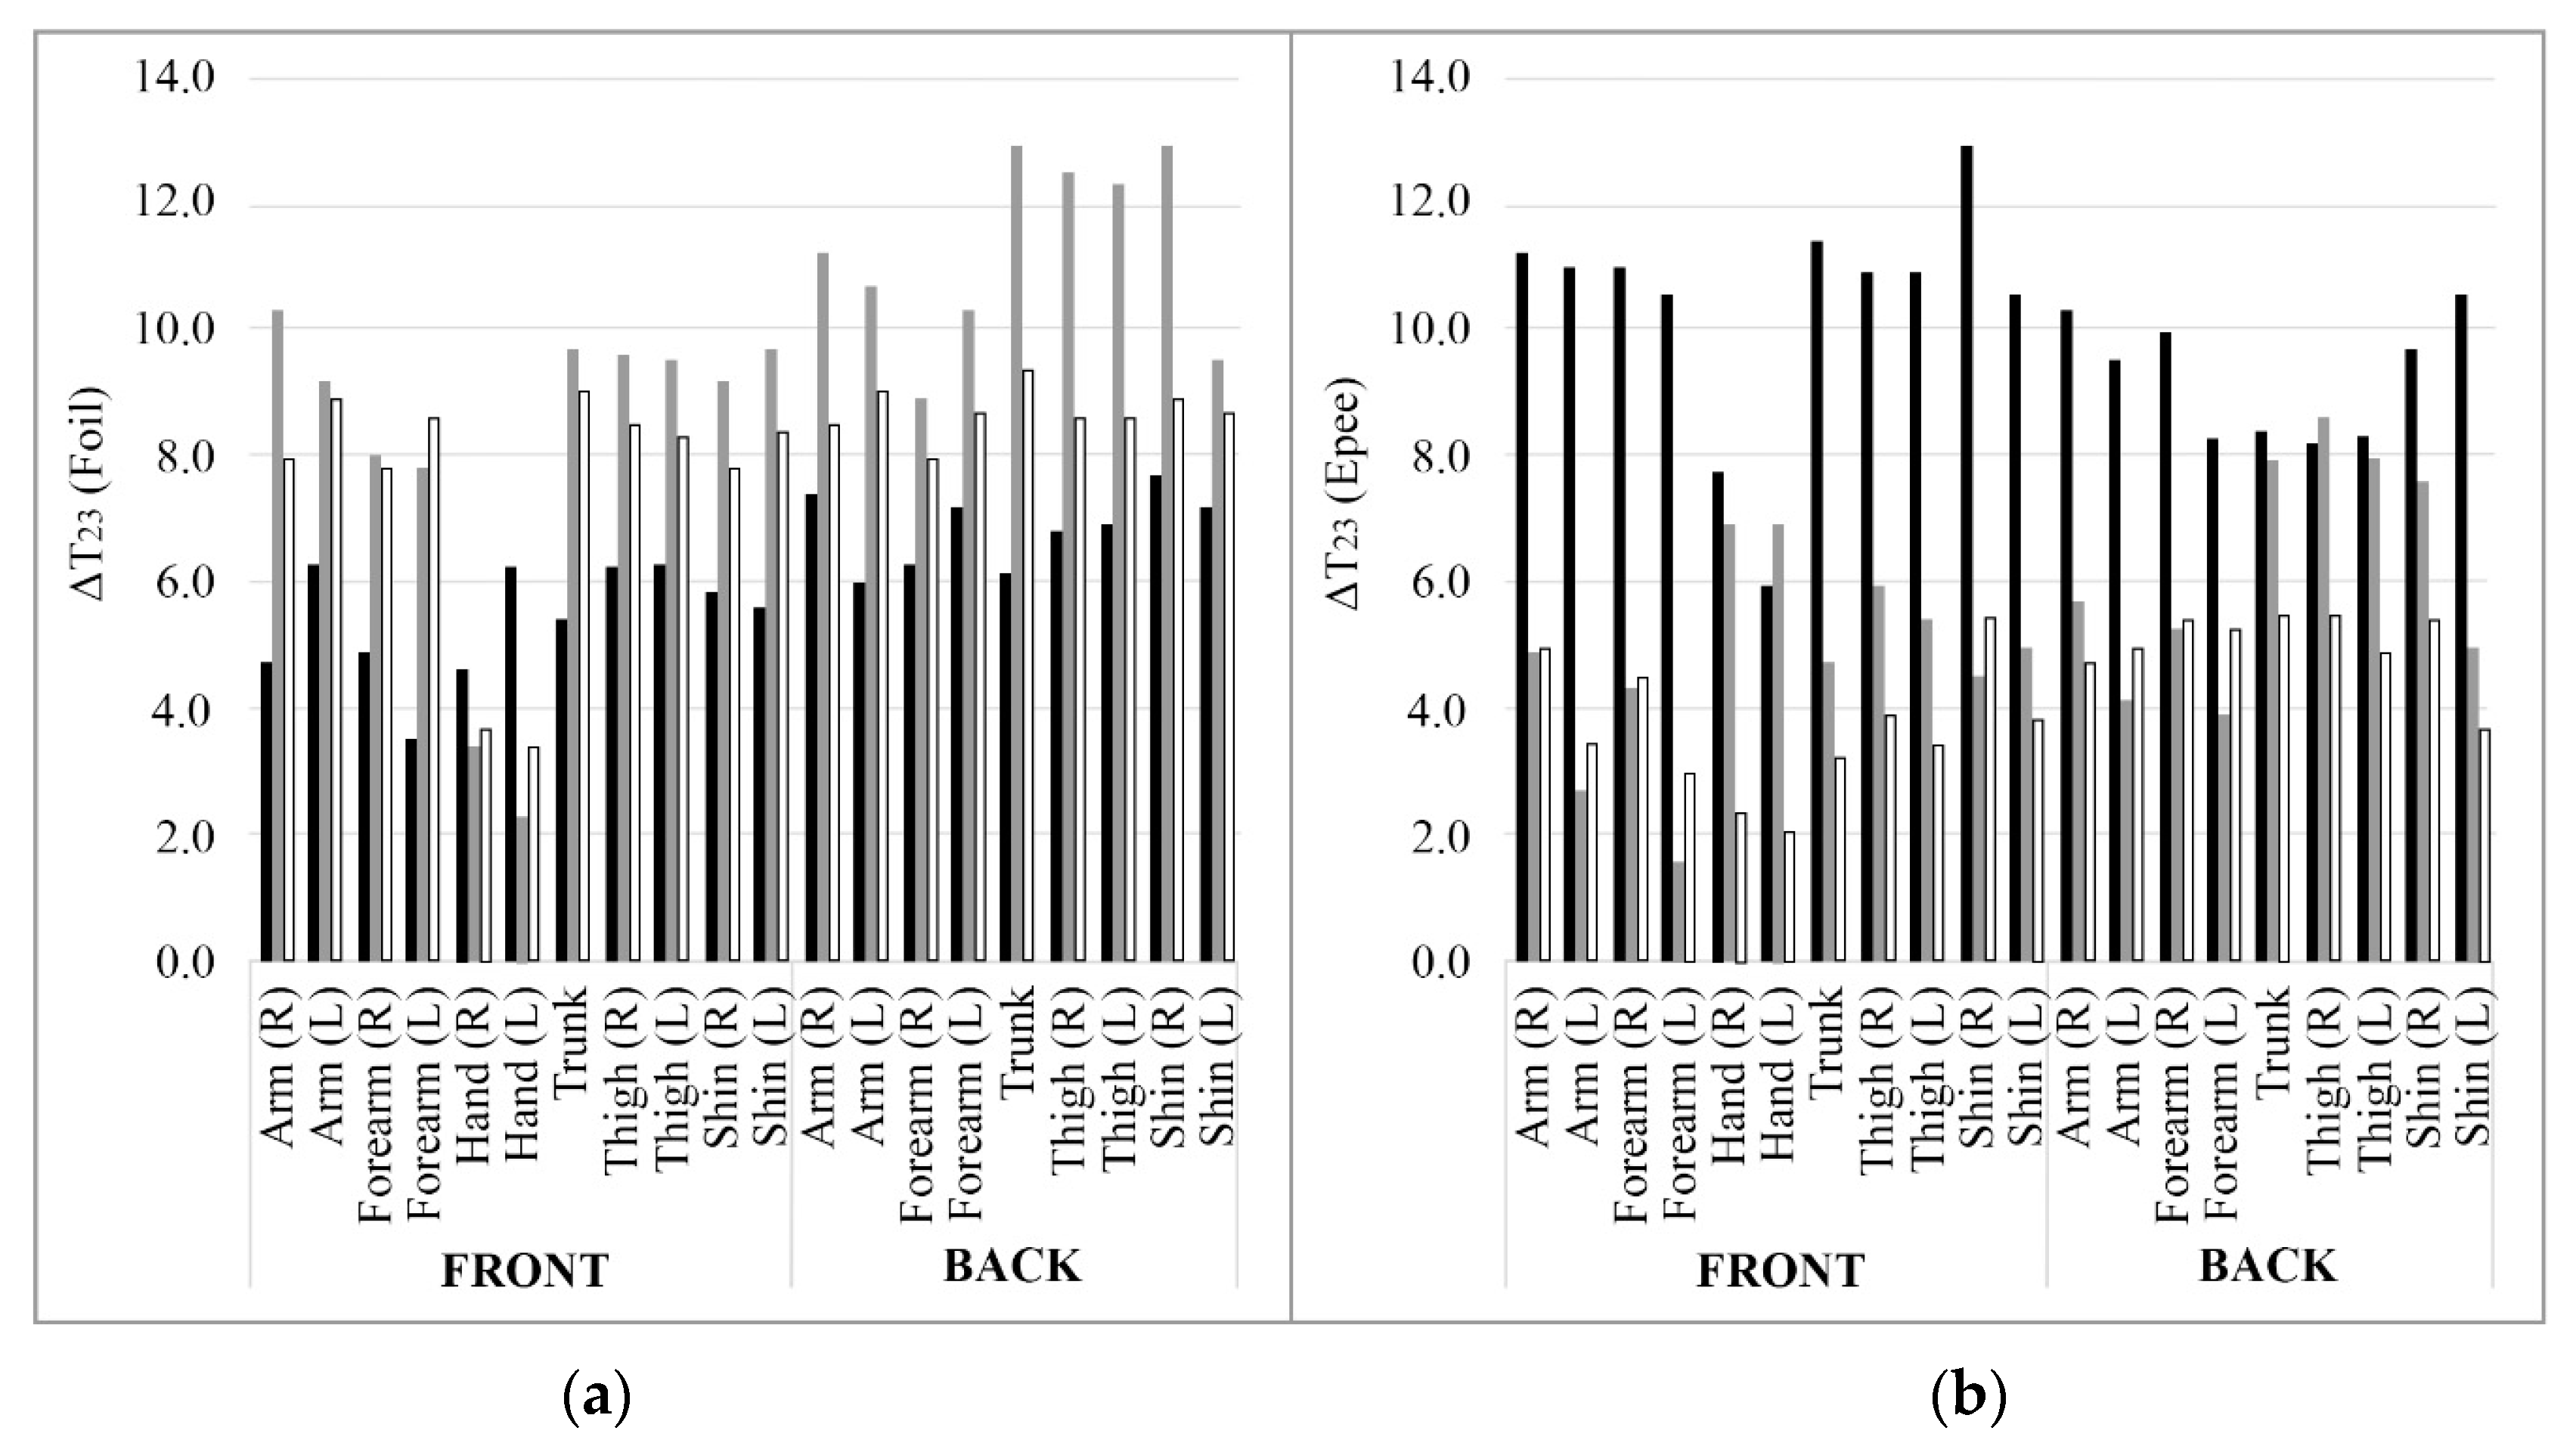
3.4. Mean Temperature differences on the Body Parts

The temperature differences on the single body parts are the ones calculated for the ROIs shown in Figure 1c. All the measurements were taken on the sports apparel, which included a jacket, breeches (fencing uniform), socks and, for foil fencers, conductive jacket, except the one on the hands that were recorded on the skin. Since the previous analysis showed that there was a correspondence between the level of competition and the thermal behaviour, the temperature differences on the defined ROIs recorded during the training for foil and epee fencers are reported in Figure 3 and Figure 4. It resulted that the ΔT for less trained athletes was lower than the one of the professional athletes and that the front and the back part of the fencers had almost the same thermal behaviour. Furthermore, the muscles that are more involved in the movements of this sport presented a higher temperature increase (or a lower decrease). The complete results regarding the investigation of the mean temperature differences on the body parts of all the athletes can be found in Supplementary Materials.
Since fencing is a sport in which muscles do not work symmetrically, an analysis concerning the comparison between the dominant and non-dominant part was considered. The trunk was considered apart, as it is the centre of the vital organs. In fact, combat sports athletes are often characterized by thermal asymmetries between different sides due to the laterality of the athletes [17], as it is shown by the qualitative analysis reported in Figure 5. The asymmetry is a peculiar characteristic of the sport of fencing and the dominant part can be recognized as the one that athletes use to keep their weapon. The asymmetry can contribute to an overheating of the dominant part [42], thus it is particularly important to evaluate it.
Table 6 shows a comparison between the left and right side of the body and between the dominant and non-dominant part. The difference between the right and the left part was more evident for foil fencers, probably due to the different workloads that they require. In fact, in some cases, the temperature difference between the right and the left part of the body for epee fencers is equal to zero. However, it is also important to consider the difference between the dominant and non-dominant side, as the pattern of temperature was the same for epee and foil fencers. As expected, when the temperature trend was decreasing, the dominant part was decreasing less than the non-dominant part, while when the temperature trend was increasing, the highest increase was detected in the dominant part.

4. Discussion

This paper provided a preliminary analysis of the thermal profile for fencers, as studies concerning the application of IRT to this sport are generally limited to qualitative results. Therefore, there was a necessity to develop a methodology for the use of this innovative technology to fencing.
Considering the mean temperature differences of the whole body, most athletes showed first a temperature decrease and a later increase. This trend was also observed in studies examining other sports, both for graded and constant load exercise [15,26]. The initial decrease of temperature is usually attributed either to vasoconstriction, due to the delivery of the blood flow to the working muscles, or to sweat evaporation since it can remove latent heat from the skin [15]. This is the general pattern of skin temperature observed despite the sport performed, even if individual differences of the time evolution of this parameter can be detected [12,13,26]. In the case of fencing, the majority of the athletes presented first a decrease and a later increase in temperature (ID3 – ID4 – ID5 – ID7), as it happened in other sports. The increase of temperature at the end of the training can be attributed to the release of the heat stored in the body core to the ambient. The opposite trend was detected only for one fencer (ID 6), probably due to the different individual response of this athlete. After the first hour of training ID 6 is probably in the phase of vasodilation and already cooled at the end of the training. Finally, it is interesting to notice that international athletes presented all the same temperature pattern, consisting of a high increase in temperature during and after the training. They also showed the highest temperature differences, probably due to the high effort that these athletes present during training. However, this result could also correspond to a particularly favourable thermal profile for the sport of fencing, which allows international athletes to lose heat through the skin and uniforms, helping them to reduce the core temperature and improving their performance. Individual differences occurred in the extent of ∆T, even if the temperature differences were particularly high for international athletes. There is to notice that in the case of fencing it was not possible to detect directly skin temperature, due to the presence of the protective clothing and the consequent loss of information that would occur in the time needed to remove it, which also explains the consistent temperature differences.
The temperature variation of the single ROIs is often a function of the thermal profile of the sport performed. For example, in sports such as running the initial skin temperature decrease is more evident in the most peripheral regions such as the upper body, as it is not directly involved in the muscular work, while the most used muscles present a lower temperature decrease [26]. The same trend can be detected in other sports such as cycling [13], while for example in swimming even the different swimming style can determine a diverse temperature trend of the single ROIs [16]. Usually, in combat sports, the higher temperature increases are related to the ROIs that include the muscles more involved in muscular work [17]. This is confirmed also in the sport of fencing, where the highest temperatures were recorded on the legs, leading arm or trunk. High temperatures in the part of the trunk are a consequence of the increase of the core temperatures that can be reached while practising this sport, as the trunk is where vital organs are located. Minimum temperatures were instead generally recorded in the arm, forearm and hand of the non-dominant side, showing that the less involved muscles in the muscular work are more subjected to vasoconstriction.
Comparing the dominant and non-dominant side of the athletes allows defining the thermal profile of the sport of fencing. In this sport, asymmetries are expected, and their investigation may help to prevent injuries and hazards for the athletes [17]. Differences in skin temperature between the right and the left part of the body higher than 1.6 °C can be considered harmful for athletes [20]. These differences were highlighted in Table 6 for foil and epee fencers and show that they were in some cases higher than this limit. However, we need to consider that this value referred to the skin temperature and not to the temperature difference recorded on the fencing uniform, so it is not possible to draw any conclusion on this problem, and medical considerations may be necessary. Thermal asymmetries between the dominant and non-dominant side were present in foil and epee fencers, as it happens in other combat sports [17]. The dominant part usually showed a lower decrease in temperature and a higher increase, while the non-dominant part had the opposite trend. The International fencers were instead presenting again a different behaviour, as they had a similar temperature trend on the dominant and non-dominant side, probably because elite fencers usually tend to involve all the muscles during their performance.
It is important however to notice some limitations that the IRT technology and the present study may have. The current number of studies of the application of IRT to sport does not provide a specific thermal profile for each discipline like it happens for fencing, making difficult the comparison and the interpretation of the results. This implies that also the methodology to assess thermal images, which can largely influence the results, is not clear for each sport. Regarding the sport of fencing, two other problems may occur: it is not possible to carry out tests in a laboratory to control better the environmental conditions and it is not possible to perform this sport without the protective uniform. The time needed for its removal would lead to an information loss about the thermal pattern, thus the measurement must be performed over the clothing, producing results more difficult to interpret.
However, despite these limitations, IRT remains an important tool that can be used in the field of sport. This paper had the aim to provide both a methodology for assessing the temperature trend and a preliminary thermal profile for the sport of fencing. This will be useful for the evaluation of athletic efficiency and performance, but also to avoid possible injuries. Furthermore, as the extent of the temperature difference was generally high, especially for International athletes, future studies should be focused on the assessment of heat stress that may occur during fencing training.

5. Conclusions

In the last years, an increasing number of studies concerning the use of IRT in sport science can be detected. In this research, it is shown how IRT can be useful for assessing the thermal response of the athletes during training and the possible implications on their performance. In the case of non-stationary conditions, the metabolic rate seems to play a key role in the heat exchange between the body and the environment, due to the high amount of heat produced by the body. In particular, physiological responses were examined to determine a preliminary thermal profile of fencers, through the detection of temperature differences on the body of the athletes before, during and after training. The results showed that the thermal behaviour of the fencers was mostly related to their competition level.
Generally, the temperature on the uniforms in moderate environments is higher than the temperature indoors, so it can be presumed that athletes give up heat to the environment. How the heat flows from the body to the environment may vary according to the metabolic response of the single person. From these preliminary results, it is shown that the majority of the trained athletes were presenting first a decrease and a later increase of temperature, while professional athletes (international level) were presenting a constant temperature increase. This suggests that this temperature trend typical of professional athletes may be one of the factors related to their high performance. From this research, further studies should be developed in accordance with National and International Federations, as they could support better performance of the athletes.

Supplementary Materials

The following are available online at https://www.mdpi.com/2076-3417/10/9/3296/s1, Figure S1: Definition of the ROIs for the single body parts, Figure S2: Temperature variations on the body parts for veteran athletes, Figure S3: Temperature variations on the body parts for national athletes, Figure S4: Temperature variations on the body parts for international athletes, Figure S5: Comparison between the temperature variation of the dominant and non-dominant part of the veteran athletes, Figure S6: Comparison between the temperature variation of the dominant and non-dominant part of the national athletes, Figure S7: Comparison between the temperature variation of the dominant and non-dominant part of the international athletes. Table S1: Temperature variations on the body parts for each athlete, Table S2: Temperature variations for the dominant, non-dominant and trunk of each athlete.

Author Contributions

All the authors contributed in equal parts to the research activity and to the paper writing. All authors have read and agreed to the published version of the manuscript.

Funding

This research was partially funded by University of Pisa, within the financing activities for multidisciplinary research projects developed at the University of Pisa (ID research project PRA 2018-38).

Acknowledgments

This research has been developed as a result of the collaboration with the fencing team “Club Scherma Pisa Antonio Di Ciolo”. The authors gratefully acknowledge the availability of the trainers and of all the athletes taking part in this research. In particular, we would like to thank the trainers M. Enrico Di Ciolo and M. Simone Piccini and the athlete members of the Italian, Spanish and Mexican National Fencing Teams participating to this study, who gave us the possibility to implement solutions also for professional fencers.

Conflicts of Interest

The authors declare no conflict of interest.

References

  1. Ludwig, N.; Formenti, D.; Gargano, M.; Alberti, G. Skin temperature evaluation by infrared thermography: Comparison of image analysis methods. Infrared Phys. Technol. 2014, 62, 1–6. [Google Scholar] [CrossRef]
  2. Choi, J.K.; Miki, K.; Sagawa, S.; Shiraki, K. Evaluation of mean skin temperature formulas by infrared thermography. Int. J. Biometeorol. 1997, 41, 68–75. [Google Scholar] [CrossRef]
  3. Ring, E.F.J. The historical development of temperature measurement in medicine. Infrared Phys. Technol. 2007, 49, 297–301. [Google Scholar] [CrossRef]
  4. Hardy, J.D. The radiation of heat from the human body. J. Clin. Investig. 1934, 13, 615–620. [Google Scholar] [CrossRef] [PubMed]
  5. Ring, E.F.J.; Ammer, K. Infrared thermal imaging in medicine. Physiol. Meas. 2012, 33, 33–46. [Google Scholar] [CrossRef] [PubMed]
  6. Lahiri, B.B.; Bagavathiappan, S.; Jayakumar, T.; Philip, J. Medical applications of infrared thermography: A review. Infrared Phys. Technol. 2012, 55, 221–235. [Google Scholar] [CrossRef]
  7. Fernández-Cuevas, I.; Bouzas Marins, J.C.; Arnáóiz Lastras, J.; Gómez Carmona, P.M.; Pinoñosa Cano, S.; García-Concepción, M.A.; Sillero-Quintana, M. Classification of factors influencing the use of infrared thermography in humans: A review. Infrared Phys. Technol. 2015, 71, 28–55. [Google Scholar] [CrossRef]
  8. Keyl, W.; Lenhart, P. Thermography in sport injuries and lesions of the locomotor system due to sport. Fortschr. Med. 1975, 93, 124–126. [Google Scholar]
  9. Clark, R.P.; Mullan, B.J.; Pugh, L.G. Skin temperature during running—A study using infra-red colour thermography. J. Physiol. 1977, 267, 53–62. [Google Scholar] [CrossRef]
  10. Maior, A.S.; Leporace, G.; Tannure, M.; Marocolo, M. Profile of infrared thermography in elite soccer players. Mot. Rev. Educ. Fis. 2017, 23, 2. [Google Scholar] [CrossRef]
  11. De Rade Fernandes, A.; Mendonca Pimenta, E.; Gomes Moreira, D.; Bouzas Marins, J.C.; Silami Garcia, E. Application of Infrared Thermography in the Assessment of Muscle Damage in Elite Soccer Athletes. Orthop. Rheumatol. 2017, 8, 5. [Google Scholar] [CrossRef] [Green Version]
  12. Arfaoui, A.; Polidori, G.; Taiar, R.; Popa, C. Infrared Thermography in Sports Activity. In Infrared Thermography; Prakash, R., Ed.; IntechOpen: London, UK, 2012; pp. 141–168. [Google Scholar] [CrossRef] [Green Version]
  13. Ludwig, N.; Trecroci, A.; Gargano, M.; Formenti, D.; Bosio, A.; Rampinini, E.; Alberti, G. Thermography for skin temperature evaluation during dynamic exercise: A case study on an incremental maximal test in elite male cyclists. Appl. Opt. 2016, 55, 126–130. [Google Scholar] [CrossRef] [PubMed]
  14. Tanda, G. Skin temperature measurements by infrared thermography during running exercise. Exp. Ther. Fluid Sci. 2016, 71, 103–113. [Google Scholar] [CrossRef]
  15. Tanda, G. Total body skin temperature of runners during treadmill exercise. J. Ther. Anal. Calorim. 2018, 131, 1967–1977. [Google Scholar] [CrossRef]
  16. Vardasca, R.; Seixas, A.; Gabriel, J.; Vilas-Boas, J. Infrared Thermography in Water Sports. In Application of Infrared Thermography in Sports Science; Priego Quesada, J.I., Ed.; Springer: New York, NY, USA, 2017; pp. 137–157. [Google Scholar] [CrossRef]
  17. Del Estal, A.; Brito, C.J.; Galindo, V.E.; Lopez Diaz de Durana, A.; Franchini, E.; Sillero-Quintana, M. Thermal asymmetries in striking combat sports athletes measured by infrared thermography. Sci. Sport 2017, 32, 61–67. [Google Scholar] [CrossRef]
  18. Priego Quesada, J.I.; Cibrián Ortiz de Anda, R.M.; Pérez-Soriano, P.; Salvador Palmer, R. Introduction: Historical Perspective of Infrared Thermography and Its Application in Sport Science. In Application of Infrared Thermography in Sports Science; Priego Quesada, J.I., Ed.; Springer: New York, NY, USA, 2017; pp. 1–23. [Google Scholar] [CrossRef]
  19. Formenti, D.; Merla, A.; Priego Quesada, J.I. The Use of Infrared Thermography in the Study of Sport and Exercise Physiology. In Application of Infrared Thermography in Sports Science; Priego Quesada, J.I., Ed.; Springer: New York, NY, USA, 2017; pp. 111–136. [Google Scholar] [CrossRef]
  20. Fernández-Cuevas, I.; Lastras, A.J.; Galindo, E.V.; Carmona, P.G. Infrared Thermography for the Detection of Injury in Sports Medicine. In Application of Infrared Thermography in Sports Science; Priego Quesada, J.I., Ed.; Springer: New York, NY, USA, 2017; pp. 81–110. [Google Scholar] [CrossRef]
  21. Soroko, M.; Davies Morel, M.C.G.; Howell, K. The Application of Infrared Thermography in Equestrian Sport. In Application of Infrared Thermography in Sports Science; Priego Quesada, J.I., Ed.; Springer: New York, NY, USA, 2017; pp. 265–296. [Google Scholar] [CrossRef]
  22. Fournet, D.; Havenith, G. Assessment of Sport Garments Using Infrared Thermography. In Application of Infrared Thermography in Sports Science; Priego Quesada, J.I., Ed.; Springer: New York, NY, USA, 2017; pp. 159–183. [Google Scholar] [CrossRef]
  23. Luong, M.P. Assessment of Equipment Using Infrared Thermography in Sports. In Application of Infrared Thermography in Sports Science; Priego Quesada, J.I., Ed.; Springer: New York, NY, USA, 2017; pp. 185–209. [Google Scholar] [CrossRef]
  24. Priego Quesada, J.I.; Kunzler, M.R.; Carpes, F.P. Methodological Aspects of Infrared Thermography in Human Assessment. In Application of Infrared Thermography in Sports Science; Priego Quesada, J.I., Ed.; Springer: New York, NY, USA, 2017; pp. 49–79. [Google Scholar] [CrossRef]
  25. Marins, J.; Fernández Cuevas, I.; Arnaiz-Lastras, J.; Fernandes, A.A.; Quintana, M. Applications of Infrared Thermography in Sports. A Review. Rev. Int. Med. Cienc. Act. Fis. Deporte 2015, 15, 805–824. [Google Scholar]
  26. Tanda, G. The use of infrared thermography to detect the skin temperature response to physical activity. In Proceedings of the 33rd UIT (Italian Union of Thermo-fluid dynamics) Heat Transfer Conference, L’Aquila, Italy, 22–24 June 2015. [Google Scholar]
  27. Akimov, E.B.; Son’kin, V.D. Skin temperature and lactate threshold during muscle work in athletes. Hum. Physiol. 2011, 37, 621–628. [Google Scholar] [CrossRef]
  28. Cholewka, A.; Kasprzyk, T.; Stanek, A.; Sieroń-Stołtny, K.; Drzazga, Z. May thermal imaging be useful in cyclist endurance tests? J. Ther. Anal. Calorim. 2016, 123, 1973–1979. [Google Scholar] [CrossRef] [Green Version]
  29. Gómez-Carmona, P.M.; Noya-Salces, J.; Núñez, J.; Fernández-Rodríguez, I.; Sillero-Quintana, M. Validation of infrared thermography as injury prevention method in professional soccer players. In Proceedings of the 14th Annual Congress of the European College of Sport Sciences, Oslo, Norway, 24–27 June 2009. [Google Scholar]
  30. Arnaiz-Lastras, J.; Fernández-Cuevas, I.; Gómez-Carmona, P.M.; Sillero-Quintana, M.; García, M.Á.; Piñonosa, C.S. Pilot study to determinate thermal asymmetries in judokas. In Proceedings of the 16th Annual Congress of the European College of Sport Sciences, Liverpool, UK, 6–9 July 2011. [Google Scholar]
  31. British Researcher Investigates the Science of Fencing. Available online: https://www.fencing.net/17086/british-researcher-investigates-the-science-of-fencing/ (accessed on 15 February 2020).
  32. Hot Fencer in Uniform! Available online: https://www.leonpaul.com/blog/hot-fencer-in-uniform/ (accessed on 19 February 2020).
  33. Havenith, G. Human surface to mass ratio and body core temperature in exercise heat stress—A concept revisited. J. Ther. Biol. 2001, 26, 387–393. [Google Scholar] [CrossRef]
  34. BSI. Protective Clothing—Hand, Arm, Chest, Abdomen, Leg, Genital and Face Protectors for Fencers—Requirements and Test Methods: BS EN 13567; BSI: London, UK, 2002. [Google Scholar]
  35. PCE–Infrared Thermography Mod. PCE-TC30. Available online: http://www.pce-italia.it/html/data-sheet/Datasheet-PCE-TC_30.pdf (accessed on 5 March 2020).
  36. PCE–Humidity Meter for Temperature and Humidity. Available online: https://www.industrial-needs.com/technical-data/humidity-detector-PCE-HT-110.htm (accessed on 5 March 2020).
  37. Priego Quesada, J.I.; Lucas-Cuevas, A.G.; Palmer, R.S.; Perez-Soriano, P.; De Anda, R.M.C.O. Definition of the thermographic regions of interest in cycling by using a factor analysis. Infrared Phys. Technol. 2016, 75, 180–186. [Google Scholar] [CrossRef]
  38. Ammer, K. The Glamorgan Protocol for recording and evaluation of thermal images of the human body. Ther. Int. 2008, 18, 125–129. [Google Scholar]
  39. Borg, G. Borg’s Perceived Exertion and Pain Scales; Human Kinetics: Champaign, IL, USA, 1998; pp. 29–38. [Google Scholar]
  40. Milia, R.; Roberto, S.; Pinna, M.; Palazzolo, G.; Sanna, I.; Omeri, M.; Piredda, S.; Migliaccio, G.; Concu, A.; Crisafulli, A. Physiological responses and energy expenditure during competitive fencing. Appl. Physiol. Nutr. Metab. 2013, 39, 234–328. [Google Scholar] [CrossRef] [PubMed]
  41. Turner, A.N. Physical Preparation for Fencing: Tailoring Exercise Prescription and Training Load to the Physiological and Biomechanical Demands of Competition. Ph.D. Thesis, Middlesex University, London, UK, 2015. [Google Scholar]
  42. Chen, T.L.; Wong, D.W.; Wang, Y.; Ren, S.; Yan, F.; Zhang, M. Biomechanics of fencing sport: A scoping review. PLoS ONE 2017, 12, e0171578. [Google Scholar] [CrossRef] [PubMed]
Figure 1. Definition of the regions of interest (ROIs; front and back side) used to calculate the mean temperature on the body for foil fencers (a) and epee fencers (b). Definition of the ROIs for the single body parts (c). Note that, to evaluate the temperatures, only the parts covered by the fencing uniform were considered. Since foil fencers wear an additional electric jacket over the uniform, the trunk was not considered in the definition of the ROIs for these athletes. Athletes were asked to remove the protective glove before acquiring the thermal image.
Applsci 10 03296 g001
Figure 2. Temperature variations on the fencing uniform sorted per competition level. In black it is reported ΔT12, while in white ΔT23. It can be noticed that temperature variations for veteran athletes are generally lower than for the others (especially ID 4). National athletes were presenting high ΔT, with the tendency to reduce and then increase their temperature. The only exception is ID 6, who presented the opposite trend. International athletes were presenting a constant increase of temperature.
Applsci 10 03296 g002
Figure 3. Temperature difference ΔT12 on the front and the back part of the body for foil (a) and epee (b) fencers. In black veteran fencers (ID 4 for foil, ID 7 for epee), in grey national fencers (ID 3 for foil, ID 5 for epee) and in white international fencers (ID 1 for foil, ID 8 for epee).
Applsci 10 03296 g003
Figure 4. Temperature difference ΔT23 on the front and the back part of the body for foil (a) and epee (b) fencers. In black veteran fencers (ID 4 for foil, ID 7 for epee), in grey national fencers (ID 3 for foil, ID 5 for epee) and in white international fencers (ID 1 for foil, ID 8 for epee).
Applsci 10 03296 g004
Figure 5. Infrared image of fencers before and during training (image not in scale). From this temperature map, it can be noticed that the dominant part of the body presents an overheating when compared to the non-dominant part.
Applsci 10 03296 g005
Table 1. Characteristics, weapon performed, and competition level of the eight fencers selected.
IDSexAge
(years)
Height
(m)
Weight
(kg)
BSA
(m2)
BMI
(kg/m2)
WeaponCompetition Level
1F291.72611.7220.62FoilInternational
2M171.74721.8623.78FoilInternational
3M221.83802.0223.89FoilNational
4M491.70861.9729.76FoilVeteran
5F211.67581.6520.80EpeeNational
6F241.74681.8222.46EpeeNational
7M241.79822.0125.59EpeeVeteran
8M251.80781.9724.07EpeeInternational
Table 2. Technical specifications of the infrared thermal camera PCE TC-30. Data provided by [35].
Technical Specifications PCE TC-30 Thermal Camera
Resolution of the sensor80 pixels × 80 pixels
Measurement range0–250 °C
DisplayLCD (320 pixels × 240 pixels)
Thermal sensibility80 mk
Frequency50 Hz
Operative Temperature0–50°C
Table 3. Activities carried out by eight fencers during the training. The resting time during the training is considered as the total amount of rest between different assaults.
Before the training
(10 min after entering)
Standing in the fencing hall, 10 minutes
During the training
(after 1 h of fencing)
ID 15 assaults, 55 min—Standing (rest), 5 min
ID 25 assaults, 50 min—Standing (rest), 10 min
ID 34 assaults, 50 min—Standing (rest), 10 min
ID 44 assaults, 45 min—Standing (rest), 15 min
ID 54 assaults, 40 min—Standing (rest), 20 min
ID 64 assaults, 50 min—Standing (rest), 10 min
ID 74 assaults, 45 min—Standing (rest), 15 min
ID 84 assaults, 55 min—Standing (rest), 5 min
After the training
(10 min after the training)
Sitting in the fencing hall, 10 minutes
Table 4. Heart rate of all the eight athletes measured before, during and after the training.
IDHeart Rate (bpm)
Before the TrainingDuring the TrainingAfter the Training
16316172
25913868
35412070
48214991
57313497
67012578
779195102
85716662
Table 5. Rate of perceived exertion (RPE) scale measured for all the athletes before, during and after the training (before the thermal images were acquired).
IDRPE Scale Measured
Before the Training
(10 min after Entering)
During the Training
(after 1 h of Fencing Assaults)
After the Training
(10 min after the Training)
17197
27187
37168
48178
57188
67177
78168
87167
Table 6. Comparison between the right and the left part and between the dominant and non-dominant side of foil and epee fencers (DP: Dominant part; NDP: Non-Dominant Part, T: Trunk).
FOIL FENCERS
Veteran ID 4National ID 3International ID 1
ΔT12R-ΔT12LΔT23R-ΔT23LΔT12R-ΔT12LΔT23R-ΔT23LΔT12R-ΔT12LΔT23R-ΔT23L
Arm2.3−1.6−0.91.12.2−0.9
Forearm0.71.41.40.20.9−0.8
Hand1.6−1.61.01.10.40.3
Thigh0.5−0.11.10.10.20.2
Shin0.90.20.3−0.5−1.1−0.6
ΔT12ΔT23ΔT12ΔT23ΔT12ΔT23
DP−0.56.0−10.39.53.57.8
NDP−1.16.1−11.09.03.68.1
T2.25.4−12.49.74.89.0
EPEE FENCERS
BODY PARTVeteranID 4NationalID 3InternationalID 1
ΔT12R-ΔT12LΔT23R-ΔT23LΔT12R-ΔT12LΔT23R-ΔT23LΔT12R-ΔT12LΔT23R-ΔT23L
Arm0.40.3−1.02.2−0.51.5
Forearm0.00.4−2.92.80.51.5
Hand−1.21.81.00.00.90.3
Thigh0.30.0−0.50.50.00.5
Shin−3.02.40.0−0.50.01.5
ΔT12ΔT23ΔT12ΔT23ΔT12ΔT23
DP−3.29.5−12.64.815.14.8
NDP−3.710.3−13.36.114.93.9
T−2.311.5−14.34.815.73.3

