Article

Application of the Improved Knothe Time Function Model in the Prediction of Ground Mining Subsidence: A Case Study from Heze City, Shandong Province, China

1
School of Civil Engineering and Architecture, Anhui University of Science and Technology, Huainan 232001, China
2
School of Resources and Environmental Engineering, Anhui University, Hefei 230022, China
*
Author to whom correspondence should be addressed.
Appl. Sci. 2020, 10(9), 3147; https://doi.org/10.3390/app10093147
Submission received: 1 April 2020 / Revised: 29 April 2020 / Accepted: 29 April 2020 / Published: 30 April 2020
(This article belongs to the Special Issue Land Subsidence: Monitoring, Prediction and Modeling)

Abstract

:
Taking into account the inadequacy of the Knothe time function model to predict the dynamic surface subsidence caused by underground mining, a new hypothesis is proposed, and the improved Knothe time function model is established. Theoretical analysis shows the improved model agrees well with surface subsidence dynamic change, velocity change, and acceleration change rules. Combined with field measured data, the probability integral method, dual-medium method, and least square method are adopted to determine the time influence parameter C and the model order n. Based on monitoring data from four monitoring stations in the Guotun coal mine subsidence basin strike main profile from Heze city, Shandong Province, China, the accuracies of the Knothe time function and improved model are compared and analyzed. Results show the improved model can accurately describe the dynamic surface subsidence process and subsidence velocity with mining time. The average relative standard error between the predicted and measured values is only 4.8%—far lower than the Knothe time function model is 23%, verifying the improved model’s accuracy and reliability.

1. Introduction

The surface subsidence and deformation caused by underground mining is a complex four-dimensional problem varying with a continuous time–space function [1,2]. With progressive mining of the working face, the surfaces’ subsidence undergoes three stages of subsidence, namely, slow deformation stage, rapid deformation stage, and basic stable stage. The slow deformation stage only accounts for 10%–15% of the final subsidence and causes minor ground deformation. The rapid deformation stage is the principal subsidence corresponding to about 75% of the final subsidence and causes major ground deformation. The basic stable stage may vary from 5% to 10% of the final subsidence [3]. The deformation that occurs in each of these stages leads to various forms of damage, such as that to buildings, water facilities, and roads. Geological disasters resulting from ground subsidence cause huge economic losses in China every year. Researching the ground subsidence characteristics caused by underground mining and accurately predicting the deformation caused by ground subsidence is one of the most important aspects of protecting buildings and structures above the gob [4,5,6,7].
Surface subsidence is a widespread problem frequently caused by underground mining. In the past several decades, a number of studies have focused on using the geometric theory prediction method, profile function prediction method, mechanical model prediction method, interferometric synthetic aperture radar (InSAR) method, GPS (Global Positioning System) method, and numerical simulation prediction method to estimate the ground subsidence and deformation caused by underground coal mining. Kwinta et al. [8] proposed a one-parameter Knothe’s function model based on a growth law and a two-parameter Sroka-Schober’s function based on double use of the growth law considering the convergence of extracted excavations and delaying activity of overlain rock. Sheorey et al. [9] proposed a new functional influence method and additional modeling subsidence asymmetry functions for the extraction of edge effects, with the method’s accuracy examined by four cases. Lian et al. [10] extended an existing classical dynamic subsidence prediction model, proposing new potential research avenues offered by cellular automata (CA) models. The model verified the deformation measurements collected above a coalmine panel in the Huainan mining area in Anhui Province, China. Tugrul et al. [11] proposed a new subsidence prediction approach using FEM (Finite Element Models) and satellite measurements and gave two case studies as examples for the application of the proposed approach. Hu et al. [12] established a model for calculating the Knothe time function parameters based on a full subsidence angle, verifying the proposed model’s reliability and applicability by comparing the predicted and measured values. Chen et al. [13] proposed using intensity tracking technique and the small baseline subset (SBAS) interferometry technique to obtain complete monitoring results. The comparison between experiment monitoring results and GPS measurements showed that the proposed method has the capability to detect and measure the large gradient deformation. Yang et al. [14] proposed a method for completely retrieving three-dimensional (3-D) mining-induced displacements with OT (Offset Tracking)-derived observations of LOS (Line-of-Sight) deformation from a single amplitude pair of SAR (Single Amplitude Pair), and this method had been successfully used in the Daliuta coal mining area. Janez Rošer et al. [15] analyzed surface subsidence above the Velenje Coal Mine’s underground mining sites using a modified sigmoid function (logistic function surrogate) and considered the time estimation of the next and final epoch measurement. Luo et al. [16] proposed a range split spectrum interferometry assisted phase unwrapping (R-SSIaPU) method to monitor large gradient mining-induced surface movements, this method agreed with GPS with differences of approximately 4.2 cm in the Tangjiahui mine.
Due to numerous parameters, an extremely complex velocity and acceleration prediction function, and an unreasonable parameter calculation methodology, most of the prediction models are not only different from the actual values but also not conducive to field application. Hence, a dynamic surface subsidence prediction model with high accuracy and few parameters is necessary. In this paper, a new model, based on the Knothe time function model, to predict the dynamic surface subsidence is proposed, and a simple, feasible parameter determination method is provided. Finally, the model accuracy is verified by comparing to the 1301 working face monitoring data in the Guotun coal mine in Shandong Province, China.

2. The Knothe Time Function Model

In 1952, Knothe used mathematical methods to describe the complex time–space process of surface subsidence caused by underground mining and made the following assumptions: The surface subsidence rate d W ( t ) d t is proportional to the difference between the final surface subsidence W 0   and the dynamic subsidence W ( t ) at time t, which may be expressed as [17,18,19]:
d W ( t ) d t = c [ W 0 W ( t ) ]
where c is a time influence parameter related to the overburdened rock mass physical and mechanical properties. This parameter is expressed in the unit 1/year.
By separating variables and combining with boundary conditions t = 0 ,   W ( t ) = 0 , the relationship between subsidence and time is obtained as follows:
W ( t ) = W 0 [ 1 exp ( c t ) ]
The Knothe time function model is widely used to predict the actual surface subsidence process due to its simple form and few undetermined parameters. However, with expanding research and practice, this model does not accurately describe the dynamic processes of the subsidence [19,20].
The first and second derivatives of Equation (2) are used to obtain the surface subsidence velocity and acceleration as follows:
{ V ( t ) = c W 0 exp ( c t ) a ( t ) = c 2 W 0 exp ( c t )
Using Equations (2) and (3), the surface subsidence rule described by the Knothe time function model is shown in Figure 1a. The figure shows that when t = 0 , the surface subsidence velocity is at the maximum value c W 0 . With the passage of time, the velocity gradually decreases and finally approaches 0. That is to say, the surface subsidence gradually increases from 0, but the increasing range is shortened. The surface subsidence acceleration curve shows that from the beginning of surface subsidence to final stability, the whole subsidence process acceleration is always less than 0. In other words, surface subsidence velocity is always decreasing.
Numerous research and field monitoring data show that the surface subsidence curve caused by coal mining is approximately an “S”-type curve [21,22]. When the distance between set-up entry and the working face reaches the surface starting distance, the surface starts sinking. The subsidence velocity is 0 at that point. Then, the subsidence slowly increases, but subsidence velocity rapidly increases. As the working face continuously advances, the surface subsidence increases significantly, and the subsidence velocity gradually increases to the maximum value. When the working face has advanced a sufficient distance away from the entry set-up, the surface subsidence shape curve remains basically unchanged, and the subsidence continues to increase, but the velocity increase is very slow and eventually tends toward 0. Figure 1b shows the actual measured subsidence, subsidence velocity, and subsidence acceleration curve at the z7 monitoring point on the 35,101 working face in the Sandaogou mine [23] in Shanxi Province, China. Comparing Figure 1a,b, the Knothe time function model is clearly quite different from the actual situation in describing surface subsidence, subsidence velocity, and subsidence acceleration. The Knothe time function model is suitable only for describing the basic stable stage and cannot accurately predict the whole dynamic surface subsidence process [24].

3. The Establishment of an Improved Knothe Time Function Model

By analyzing the Knothe time function hypothesis and Equation (3), Equation (4) can be obtained:
{ V ( t ) a ( t ) = 1 c a ( t ) a ( t ) = a ( t ) a ( t ) a ( n ) ( t ) a ( n 1 ) ( t ) 1 c
Equation (4) shows that the surface subsidence velocity to acceleration ratio and the (n-1) acceleration derivative time to n-th derivative ratio described by the Knothe time function model are time-independent, and are all constant values 1 c at any time. This is obviously inconsistent with the actual dynamic surface subsidence velocity and acceleration relationship, leading to a significant difference between the predicted surface subsidence and the field monitoring values. The Knothe time function model premise assumption is special, not general, so an improved Knothe time function model is required and a new assumption is made: the n-th surface subsidence derivative d n W ( t ) d n t is proportional to the n-th power of the difference between the final surface subsidence W 0 and the dynamic subsidence W ( t ) at time t, a general differential Equation (5) can be obtained:
d n W ( t ) d n t = C [ W 0 W ( t ) ] n
where C is a time influence parameter of the improved Knothe time function model, with this parameter expressed in the unit 1/(yearn).
The solution of Equation (5) is as follows:
W 0 W ( t ) = A exp ( C 1 n t n )
where A is the integral constant.
Considering the initial condition t = 0 , W   ( t ) = 0 , the integral constant A = W 0 , then Equation (6) can be simplified as:
W ( t ) = W 0 [ 1 exp ( C 1 n t n ) ]
Equation (7) shows that the dynamic surface subsidence function W ( t ) has a power-law relationship with time. When 0 t < , W ( t ) ( 0 , W 0 ) , the surface dynamic subsidence velocity can be derived from Equation (7):
V ( t ) = W 0 C t n 1 exp ( C 1 n t n )
The dynamic subsidence acceleration obtained from the Equation (8) derivative is as follows:
a ( t ) = W 0 C exp ( C 1 n t n ) [ ( n 1 ) t n 2 C t 2 n 2 ]
When n = 1, upon comparing Equations (2) and (3), and Equations (7)–(9), we can find that the Knothe time function model is actually a special case of the improved Knothe time function model.
If a ( t ) = 0 , Equation (9) can be converted into:
{ t 1 = 0 t 2 = ( n 1 C ) 1 n t 3 =
According to Equations (8)–(10), in the interval [ 0 , ( n 1 C ) 1 n ] , the dynamic subsidence acceleration a ( t ) is always greater than 0, the dynamic surface subsidence velocity gradually increases, and the dynamic surface subsidence gradually increases from 0. In the interval [ ( n 1 C ) 1 n , ] , the surface dynamic subsidence acceleration a ( t ) is always less than 0, the surface dynamic subsidence velocity V ( t ) gradually decreases and finally approaches 0, and the dynamic surface subsidence increase gradually slows and finally approaches W 0 . According to the function extreme value principle, when t = ( n 1 C ) 1 n , the maximum dynamic subsidence velocity value V ( t ) m a x is shown in Equation (11):
V ( t ) 0 ( x , y ) ( n 1 C ) n 1 n exp ( n 1 n ) m a x
The corresponding surface subsidence is shown in Equation (12):
W ( t ) = W 0 [ 1 exp ( n 1 n ) ]
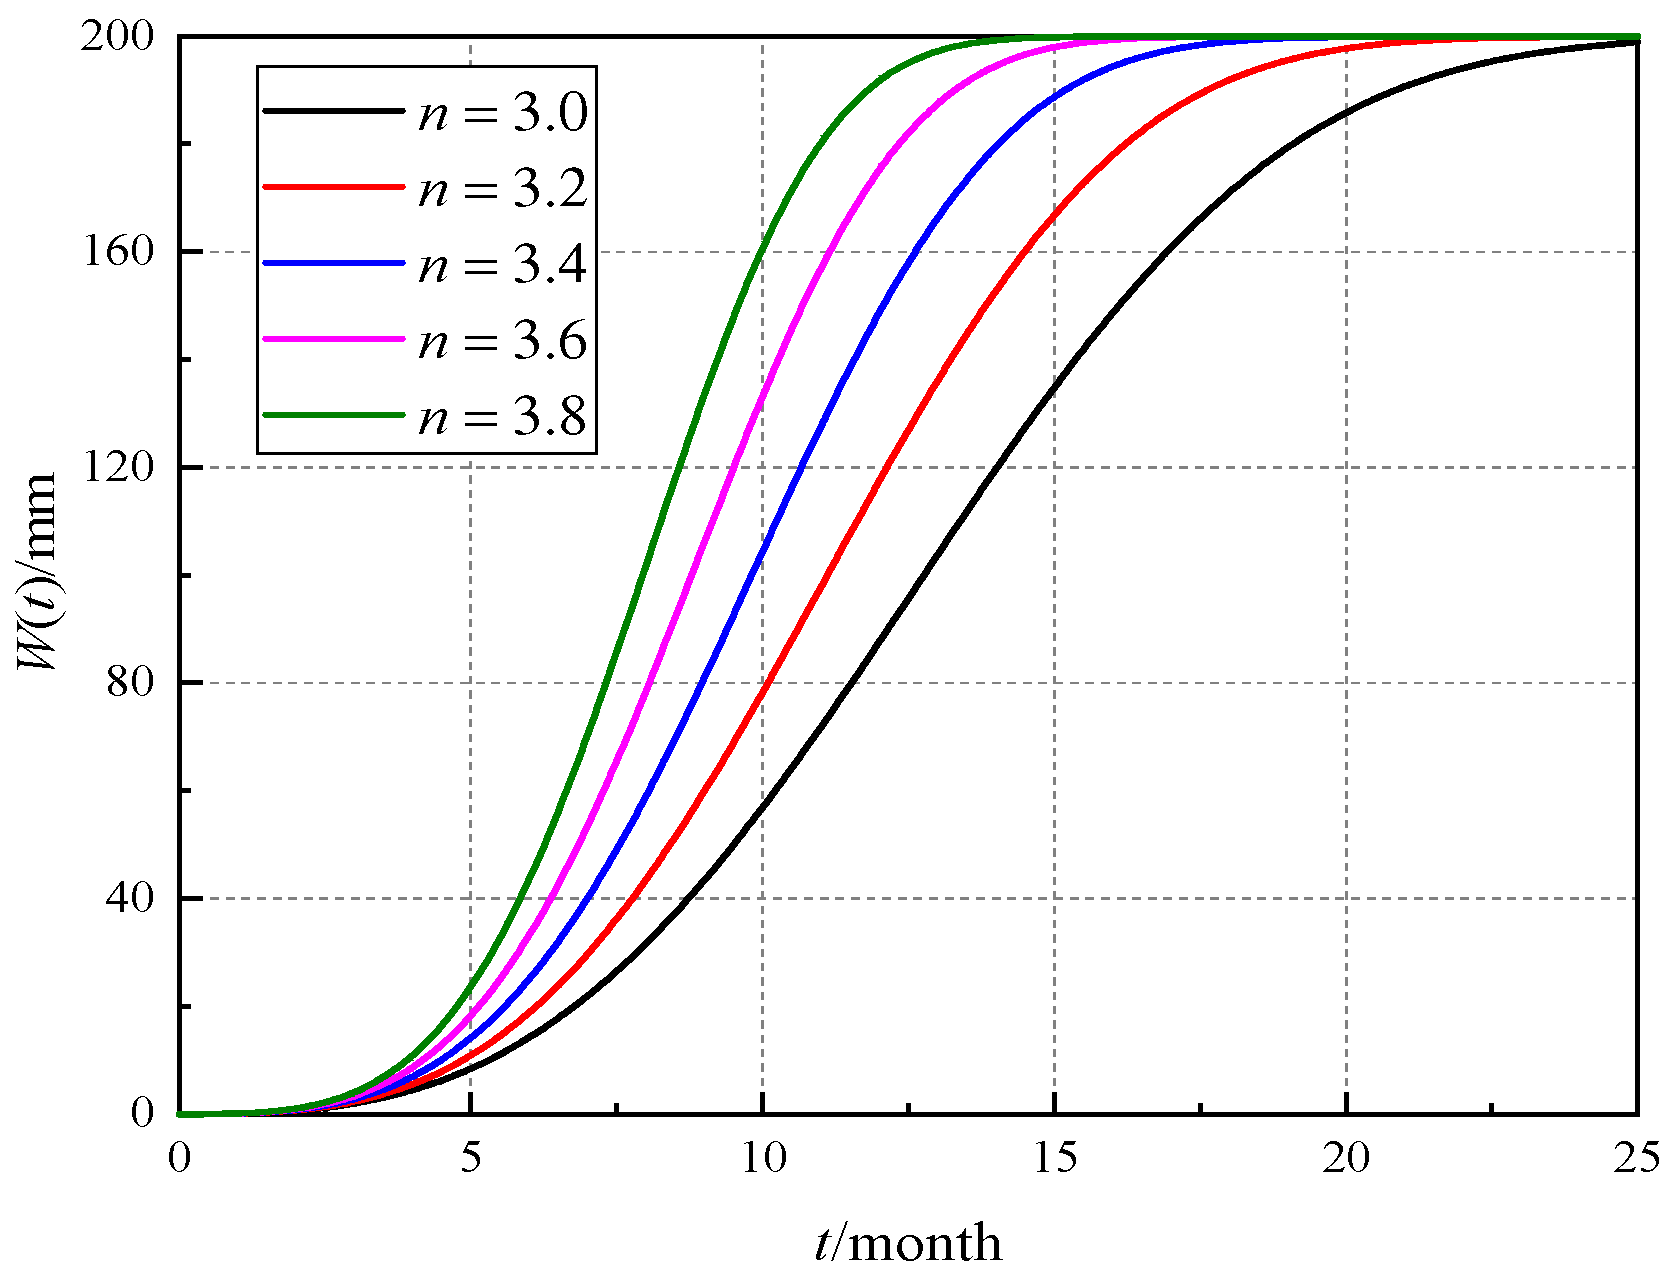
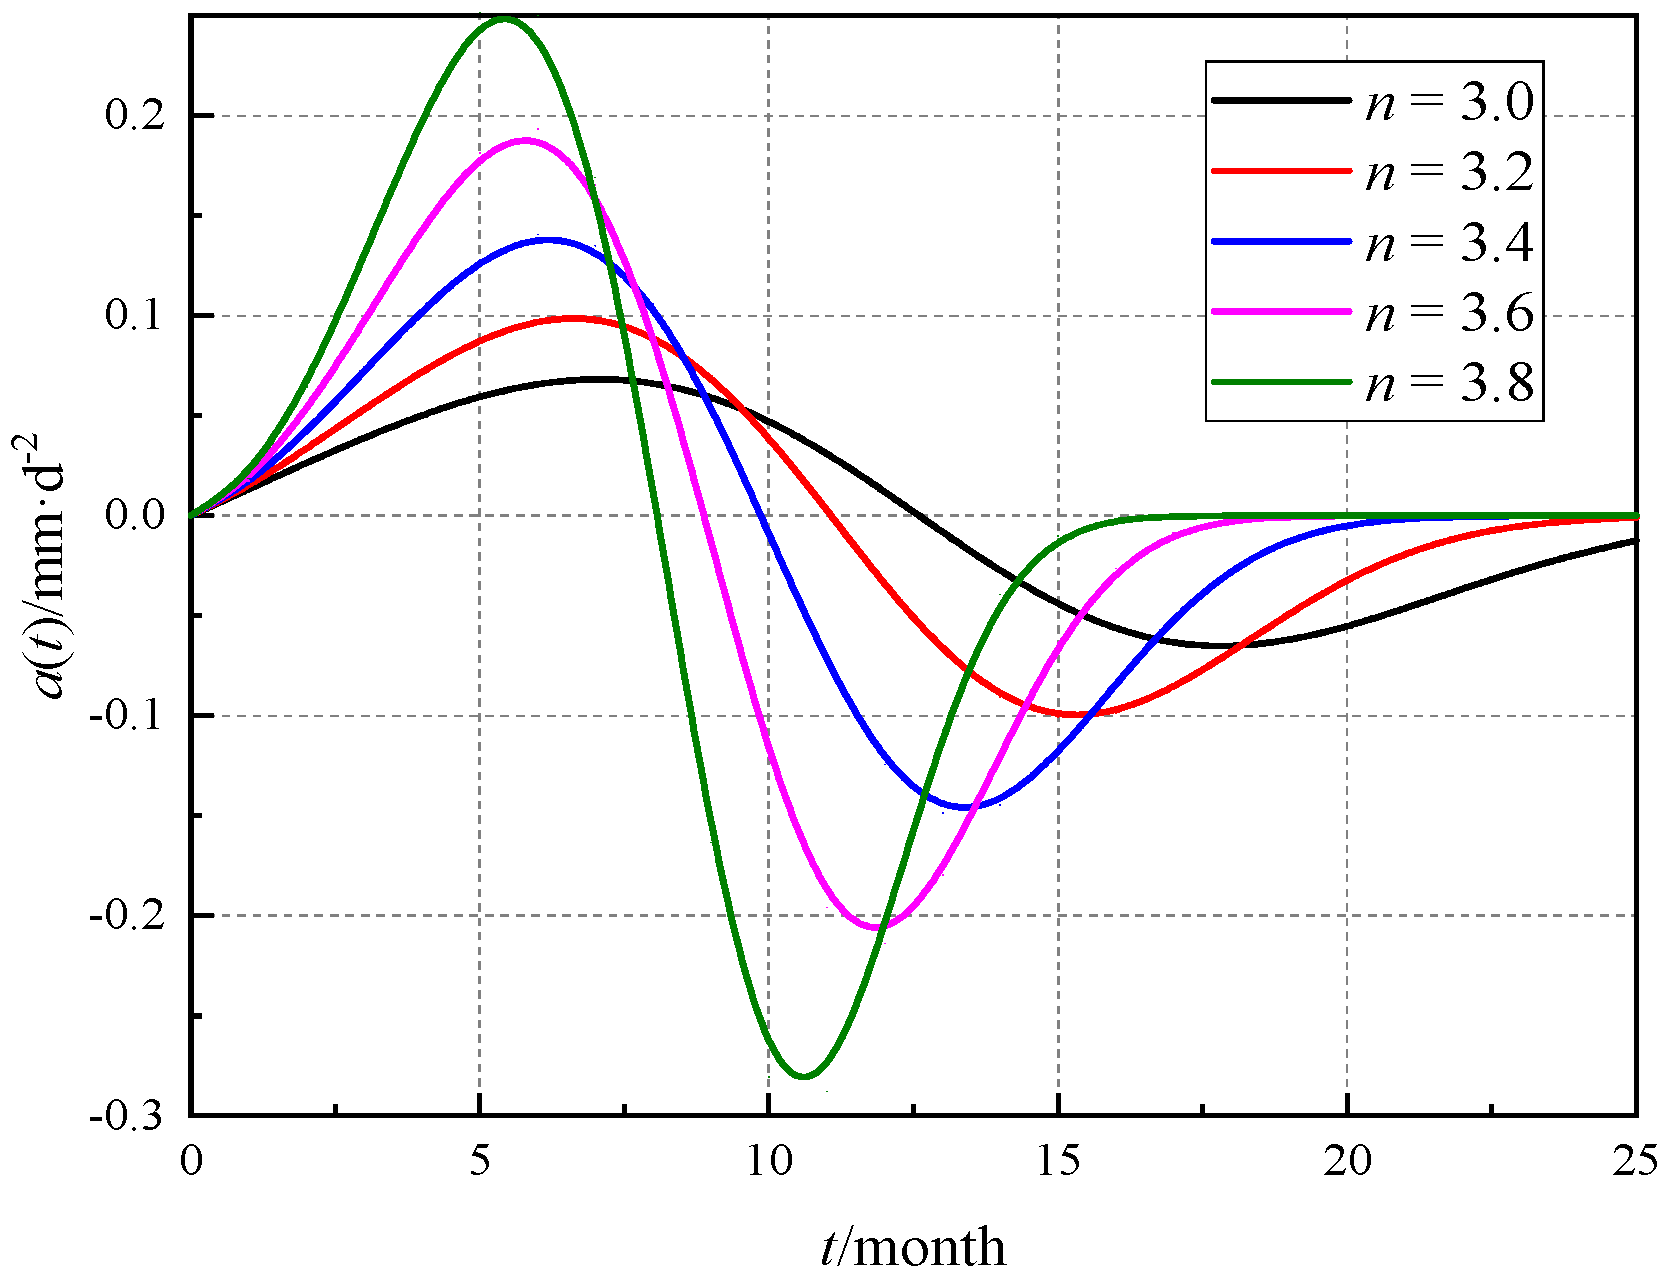
The surface subsidence curves of different models order n, represented by the improved Knothe time function model, the subsidence velocity curve, and the subsidence acceleration curve are shown in Figure 2, Figure 3 and Figure 4, respectively. Figure 2, Figure 3 and Figure 4 demonstrate that the improved Knothe time function model is consistent with the actual surface subsidence, and can be used to describe the dynamic surface subsidence process.
Figure 2, Figure 3 and Figure 4 show that the surface subsidence initial value is not affected by the model order n, while the time when the surface subsidence reaches the final value is affected by the model order n. The greater n is, the less time it takes the surface to reach the final subsidence value. As the value of n increases, the maximum subsidence velocity increases, the time of peak and valley acceleration will be shortened, with the absolute peak value and valley acceleration also increasing.

4. Determination of Model Parameters

When we use the improved Knothe time function to predict progressive subsidence, the key process is to determine the model parameters, which are closely related to the mechanical characteristics of the overburden strata, the coal mining speed, and the roof management method [25,26,27].

4.1. Determination of Model Order n

Chang and Wang [28] showed that when the surface point subsidence velocity reaches the maximum value, the surface subsidence is about half the final subsidence value. According to Equation (12), we obtain the following formula:
W 0 2 = W 0 [ 1 exp ( n 1 n ) ]
The model order n = 3.26 .

4.2. Determination of Time Influence Parameter C

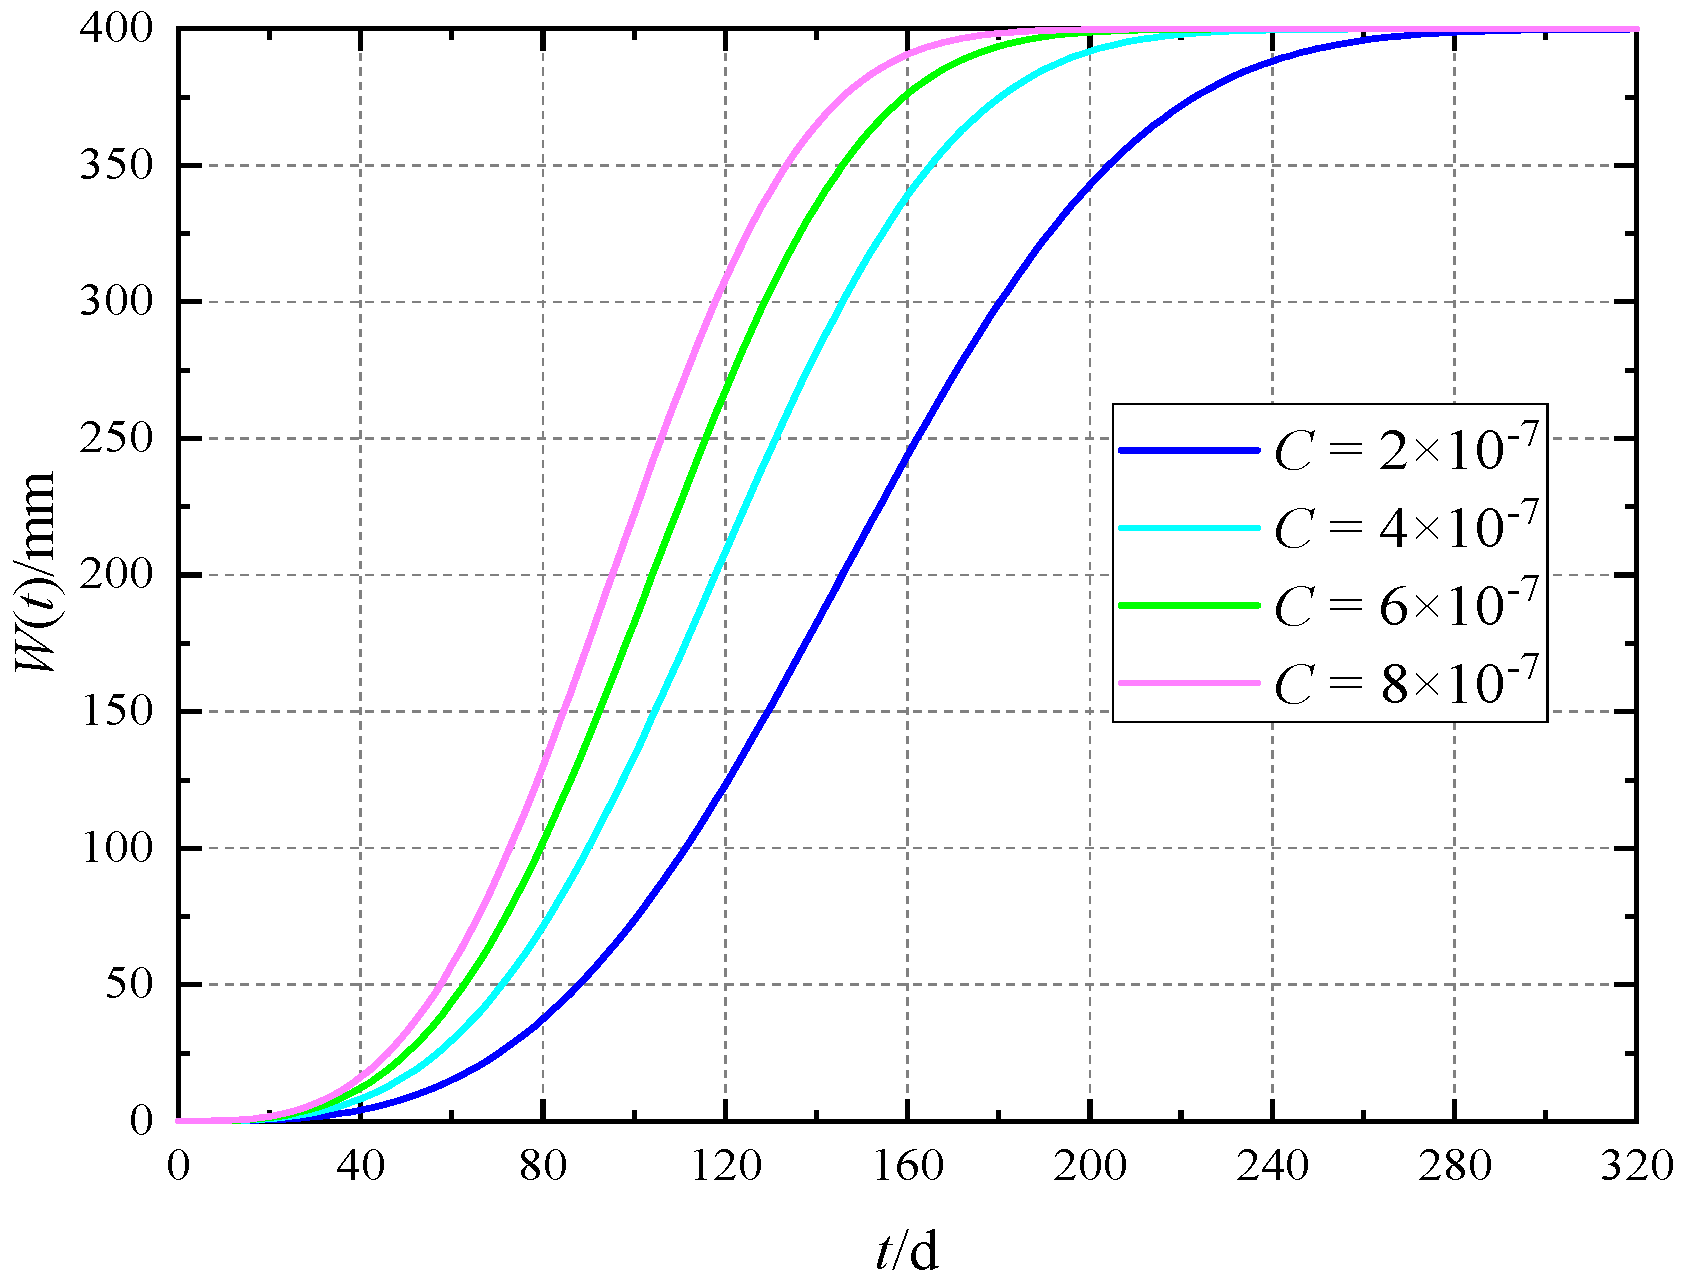
According to Equation (7), the surface subsidence curve with different time influence parameter C is shown in Figure 5.
Comparing Figure 2 and Figure 5, it can be seen that the impact of time influence parameter C on the surface subsidence curve is similar to the model order n, both of which have no effect on the initial and final surface subsidence values, but only affect the time to reach the final subsidence value. The larger C is, the less time it takes for the surface subsidence to reach a stable state. When the model n is determined, the key to the improved time function model accuracy is the determination of C.
According to the probability integral method, when the mining range reaches the critical value of full mining, the maximum subsidence is approximately equal to 0.98 W 0 [29,30]. If we assume that the mining velocity is v and the critical gob dimension is L f , the critical time to achieve full mining can be expressed as L f v . According to Equation (7), the time influence parameter C calculation formula is as follows:
0.98 W 0 = W 0 [ 1 exp ( C 1 n ( L f v ) n ) ]
Because the mining velocity is easily determined, the key to finding time influence parameter C is to determine the critical gob dimension when full mining is realized. Presently, three methods are used to calculate the critical gob dimension [31]:
(1)
Bedrock decision method: Determines final surface subsidence based only on the bedrock with no loose layer consideration. Obviously, the L f determined by this method is only suitable for a shallow loose layer, not applicable for mining areas with thick loose layers, such as those found in central and eastern China. This method’s calculation model is shown in Figure 6a and L f = 2 H j t a n φ j relating to the geometric relationship.
(2)
Comprehensive impact parameter method: Regards the loose layer and bedrock as a composite medium, so the bedrock and loose layers mining influence angle are equal. This method’s calculation model is seen in Figure 6b, with L f = 2 H 0 t a n φ relating to the geometric relationship. This method ignores the mechanical properties difference between the loose layer and the bedrock, so errors exist. Generally speaking, the loose layer mining influence angle is larger than that of the bedrock.
(3)
Dual-medium method: The coal mining influence on the bedrock and loose layer deformation is considered comprehensively. The critical gob dimension obtained is close to the actual value. The calculation model is shown in Figure 6c. According to the geometric relationship, L f is determined as follows:
L f = 2 H s tan φ s + 2 H j tan φ j
where H 0 is the average seam depth, φ is the full subsidence angle, H j is the bedrock thickness, φ j is the bedrock full subsidence angle, H s is the loose layer thickness, and φ s is the loose layer full subsidence angle.
Substituting Equation (15) into Equation (14), the calculation formula of C is as follows:
C = n v n ln 0.02 ( 2 H s tan φ s + 2 H j tan φ j ) n
A significant amount of monitoring data shows that it is not precise and that the corresponding surface subsidence is just half of W 0 when the subsidence velocity reaches the maximum value. Therefore, there is an error in the value of model order n. The time influence parameter C obtained according to Equation (16) will also produce a certain error. However, in the absence of significant field surface subsidence monitoring data, the above parameter determination method can be used as a reference.
When there is sufficient field monitoring data, the least square method can be used to determine parameters n and C; the multiple group subsidence data is selected from the monitoring points, Equation (7) is used to fit the subsidence data, multiple groups of n and C are obtained, and then the average value is taken as the final parameter. This method is easy to operate and has high accuracy in obtaining parameters.

5. Model Validation

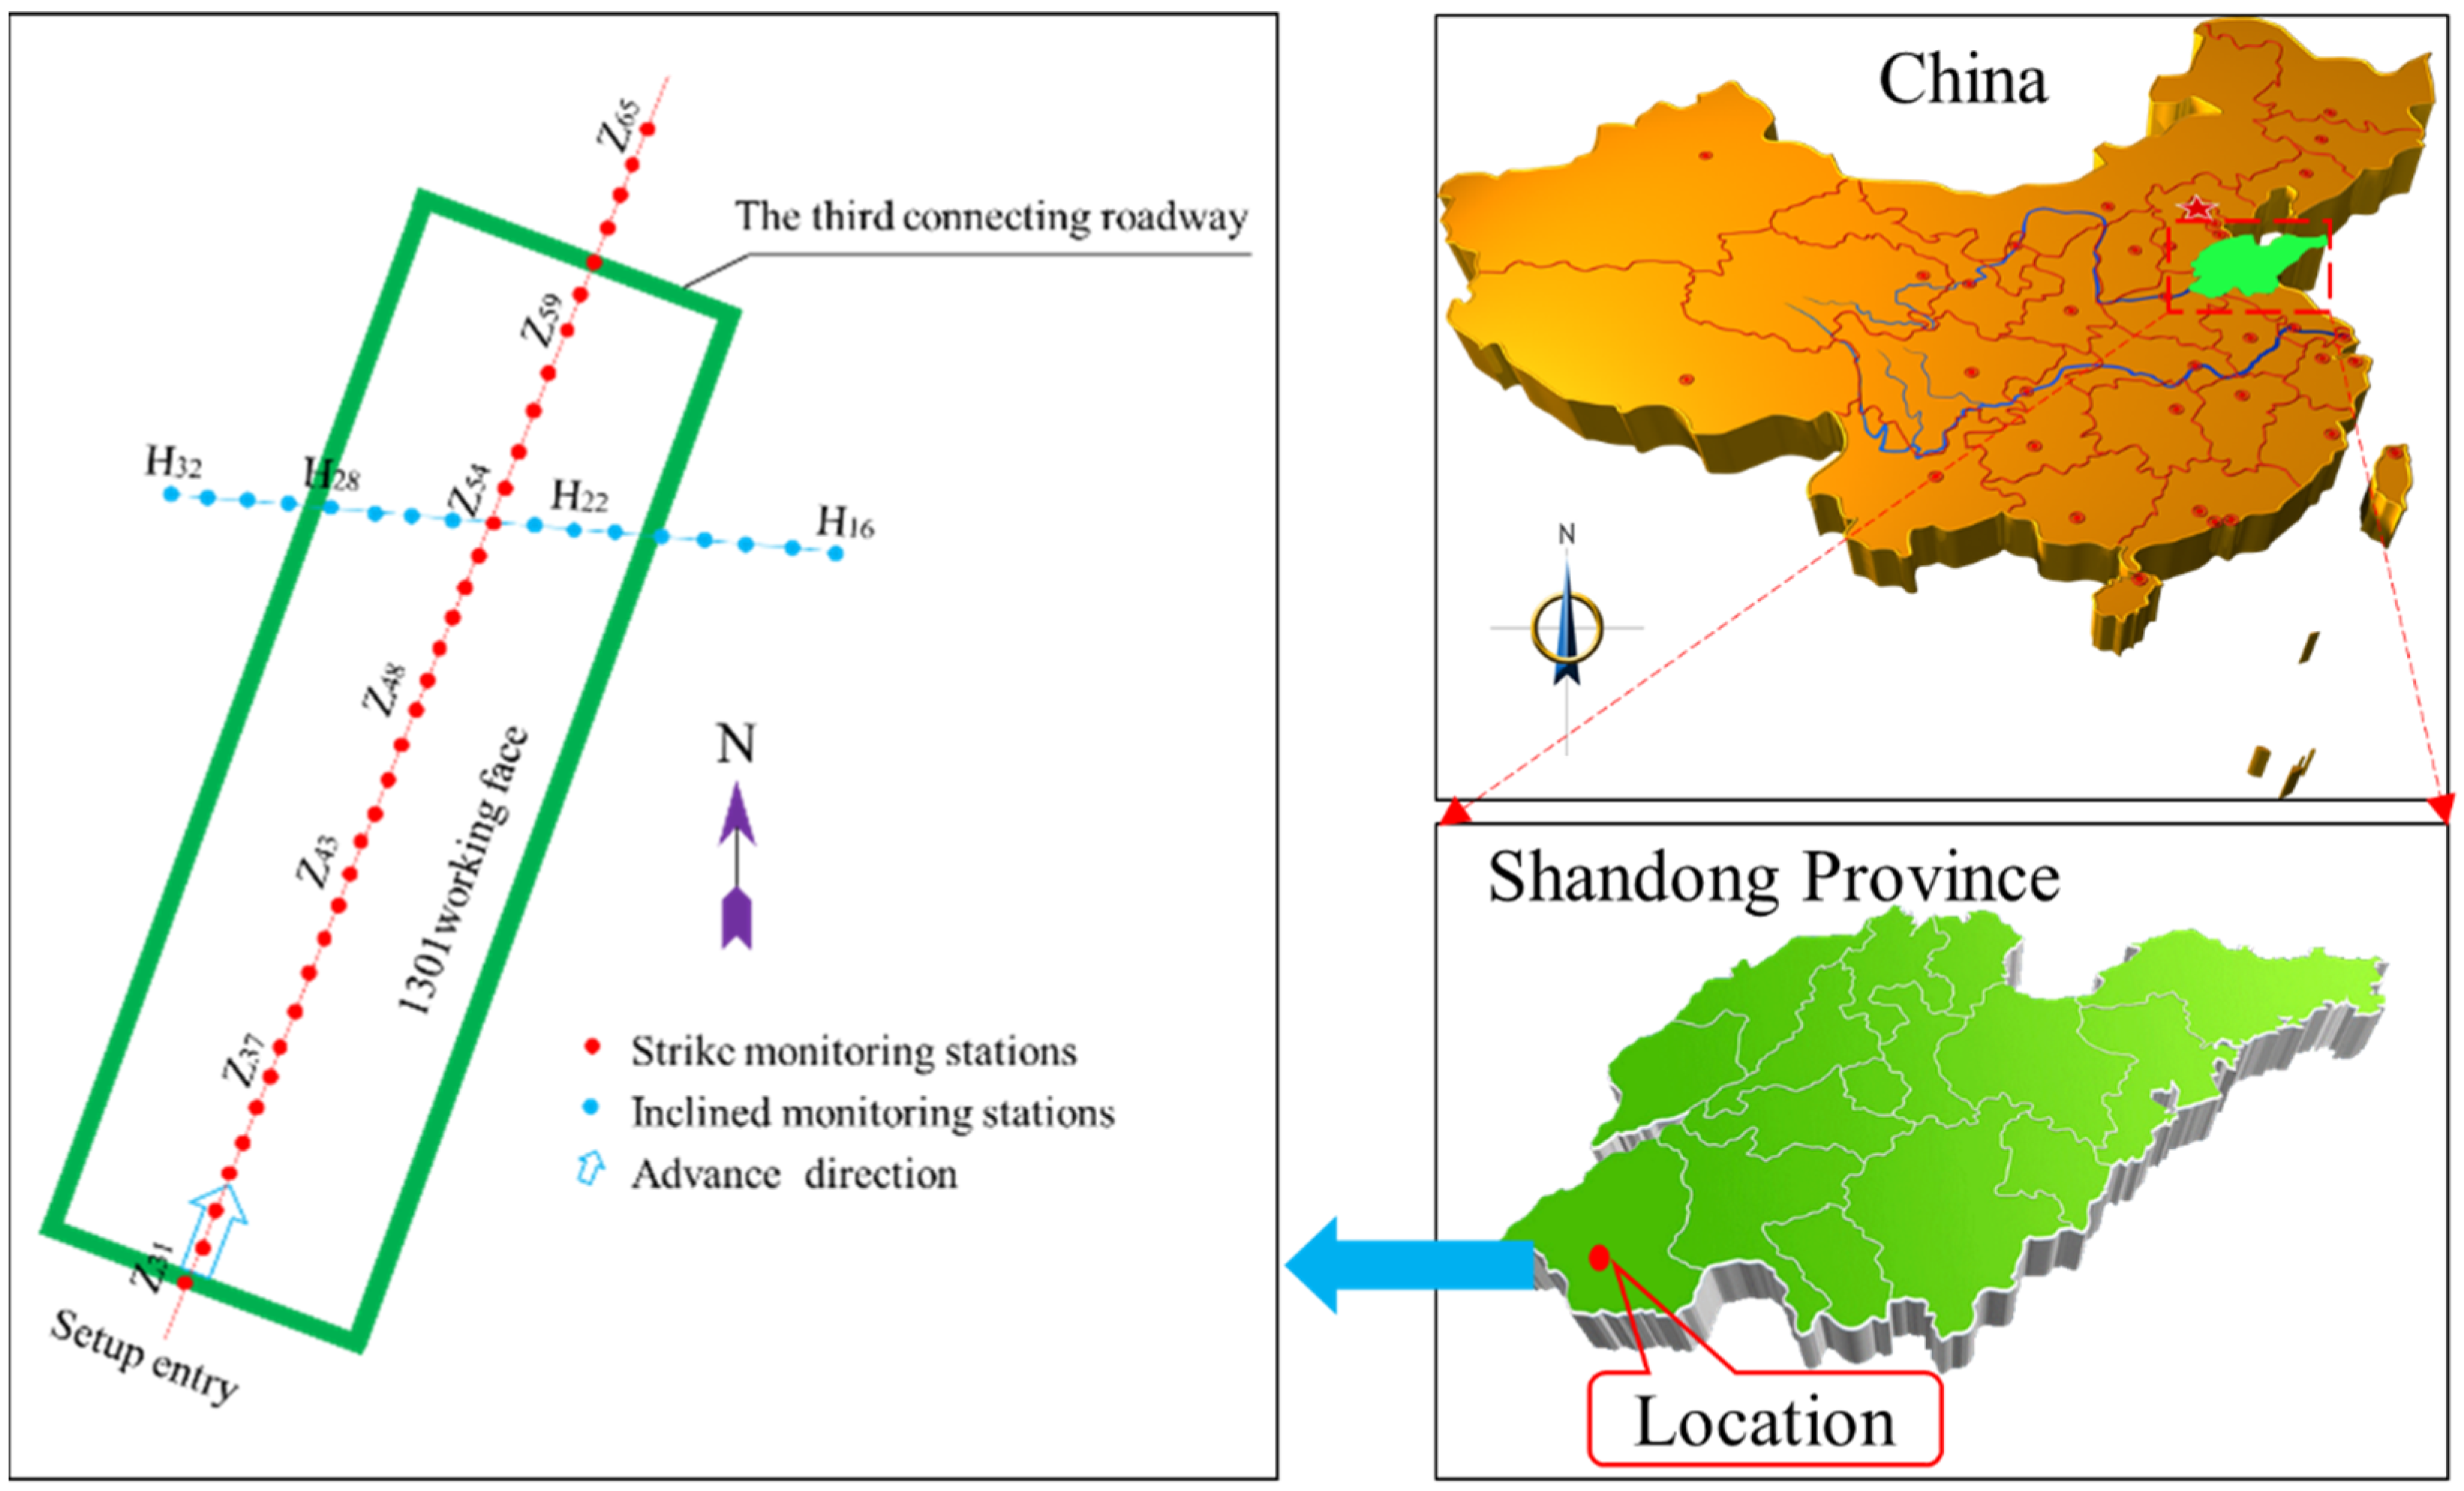
To verify the improved Knothe time function model accuracy and reliability established in this paper, based on the surface movement observation station field monitoring data above the 1301 working face in Guotun coal mine from Heze city, Shandong Province, China, the monitoring data and the model predicted results were compared and analyzed. The surface movement observation stations’ layout is shown in Figure 7, and the spacing between each observation station is 30 m. Due to a long observation time span and a large amount of monitoring data, clearer monitoring and prediction data comparison and analysis were achieved by randomly selecting only four stations, z38, z41, z44, and z47, as the research study objects for improved and traditional Knothe time function model accuracy analysis in surface subsidence prediction.
The working face 1301 elevation is from −748.9 to −817 m; the coal seam thickness is 1 to 3.6 m, with the average being 2.9 m, and the coal seam dip angle is 12°; the roof is managed by full caving methodology. Due to mining area limitations, the observation point along the strike direction sinks to a flat bottom, with no flat bottom phenomenon along the inclined surface, that is to say, the working face strike is full mining, and the working face incline is not.
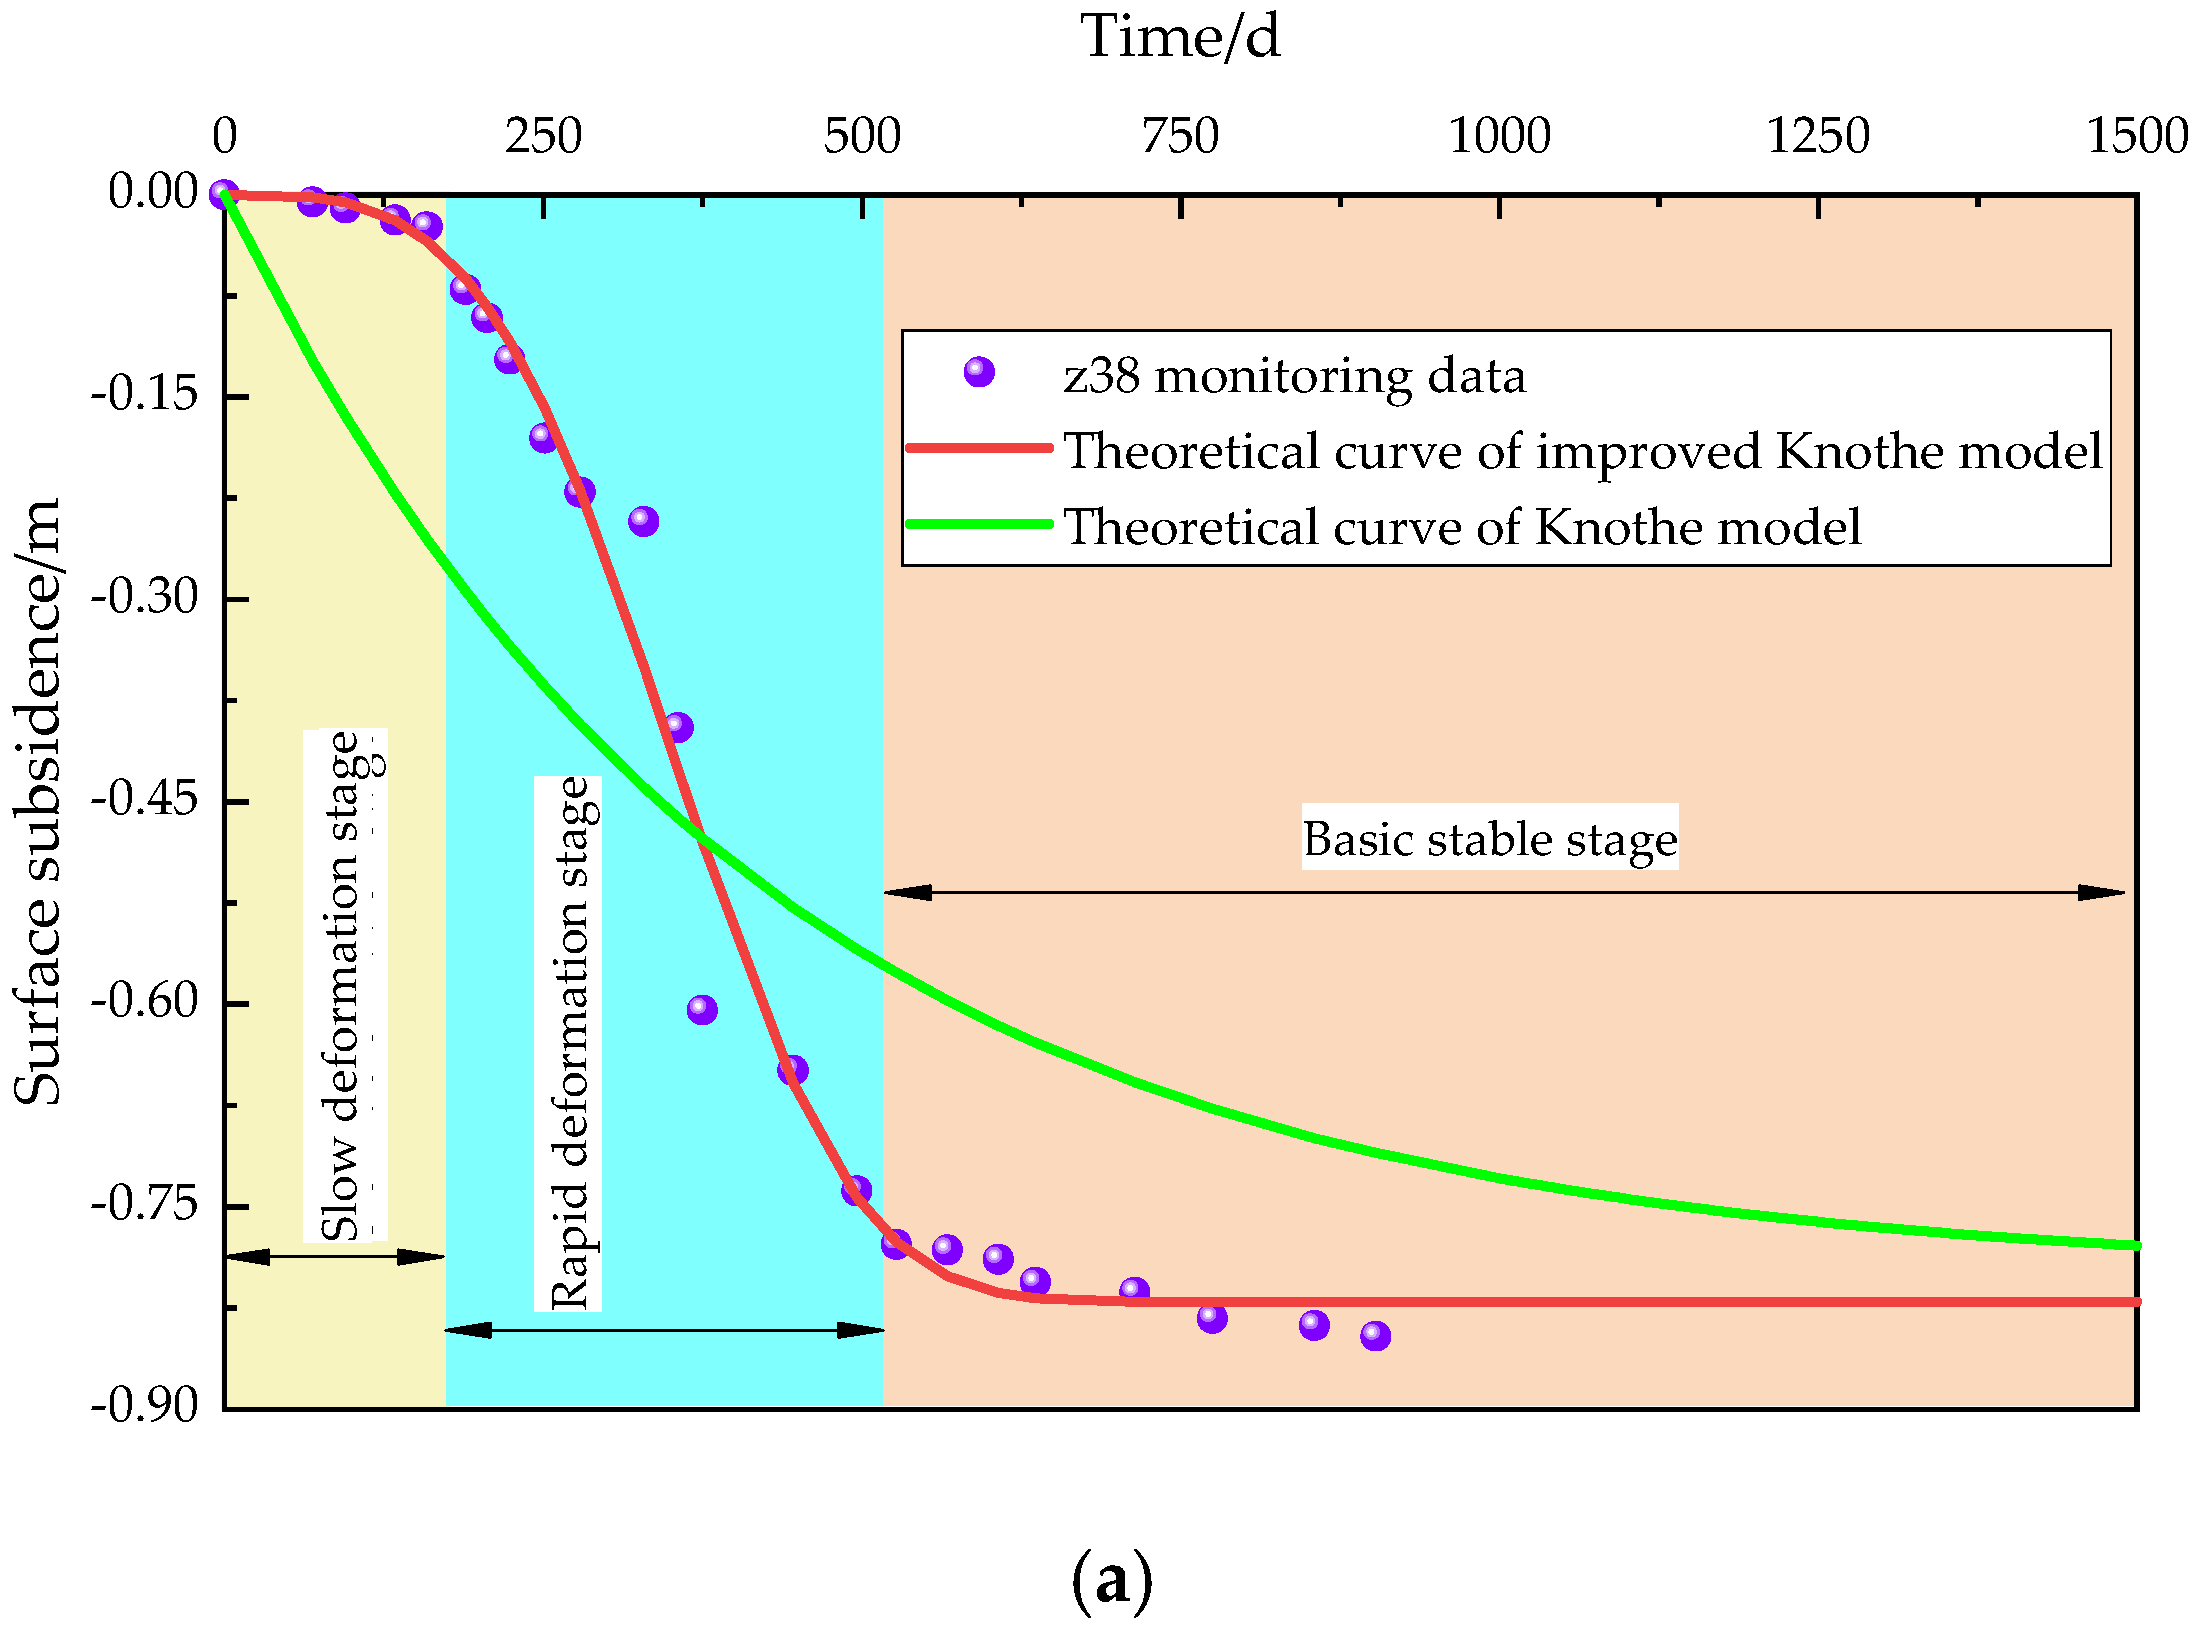
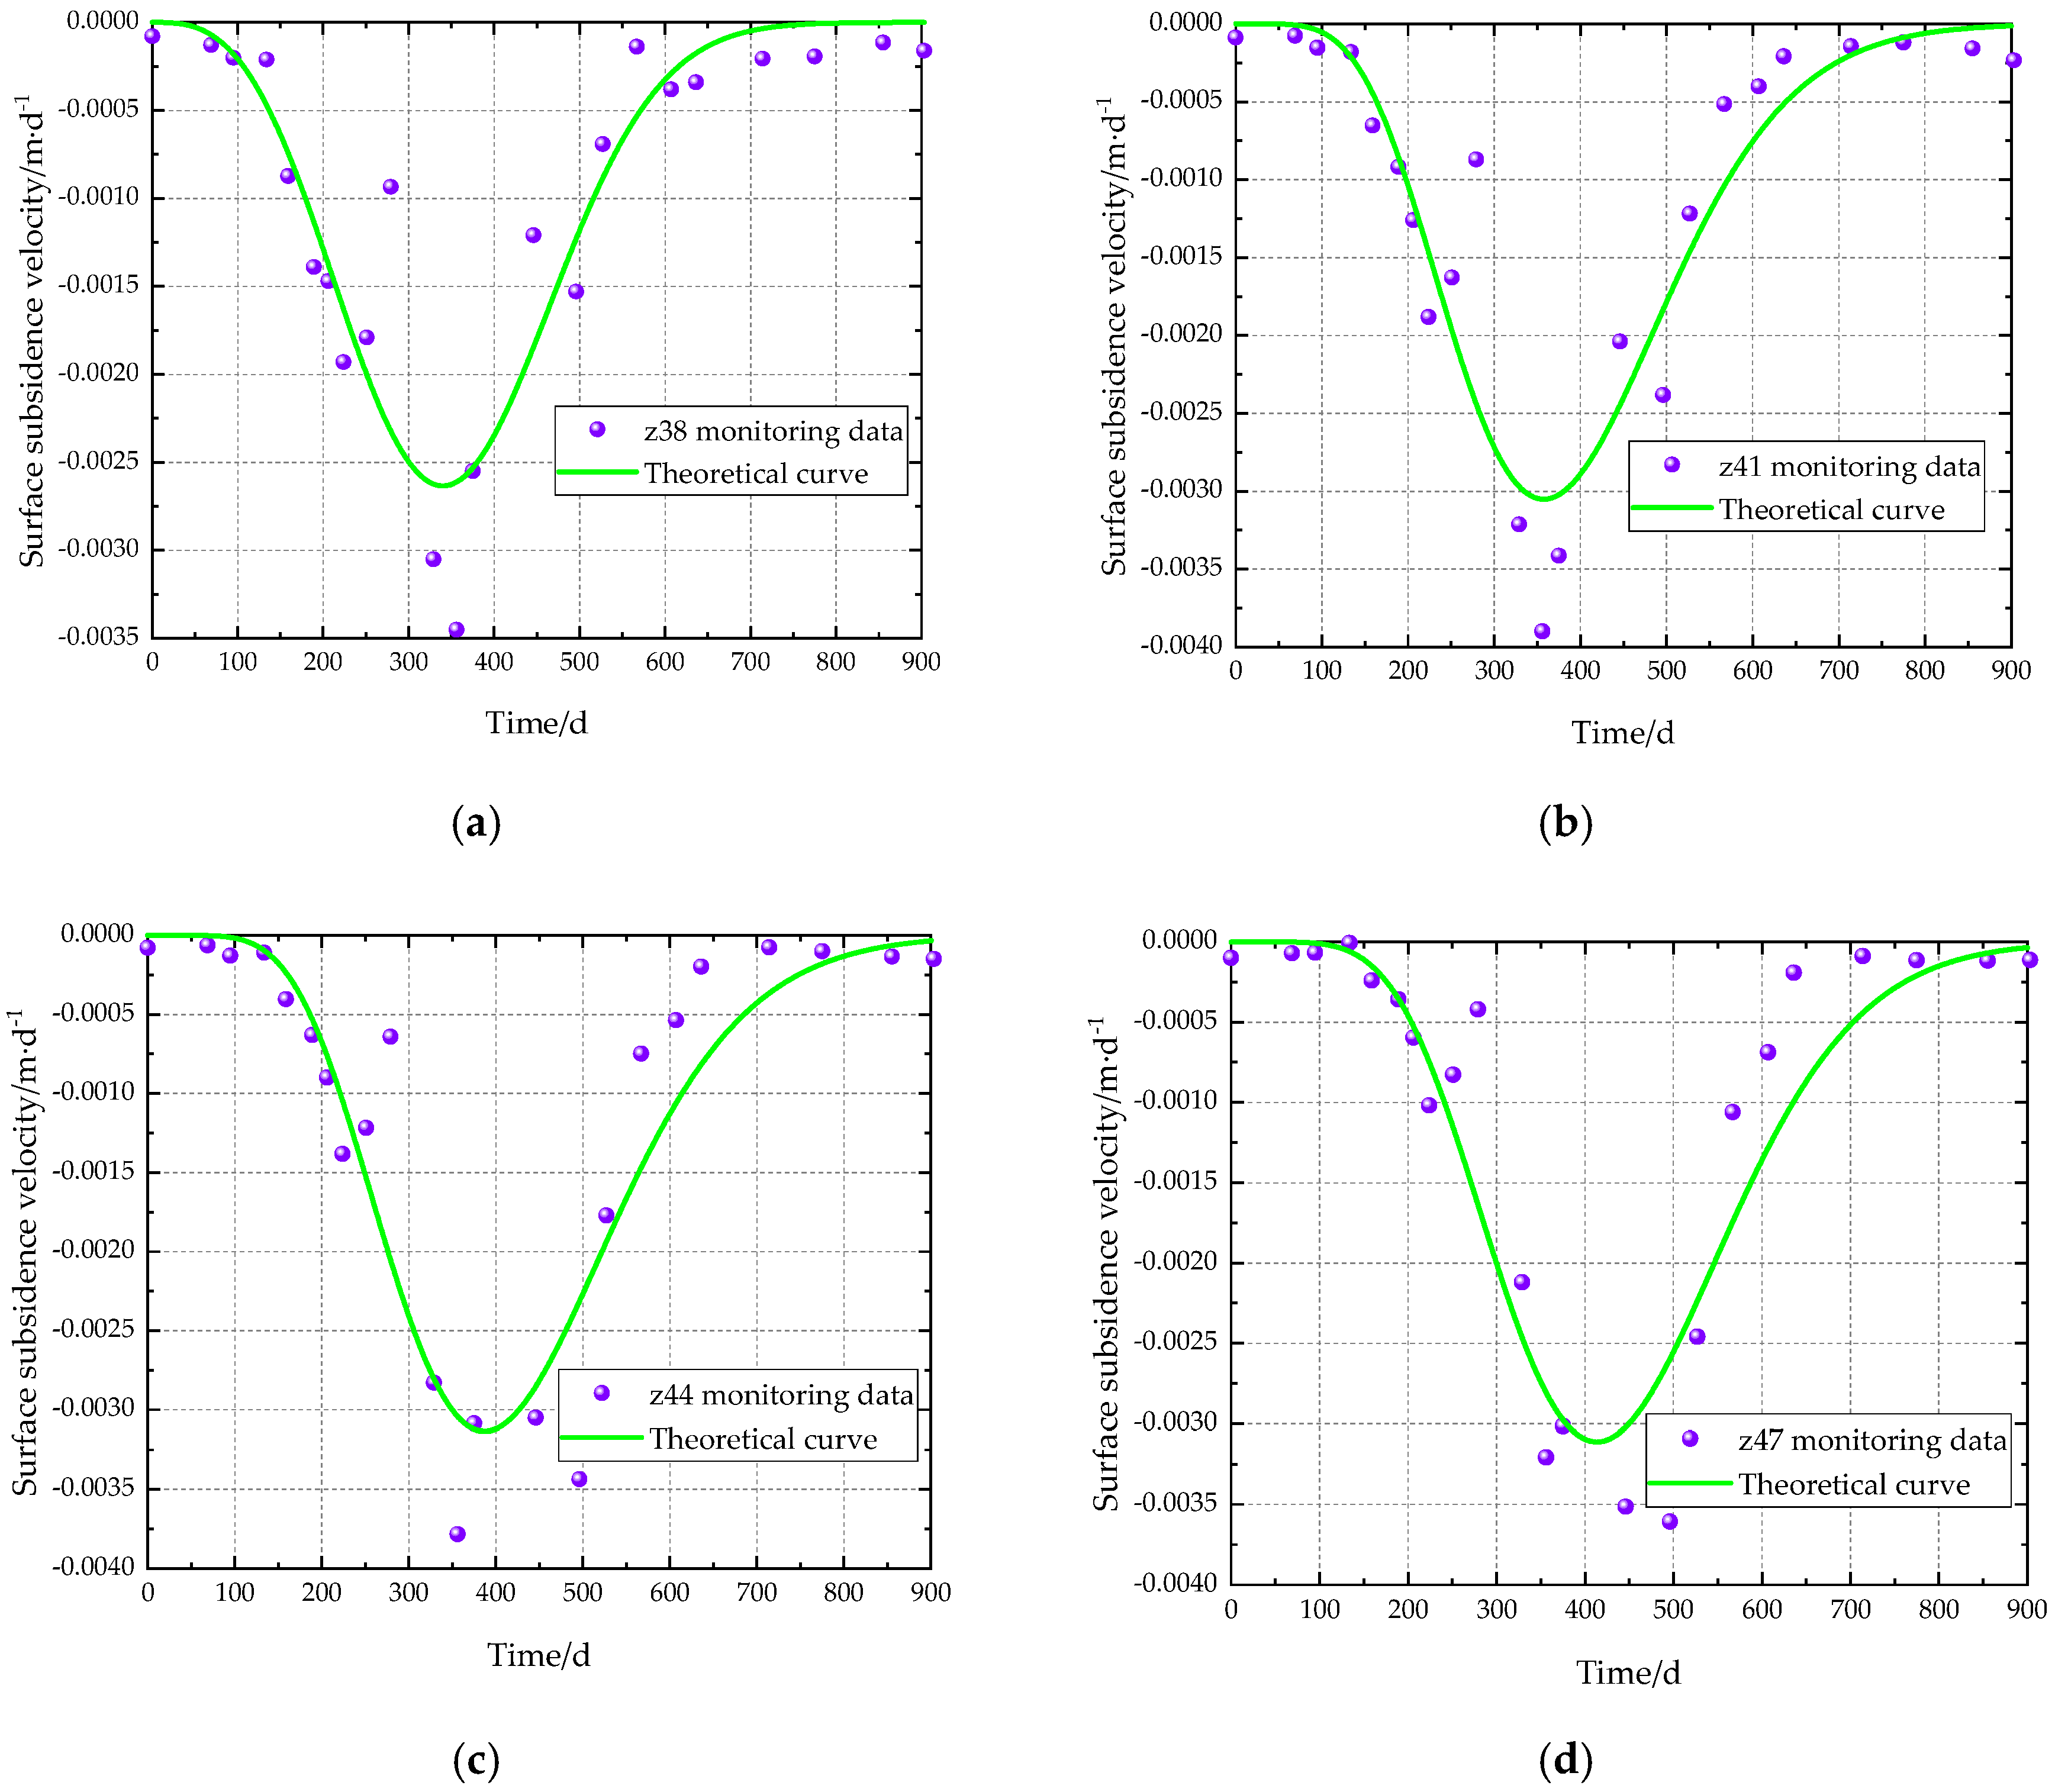
Table 1 shows the monitoring data of z38, z41, z44, and z47 for each period. The traditional and improved Knothe time function models were, respectively, used to predict the surface subsidence and subsidence velocity. The two models’ prediction comparison results are shown in Figure 8 and Figure 9.
As can be seen from the monitoring data in Table 1 and Figure 8, the duration of the rapid deformation stage of z37, z41, z44, and z47 monitoring sites was 310 days, 303 days, 276 days, and 198 days, respectively. Moreover, the duration of the rapid deformation stage of z44 and z47 monitoring sites was shorter than that of the slow deformation stage and basic stable stage. However, the data of the four monitoring sites indicated that the dynamic surface subsidence curve was approximately “S”-type. Therefore, the proposed model in the manuscript can be used to predict the vertical surface deformation. In addition, due to the lack of surface horizontal movement monitoring data and the focus of the manuscript is the vertical surface deformation. The horizontal deformation law of the surface will be discussed in the following research.
Figure 8 and Figure 9 demonstrate that the improved Knothe time function model prediction accuracy for surface subsidence is significantly better than the Knothe time function model, and can comprehensively reflect the whole dynamic surface subsidence velocity process from beginning acceleration to attenuation. The prediction results were consistent with the monitoring data. The prediction value of the Knothe time function model was quite different from the monitoring data. The improved Knothe time function model parameters obtained by the least square method are shown in Table 2.
Standard deviation and relative standard deviation can measure the deviation between monitored and predicted values [20,31]. To further verify the improved Knothe time function model accuracy, the standard deviation and relative standard deviation of the monitoring value and the predicted value of four monitoring points were analyzed without considering the monitoring error. The calculation formula is shown in Equation (17), and the calculation results are shown in Table 3. The improved Knothe time function model’s maximum relative standard deviation was only 5.7%, and the average relative standard deviation was only 4.8%. In contrast, the Knothe time function model maximum relative standard deviation was as high as 24.8%, and the average relative standard deviation was 23%, much higher than the improved Knothe time function model, which confirms the improved Knothe time function model accuracy and reliability established in this paper.
{ m = i = 1 k ( W m W p ) 2 k 1 f = m W 0
where m is standard deviation; f is relative standard deviation; W m is monitored value; W p is predicted value; k is monitoring data volume.

6. Conclusions

(1) Taking into account the inadequacy of the Knothe time function model to predict the dynamic surface subsidence, an improved Knothe time function model was established. The new model can accurately predict the dynamic surface subsidence caused by underground mining.
(2) The time influence parameter C and the model order n do not affect the initial and final surface subsidence values but only affect the time to reach the final subsidence value. The larger C and n are, the less time it takes to reach the final subsidence value. When the surface subsidence monitoring data is lacking, the time influence parameter C and the model order n can be determined according to the probability integral and the dual-medium methods. When a significant amount of monitoring data exists, the time influence parameter C and the model order n can be determined according to the least-squares methods.
(3) Four surface movement observation station monitoring data sets on the mine subsidence basin’s main profile in the Guotun coal mine were randomly selected. The monitoring data indicated that the dynamic surface subsidence curve is approximately “S”-type. Therefore, the proposed model in the manuscript can be used to predict the vertical surface deformation. By comparing the curve of improved Knothe time function model, Knothe time function model, and monitoring data, the results showed that the improved Knothe time function model surface subsidence value agrees well with the monitoring value, having better accuracy than the Knothe time function model. The average relative standard deviation between predicted and monitoring values was only 4.8%, much lower than the 23% of the Knothe time function model. The results verify the accuracy and reliability of the improved Knothe time function model.

Author Contributions

Conceptualization, L.Z. and H.C.; validation, X.W.; formal analysis, L.Z.; data curation, Z.Y.; writing—original draft preparation, L.Z.; writing—review and editing, H.C.; funding acquisition, H.C. All authors have read and agreed to the published version of the manuscript.

Funding

This research was funded by the National Natural Science Foundation of China (51874005).

Conflicts of Interest

The authors declare no conflict of interest.

References

  1. Alam, M.S.; Kumar, D.; Chatterjee, R.S.; Upreti, V. Assessment of land surface subsidence due to underground metal mining using integrated spaceborne repeat-pass differential interferometric synthetic aperture radar (DInSAR) technique and ground based observations. J. Indian Soc. Remote Sens. 2018, 46, 1569–1580. [Google Scholar] [CrossRef]
  2. Kim, Y.; Lee, S.S. Application of Artificial Neural Networks in Assessing Mining Subsidence Risk. Appl. Sci. 2020, 10, 1302. [Google Scholar] [CrossRef] [Green Version]
  3. Gueguen, Y.; Deffontaines, B.; Fruneau, B.; Al Heib, M.; De Michele, M.; Raucoules, D.; Guise, Y.; Planchenault, J. Monitoring residual mining subsidence of Nord/Pas-de-Calais coal basin from differential and Persistent Scatterer Interferometry (Northern France). J. Appl. Geophys. 2009, 69, 24–34. [Google Scholar] [CrossRef]
  4. Hejmanowski, R. Modeling of time dependent subsidence for coal and ore deposits. Int. J. Coal Sci. Technol. 2015, 2, 287–292. [Google Scholar] [CrossRef] [Green Version]
  5. Bai, E.; Guo, W.; Tan, Y.; Huang, G.; Guo, M.; Ma, Z. Roadway Backfill Mining with Super-High-Water Material to Protect Surface Buildings: A Case Study. Appl. Sci. 2019, 10, 107. [Google Scholar] [CrossRef] [Green Version]
  6. Marschalko, M.; Yilmaz, I.; Bednárik, M.; Kubecka, K. Influence of underground mining activities on the slope deformation genesis: Doubrava Vrchovec, Doubrava Ujala and Staric case studies from Czech Republic. Eng. Geol. 2012, 147, 37–51. [Google Scholar] [CrossRef]
  7. Williams, S.; Bock, Y.; Fang, P. Integrated satellite interferometry: Tropospheric noise, GPS estimates and implications for interferometric synthetic aperture radar products. J. Geophys. Res. Space Phys. 1998, 103, 27051–27067. [Google Scholar] [CrossRef]
  8. Kwinta, A.; Hejmanowski, R.; Sroka, A. A Time Function Analysis Used for the Prediction of Rock Mass Subsidence. In Proceedings of the International Symposium on Mining Science and Technology, Xuzhou, China, 16–18 October 1996; A.A. Balkema: Rotterdam, The Netherlands, 1996; pp. 419–424. [Google Scholar]
  9. Sheorey, P.; Loui, J.; Singh, K.; Singh, S. Ground subsidence observations and a modified influence function method for complete subsidence prediction. Int. J. Rock Mech. Min. Sci. 2000, 37, 801–818. [Google Scholar] [CrossRef]
  10. Lian, X.; Jarosz, A.; Saavedra-Rosas, J.; Dai, H.-Y. Extending dynamic models of mining subsidence. Trans. Nonferrous Met. Soc. China 2011, 21, s536–s542. [Google Scholar] [CrossRef]
  11. Tugrul, U.; Hakan, A.; Ozgur, Y. An integrated approach for the prediction of subsidence for coal mining basins. Eng. Geol. 2013, 166, 186–203. [Google Scholar]
  12. Hu, Q.; Deng, X.; Feng, R.; Li, C.; Wang, X.; Jiang, T. Model for calculating the parameter of the Knothe time function based on angle of full subsidence. Int. J. Rock Mech. Min. Sci. 2015, 78, 19–26. [Google Scholar] [CrossRef]
  13. Chen, B. Combining SAR interferometric phase and intensity information for monitoring of large gradient deformation in coal mining area. Eur. J. Remote. Sens. 2015, 48, 701–717. [Google Scholar] [CrossRef] [Green Version]
  14. Yang, Z.; Li, Z.; Zhu, J.; Preusse, A.; Yi, H.; Hu, J.; Feng, G.; Papst, M. Retrieving 3-D Large Displacements of Mining Areas from a Single Amplitude Pair of SAR Using Offset Tracking. Remote Sens. 2017, 9, 338. [Google Scholar] [CrossRef] [Green Version]
  15. Rošer, J.; Potočnik, D.; Vulić, M. Analysis of Dynamic Surface Subsidence at the Underground Coal Mining Site in Velenje, Slovenia through Modified Sigmoidal Function. Minerals 2018, 8, 74. [Google Scholar] [CrossRef] [Green Version]
  16. Luo, H.; Li, Z.; Chen, J.; Pearson, C.; Wang, M.; Lv, W.; Ding, H. Integration of Range Split Spectrum Interferometry and conventional InSAR to monitor large gradient surface displacements. Int. J. Appl. Earth Obs. Geoinf. 2019, 74, 130–137. [Google Scholar] [CrossRef] [Green Version]
  17. Knothe, S. Effect of time on formation of basin subsidence. Arch. Min. Steel Ind. 1953, 1, 1–7. [Google Scholar]
  18. Gonzalez-Nicieza, C.; Alvarez-Fernandez, M.I.; Menéndez-Díaz, A.; Álvarez-Vigil, A.E. The influence of time on subsidence in the Central Asturian Coalfield. Bull. Int. Assoc. Eng. Geol. 2007, 66, 319–329. [Google Scholar] [CrossRef]
  19. Chen, Q.-J.; Hang, M. Dynamic Reclamation Methods for Subsidence Land in the Mining Area with High Underground Water Level. Open Geosci. 2018, 10, 639–646. [Google Scholar] [CrossRef]
  20. Kowalski, A. Surface subsidence and rate of its increaments based on measurements and theory. Arch. Min. Sci. 2001, 46, 391–406. [Google Scholar]
  21. Tang, J.; Wang, J.A.; Wang, L. Dynamic laws and characteristics of surface movement induced by mining under thin alluviumv. Rock Soil Mech. 2014, 35, 2958–2968. [Google Scholar]
  22. Nie, L.; Wang, H.; Xu, Y. Application of the arctangent function model in the prediction of ground mining subsidence deformation: A case study from Fushun City, Liaoning Province, China. Bull. Int. Assoc. Eng. Geol. 2016, 76, 1383–1398. [Google Scholar] [CrossRef]
  23. Xi, G.J.; Hong, X.; Shao, H.Q. Application of improved Logistic function model to prediction of surface subsidence. Coal Sci. Technol. 2013, 41, 114–117. [Google Scholar]
  24. Asadi, A.; Shakhriar, K.; Goshtasbi, K. Profiling Function for Surface Subsidence Prediction in Mining Inclined Coal Seams. J. Min. Sci. 2004, 40, 142–146. [Google Scholar] [CrossRef]
  25. Cai, Y.; Li, X.; Xiao, W.; Zhang, W. Simulation of Mining-Induced Ground Damage Using Orthogonal Experiments to Determine Key Parameters of Super-Large Coalface: A Case Study in Shendong Coalfield in China. Appl. Sci. 2020, 10, 2258. [Google Scholar] [CrossRef] [Green Version]
  26. Nie, L.; Wang, H.; Xu, Y.; Li, Z. A new prediction model for mining subsidence deformation: The arc tangent function model. Nat. Hazards 2014, 75, 2185–2198. [Google Scholar] [CrossRef]
  27. Iwanec, A.S.; Carter, J.; Hambleton, J. Geomechanics of subsidence above single and multi-seam coal mining. J. Rock Mech. Geotech. Eng. 2016, 8, 304–313. [Google Scholar] [CrossRef] [Green Version]
  28. Chang, Z.Q.; Wang, J.Z. Study on time function of surface subsidence—The improved Knothe time function. Chin. J. Rock Mech. Eng. 2003, 22, 1496. [Google Scholar]
  29. Cui, X.M.; Miao, X.X.; Zhao, Y.L.; Jin, R.P. Discussion on the time function of time dependent surface movement. J. China Coal Soc. 1999, 24, 454–456. [Google Scholar]
  30. Cui, X.; Wang, J.; Liu, Y. Prediction of progressive surface subsidence above longwall coal mining using a time function. Int. J. Rock Mech. Min. Sci. 2001, 38, 1057–1063. [Google Scholar] [CrossRef]
  31. Wang, B.; Xu, J.; Xuan, D. Time function model of dynamic surface subsidence assessment of grout-injected overburden of a coal mine. Int. J. Rock Mech. Min. Sci. 2018, 104, 1–8. [Google Scholar] [CrossRef]
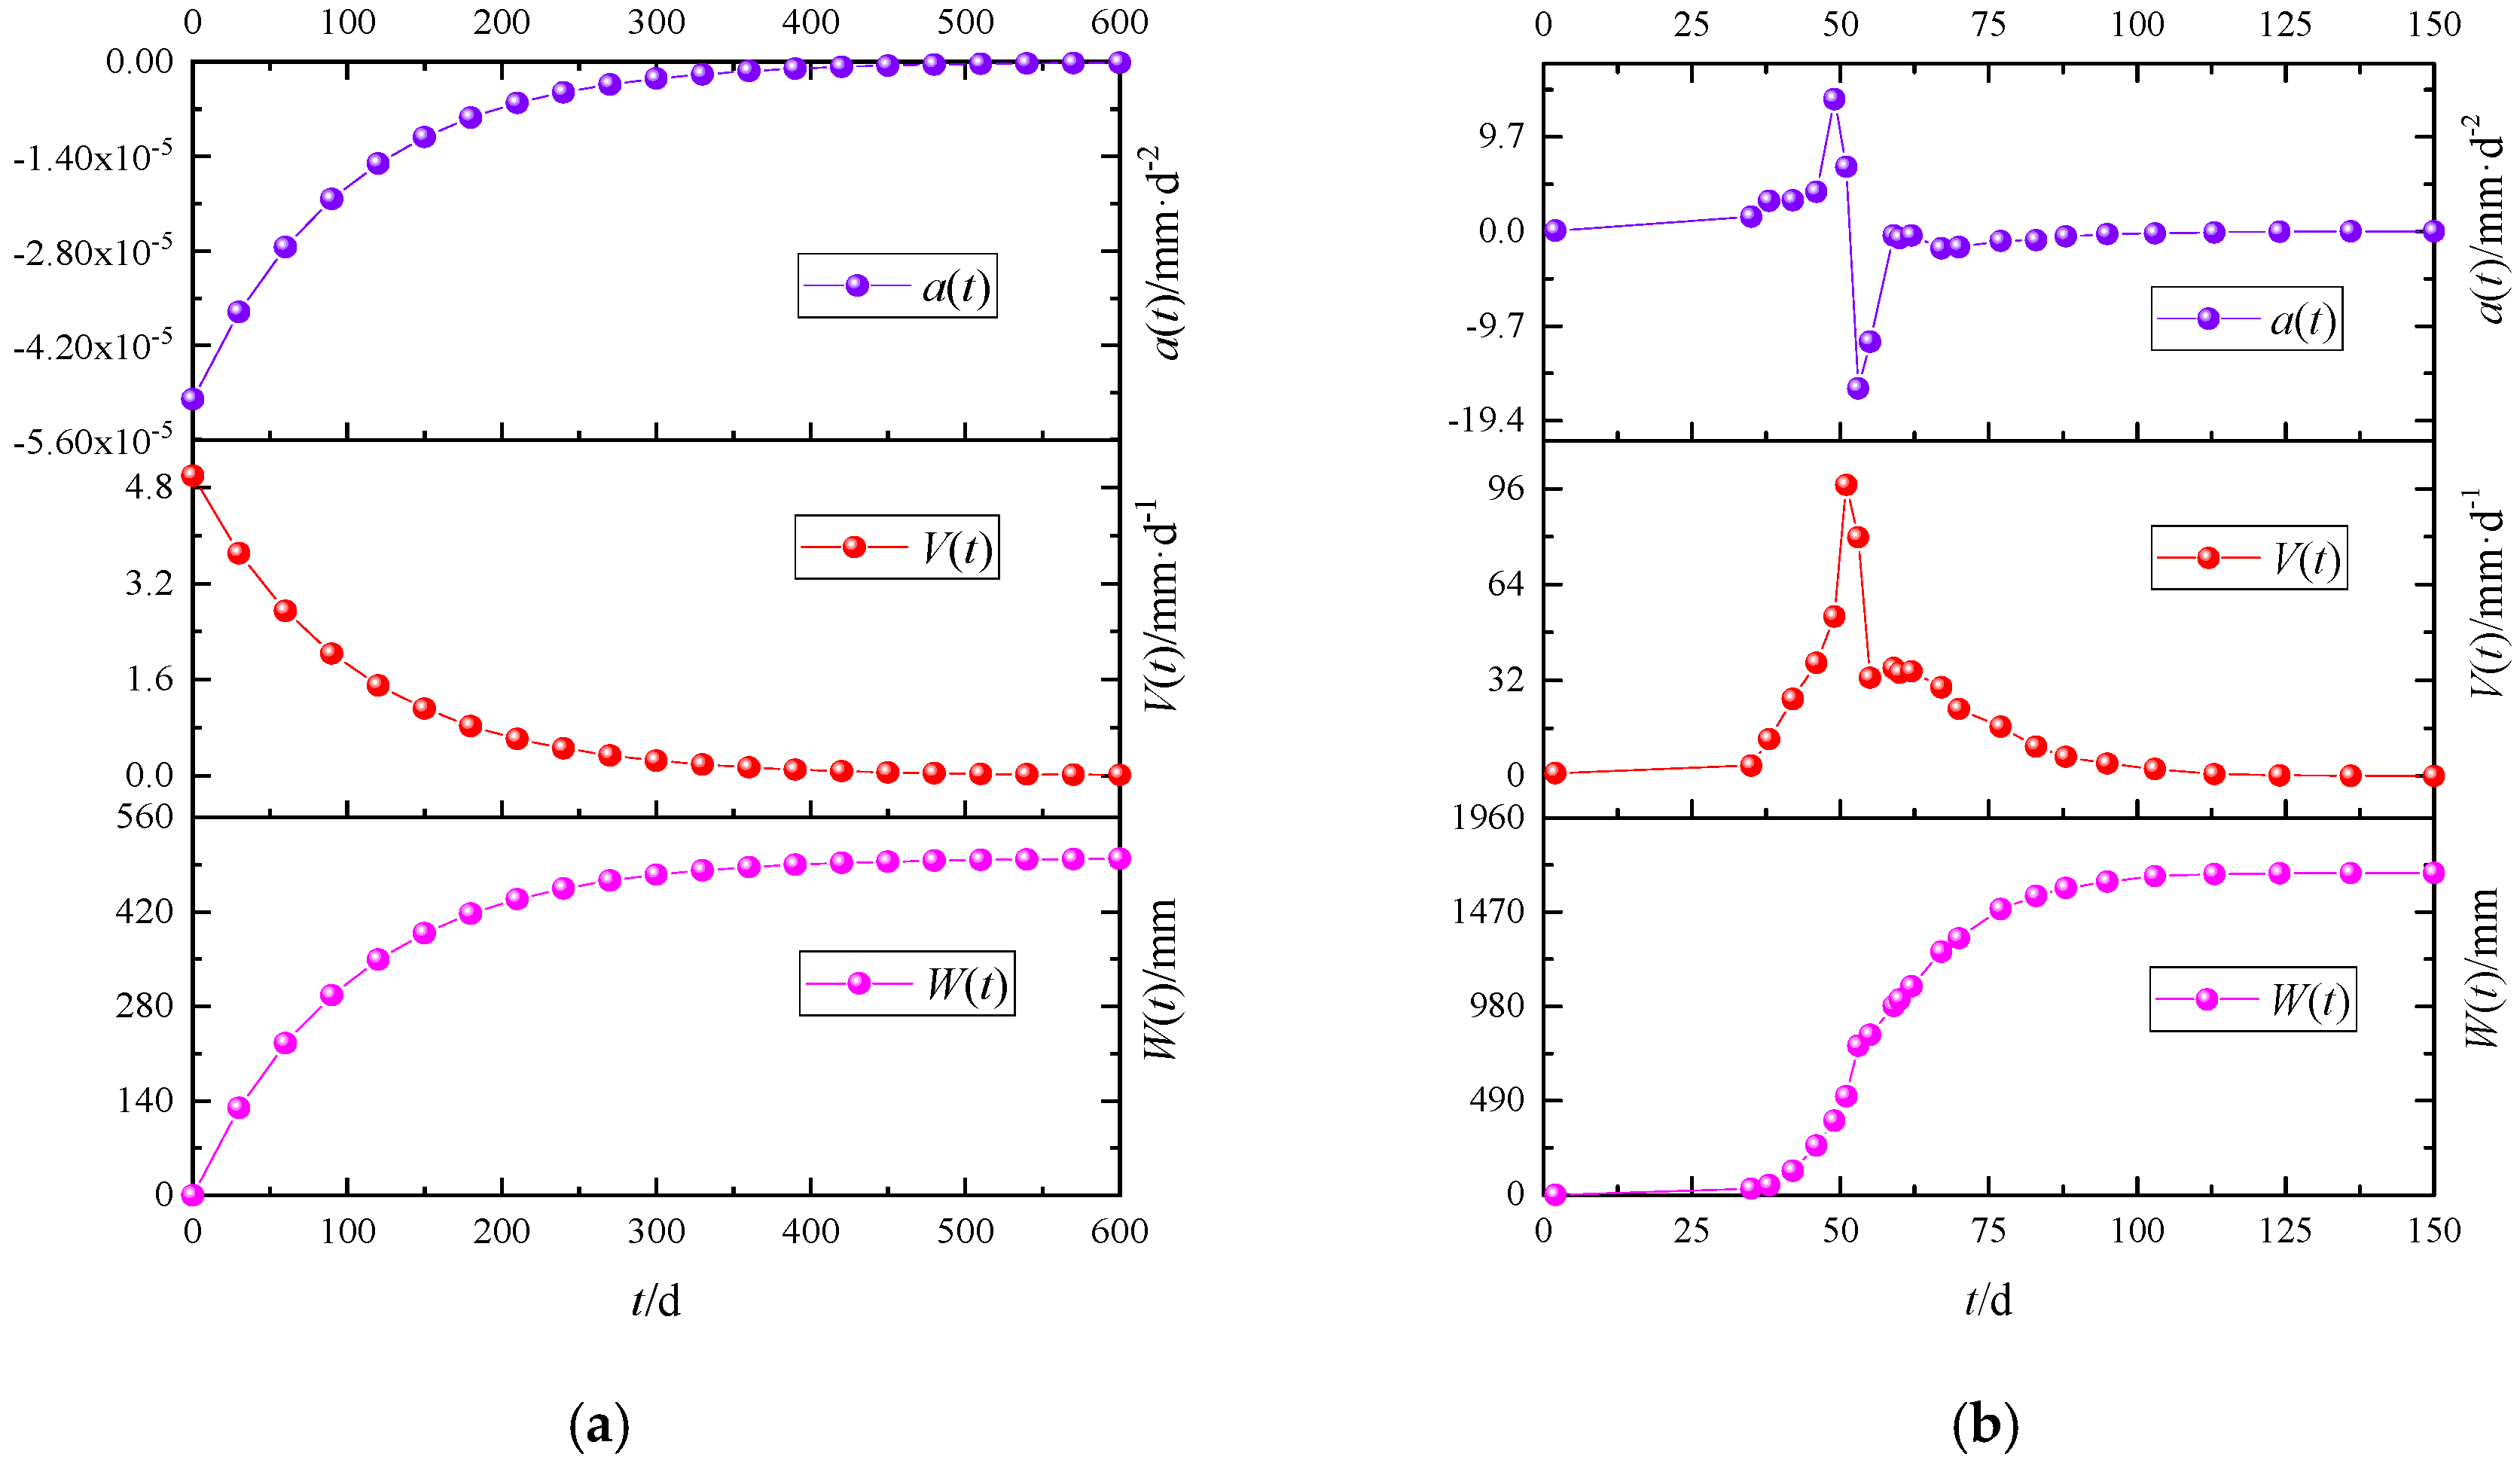
Figure 1. Surface point curve of subsidence, subsidence velocity, and subsidence acceleration: (a) based on Knothe time function model; (b) based on the field monitoring value.
Applsci 10 03147 g001
Figure 2. The influence of model order n on surface subsidence.
Applsci 10 03147 g002
Figure 3. The influence of model order n on surface subsidence velocity.
Applsci 10 03147 g003
Figure 4. The influence of model order n on surface subsidence acceleration.
Applsci 10 03147 g004
Figure 5. The surface subsidence curve with different time influence parameter C.
Applsci 10 03147 g005
Figure 6. Calculation model of critical dimension for full mining: (a) bedrock decision method; (b) comprehensive impact parameter method; (c) dual-medium method.
Applsci 10 03147 g006
Figure 7. Schematic diagram of the Guotun coalmine location and layout of surface subsidence observation stations above 1301 working face.
Applsci 10 03147 g007
Figure 8. Comparison of two time-function models for surface subsidence prediction: (a) z38; (b) z41; (c) z44; (d) z47.
Applsci 10 03147 g008aApplsci 10 03147 g008b
Figure 9. Prediction of surface subsidence velocity curve by the improved Knothe time function model: (a) z38; (b) z41; (c) z44; (d) z47.
Applsci 10 03147 g009
Table 1. Surface subsidence monitoring data of z38, z41, z44, and z47.
Observation TimesObservation DateRelative Observation (Time/d)z38 Settlement (Value/mm)z41 Settlement (Value/mm)z44 Settlement (Value/mm)z47 Settlement (Value/mm)
12010/10/1800000
22010/12/2769−5.4−6.0−5.4−6.8
32011/1/2395−10.0−7.7−6.6−7.9
42011/3/2134−18.8−17.1−14.9−11.5
52011/3/27159−23.7−20.1−15.0−9.5
62011/4/27189−70.2−55.6−39.1−26.3
72011/5/14206−91.2−66.7−46.9−28.9
82011/6/2224−122.0−100.3−71.0−47.6
92011/6/29251−180.2−151.5−109.5−74.5
102011/7/27279−220.2−189.6−137.7−92.9
112011/9/17329−242.2−208.5−151.4−102.1
122011/10/14356−394.9−371.8−296.8−211.6
132011/11/3375−604.3−630.0−569.4−370.4
142012/1/14446−648.9−717.8−713.0−630.8
152012/3/4496−738.2−859.9−916.9−898.7
162012/4/5527−778.0−919.5−1003.5−1018.2
172012/5/15567−782.0−940.1−1033.4−1060.6
182012/6/25607−789.0−960.7−1063.4−1103.0
192012/7/24636−806.0−969.0−1072.8−1112.1
202012/10/12714−813.3−979.1−1078.3−1117.4
212012/12/13775−832,7−988.7−1083.2−1123.9
222013/3/3855−838.2−995.2−1092.7−1133.5
232013/4/21903−845.9−1006.4−1099.8−1138.9
Table 2. Time influence parameters of different main strike profile monitoring points.
Model ParameterMonitoring PointsAverage Value
z38z41z44z47
C1.62 × 10−101.30 × 10−100.85 × 10−101.16 × 10−101.23 × 10⁻¹⁰
n3.524.014.043.943.88
Table 3. Error between monitored and predicted values.
Monitoring PointsImproved Knothe Time Function ModelKnothe Time Function Model
m/mmf/%m/mmf/%
z3837.64.6174.521.3
z4142.54.3219.722.3
z4461.95.7259.723.7
z4752.94.6286.324.8
Average value48.74.8235.123