1. Introduction
Daylighting is a design concept of buildings used over the years with varying degrees of success. It has been proven that buildings with good daylighting have positive effects on the well-being and health of occupants, reducing stress levels, and improving mood and photobiological effects [
1,
2,
3,
4,
5]. The International Energy Agency (IEA) promoted the use of daylight as a means of reducing electricity consumption on lighting [
6], and increasing the energy efficiency of buildings [
7,
8]. International Net Zero Energy Building (NZEB) standards and regulations recommend the incorporation of natural lighting strategies in their design and define minimum standards [
9,
10].
A fundamental step towards building design that illuminates interiors with daylight is the compilation of information on daylight availability outside the building. Illuminance on vertically oriented surfaces is, therefore, important for modeling the daylight availability, especially for high-rise buildings with substantial areas of glazed surfaces [
11]. Solar radiation data on vertical surfaces can also be used to evaluate the performance of Building Integrated Photovoltaics (BIPV), because the vertical facades of modern cities occupy larger areas than roof surfaces and usually present better maintenance conditions for photovoltaic panels [
12]. However, the basic outdoor solar irradiance and illuminance data for the surfaces of interest are not usually available in many parts of the world [
13].
The Vertical Sky Component (VSC) is defined as the ratio of the vertical diffuse illuminance () over the unobstructed horizontal diffuse illuminance () simultaneously measured at the same point [
14]. City planners and developers use the VSC to assess the impact of newly built constructions on the access to daylighting. Its potential in early stage design decisions is widely recognized [
15]. The VSC is an important daylight parameter, which has been also used for different applications: Sky classification [
16,
17], unobstructed sky irradiance and illuminance determinations [
18], and calculations of indoor illuminance [
19]. Global and diffuse outdoor illuminance on a horizontal surface and vertical global illuminance on the four (north, east, south, and west) cardinal orientations have been used to compute the VSC. However, as experimental data of
and
are scarce, different alternatives are used to calculate VSC [
11,
17,
20].
With a well-defined luminance distribution, the daylight illuminance on various inclined surfaces, such as vertical planes facing towards different directions, can be estimated by integrating the luminance distribution of the sky dome over each surface [
21]. The usual instrument for measuring sky luminance distribution is by means of a sky scanner [
8]. On the other hand, empirical models of homogeneous skies represent a low-cost approach to obtain sky luminance distribution. Generally, sky conditions can be subdivided into overcast, partly cloudy, and clear skies. In 2003, CIE [
22] and the International Organization for Standardization (ISO) [
23] adopted 15 Standard Sky Luminance Distributions (SSLD) as the most versatile definition of skylight in various localities and daylight climate regions, making it possible to simulate annual daylight profiles in absolute units based on typical luminance sky patterns. Despite the high interest in those measurements, very few studies at only a handful of European [
24,
25,
26,
27,
28,
29] and Asian [
15,
30,
31] locations have been conducted to characterize the sky under the CIE standard, mainly due to scarce sky luminance data obtained from sky scanner devices.
Different alternatives to the use of sky scanners have been proposed for classifying the skies [
32] including the use of different climatic parameters [
33,
34,
35,
36], vertical [
12,
20] and horizontal illuminance [
37,
38], and satellite data [
39]. VSC has been proposed as an appropriate method, both for categorizing the CIE Standard General Skies and for determining daylight illuminance on inclined surfaces with various orientations [
17,
32]. The VSC facing a given orientation at a given time under an individual CIE Standard General Sky has its own features and stands for a unique value. So, the use of the CIE standard classification could represent an alternative means of estimating VSC.
As it has been pointed out, the determination of daylight availability is a complex issue due to scarce experimental data needed for all methodologies proposed. Therefore, it is mandatory the establishment of the equivalence among the different methodologies for obtaining daylighting through any of the proposed methods and even the possible combination between them when necessary.
This study focused on the determination of VSC in Burgos, Spain, for which purpose different alternative proposals for its calculation are compared. Three methods are generally used to calculate VSC: Available experimental data of horizontal global, diffuse, and beam illumination; through the data from experimental sky scanner measurements; and the CIE standard classification for homogeneous skies. The results obtained under different sky conditions were tested in a long-term experimental test campaign over 29 months. The VSC data obtained from the experimental data of global horizontal, diffuse, and beam illuminance were taken as the reference data and two statistical indicators, root mean square deviation (RMSD) and mean bias deviation (MBD), were used as quality indicators of the equivalence of the different approaches. Finally, the daylight conditions in Burgos, Spain, were determined with the VSC calculations for surfaces facing all four cardinal orientations.
The paper will be structured as follows. The experimental facility and the measurement campaign as well the quality filters applied to the experimental data will be described in
Section 2. The different approaches used for the VSC calculations will be defined in
Section 3 and the results of all three methodologies with their statistical indicators will be compared in
Section 4. In
Section 5, the VSC in Burgos will be calculated for all four cardinal orientations and the results will be compared with the existing knowledge of the CIE standard sky type, analyzing both frequency of occurrence and seasonal and monthly distributions. Finally, the main results and the conclusions of the study will be summarized in
Section 6.
2. Experimental Data
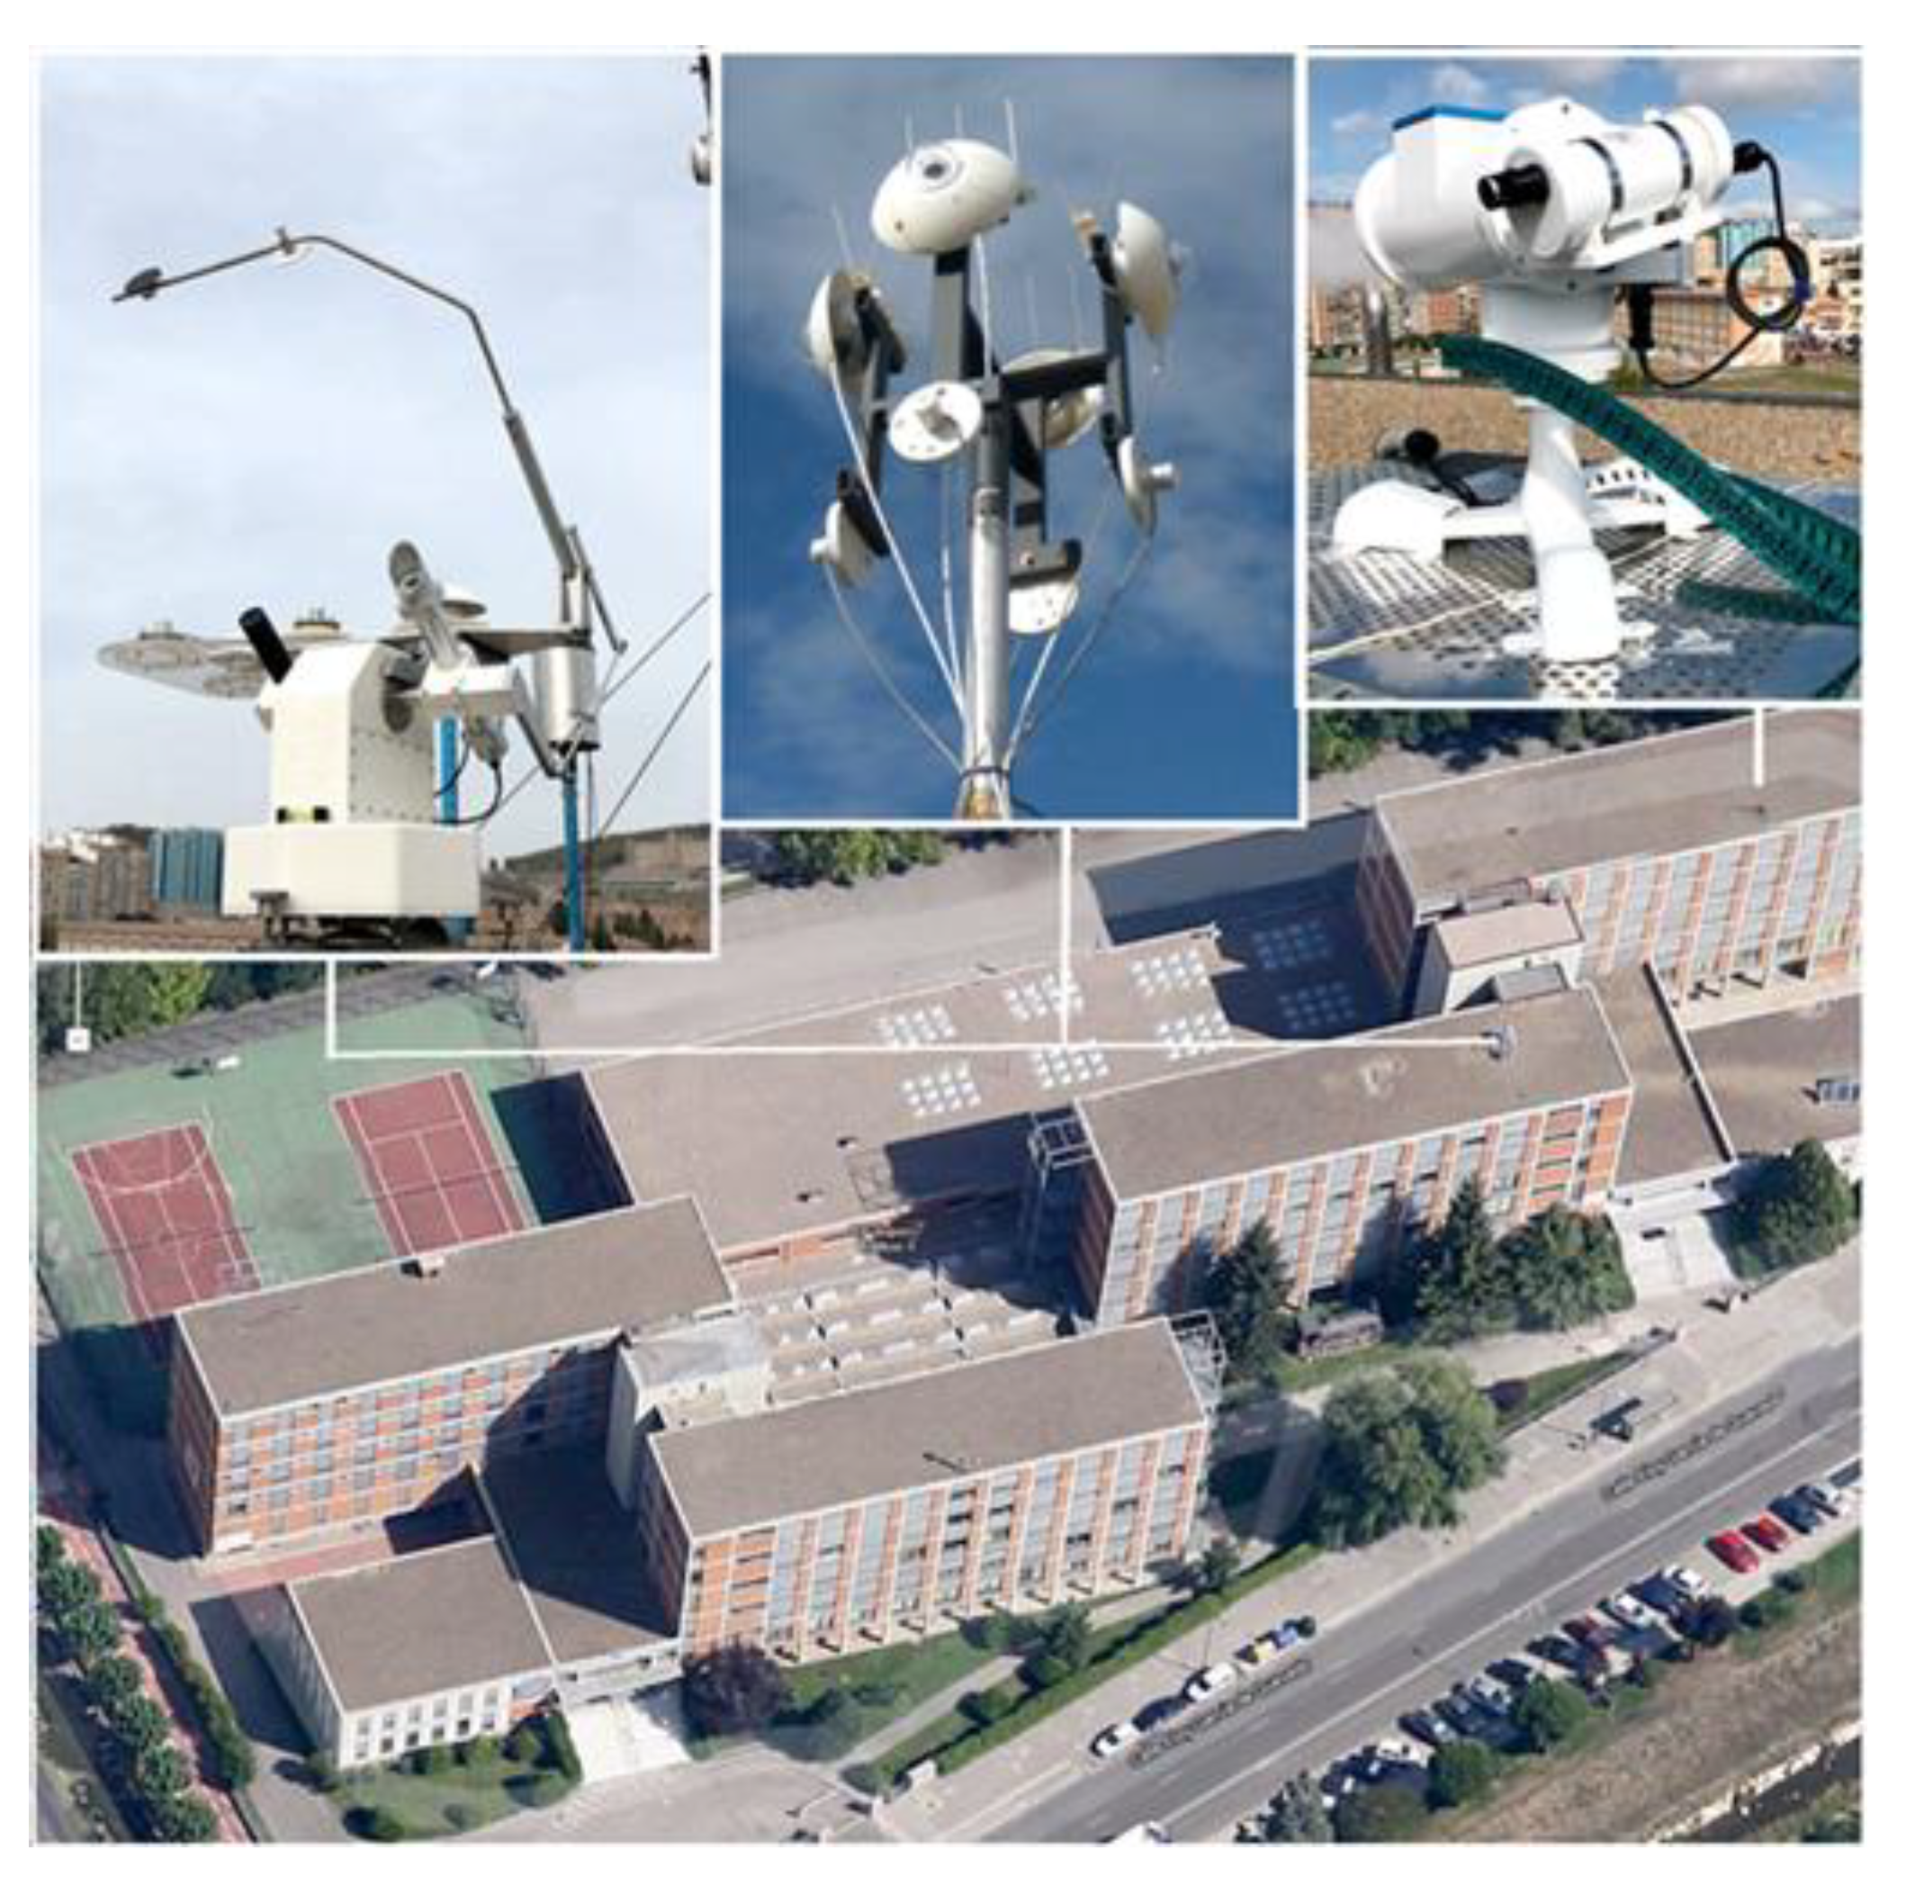
The experimental data for this study were recorded at a meteorological weather station located on the roof of the Higher Polytechnic School building of Burgos University (42°21′04″ N, 3°41′20″ W, 856 m above mean sea level). The flat roof of this five-story building, in an area with no other buildings of comparable height, is ideal for recording measurements with no external obstructions or reflections from other surfaces. The experimental equipment is shown in
Figure 1.
The daylight measurements included the global, diffuse, and beam outdoor illuminance on a horizontal plane; the vertical global components facing the four cardinal orientations (north, east, south, and west); and the luminance distributions for the whole sky, recorded with seven lumeters model ML-020S-O luxmeters, and a commercial MS-321LR sky scanner both from EKO Instruments (EKO Instruments Europe B.V. Den Haag, Netherlands). The diffuse luxmeter was obscured from direct sunlight by a shadow hat. The direct solar illuminance (
) sensor was installed on a sun tracker (model SunTracker-3000, Geónica, Madrid, Spain) facing the sun. The technical specifications of the sky scanner and luxmeter are shown in
Table 1 and
Table 2, respectively.
Illuminance data were recorded every 10 min (averaging recorded scans of 30 s). The illuminance data (horizontal global,
diffuse,
and beam,
were analyzed and then filtered using CIE quality criteria, shown in
Table 3. The sky scanner was adjusted on a monthly basis for taking measurements from sunrise to the sunset. It completed a full scan in four minutes and started a new scan every 15 min. The first and last measurement of the day (
were discarded, as well measurements higher than 50 kcd/m
2 and lower than 0.1 kcd/m
2, following the specifications of the equipment. Only half-hourly and hourly sky scanner measurements were used in this study, to match simultaneous records of illuminance data. If the illuminance data failed to pass the quality criteria, then all the simultaneous data sets were rejected.
The measurement campaign ran from September 2016 up until January 2019. A total of 3991 datasets of illuminance (horizontal global, diffuse, and beam and vertical global in the four cardinal orientations) and sky scanner measurements passed the quality criteria.
3. Determination of VSC
The Vertical Sky Component (VSC) is defined as the ratio of the vertical diffuse illuminance
, over the unobstructed horizontal diffuse illuminance,
, simultaneously measured at the same point, as shown in Equation (1).
In this study, the measured global, beam, and diffuse illuminance on a horizontal surface and vertical global illuminance on vertical surfaces facing the four cardinal orientations (north, east, south and west) were used to compute the VSC for subsequent analysis. As
data were not available at the experimental facility described in the
Section 2, these data will be obtained, considering the similar characteristics of both solar irradiance and illuminance. The models developed for solar irradiance prediction on a vertical surface can, therefore, also be employed for daylight calculations [
12]. The illuminance incident on a vertical surface,
, was evaluated as the sum of beam,
, sky-diffuse,
and ground-reflected,
components. It can be written as:
Calculation of beam illuminance is quite straightforward, given the position of the sun and the orientation of the surface, as shown in Equation (3):
where
is the solar elevation,
is the azimuth angle of the sun, and,
is the azimuth vertical surface angle (which is 0 for the south-facing surfaces,
for the vertical east surface,
for the vertical west surface, and
for the north surface). It was assumed when estimating the ground-reflected illuminance,
that vertical surfaces will receive half of the total illuminance reflected isotropically from the ground, ignoring the inter-reflection between the vertical and the ground surfaces.
depends on the albedo,
, and the global horizontal illuminance,
, as it is shown in Equation (4). In this work, the value of
was experimentally obtained [
40].
can then be calculated with Equation (5). The VSC was obtained from the experimental data of horizontal global, diffuse, and beam illuminance, as shown in Equation (6):
If the luminance distribution in the sky dome is known, one alternative to determine the VSC is through integration. With a well-defined luminance distribution, the daylight on any surface can be estimated by integrating the luminance distribution of the sky dome over each surface. Traditionally, sky luminance distribution has been measured by sky-scanner instruments. These instruments divide the sky hemisphere into a limited number of sky elements (patches) of finite angular size and continuously scan the luminance data corresponding to each patch,
. Each sky patch will, it is expected, be treated as point sources with negligible error, but integration over all sky luminance scanning patches is only an approximation of total illuminance.
Figure 2 shows a typical sky hemisphere sectorization into 145 patches and the geometric magnitudes that characterize each patch.
When sky scanner measurements are available, the horizontal and vertical diffuse illuminance can be obtained from Equations (7) and (8), respectively [
37,
41,
42]:
In Equation (7),
is the luminance of patch p,
is the angle of elevation of a patch above the horizon,
is the altitude length of patch p (
for all patches), and
is the azimuth length of patch p. In Equation (8),
represents the contribution of each patch to the vertical diffuse illuminance, calculated with Equation (9):
is a geometrical factor which depends on the patch position in the sky dome, defined by Equation (10) [
32]:
where
is the azimuth of the patch p and
is the azimuth of the vertical surface.
Knowledge of the sky luminance distribution can be obtained through the CIE standard sky classification, which establishes a biunivocal relationship between the sky type and the sky luminance pattern. If the CIE standard sky classification is known, the luminance in each sky patch,
can be obtained using Equation (11):
Coefficients
are defined by CIE [
23] as functions of the sky type, as shown in
Table 4.
is the sky element zenith angle and
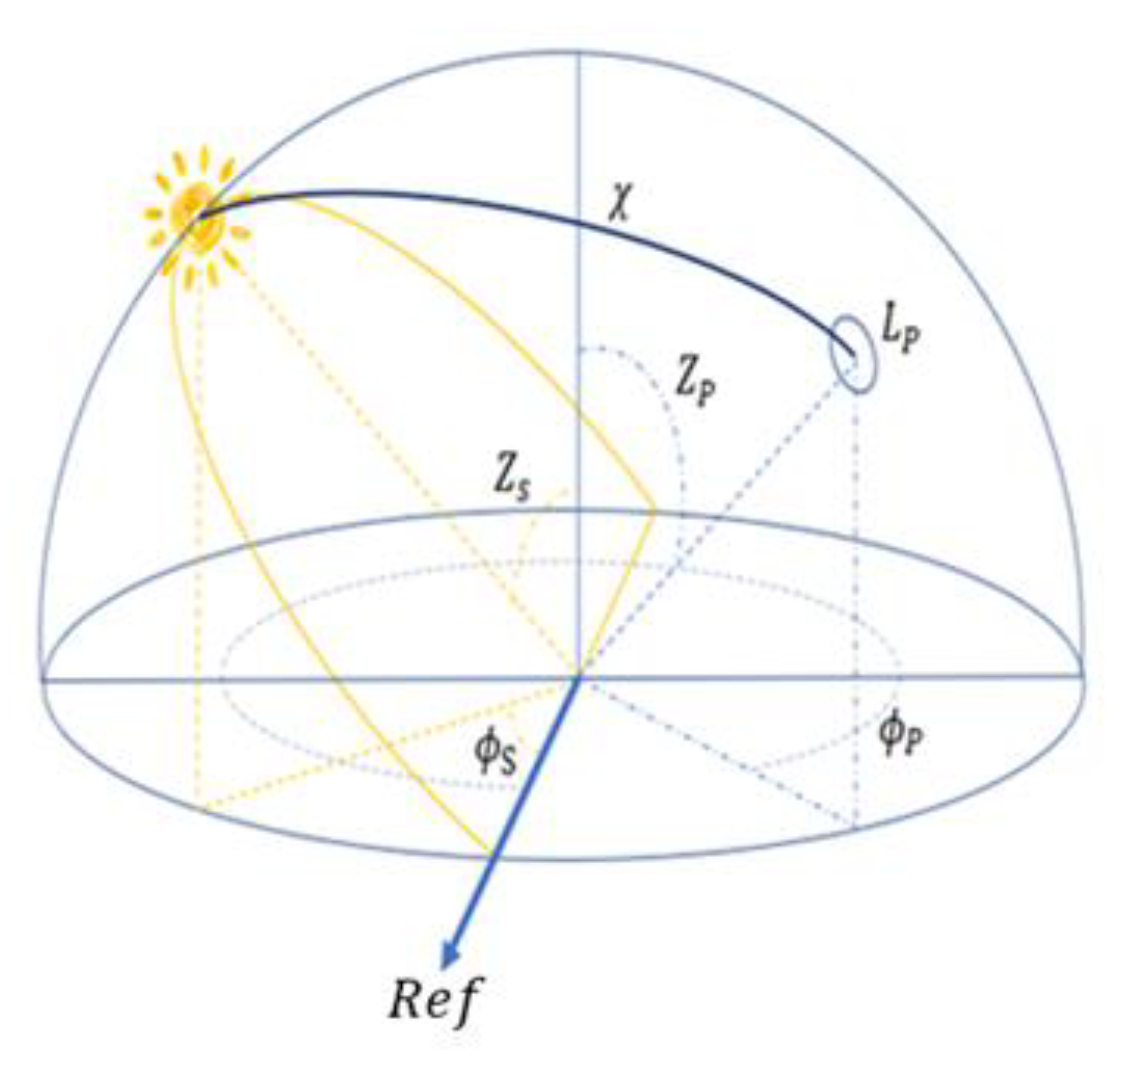
is the dispersion angle, calculated from Equation (12):
where
is the azimuth angle of the sky element, p, and
and
are the zenith and azimuth angles of the sun. The
represents the shortest angular length between the sky element, p, and the sun, as is shown in
Figure 3. Once the luminance in each sky element is known, Equations (7)–(10) can be applied to calculate
,
and, therefore, VSC.
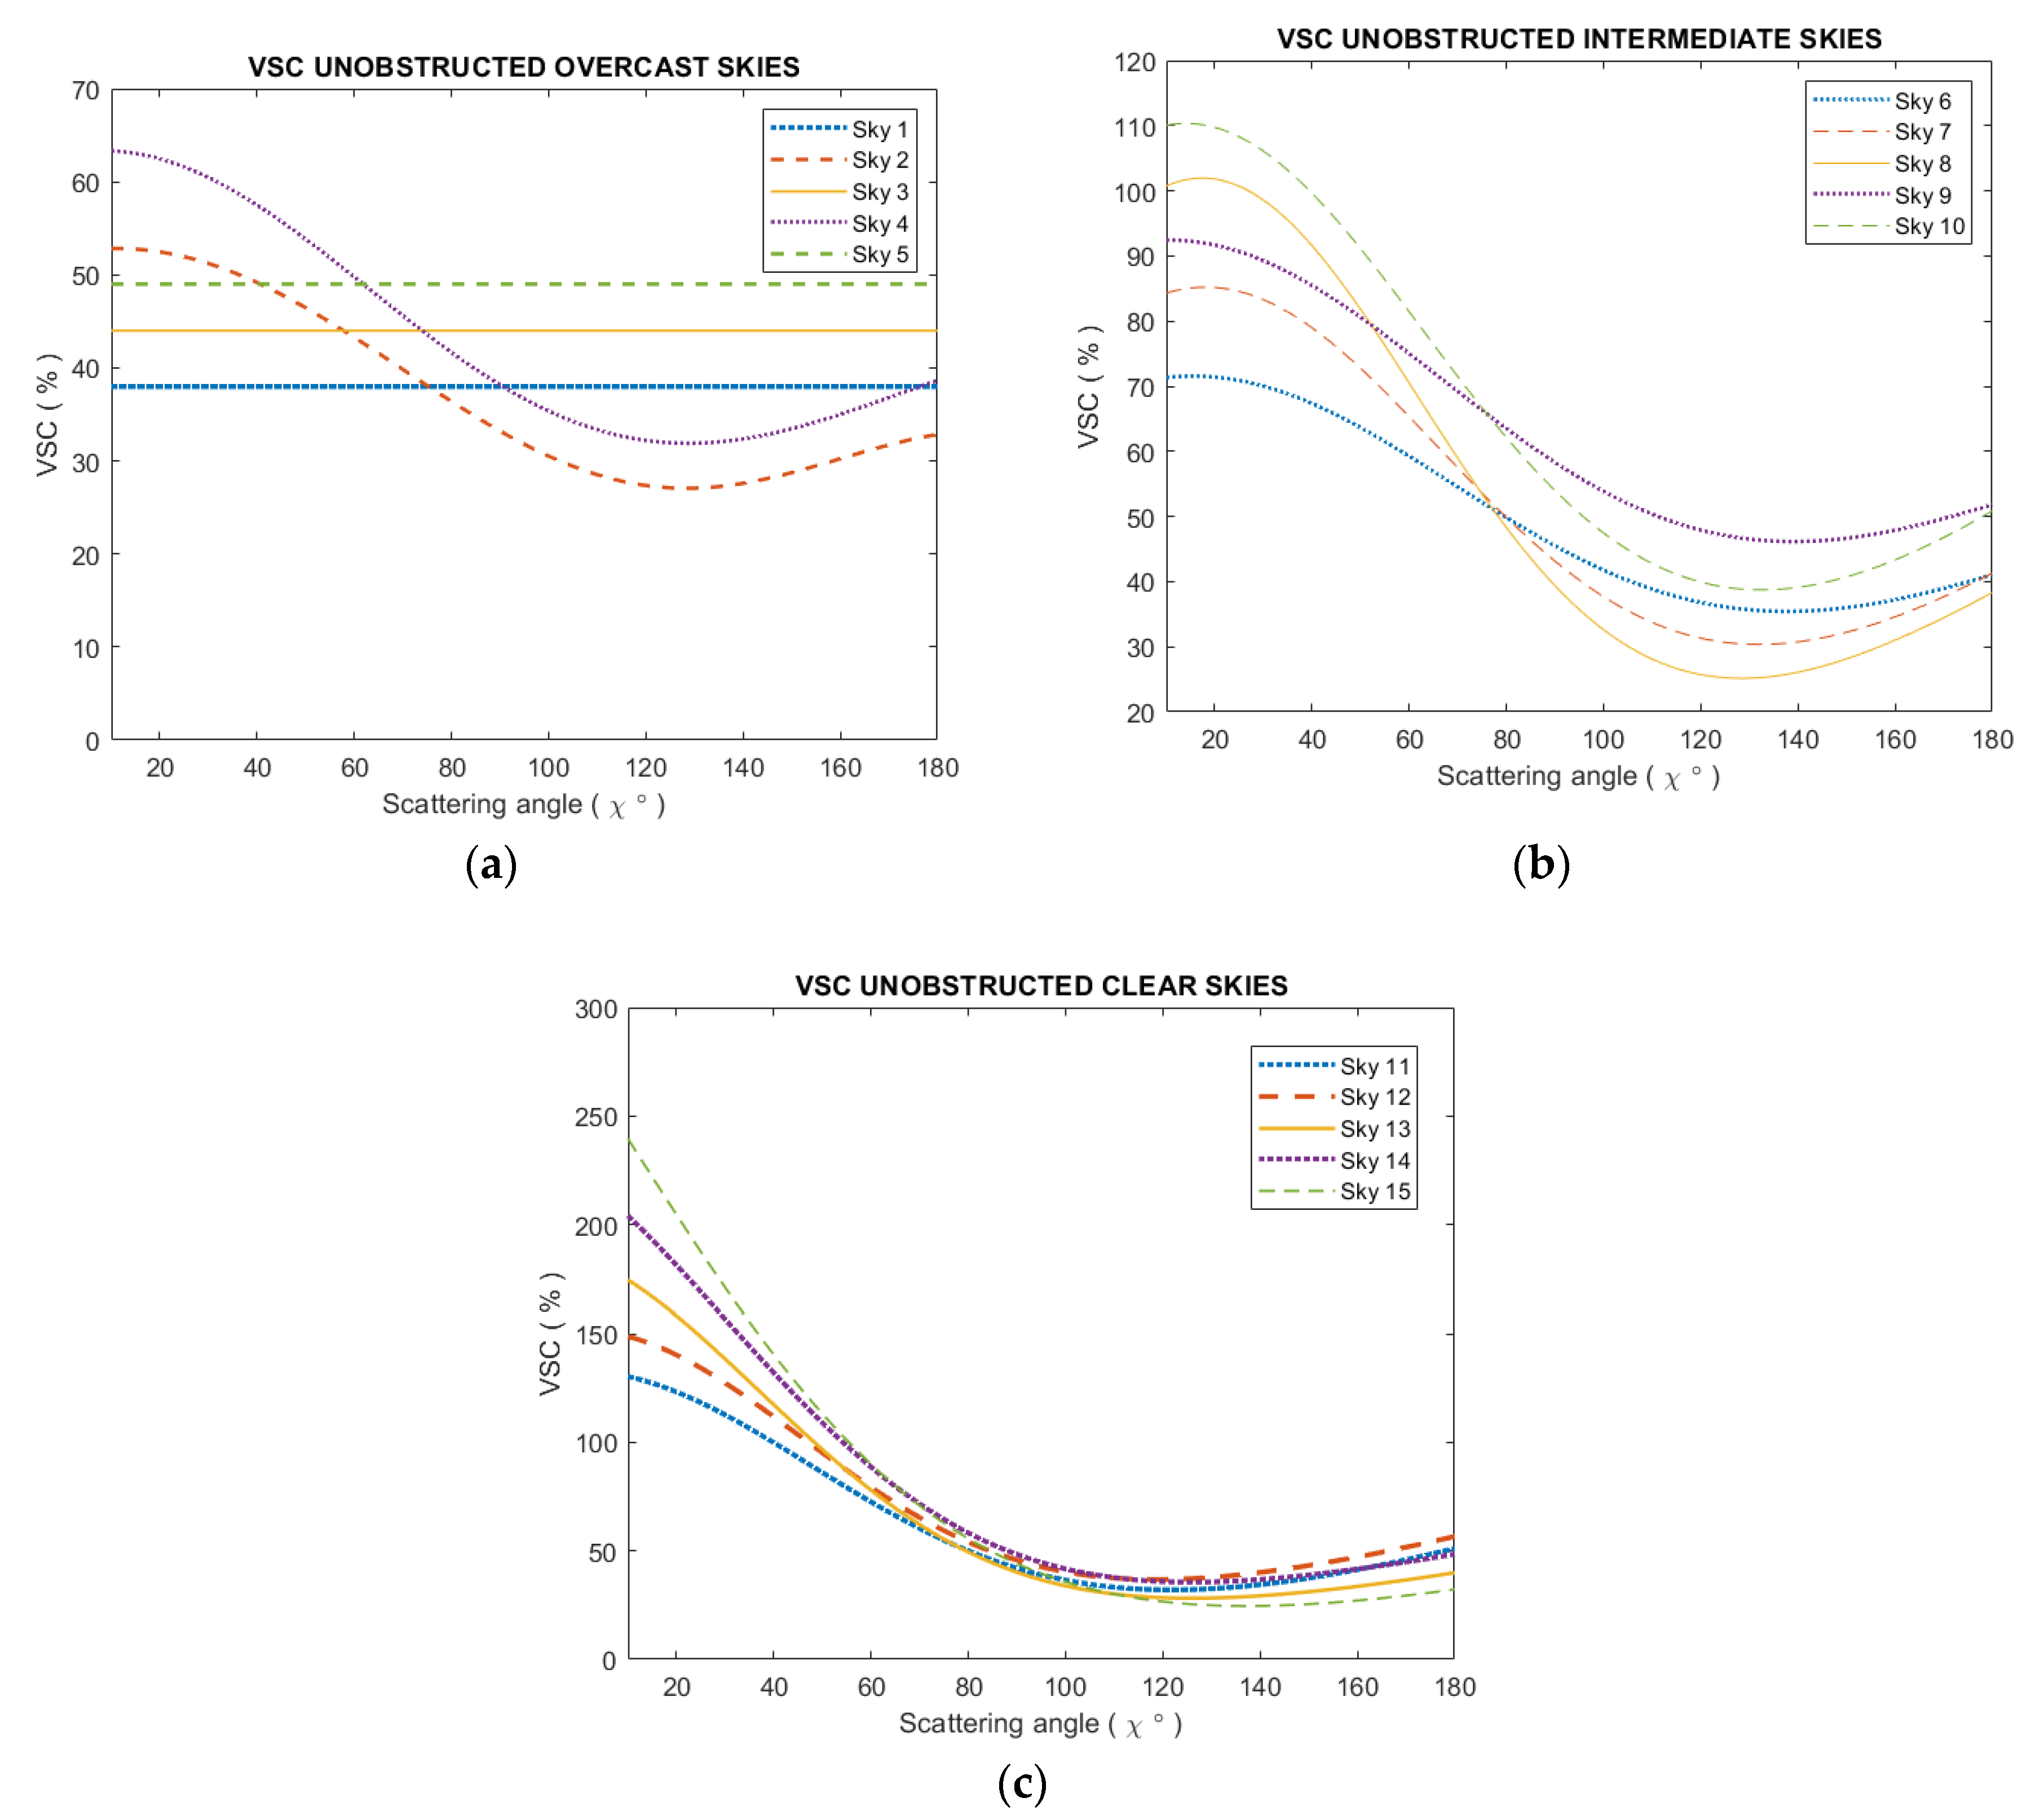
Figure 4 shows the VSC calculation for each CIE standard sky type as a function of the dispersion angle,
As can be seen, sky types 1, 3, and 5 present constant VSC values, regardless of
Therefore, the orientation of the vertical surface has no effect on the level of illumination. The predicted VSC values for these sky types (1, 3, and 5) were 38.5%, 45% and 50%, respectively.
The VSC showed a great dependency on the scattering angle of the other CIE standard sky types, with a minimum value of around 30% and a scattering angle close to 120°, as shown in
Figure 4.
4. Comparative Study of the Different Approaches to Obtain the VSC
Three different procedures to calculate the VSC have been described. In this section, the results of the different approaches to calculate the VSC in Burgos during the experimental campaign will be compared, taking the VSC calculated by Equation (6) as a reference. The comparison was conducted on a half-hourly basis. The two widely used statistical parameters, root mean square deviation, RMSD, and mean bias deviation, MBD, calculated in Equations (13) and (14), respectively, were chosen as indices to assess any differences between the procedures:
Information on the long-term performances of the estimation is given by the MBD. The RMSD indicates the data scattering around the estimation and gives information on the short-term performance.
The calculation of the diffuse illuminance on surfaces of any inclination and orientation is carried out by means of Equations (7)–(10), from the measurements of the sky scanner. An estimation of the error in the calculation of the diffuse illuminance can be obtained comparing the experimental data of horizontal diffuse illuminance,
, and the one that is calculated from the projection on the horizontal surface of the sky luminance pattern obtained with the sky scanner data. The RMSD and the MBD, both for the city of Burgos and for all experimental results of
recorded during the experimental campaign, were 27.14% and −3.8%, respectively. Hence, the use of the sky scanner data from the device used in this study (EKO, model MS-321LR) to determine illuminance on inclined surfaces facing any orientation had an implicit error higher than 25% in the city of Burgos. This error was caused by three main factors. First, the field of wiew (FOV) of the sky scanner (11° as indicated in
Table 1). Secondly, the main assumption of the measurement with the sky scanner: As shown in
Figure 2, it was assumed that the luminance of a sky patch was the value measured in the circumference inscribed within that patch. Thirdly, every scanning time was about 4 min and the measurements were taken every 15 min. Therefore, important variations in sky illuminance may occur between records.
The experimental data of
were obtained from Equation (5). Those values, calculated on the four cardinal facing surfaces, were compared to those calculated as projections on the same surface using the sky-scanner luminance pattern. Both the RMSD and the MBD values are recorded in
Table 5 and, as can be appreciated, are comparable to those obtained for horizontal diffuse illuminance. It can, therefore, be concluded from this study that the use of the sky-scanner measurements, to determine the diffuse illuminance on any horizontal or tilted surface, had an intrinsic RMSD due, mainly, to the technical specifications of the experimental device, near 30%, agreeing with other works [
11].
As has been previously stated, when CIE standard classification is available, the sky luminance distribution can be obtained from Equation (11), and Equations (7)–(10) can be applied to calculate
and, therefore, VSC. In this work, the CIE standard sky type in Burgos was determined between September 2016 and January 2019, following the procedure described in a previous paper [
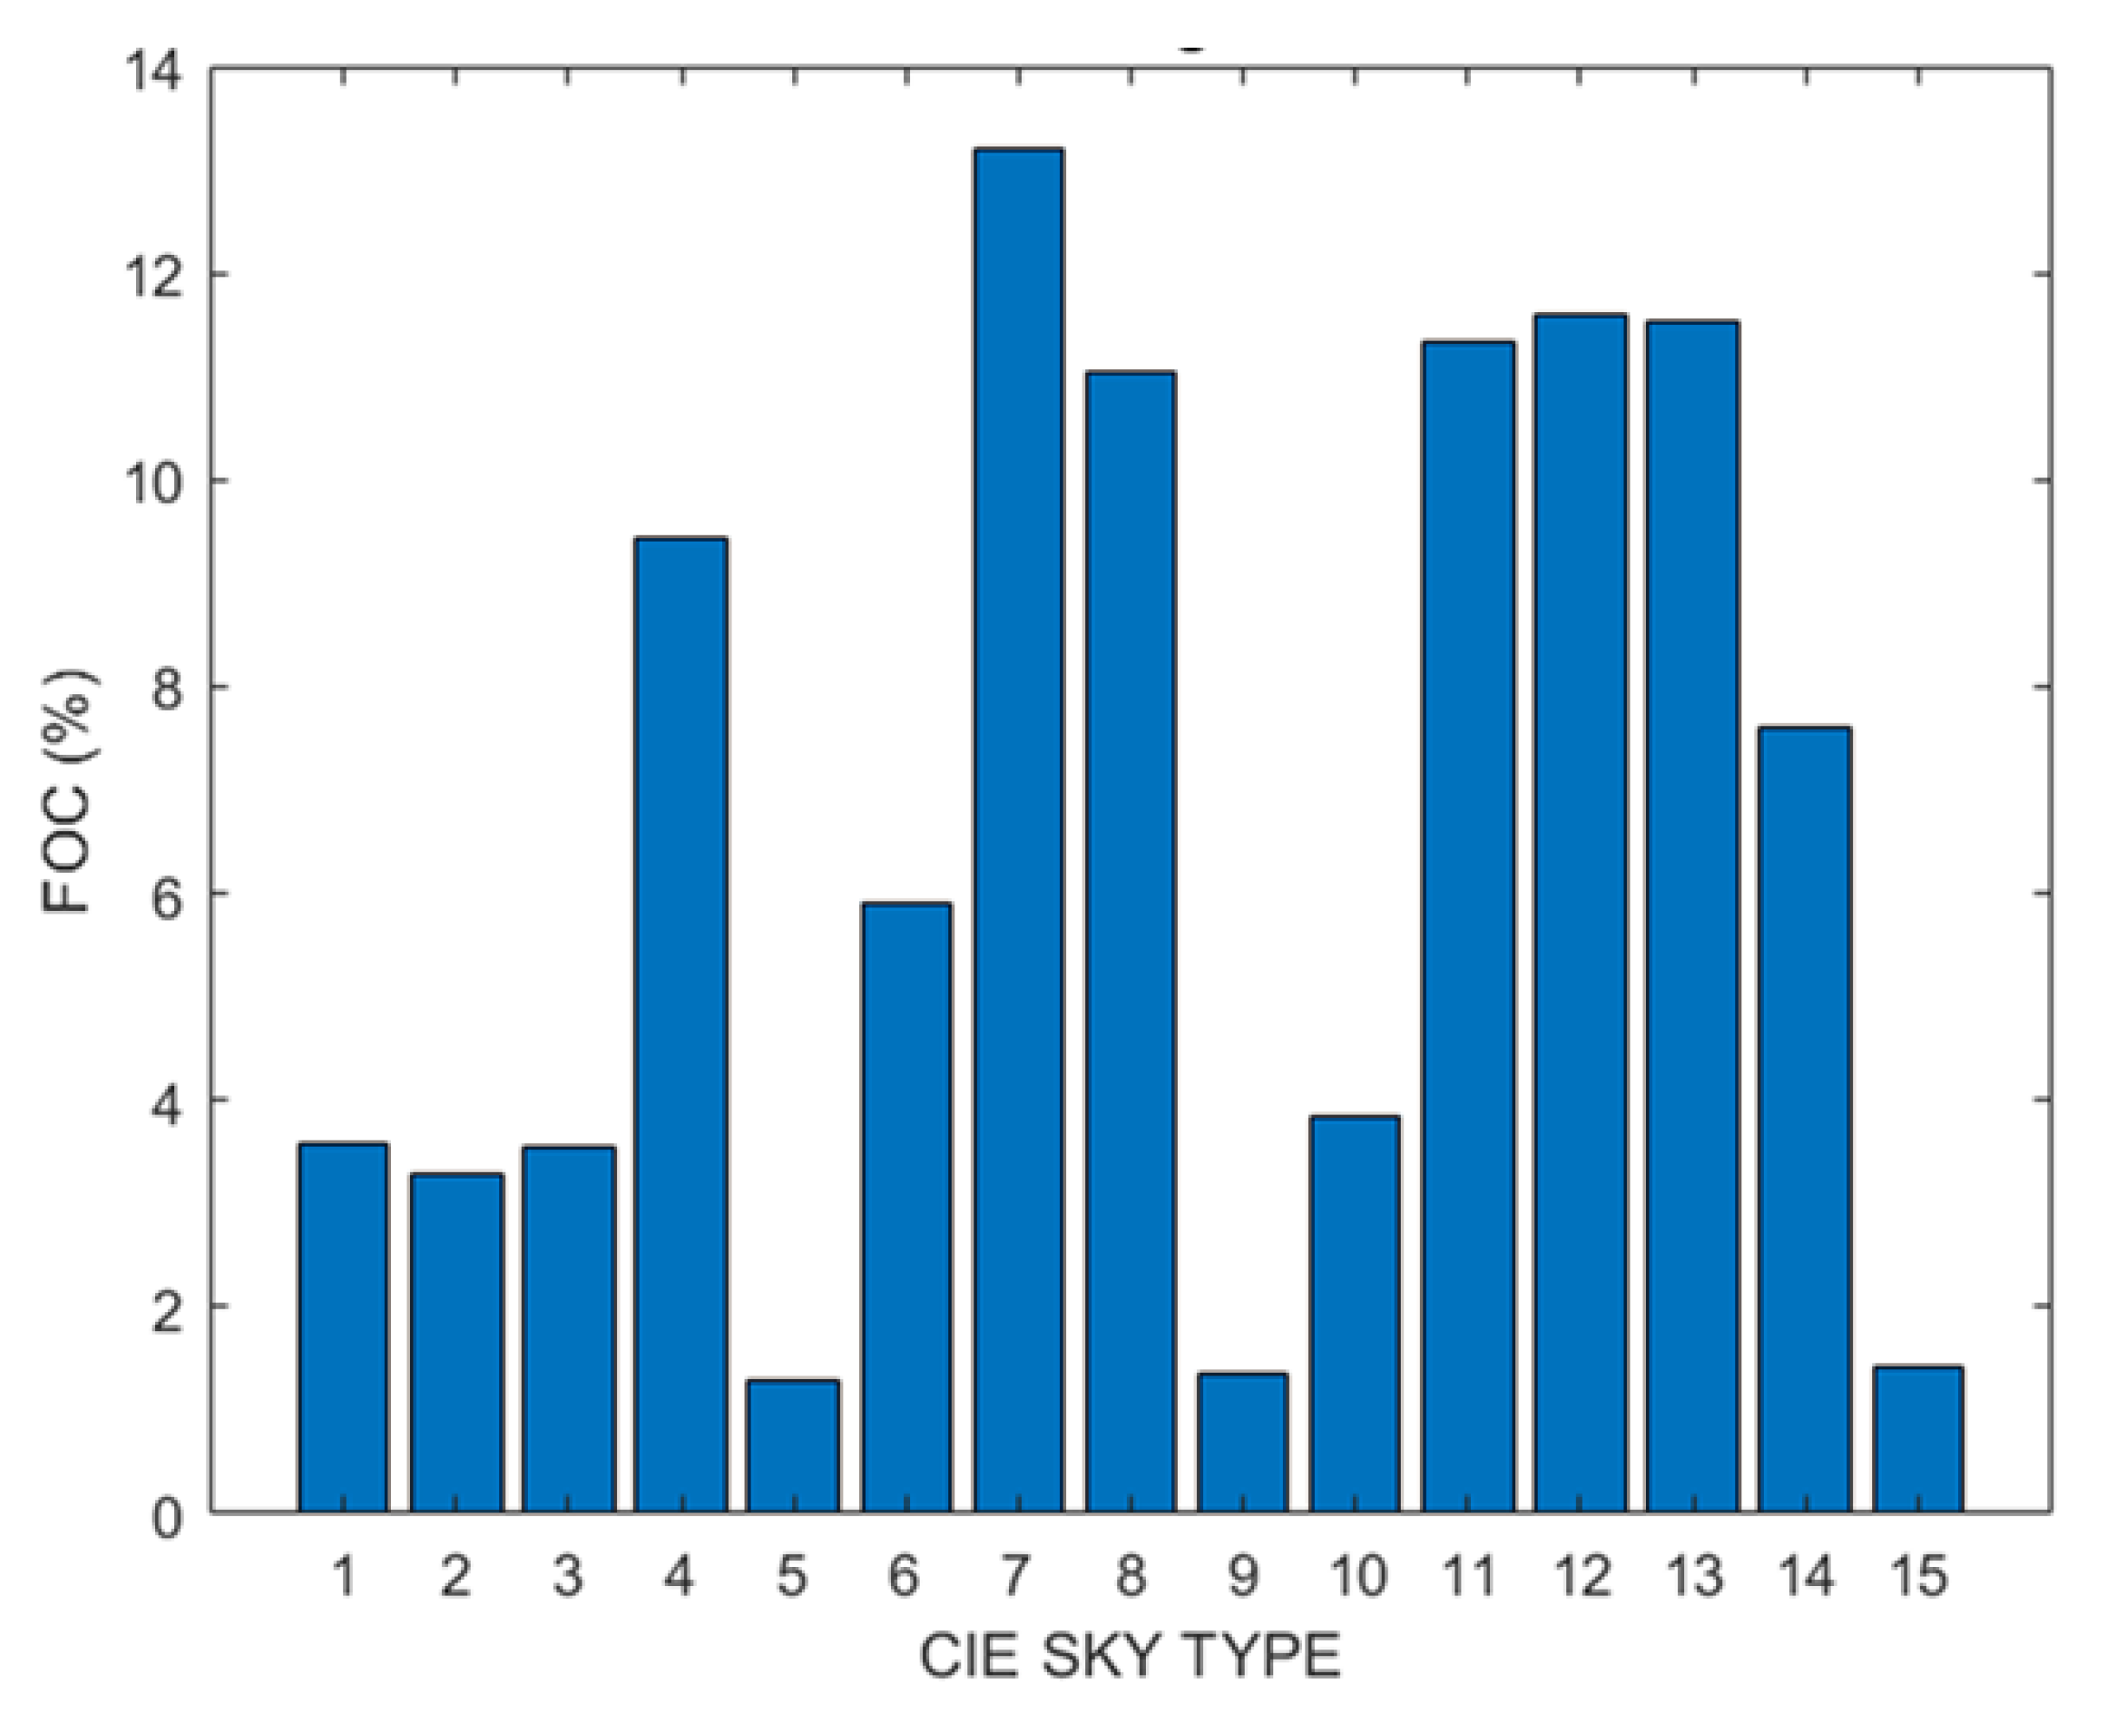
26]. The frequency of occurrence (FOC) of each sky type during the period under study is shown in
Figure 5. As can be seen, all types of CIE standard skies can be found in Burgos. The most frequent sky type was sky 7, (partly cloudy sky, no gradation towards zenith, brighter circumsolar region), with a FOC of almost 13%. Sky types 12, 13, and 11, corresponding to CIE standard clear sky categories, had FOCs of around 11%, similar to the FOC of sky type 8 (partly cloudy sky, no gradation towards zenith, distinct solar corona). Only a category of cloudy sky, sky type 4 (overcast, moderately graded, and slight brightening towards the sun), had a FOC close to 10%, while the FOC values of the other overcast categories were very low.
VSC values calculated from the different procedures were compared, taking the VSC values obtained by Equation (6) as a reference. Both the RMSD and the MBD parameters are shown in
Table 6. As can be seen, for the different vertical surfaces facing the cardinal orientations, the statistical indices ranged between 23% and 32% for the RMSD and between −1% and 16% for the MBD. Both procedures underestimated the VSC, as shown by the negative MBD values. The highest discrepancies between the different approaches were for the east orientation. This observation agreed other works, where the results of different approaches for VSC calculation varied with the different surface orientations [
15].
5. Experimental Characterization of the VSC in Burgos
The experimental values of the VSC calculated from Equation (6) were obtained for the city of Burgos.
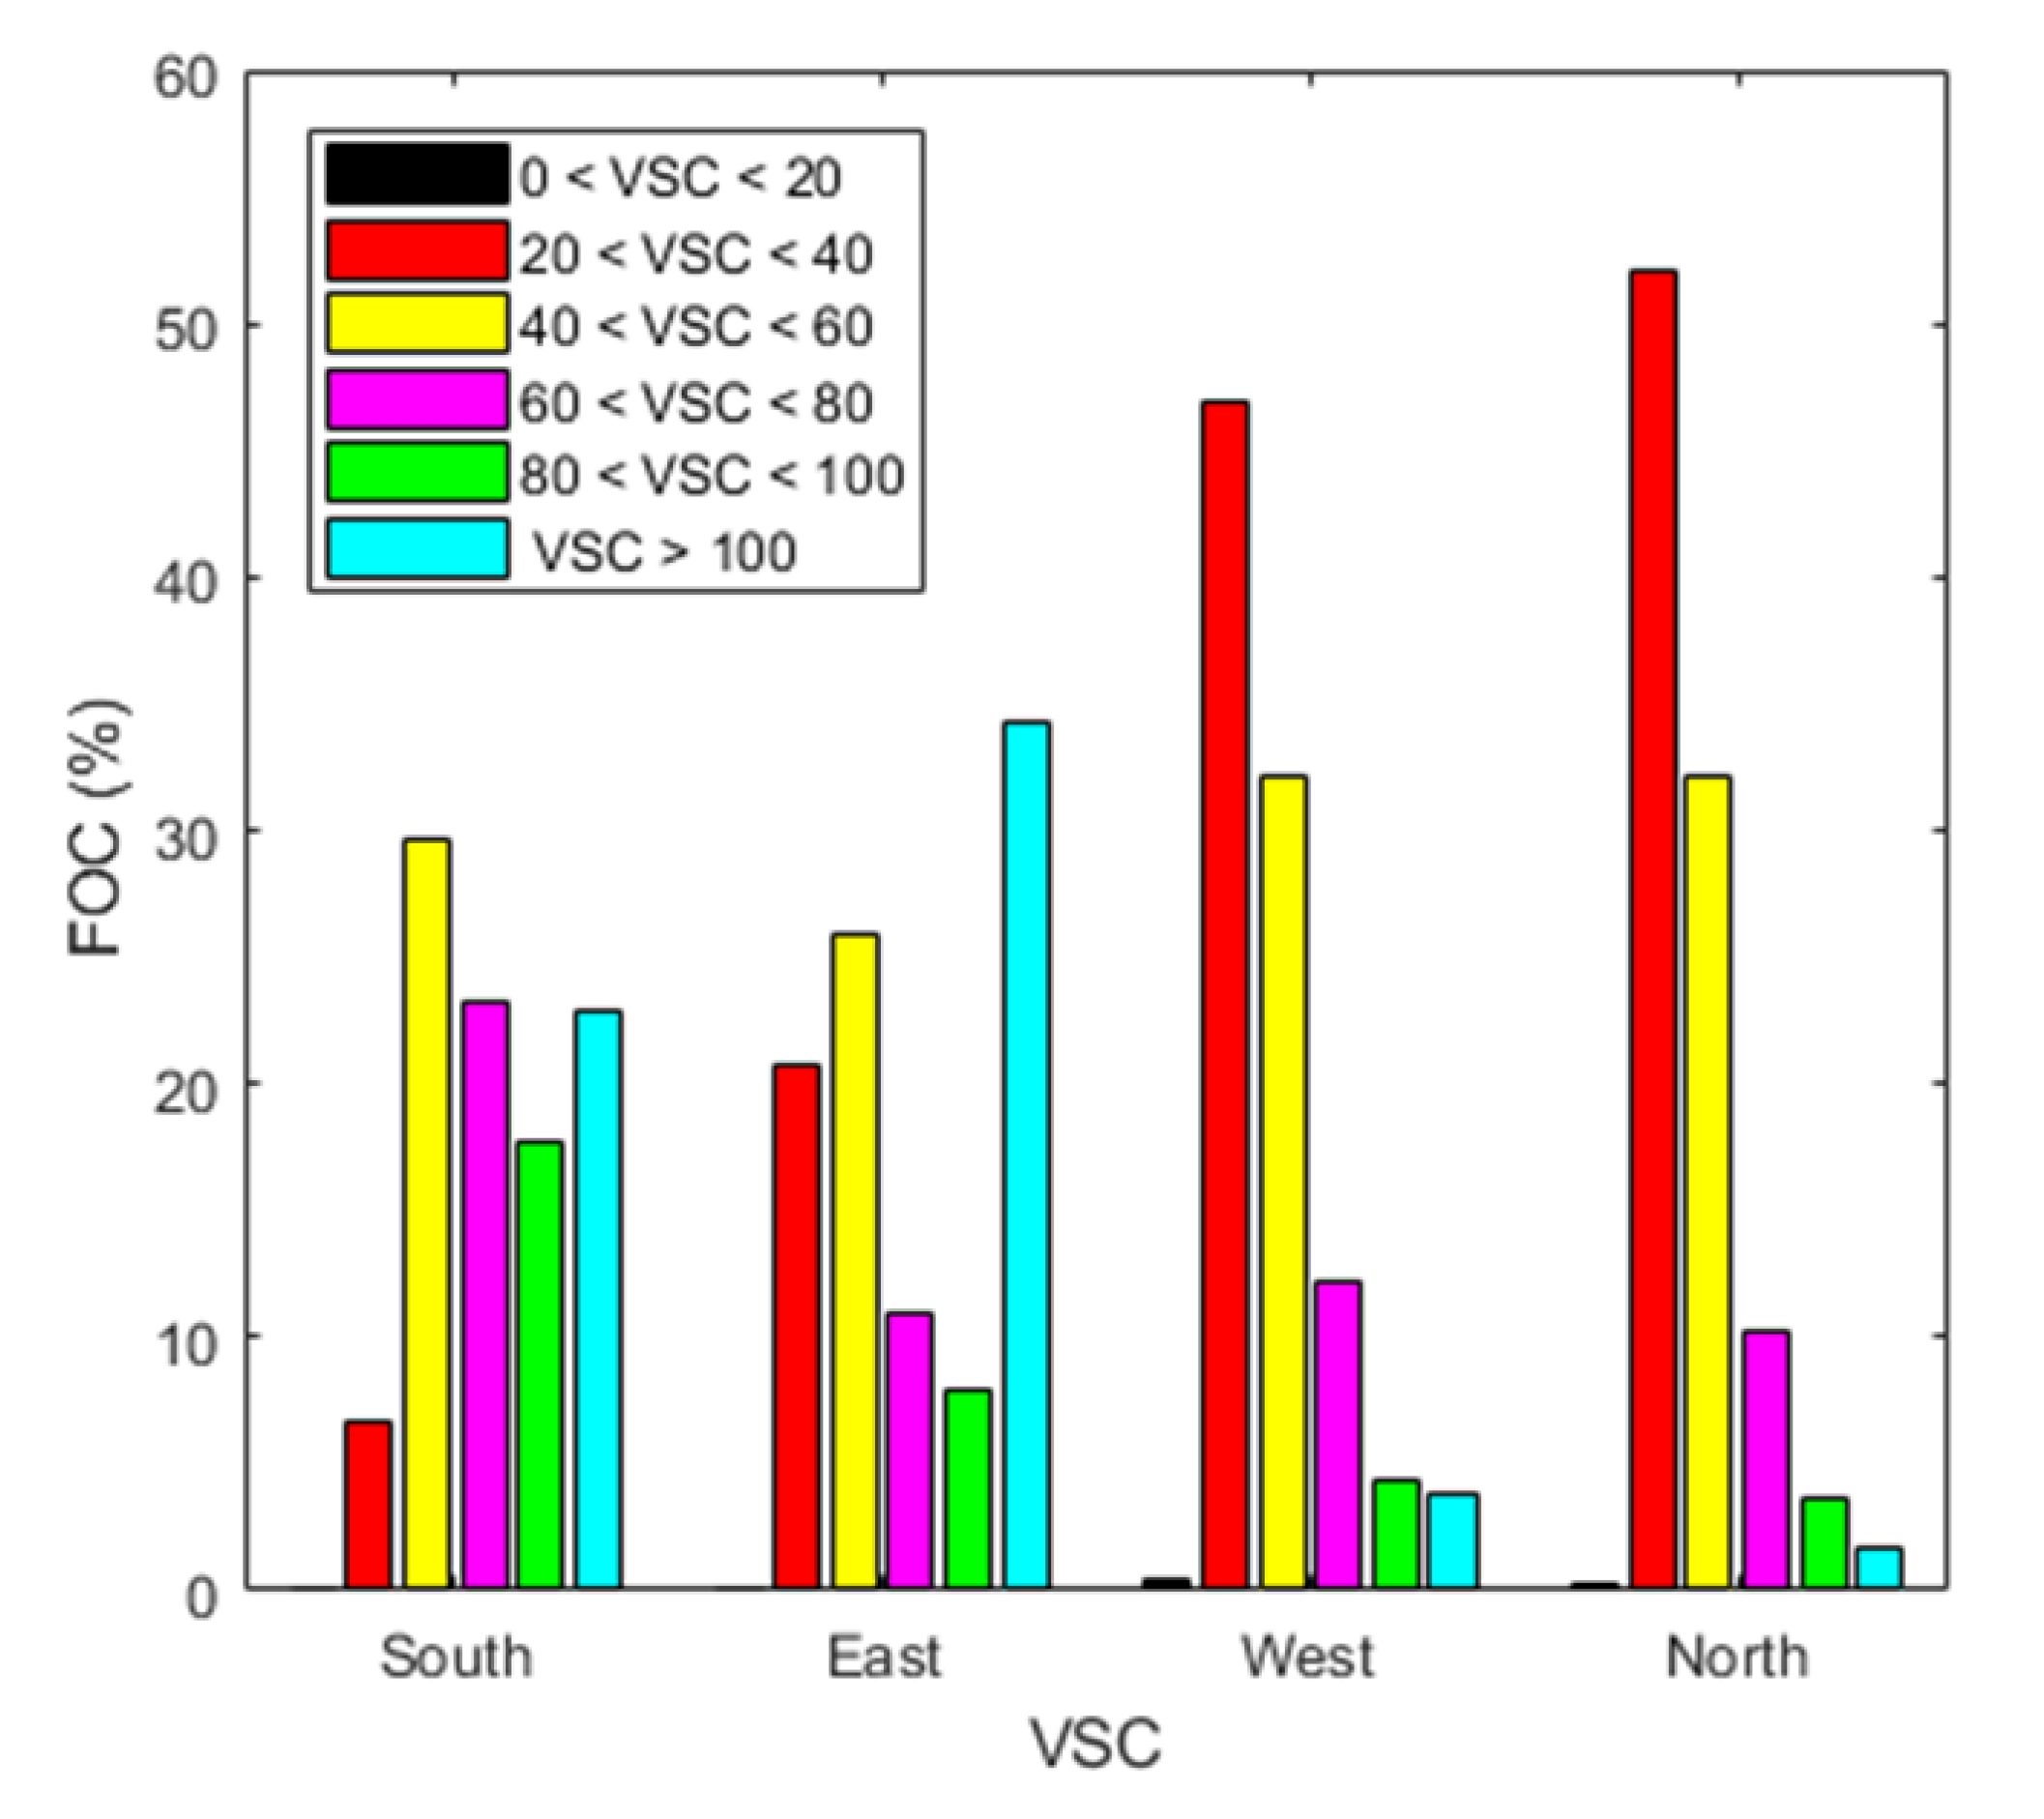
Figure 6 shows the VSC values, classified by intervals, and for the four vertical cardinal orientations. As can be seen from
Figure 6, VSC values lower than 20% were practically nonexistent on surfaces facing the four cardinal orientations. VSC values within the interval between 20% and 40% had high FOC, ranging between 6.74% (south-facing surface) and 52.53% (north-facing surface). The following VSC interval, from 40% to 60%, presented FOC of almost 30% in all four cardinal orientations. VSC values between 60% and 80% could also be found in all cardinal orientations with FOC of 23.4% for south-facing facades and 10.91% and 10.16% for east- and north-facing facades, respectively. VSC values higher than 100% were present in all directions, with greater frequency on the south- (21.94%) and the east-facing surfaces (33.68%).
Building design must take into account the availability of daylighting for proper building and room design factors, such as depth, floor area, glazing surface, and window heights and widths, among others. High VSC values usually result in a greater illumination in interior spaces. Different buildings standards [
43,
44,
45] establish minimum levels of VSC for more effective daylighting [
46]. If the obstruction angle of external obstructions is no higher than 25° above the horizon, then VSC values >27% usually indicate good daylight availability [
14]. It must be noted that the VSC target value of 27% is a figure based on low-density suburban housing models. The daylight and sunlight review states that in an inner-city urban environment, VSC values in excess of 20% should be considered as reasonably good. However, whenever the VSC value falls below 10%, then the availability of direct light from the sky will be poor. As pointed out in
Figure 6, high VSC values are predominant in Burgos in all cardinal orientations.
Table 7 shows the frequency of occurrence of VSC values higher than 27% for surfaces facing the four cardinal orientations.
This study, therefore, shows that the availability of daylight in Burgos is very favorable for integration into the lighting design of buildings. Detailed plans for new city developments accept higher urban density, thereby increasing the difficulties associated with the required levels of daylight. The impact of site layout on daylight conditions, especially in dense urban areas at high latitudes, has been remarked upon by several authors [
47]. High VSC levels mean that even dense urban areas can have good daylighting conditions.
A seasonal study of Burgos VSC conditions was completed using the CIE standard classification for homogeneous skies. Knowledge of the sky type permits the determination of VSC on any surface regardless of its orientation, due to the univocal relationship between the sky type and the illuminance distribution. This approach presents the advantage that CIE standard classification can be done using different procedures that avoid the use of sky scanner devices [
32]. Firstly, the seasonal distribution of sky types in Burgos was determined, as presented in
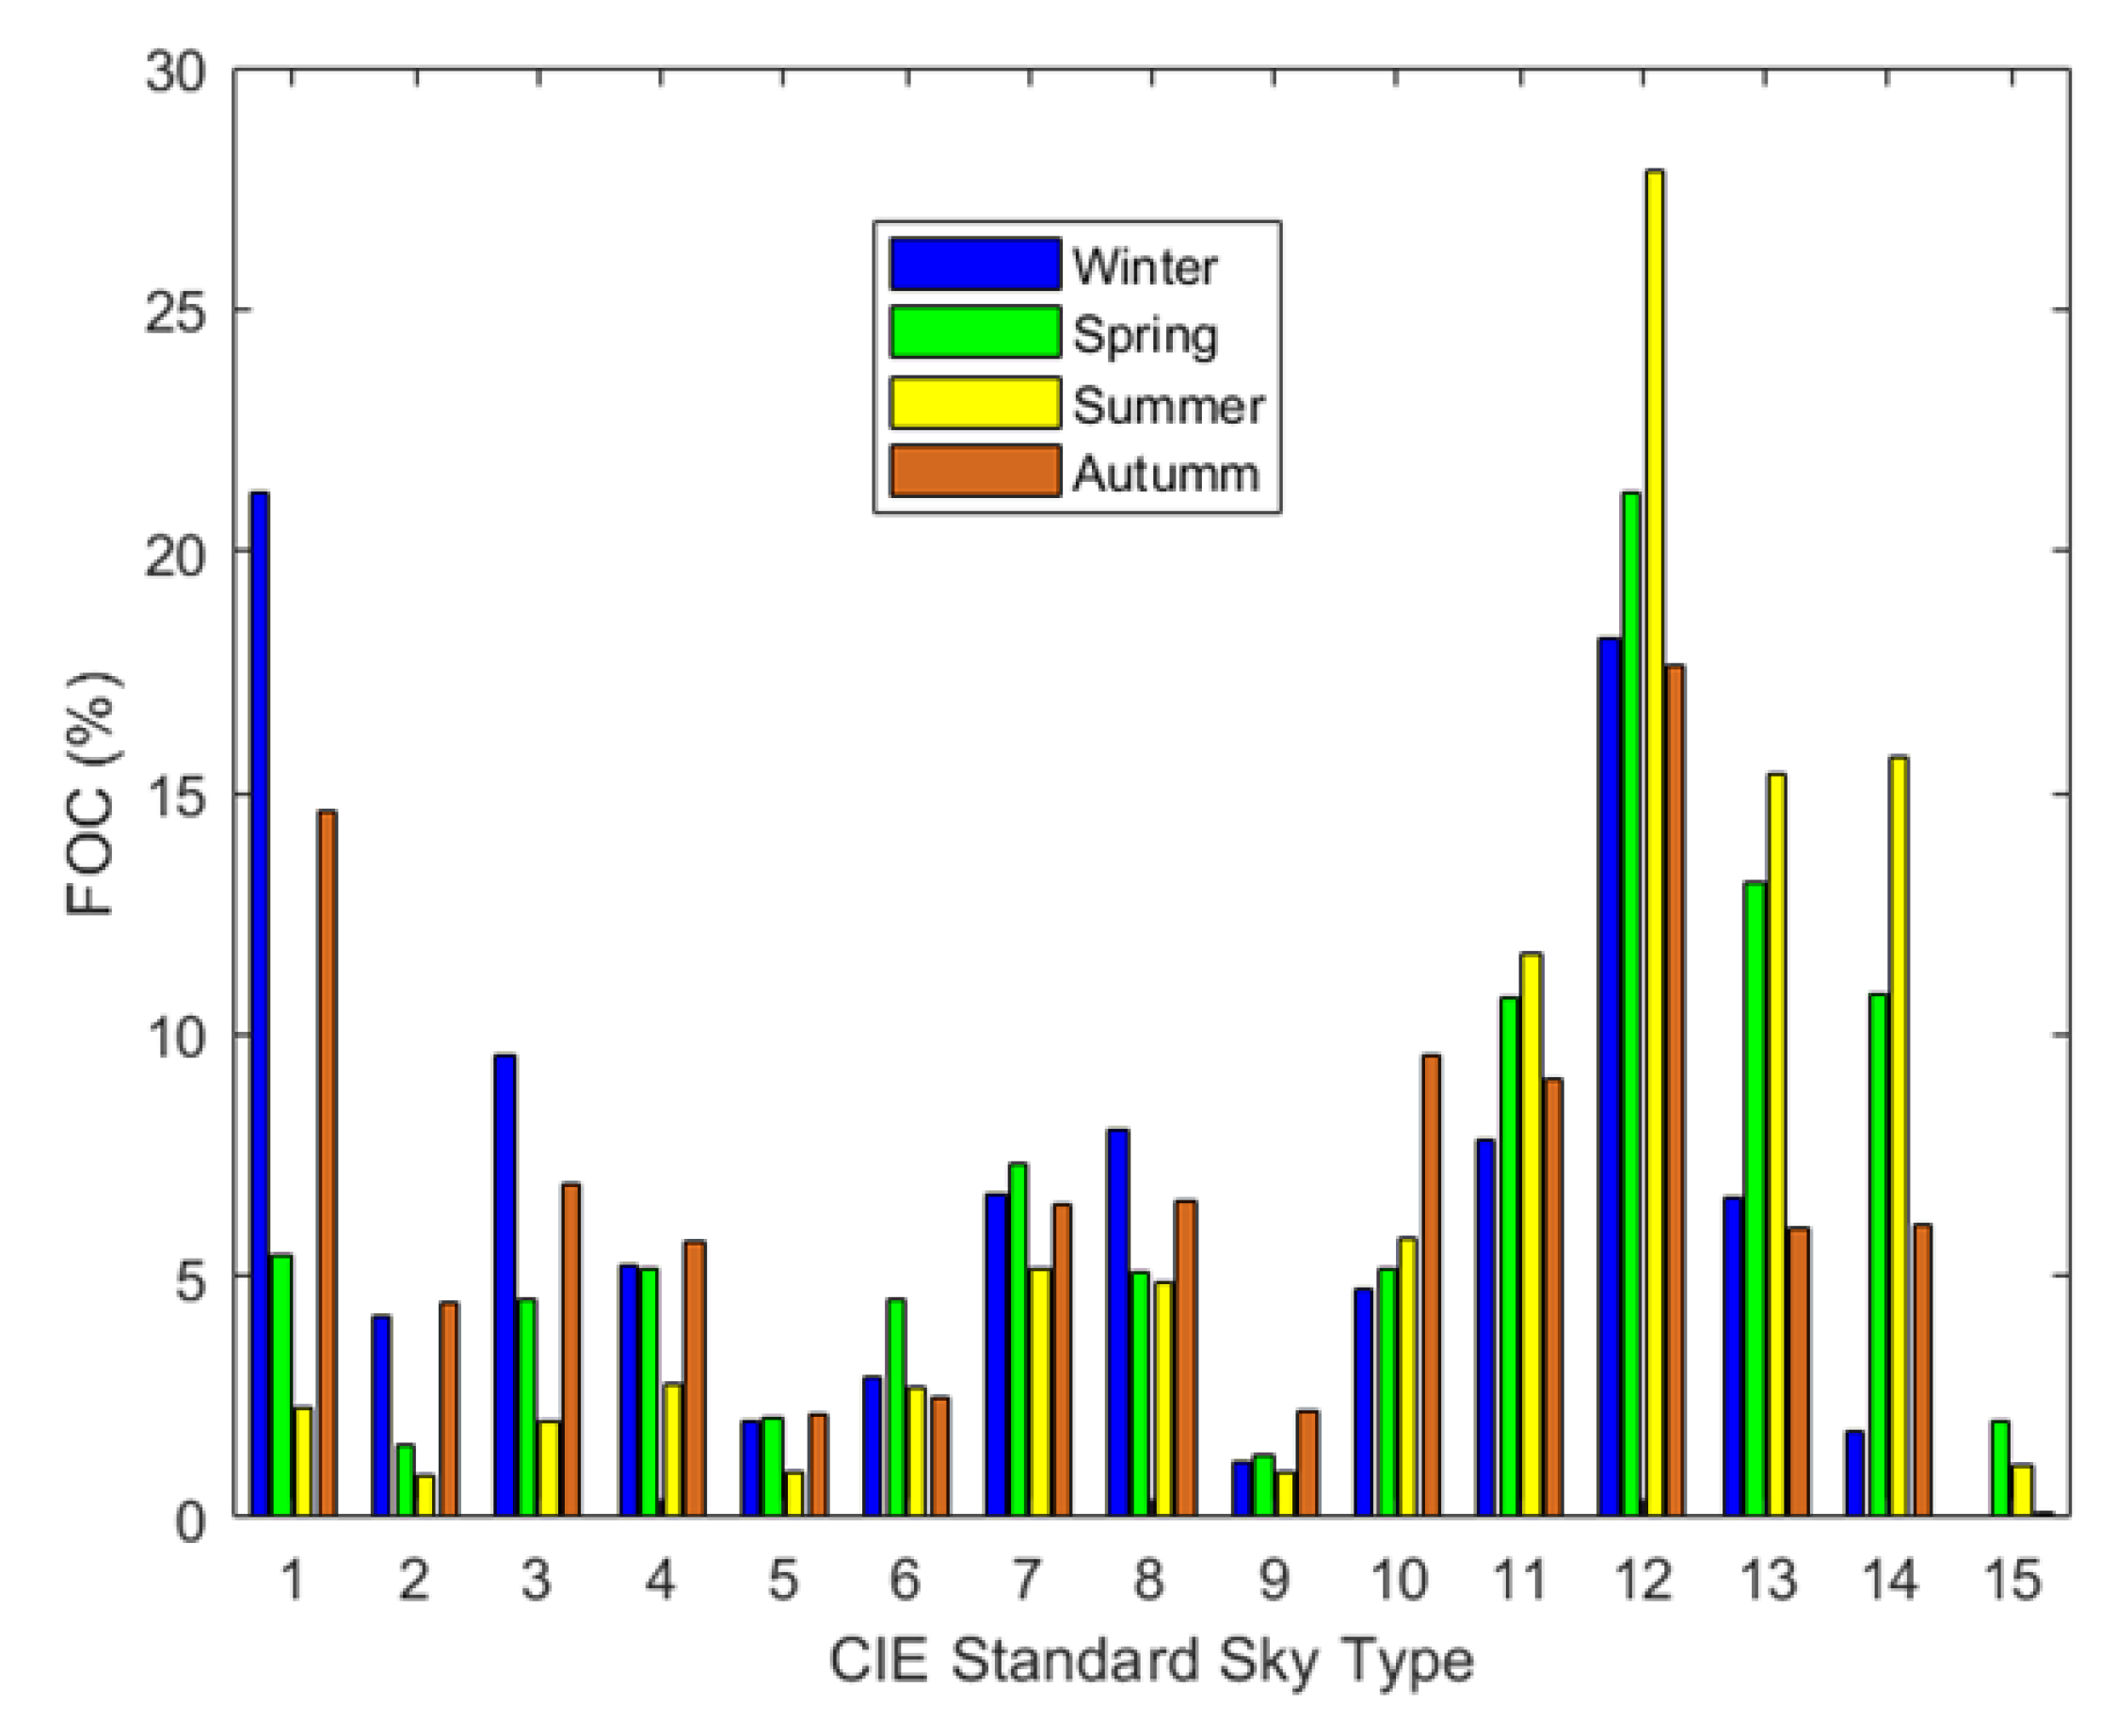
Figure 7. As can be seen, the sky types corresponding to clear sky conditions (11 to 15 CIE standard sky types) presented FOCs ranging from 71.72% in summer to 34.45% in winter. Sky type 12 was the most likely CIE standard sky type, with FOCs of 18.19% in winter, 21.21% in spring, 27.84% in summer, and 17.61% in autumn. Those figures imply VSC values higher than 45%, regardless of the scattering angle, with acceptable daylighting conditions throughout the year for dense urban design.
Sky types corresponding to cloudy sky conditions (CIE standard 1 to 5) are more probable in winter and autumn. Sky type 1 has the highest FOC (21.17% in winter and 14.63% in autumn) in the cloudy sky type group, while sky type 5 shows FOC lower than 2.5% throughout the year. There is, therefore, a very low probability that the VSC will be lower than 25% (minimum value of VSC corresponding to sky type 2 with a scattering angle of 120°). The FOC of partly cloudy sky conditions (CIE standard type from 6 to 10) was homogeneous throughout the year, ranging from 19.33% in summer to 27.29% in autumn. This result confirms the availability of daylighting in Burgos and agrees with the previous VSC calculations.
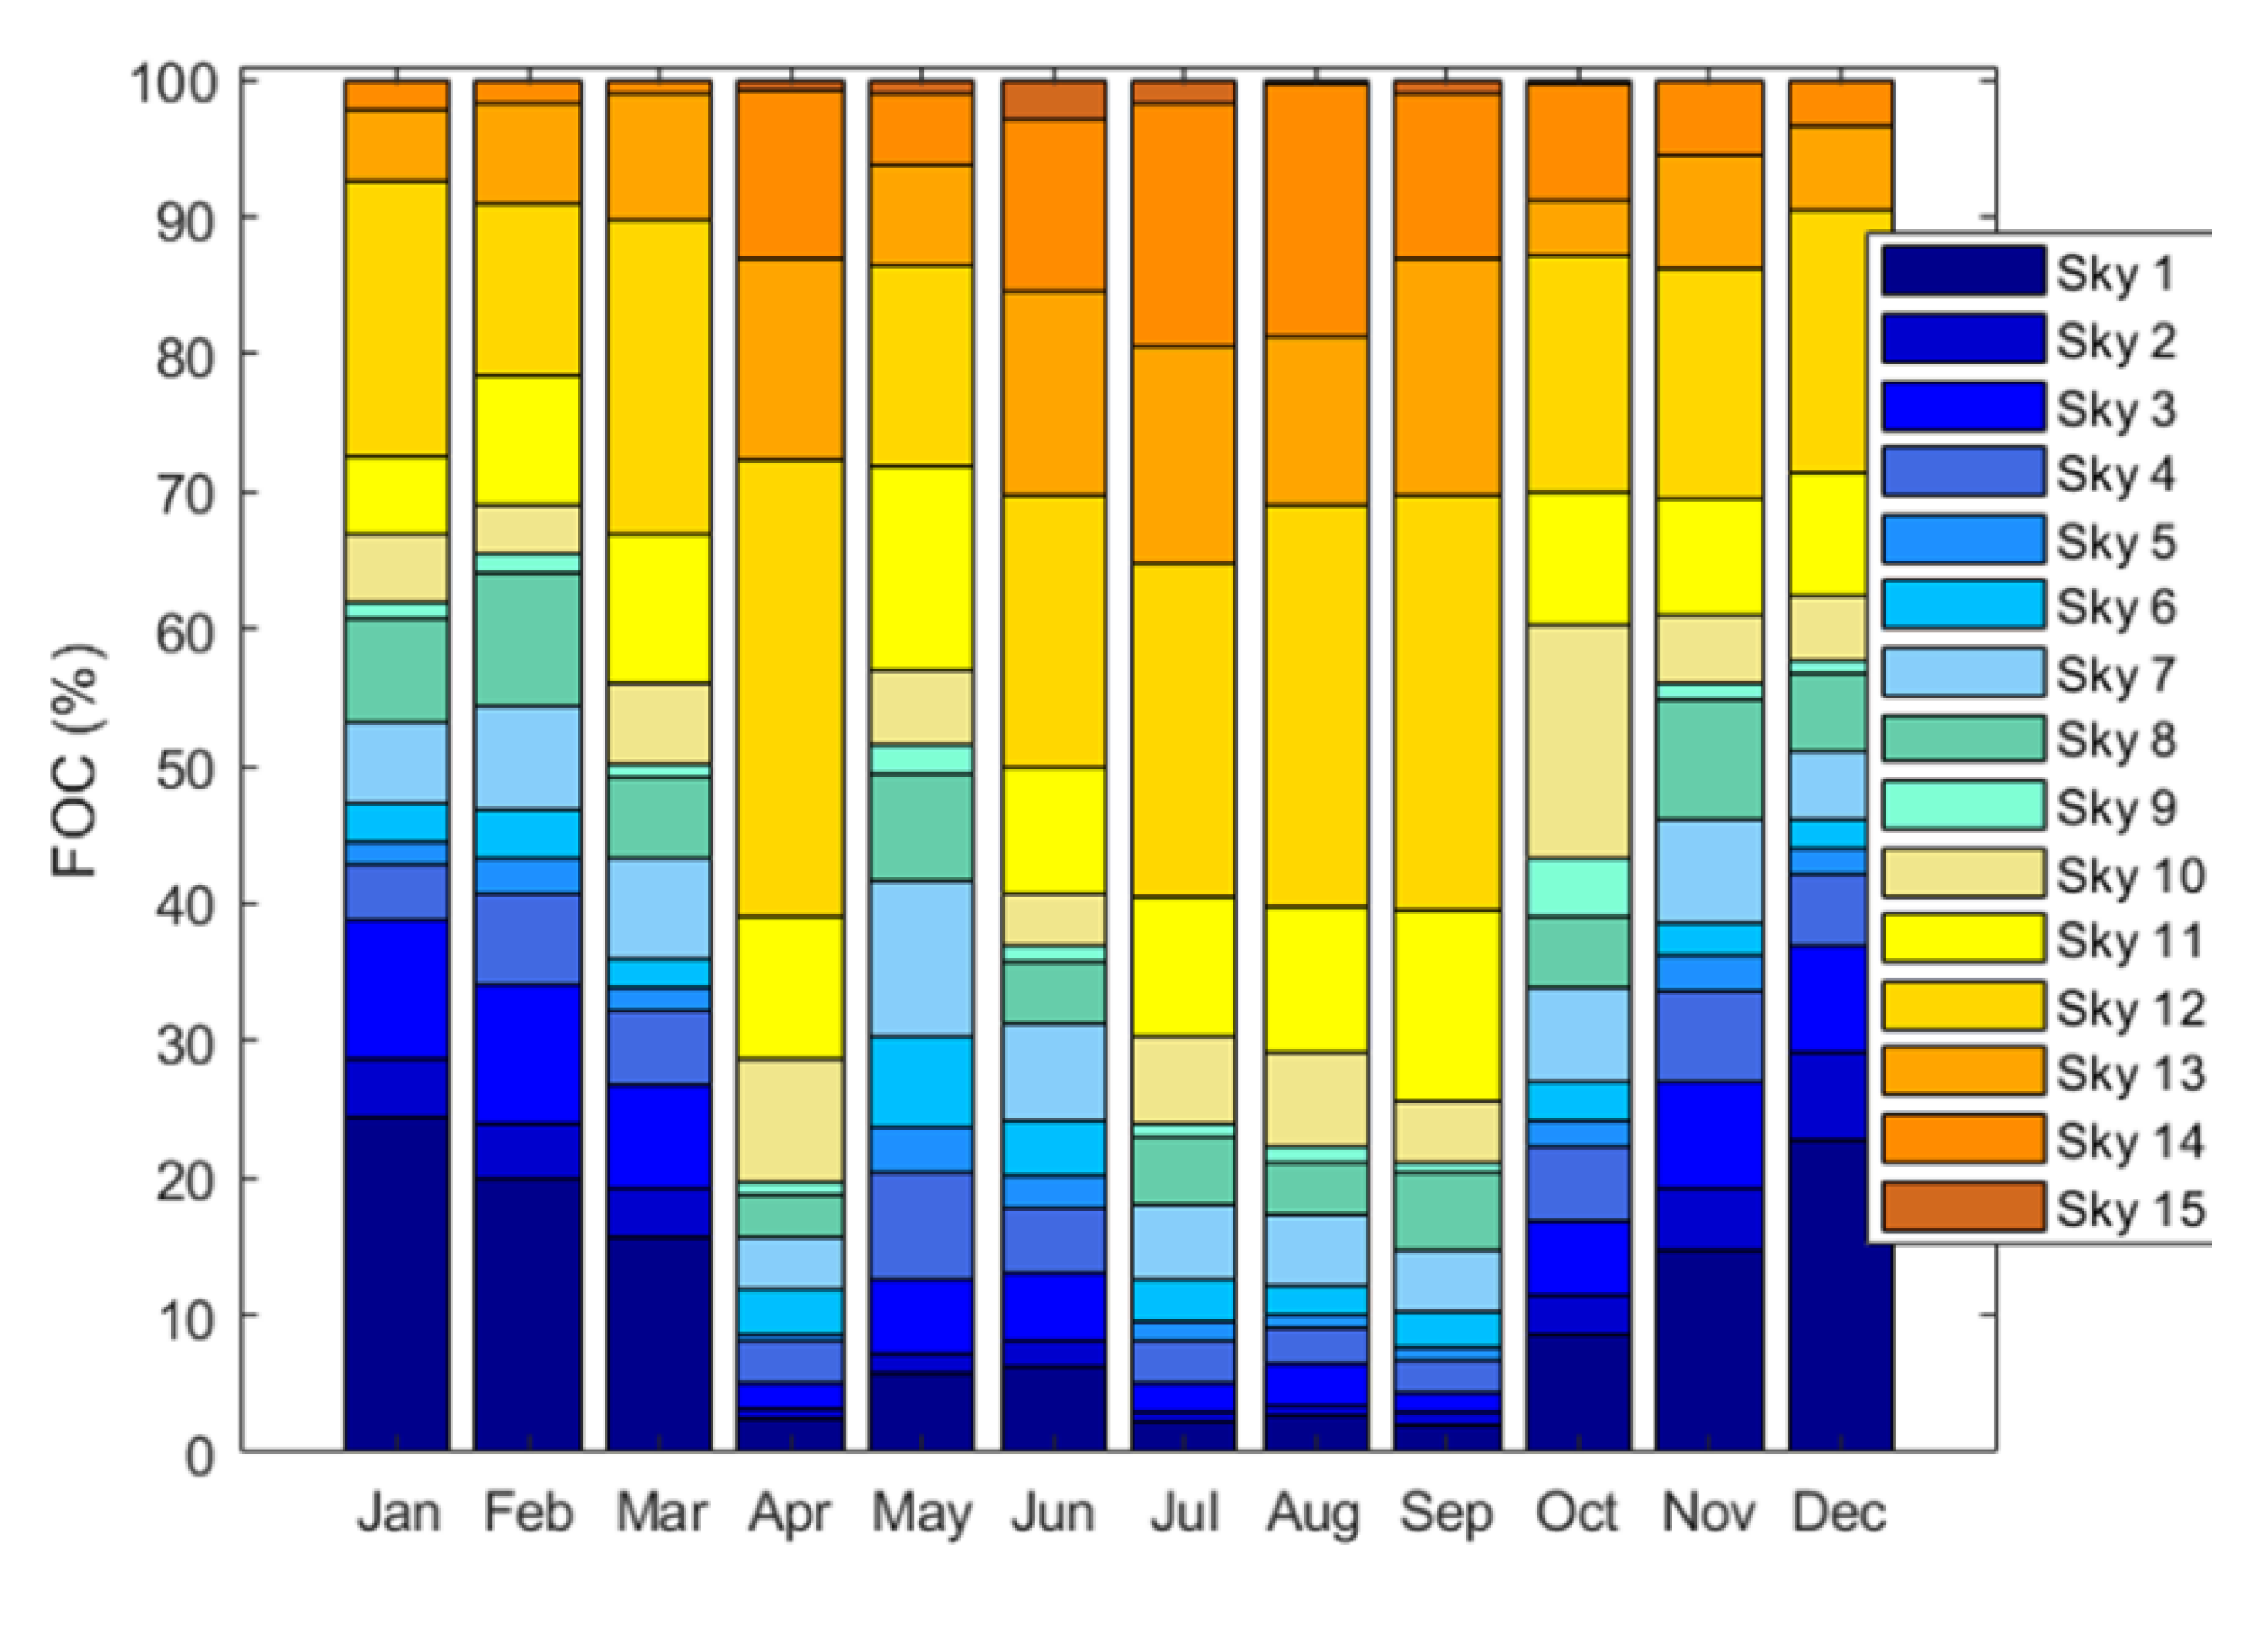
The monthly CIE standard sky classification is presented in
Figure 8. The FOC of each clear sky type is highlighted in
Figure 8, mainly from April to September, confirming that VSC values higher than 27% were obtained throughout almost all the year.
6. Conclusions
VSC is a useful index of daylighting availability for acceptable urban design in modern cities. There are very few studies on this parameter and its temporal distribution due, mainly, to the scarce experimental data available around the world. In this study, different methodologies for obtaining VSC were compared and an extensive campaign of measures was carried out over more than two years. Taking the VSC value calculated with luxmeter measures as a reference, the use of the sky luminance distribution from the CIE standard classification for homogeneous skies, and the one measured from a sky scanner have shown comparable RMSD values, lower than 30%. This fact shows the equivalence of both approaches for calculating VSC for surfaces facing a given orientation. The use of the CIE standard classification presents the advantage that it can be obtained from different procedures, different from the use of sky scanners, as various studies have shown.
Values of diffuse illuminance on horizontal and vertical cardinal-oriented surfaces calculated from the sky scanner device used in this work (model MS-321LR) implied an intrinsic RSMD, in comparison with the measured data from the luxmeters that ranged between 21% and 31%. The main discrepancies between the VSC values calculated from the luxmeter measures and those obtained from the sky illuminance distribution were due to the technical specifications of the sky scanner device. Therefore, the use of more accurate devices could decrease the error made by equivalent procedures to the same extent. In the study, neither climatic nor geographic variables were used, so the results are perfectly extrapolated to other locations.
The VSC in Burgos, Spain, was calculated in a measurement campaign lasting 29 months, between September 2016 and January 2019. During that period, VSC values lower than 20% in the four cardinal orientations were practically nonexistent and values between 20–40% were of greater probability. Values between 40% to 60% had FOC of almost 30% in all cardinal orientations and both the south- and the east-facing orientations presented FOC in the interval 60–100% of 20% and 10%, respectively. It means very good conditions for daylighting availability in accordance with the most common European Building Standards.
VSC values of >27%, considered by different standards as representative value for acceptable daylight levels, present FOC values ranging from 87% to 99%, so efficient city and building design could lead to significant energy savings for lighting, as well positive effects for occupant health and well-being. VSC values higher than 100% were found in all cardinal orientations, more probably on east- (FOC 30%) and south- (FOC 20%) facing vertical surfaces, showing the high energetic and luminic potential of those orientations without underestimating the potential of the north and west facades, usually less considered for an energy-efficient design of buildings.

 and
and 


