1. Introduction
Phase-sensitive optical time-domain reflectometry (Φ-OTDR), a kind of optical time-domain reflection technology, can respond to vibrations applied to any point along a fiber and demodulate the key information of the target events through the backscattered light. Given the characteristics of long-distance, high-sensitivity, high-stability, and full-scale monitoring of Φ-OTDR, it is widely used in fields like perimeter security, pipeline monitoring, seismic monitoring, and structural health monitoring [
1,
2]. As both a transmission medium and sensor, the application of optical fibers will develop more rapidly in the era of 5G and big data. In the field of intrusion monitoring, lots of research has been conducted in the laboratory or other ideal environments. However, in practical environments, the monitoring signals are nonlinear, nonstationary, and easily interfered with by strong noise [
3]. Furthermore, the fading effect makes it more difficult to denoise and recognize the signal. The fact that the phase measurement noise is different across the different trace positions implies that the measurements present a spatially varying sensitivity along the fiber. These problems still hinder the development of Φ-OTDR for practical applications.
The fading effect is a phenomenon that takes place during detection using a Φ-OTDR system, where the scattered light falls into the dead area of the measurements and the light intensity makes it difficult to allow for signal analysis. The fading effect makes it difficult to allow for the effective detection of the signal at some points and obtain the waveform characteristics of the time-domain detection. Therefore, it is impossible to locate and identify the event in time. So far, a large amount of work has focused on this problem. Xinyu Fan proposed a method based on time-gated digital optical frequency domain reflectometry and a novel vibration-locating method using statistical analyses of phase-change signals [
4,
5,
6]. There have also been some studies that used frequency division multiplexing and other methods to suppress the fading effect [
7,
8,
9,
10,
11].
Due to the high sensitivity of the Φ-OTDR system, the detected signal is mixed with different kinds of noises. The intensity of the noise signal is often similar to, or even larger than, the target signal. It causes the target signal to be submerged, meaning it is difficult to effectively extract and represent valid information in the signal. Furthermore, the monitoring data can generate more than 2 GB of storage files per second at a high sampling frequency, which makes most of the methods difficult to use in real time. Considerable research efforts have been devoted to avoiding these problems, but this is typically at the expense of increasing the system computational load or sacrificing the sensing performance [
12,
13]. Zhen Zhong used the fitting method to eliminate the noise’s impact [
14]. A novel location scheme proposed by Qin Li et al. requires a lot of calculations when presented with large amounts of detection data [
15]. Yuheng Tong proposed a method based on the ultra-weak Bragg grating, which increased the hardware burden [
16]. The method based on deep learning models requires very demanding computing conditions and very high computing times [
17,
18], which like the black box, is not conducive for researchers to analyze the nature of the Φ-OTDR issues.
Despite this, these studies have either increased the number of computations by switching calculations to the frequency domain or by using statistical calculations, or have increased the cost of the hardware to achieve the aim of suppressing the fading effect and improving the performance of Φ-OTDR. The above studies have not specifically studied the enhancement of signal characteristics and the improvement of computing efficiency simultaneously. No significant effective method has been found previously that can improve the location and recognition accuracy of events while ensuring the computing efficiency. This paper proposes an integrated method based on complete ensemble empirical mode decomposition with adaptive noise and Kullback–Leibler divergence (CEEMDAN-KL) and adaptive moving neighbor binary pattern (AMNBP). This method addresses the problems of non-stationary, highly sensitive, and fading practical signals monitored using the Φ-OTDR system. For the non-linear signal collected by the Φ-OTDR system in a practical environment, CEEMDAN-KL is used to reduce the noise and to reconstruct the signal. Compared with empirical mode decomposition (EMD) and machine learning methods, CEEMDAN-KL solves the problem of the modal aliasing of EMD and significantly reduces the number of iterations [
19,
20]. Through the calculation of the distribution difference between each intrinsic mode function (IMF) and the original signal, the most similar IMFs are selected to reconstruct the signal with better characteristic information. After the enhancement of the signals, the encoding sequence with the adaptive AMNBP algorithm reduces the signal dimension and preserves the differentiation information. AMNBP originates from an image processing method local binary pattern (LBP) [
21,
22], which is applied to the Φ-OTDR sensing system first. The reconstructed signals are dimensionally reduced and segmented through a custom window, and each window corresponds to four bits of binary code. By comparing the average value of the window and the means of each group, we can obtain the corresponding codes without the impact of abnormal data. After the adaptive gain adjustment, the key information in the signals is retained, thereby achieving the rapid positioning and accurate identification of events. The AMNBP is very suitable for the requirements of huge data volumes, fast response, and low signal-to-noise ratio (SNR) of the Φ-OTDR sensing system.
By adopting this method, the Φ-OTDR sensing system obtained excellent experimental results. Three kinds of typical events and background noise were used for the experiments. Compared with the time–frequency analysis method and the radial basis function (RBF) method based on wavelets [
5,
17], this integrated method significantly improved the average accuracy to 94.03% and the average efficiency by 20.0%. This method alleviated the above problems and enhanced the performance regarding the location and recognition done using Φ-OTDR in practical environments.
2. Materials and Methods
Due to the random interference of Rayleigh backscattering (RBS) generated by detecting pulsed light at different positions on the optical fiber, the intensity of RBS fluctuates randomly. As mentioned above, due to the influence of the fading effect, the RBS intensity in some regions of the optical fiber is weak, the phase demodulation results of these regions cannot be effectively identified, and these regions change over time, resulting in a high rate of false positives [
23]. At the same time, Φ-OTDR has a fast response and the characteristic of high sensitivity, which causes a huge pressure on data storage and computing [
24,
25,
26]. All these problems hindered the application of Φ-OTDR system in practical environments, and most of the research does not aim at solving the above problems at the same time.
In this study, a method based on CEEMDAN-KL and AMNBP optimized the performance of a Φ-OTDR system. The overall diagram of signal collection using Φ-OTDR and events identification with the method is shown in
Figure 1.
In practical environments, the fiber (green color in
Figure 1) is usually buried in the soil. The event produces vibration, which causes a phase change in the RBS at the corresponding positions of the fiber. Furthermore, the target signals and reference signals are both collected using the Φ-OTDR system (black and red curves in
Figure 1). Since the original signals are easily disturbed by strong noise, the characteristics of the target signals are difficult to distinguish. Given this situation, the key features of signals can be enhanced using CEEMDAN-KL. It reduces the interference at any individual position or point during the location and recognition. Through the AMNBP algorithm with adaptive adjustment, the coding sequence improves the calculation efficiency and provides outstanding differentiation that allows for identifying the target event.
2.1. Principle of the Φ-OTDR System
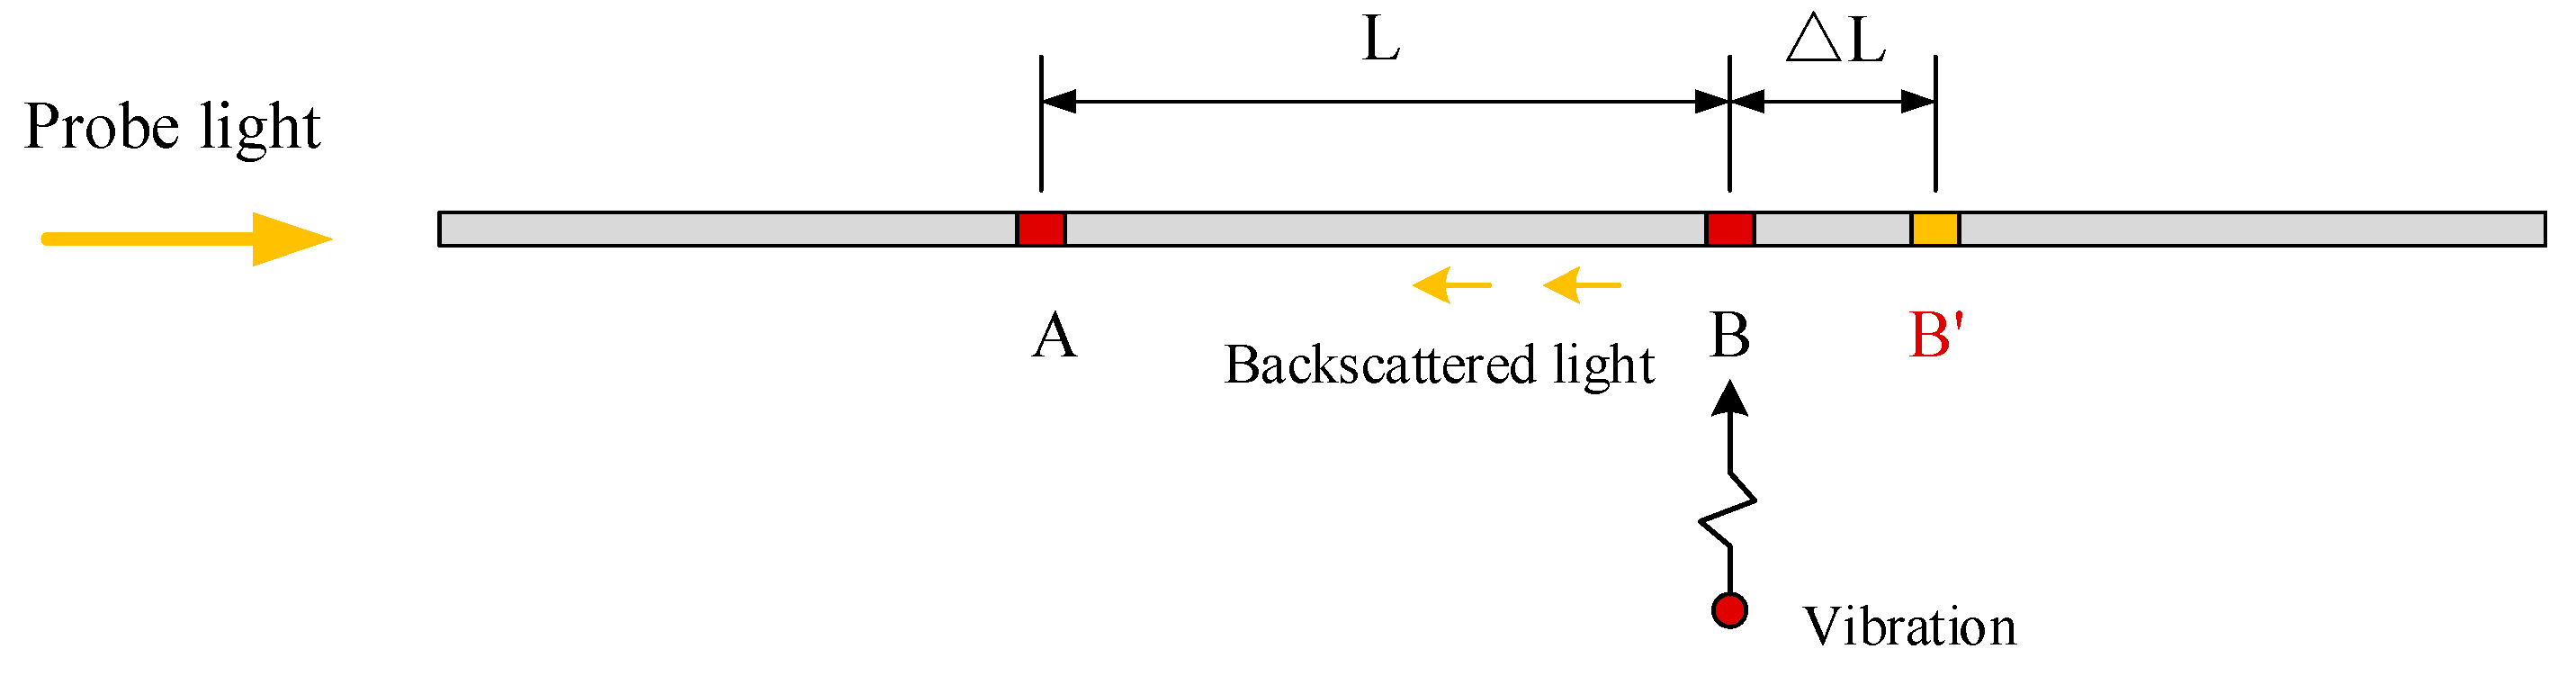
When there is an invasion event along the fiber line, the refractive index of the corresponding position of the fiber will change. A heterodyne check is the main principle of Φ-OTDR, as shown in
Figure 2.
The amplitude and phase of the backscattered light at each point of the optical fiber are determined. When fiber loss is not taken into account, the light intensity of the backscattered light at points A and B can be expressed as:
When the vibration from external events acts on the optical fiber, a lateral microstrain will occur at the corresponding position on the fiber due to the photoelastic effect. By simplifying the photoelastic effect, the phase change of the optical fiber caused by external stress can be expressed as follows:
where
n is the refractive index of the optical fiber,
k = ω/c, and
ω is the angular frequency of the light wave.
L represents the original distance between A and B,
p11 and
p12 are the constant photoelastic coefficients,
ε1 is the axial strain of optical fiber, and
ε2 is the transverse strain of optical fiber. In turn, the phase of the RBS at this position changes. The phase difference between B and B’ can be defined as:
Here,
λ is the wavelength of the light and Δ
L represents the distance between B and B’ after the impact of an external event is offset. RBS is continuously generated when the probe light propagates in the optical fiber. When the pulse light is bent, broken, or vibrated in forward propagation, the power of the RBS received by Φ-OTDR system will change at the corresponding time [
24]. The vibration position can be located using the time difference caused by the optical path difference. When the incident light enters the fiber, it takes time to reach point B and generates RBS. Over the same time, RBS returns to the incident end. Assuming that the vibration occurs at point B and the distance between the start point and B is
X, the position of point B can be expressed as:
where
c represents the speed of light, and
t represents the round trip time between probe light and point B.
2.2. Improved CEEMDAN with Kullback–Leibler Divergence
During the signal collection using the Φ-OTDR system in practical environments, the lack of prior knowledge and poor SNR make it difficult for the wavelet and Fourier transform to work. CEEMDAN was developed based on EMD decomposition. It decomposes the time-series signal into several IMF components with adaptability [
20]. These IMF components have little influence on each other and differ from the original signal, which can simplify the coupling of signal feature information [
27]. By adding adaptive white noise, the unique margin is calculated to obtain the IMF component. The decomposition process is then complete [
28,
29]. To measure the similarity between each IMF component and the original signal, this paper introduces the Kullback–Leibler divergence (KL). It optimizes the CEEMDAN process. In short, it enhances the signal characteristics and provides support for the Φ-OTDR system performance optimization.
Firstly, the Ek(·) is difined as the kth mode component generated by the decomposition of the conventional EMD algorithm. The is difined as the mode component generated by CEEMDAN. N is Gaussian white noise. σ is the standard deviation of the noise. Then, the steps of CEEMDAN-KL decomposition are as follows:
- (1)
Conduct the experiment of the signal
m times, where the first modal component is:
- (2)
Obtain the unique residual signal:
- (3)
Do the experiment
m times with the signal
and break it down until
E1(·) is obtained. Based on this, the second empirical modal component is calculated:
- (4)
For
, calculate the residual signal and the corresponding empirical mode component, where the calculation steps are consistent with step 3, and the KL divergence values between each component
and the original signal
x(
t) are calculated as follows:
- (5)
Execute step 4 until the residual cannot be decomposed. The judgment criteria for termination are:
- (a)
The number of extremum points of the residual signal should not exceed two.
- (b)
The component combination with the smallest mean square error of the decomposed component KL value. Here, from the perspective of mathematical statistics, the best reconstruction effect is when the KL standard deviation of the chosen components is less than that of half of all KL components:
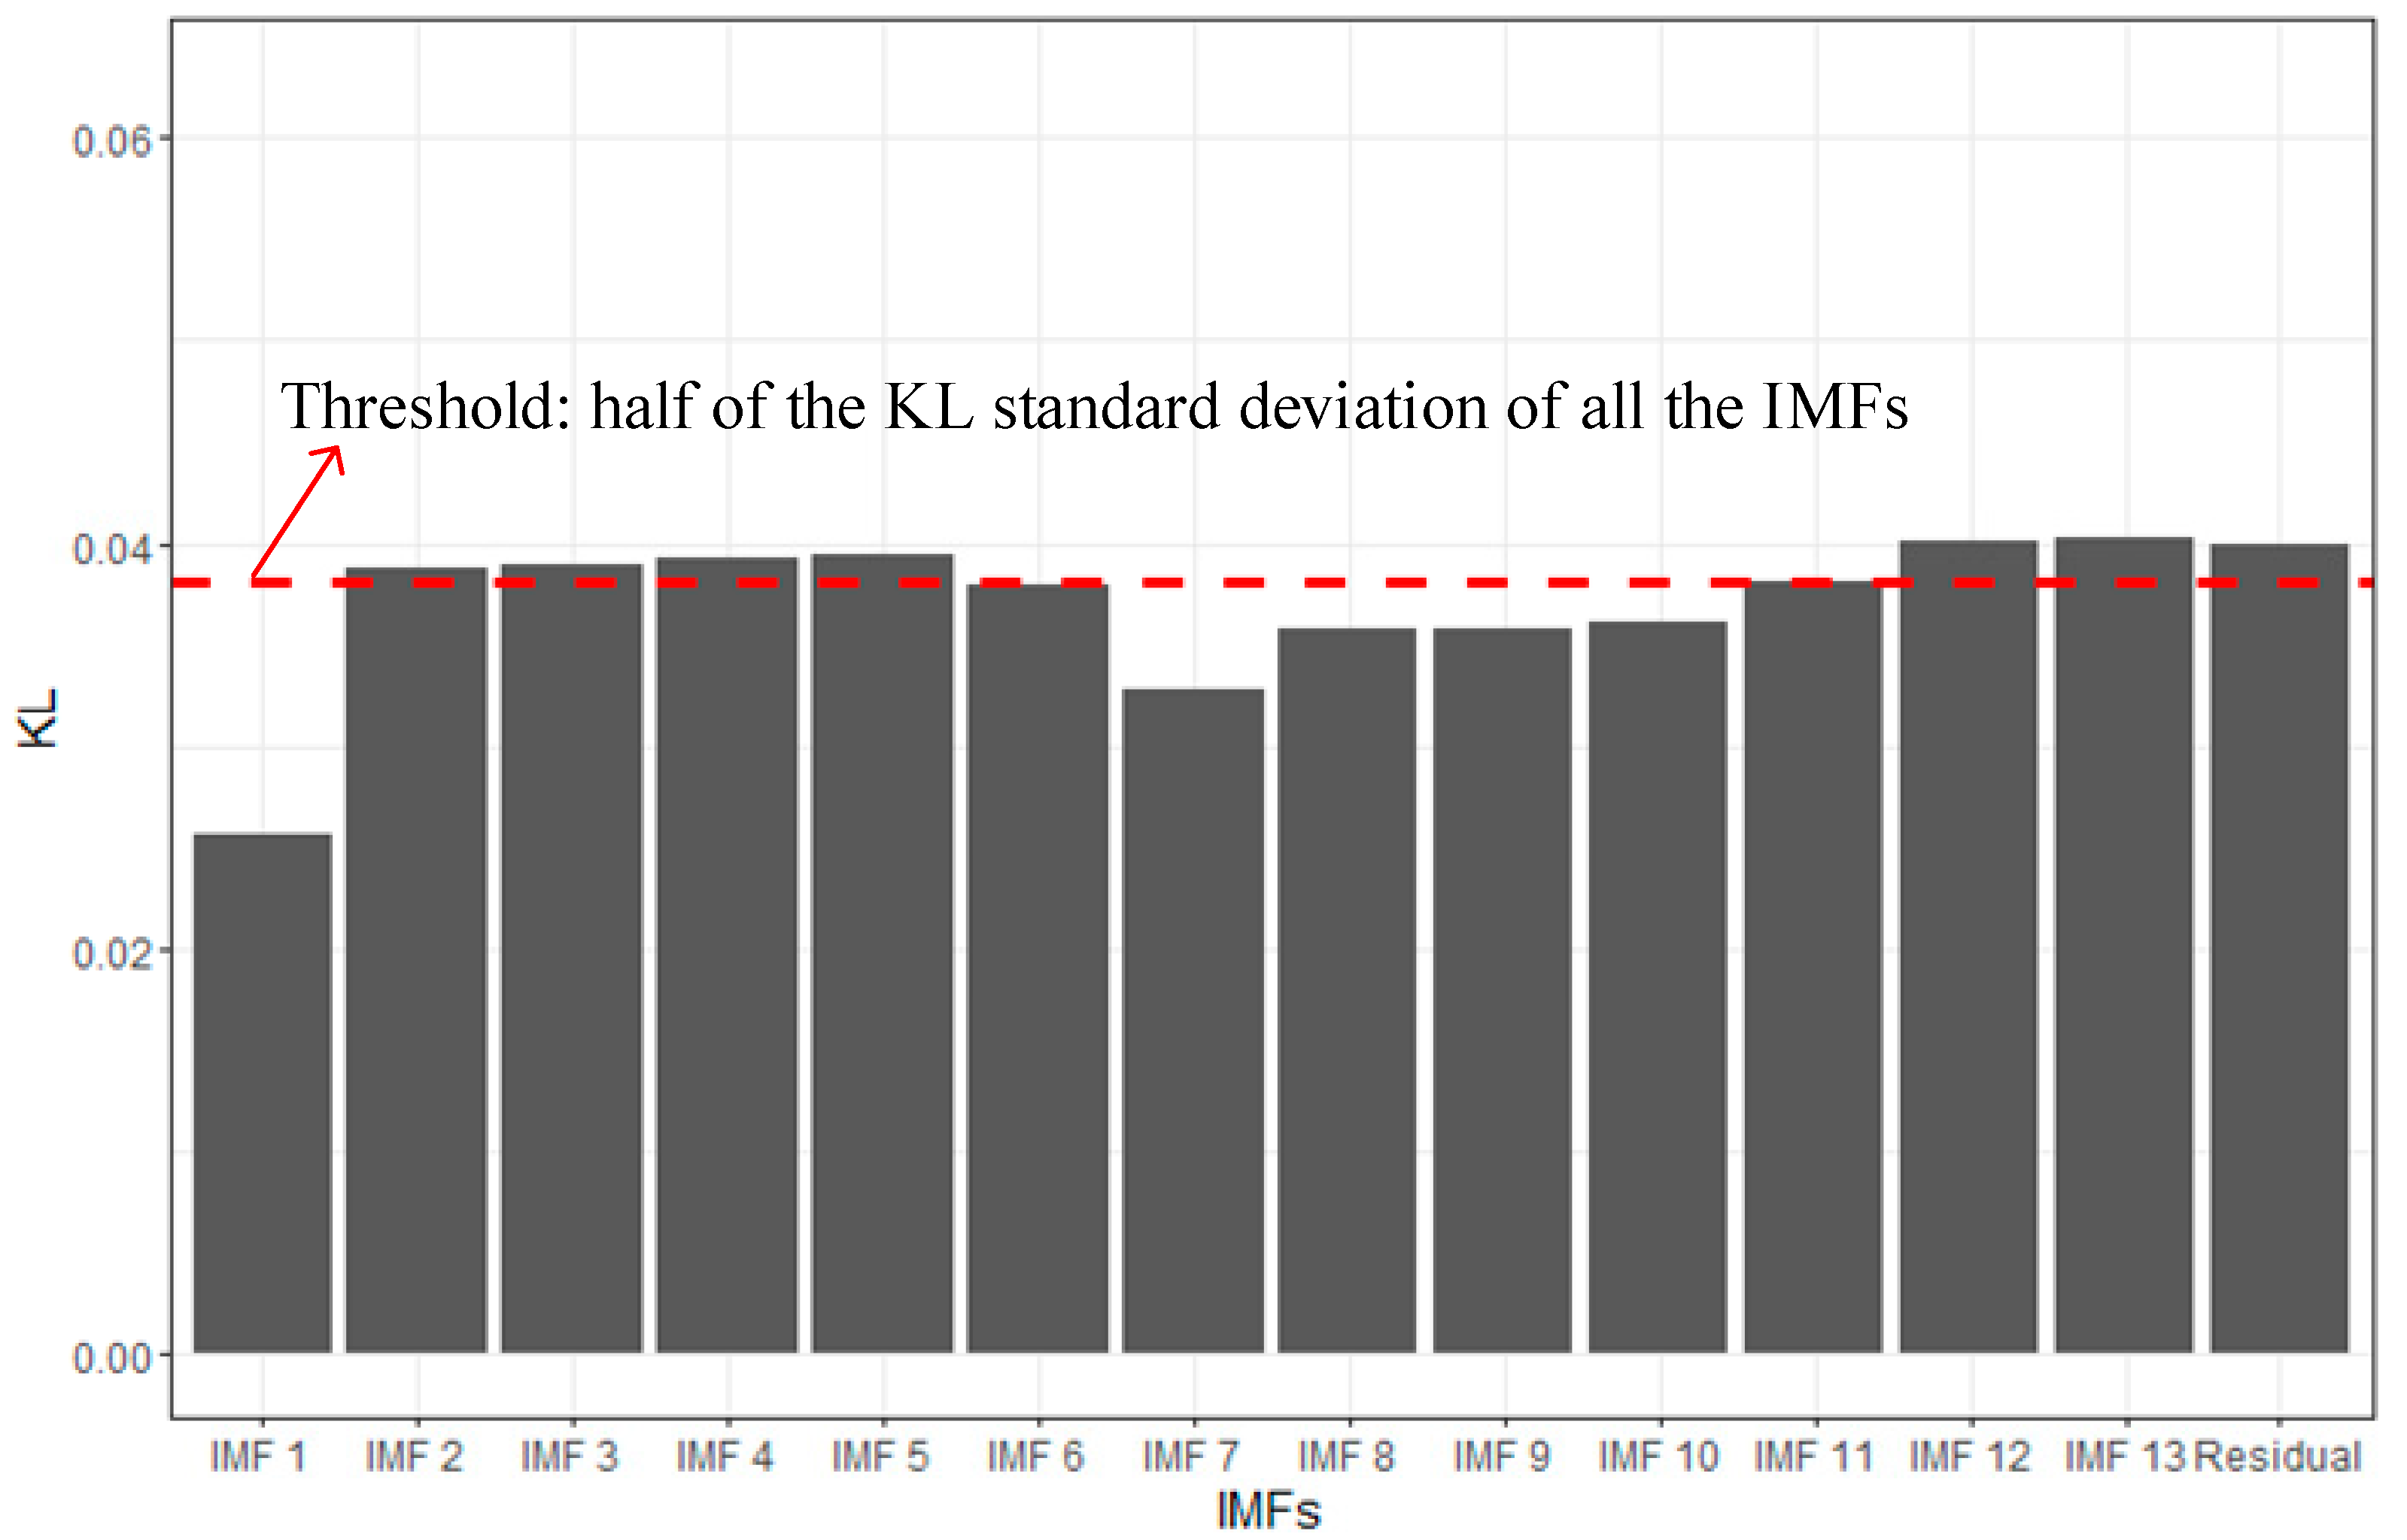
To gain a better understanding of this algorithm, we experimented with a standard knocker. The data of a standard knocker was collected with a frequency of 10 Hz using the Φ-OTDR system. After standardization, the CEEMDAN-KL feature enhancement was adopted. IMFs meeting the KL selection criteria were selected to complete the reconstruction of the original signal, as shown in
Figure 3, and the comparison effect is shown in
Figure 4.
In
Figure 3, the abscissa is the IMFs obtained after the decomposition. The ordinate indicates the KL values of the IMFs from the original signal. This step eliminates the IMFs components with a large difference, and the remaining components express the characteristics of the original signal more clearly. The red dashed line in
Figure 4 represents the filtering threshold of the IMFs components. Here, the threshold was 0.389, which was half of the KL standard deviation of all the IMFs. In this way, IMF1, IMF6, IMF7, IMF8, IMF9, and IMF10 were selected to reconstruct the signal, which is shown in
Figure 4b.
In practical environments with a low SNR, the target signal and noise are often mixed and are difficult to distinguish, as shown in
Figure 4a. After the feature enhancement through CEEMDAN-KL, the contrast characteristics of the target signal and noise are enhanced with a limited SNR, as shown in
Figure 4b, which makes the characteristics of the target signal more distinguishable, as shown by the red box in the figure.
2.3. Location and Recognition-Based AMNBP
Based on feature enhancement of the original signal using CEEMDAN-KL, an AMNBP coding algorithm is proposed in this paper to meet the requirements of fast location and recognition of invasion events in practical environments and to reduce the influence of the fading effect. AMNBP was based on the LBP algorithm [
21,
22]. According to the characteristics of Φ-OTDR system, signals are collected point by point along the fiber direction. CEEMDAN-KL reduces the impact of noise on the coding. Afterward, the final AMNBP coding results are optimized using the moving average sliding window, which also decreases the influence of dead-zone detection. The coding flowchart of AMNBP is shown in
Figure 5. The coding steps of the AMNBP are as follows:
- (1)
Set the window length as W, where the length shall be less than or equal to the detection event length. The data in the window is divided into four parts, and each W/4 data set corresponds to a code.
- (2)
Compare the four coding lengths in the window with the mean values in the window. If the mean of the
W/4 data set is less than or equal to the window mean, the coded value is denoted as 0; otherwise, it is denoted as 1:
- (3)
Slide along a step and obtain the moving neighbor binary code in turn.
- (4)
The binary coding sequence is converted to a decimal. To ensure the differentiation degree of the acquired sequence of different events with the same background noise, it is necessary to readjust the relationship between the mean value of all data and the mean value of the noise to obtain the decimal sequence:
To select an appropriate window length, the optimal window selection was found by calculating the AMNBP value of the signal at different window lengths, and the standard knocker was used for multiple tests in practical environments. The sampling frequency was 4 kHz. This means that each point of data represented 0.25 milliseconds. The sampling frequency and spatial resolution determine the fine granularity of the final determined location. To facilitate the inspection, the AMNBP value of the signal was compared with the AMNBP value of the noise. The difference in AMNBP values between various scales of the window is shown in
Figure 6, where the black dashed line is the difference between the initial moving neighbor binary pattern (MNBP) of the percussive signal and the noise. After the adaptive adjustment, the red solid line was obtained, and the blue curve represents the trend of AMNBP difference. To prevent the occurrence of underreporting, we selected the first high point and obtained the optimal distinguishing effect when the window number was equal to 400 (i.e., at 0.1 s).
By comparing the AMNBP value of the detection signal and the noise, the signal could be quickly detected and located, as shown in
Figure 7. To facilitate the presentation in the paper, this graph is transposed. The abscissa in the figure represents the time. Each grid corresponds to 100 data points, the sampling rate is 4 kHz, and the corresponding time length is 0.1 s. The vertical coordinate represents the distance, and the resolution is 1 m. It can be found from
Figure 7 that there was a corresponding time within the range of three meters (255–257 m), which occurred intermittently with time.
The two-dimensional heat map drawn using the AMNBP coding sequence can quickly locate the target events accurately. It can be seen from the figure that the minimum unit of location depends on the spatial separation rate and sampling frequency of the Φ-OTDR system. As shown in the green box in
Figure 7, the locating accuracy of the knocking event was 0.1 s × 1 m. Using this method, the time of the target location can be realized every 0.2 s. Additionally, the position of the standard knocker is fixed, and there was no relative change in the position of the optical fiber during the monitoring time.
As the computational complexity of AMNBP algorithm was lower than that of the frequency domain transform algorithm and the wavelet algorithm, the moving average method adopted in this algorithm further improved the computational efficiency, reduced the fading effect and the interference in the low SNR environment, and guaranteed the signal accuracy. This experiment indicates that the integrated method with CEEMDAN-KL and AMNBP is an interesting and feasible research direction for the application of the Φ-OTDR system in practice.
3. Experiments and Results
To verify the effectiveness of the method, first, the noise signal was collected in a relatively quiet environment, and then three kinds of typical events were selected, which were a standard knocker, walking, and manual mining. Through the method based on CEEMDAN-KL and AMNBP, the signal features were enhanced in strong noise conditions, and the AMNBP algorithm divided the three kinds of typical events and noise exactly.
3.1. Experimental Introduction
The experimental deployment based on Φ-OTDR system is shown in
Figure 8, where the system included a continuous wave laser, an optical coupler, an acoustic–optical modulator, an erbium-doped optical fiber amplifier, a circulator, photodetector, a data acquisition card, and a personal computer. The center wavelength of the laser was 1550.12 nm, the linewidth was 3.7 kHz, the pulse width of the detection pulse was 100 ns, the repetition period was 1 ms. The length of the fiber was 550 m and was buried at a depth of 20 cm. There was a nearly 20 m experimental area after 200 m. The experimental area was on the campus with pedestrians, bicycles, and other interferences 10 m away. In the experimental area, three kinds of typical interference events were introduced, i.e., a standard knock, walking, and manual excavation. The relative initial noise was also recorded at a quiet time. The beat frequency signal was continuously recorded by the digital acquisition card, the sampling frequency was 10 kHz, and 30 groups of four kinds of data were collected.
3.2. Signal Enhancement and Reconstruction
Signals from knocking, walking, and manual mining collected in the practical environment are nonlinear and nonstationary. CEEMDAN-KL overcomes the problem of signal aliasing in decomposition and reduces the number of iterations compared with ensemble empirical mode decomposition (EEMD). Furthermore, CEEMDAN-KL introduces white noise and KL divergence in the calculation process to optimize the signal reconstruction accuracy, which can meet the requirements of noise reduction and feature enhancement in a strong noise environment.
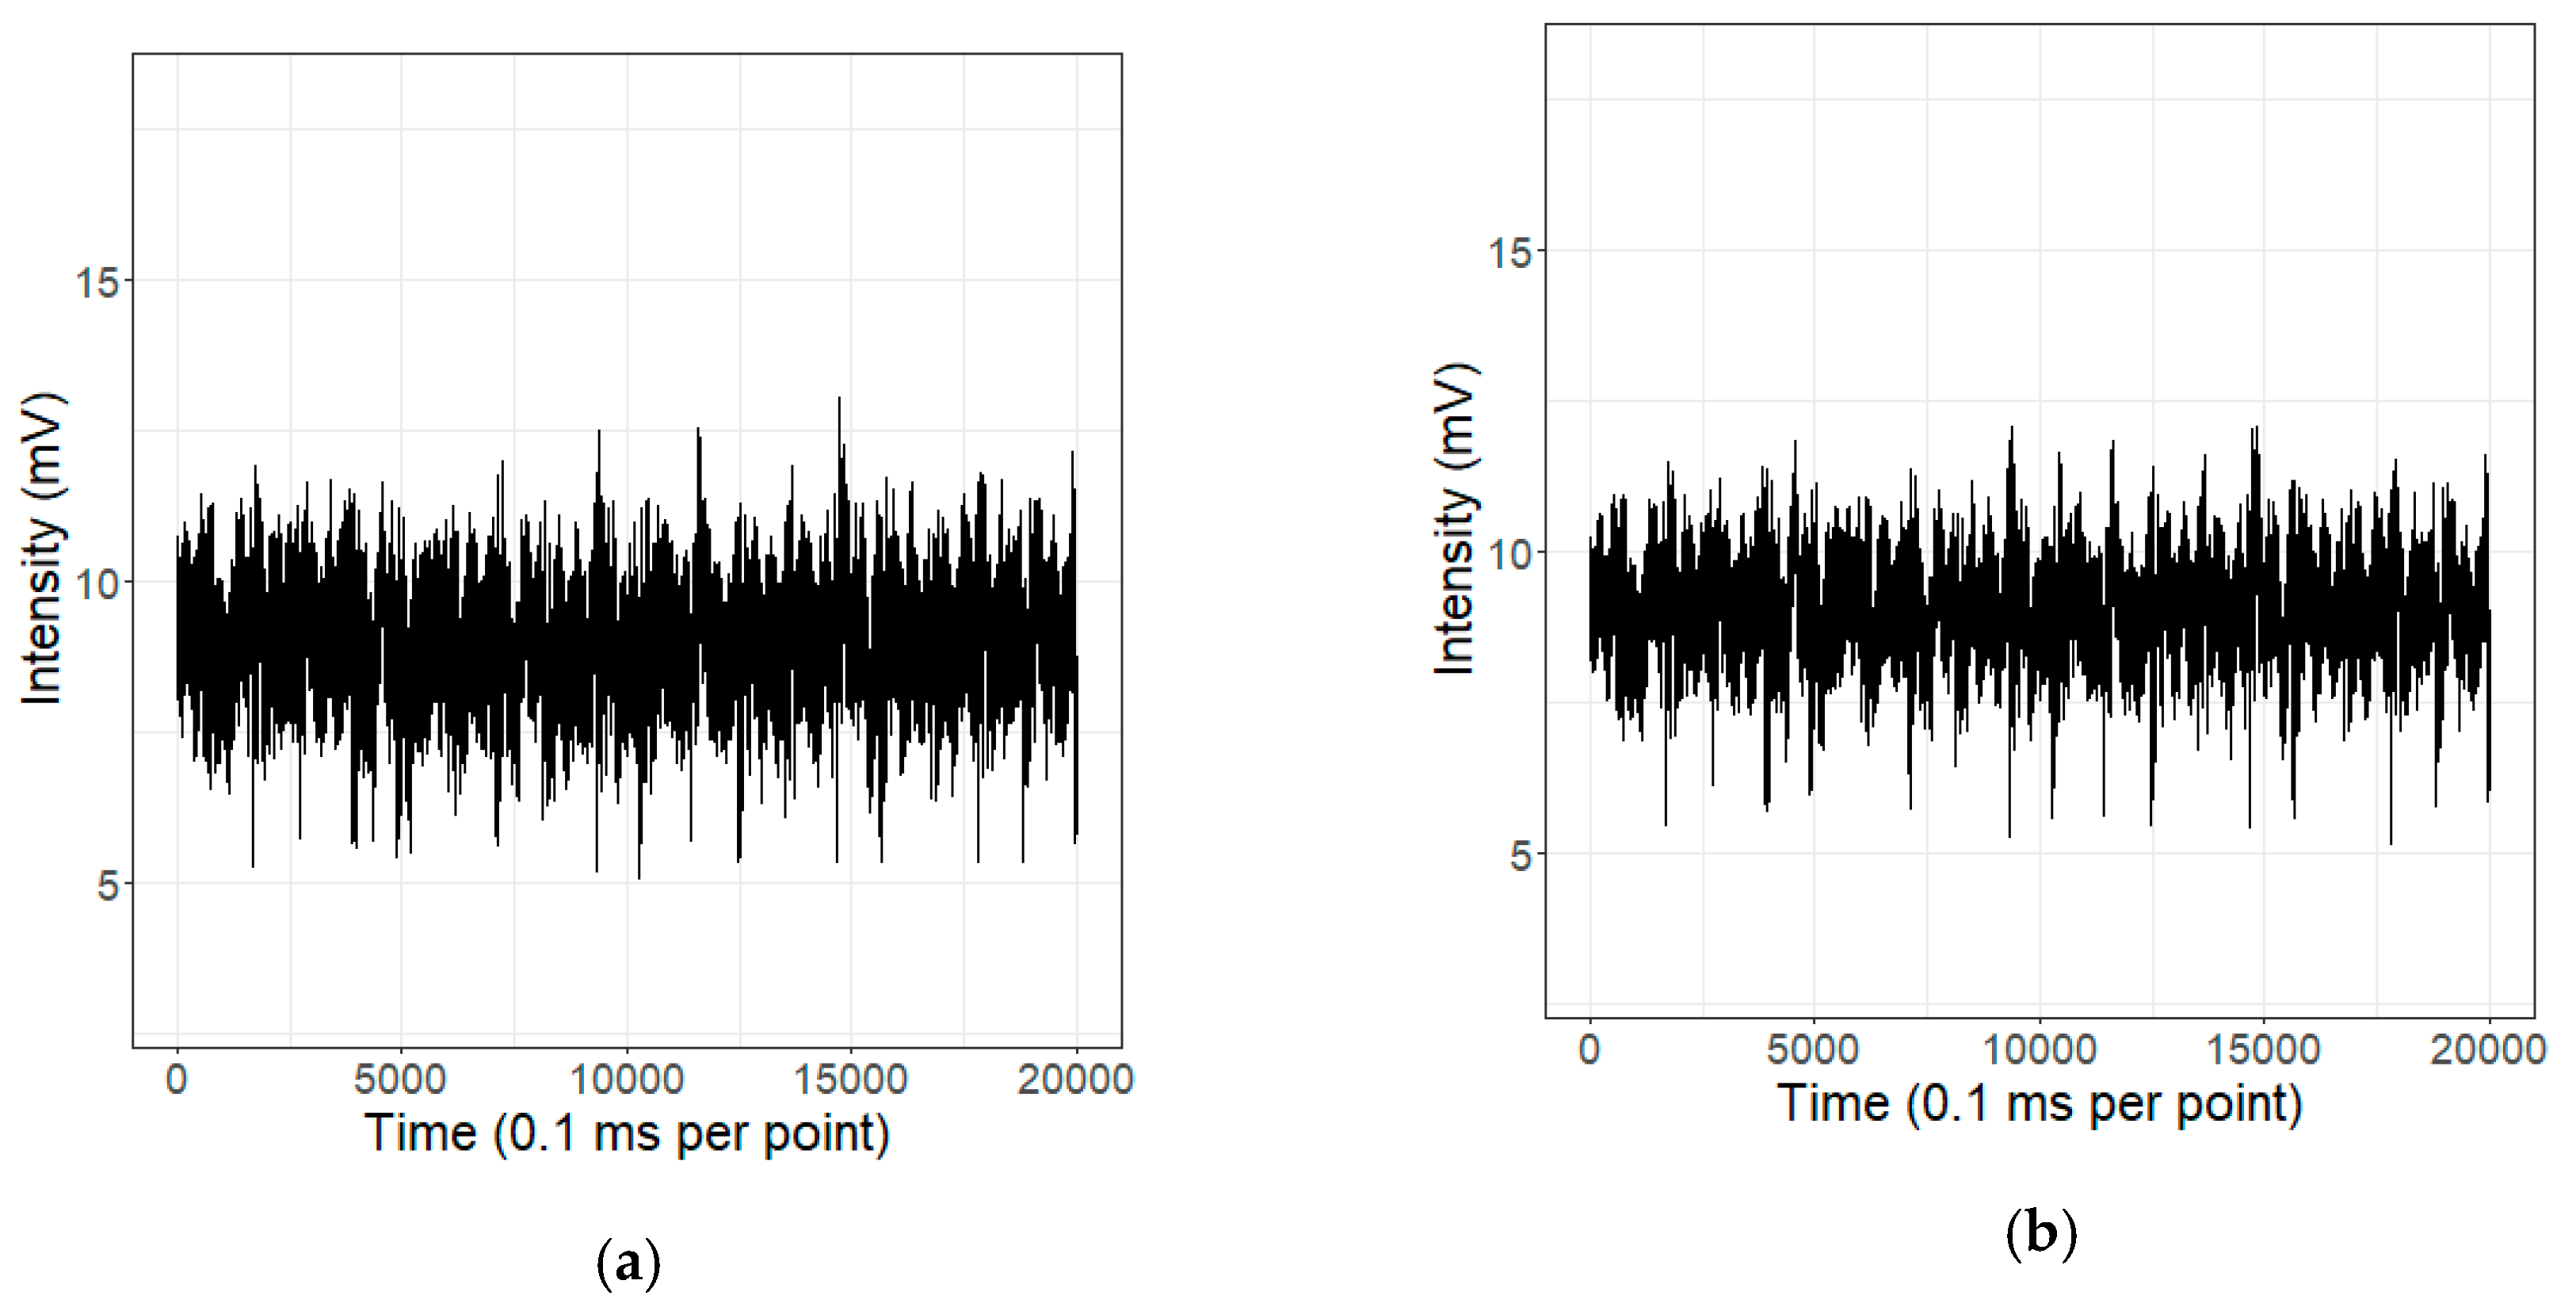
After the standardization, CEEMDAN-KL was used to enhance the features of the three types of typical signals. The comparison results are shown in
Figure 9. Among them, the abscissa represents time, where the unit is ms. The ordinate represents intensity, and the unit is mV.
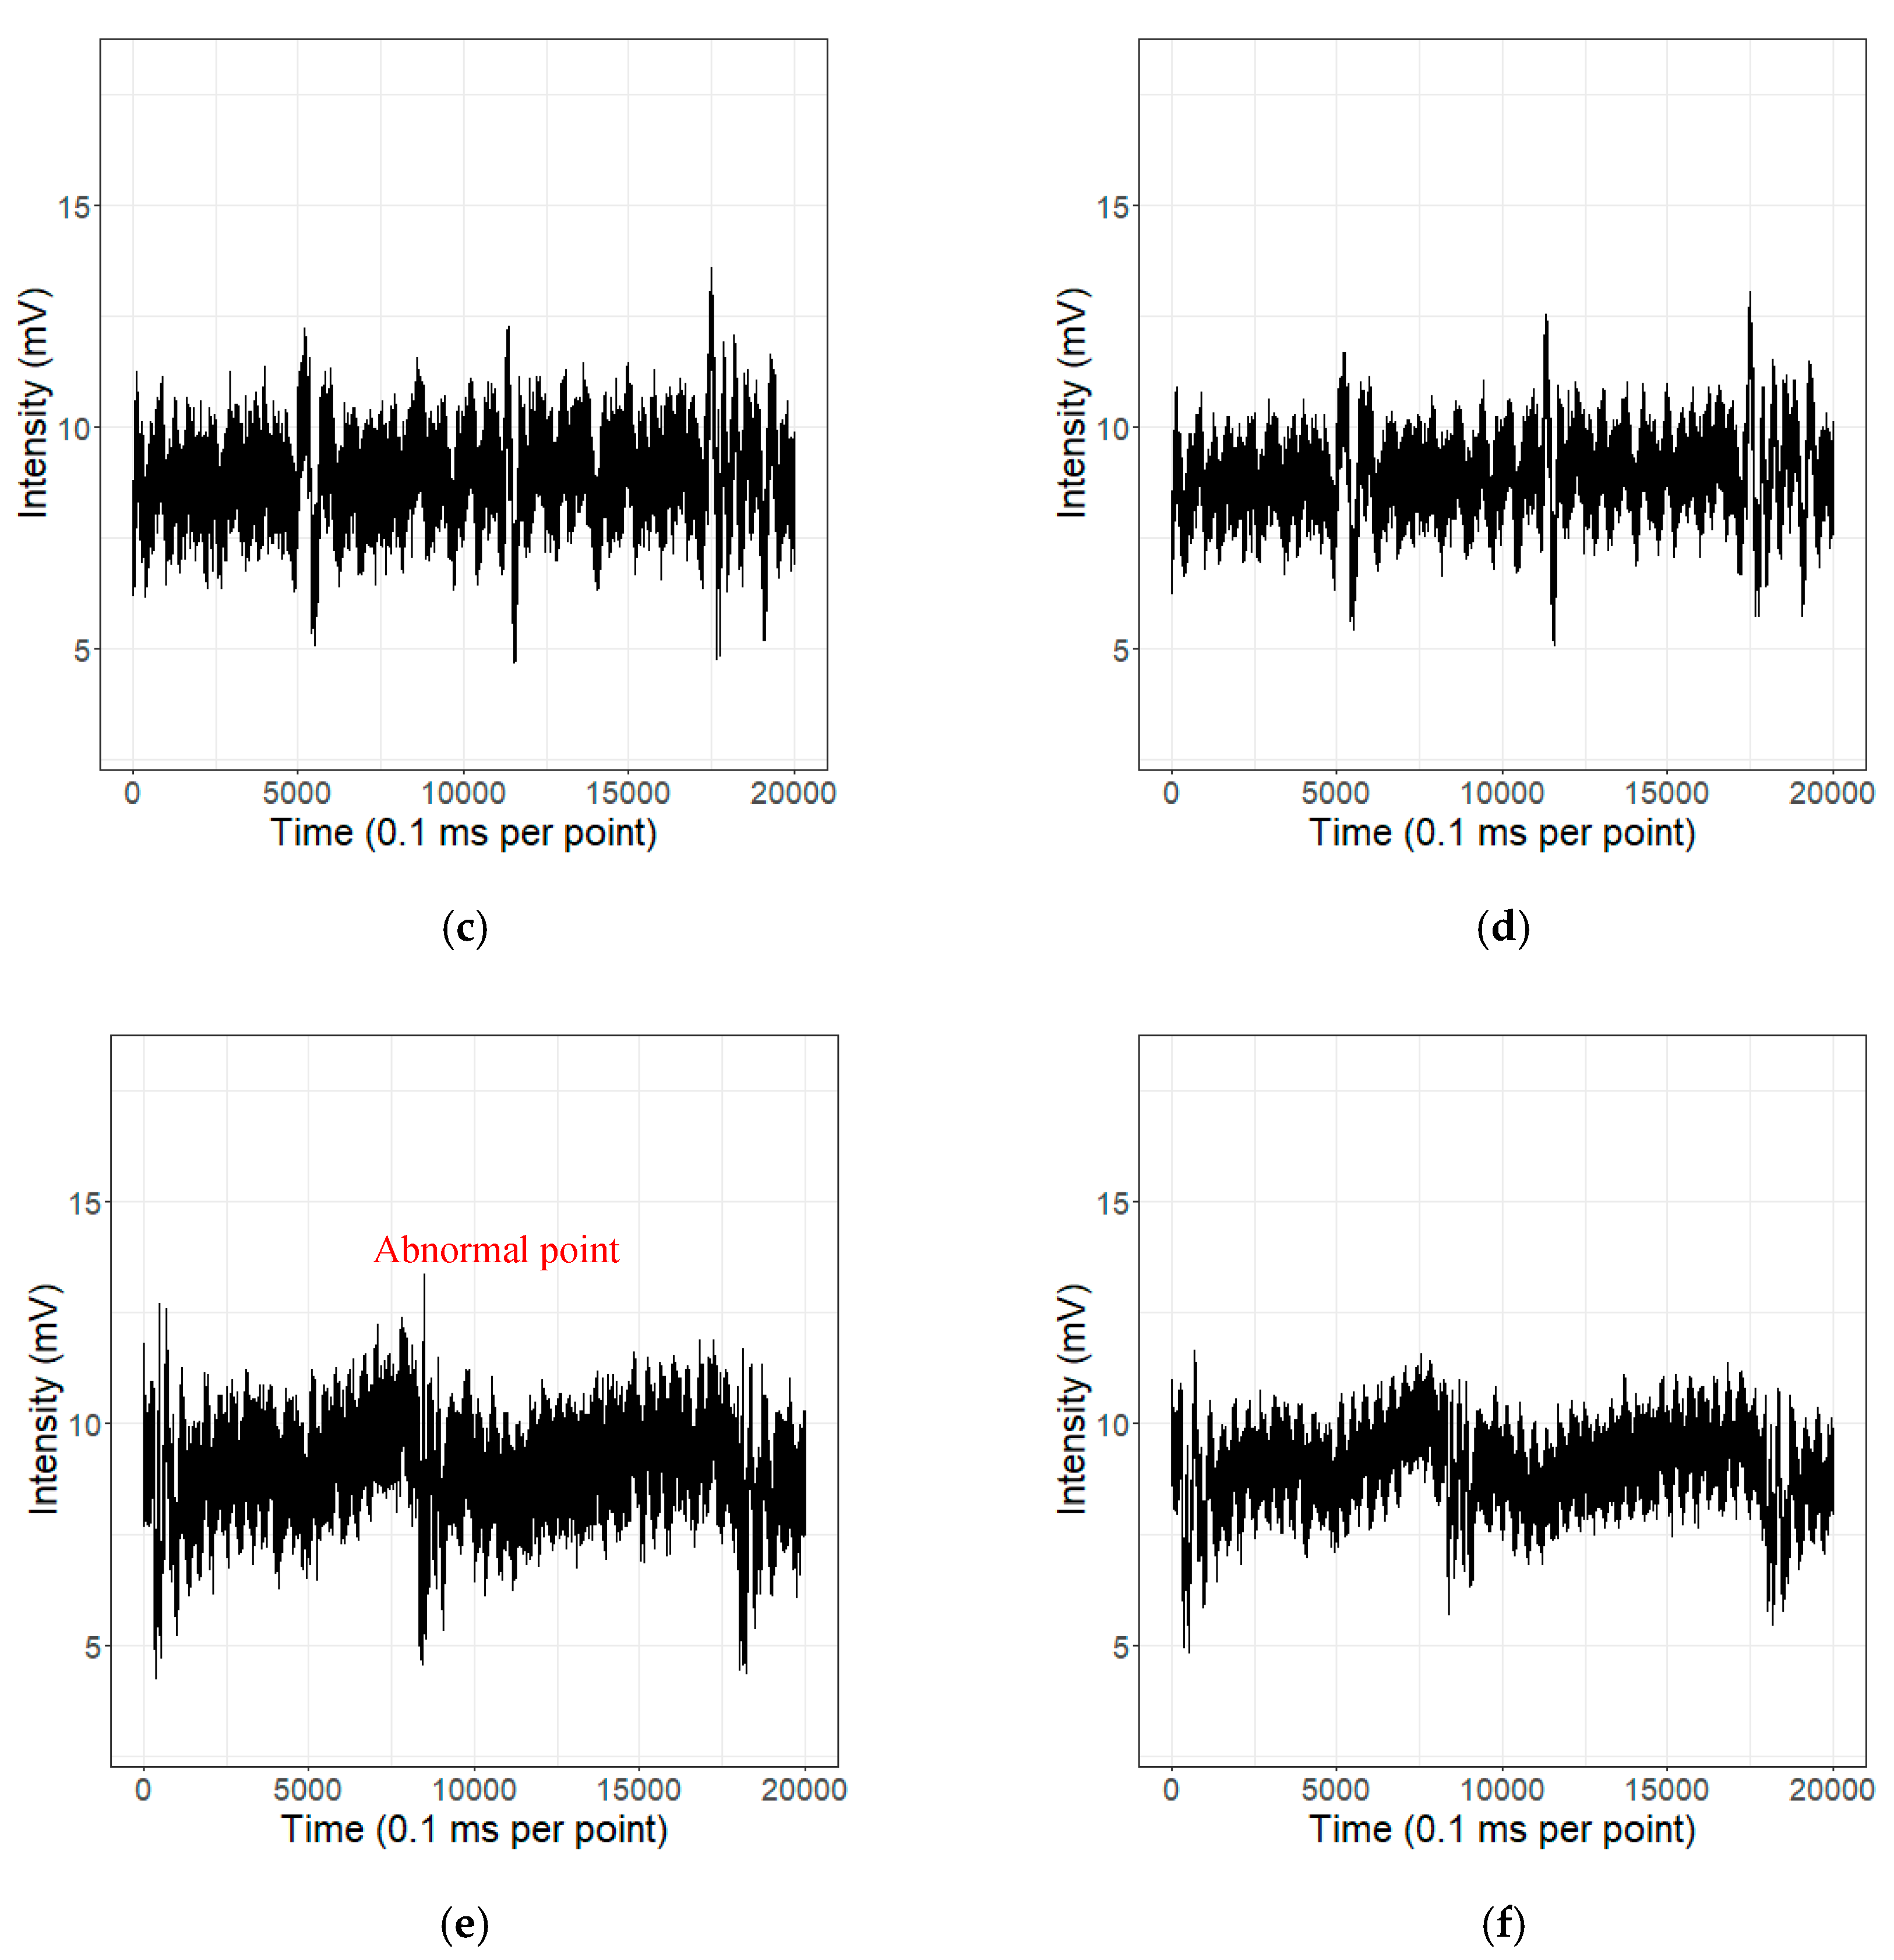
From the comparison of the three types of typical signals before and after CEEMDAN-KL processing, the characteristics of the mutant type of the signal are more clear. In
Figure 9, a,c,e on the left are the original signals of standard knocking, walking, and manual mining, respectively. It can be found that the original signals had a low SNR, and the high-frequency waveform characteristics of the target signal were not obvious. After the CEEMDAN-KL processing, the enhanced signals were obtained and are shown in
Figure 9b,d,f. In the case of a low SNR, the high-frequency parts of the time-domain waveform signals were effectively enhanced, which improved the discrimination between the target signal and noise. This is consistent with the observation in
Section 2.2. Additionally, for the single-point step of the signal, as shown in
Figure 9e,f, the influence of such abnormal points could be reduced. These results indicate that the CEEMDAN-KL effectively improved the distinguishing characteristics of the signals.
3.3. AMNBP Results of Multiple Events
After the signal enhancement, we obtained reconstructed signals with better characteristics. Then, the collected noise was encoded and used as a reference. The MNBP values of various events are shown in
Table 1. The first row is the average value. It can be seen that the noise average value was slightly greater than the MNBP values of the other three types of typical events, and the degree of event discrimination was not large. Equation (14) was used to achieve the AMNBP values after the adaptive adjustment, as shown in
Table 2. The average gain was 30 times that of the AMNBP values. Thus, the four types of events could be easily distinguished by increasing the AMNBP values.
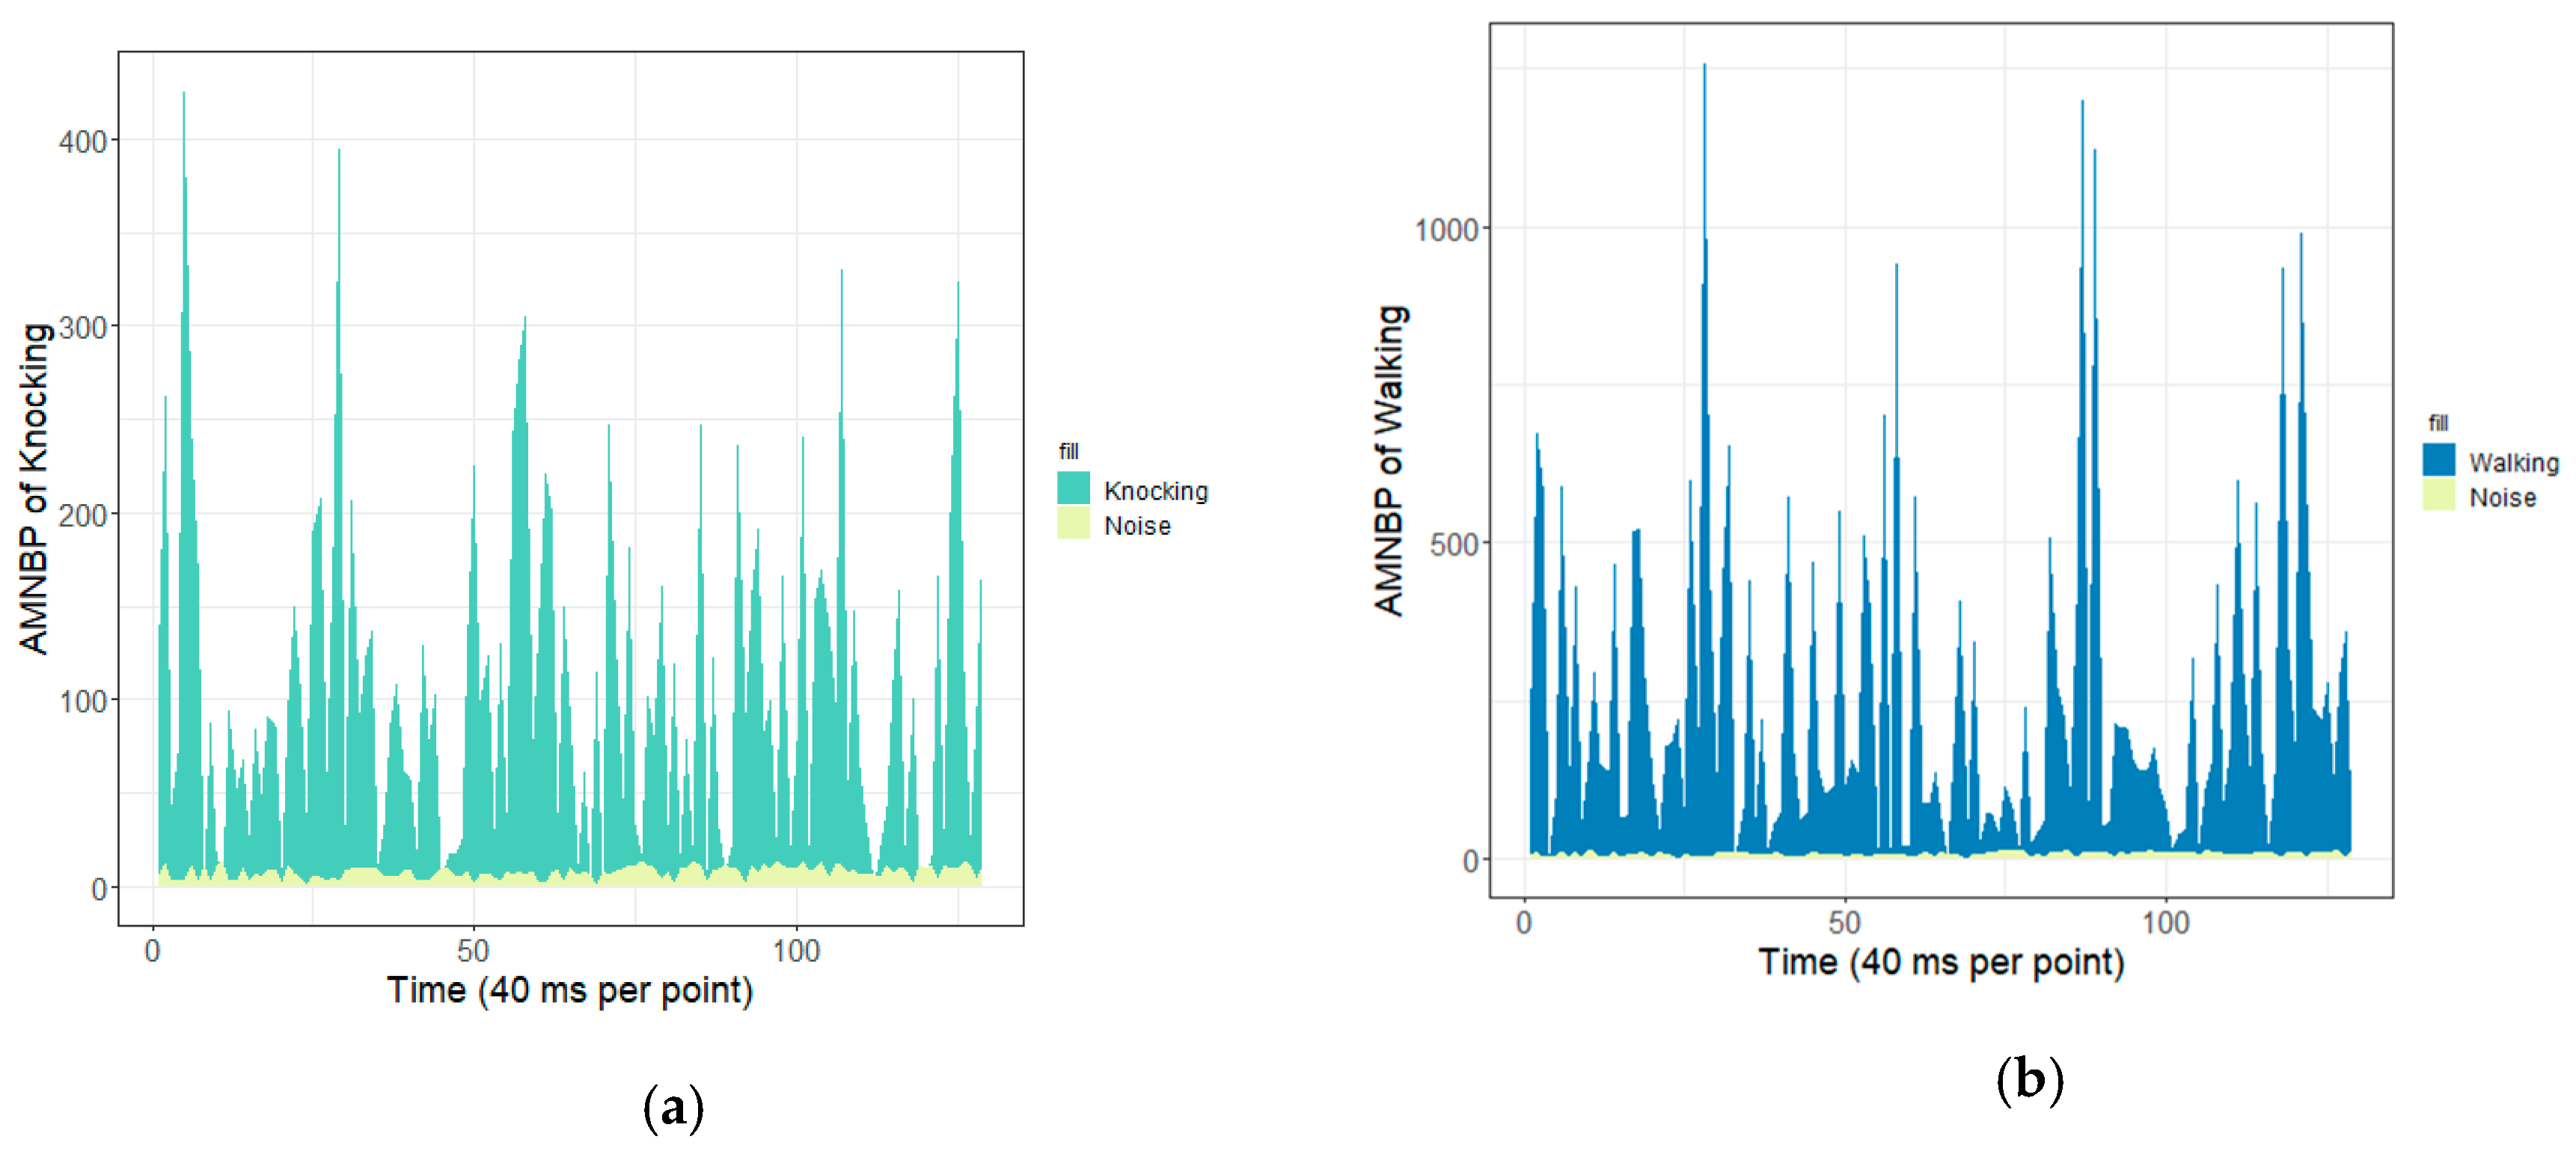
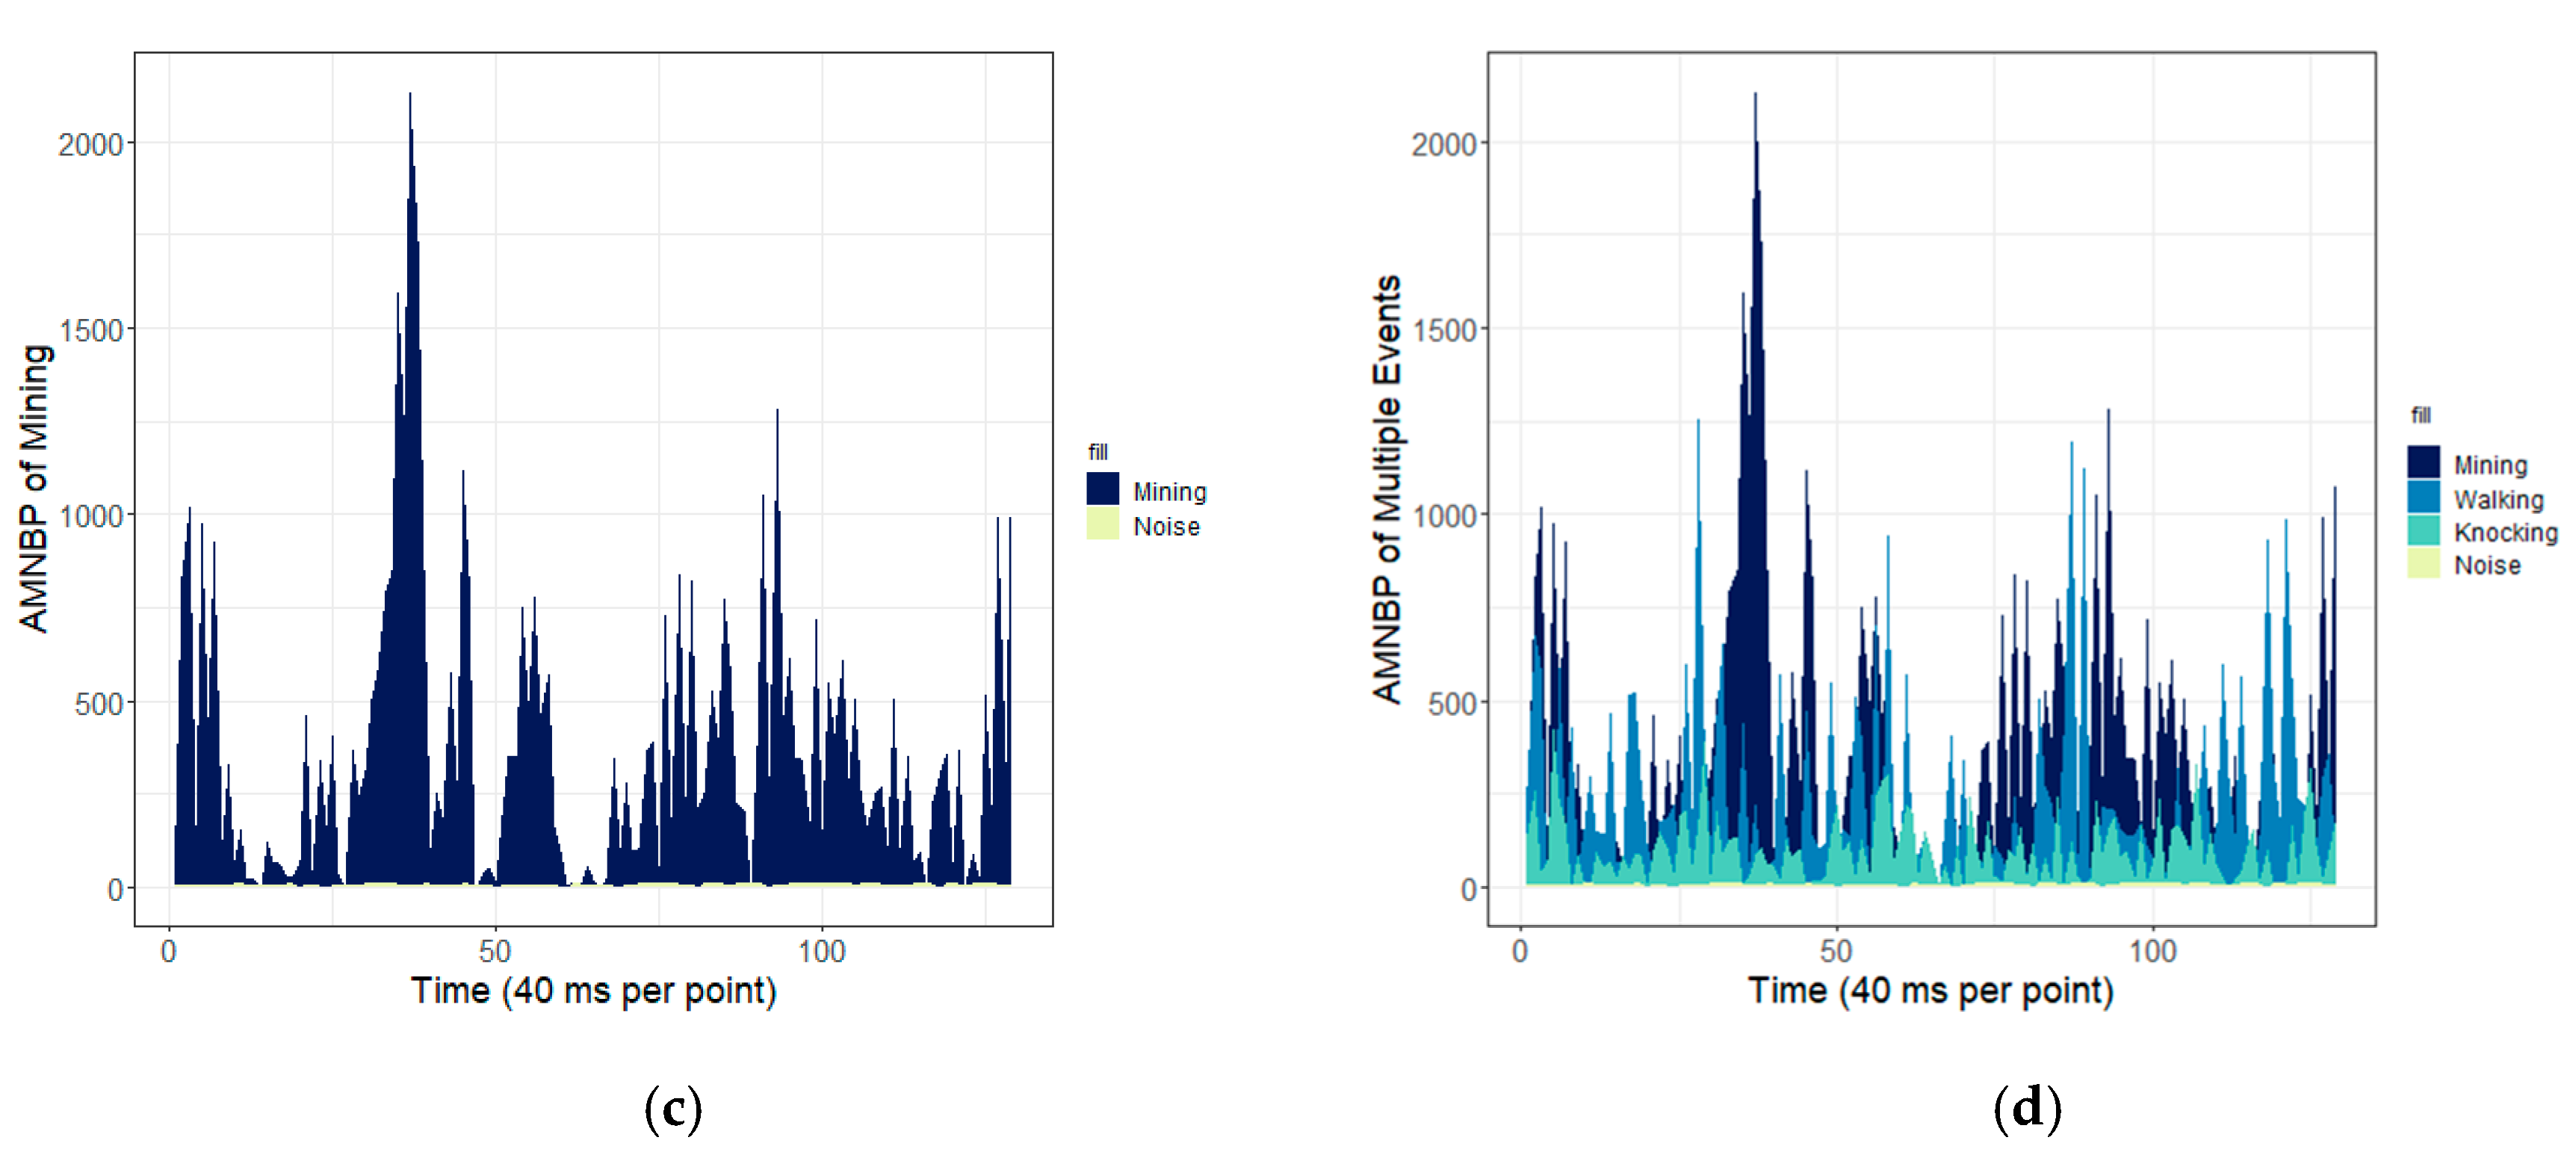
The comparison graphs of the experimental results of the four types of signals are shown in
Figure 10. The ordinate represents the AMNBP values of different events, and each point on the abscissa represents 40 ms, which corresponds to 400 points in the original data. In
Figure 10, beige is the AMNBP value of the noise, light blue is the AMNBP value of the standard knocker, blue is the AMNBP value of walking, and dark blue is the AMNBP value of artificial mining.
From the graphs, four different kinds of events could be distinguished. After the self-adaptive adjustment, AMNBP increased by an average of 30 times. At the same time, the AMNBP images clearly reflected the frequency information of the event. This shows that this method could enhance the performance of the location and recognition of a Φ-OTDR system.
3.4. Comparison between Different Methods
To verify the effectiveness of this method, we chose two kinds of methods based on frequency-domain analysis and wavelet support vector machines (SVM) to compare the accuracy and efficiency [
5,
17]. When the amount of data is small, the calculation load of wavelet-SVM is small. However, the amount of data also limits the accuracy of the mode. For the method based on frequency-domain analysis, a lot of time is used for the time–frequency conversion. Meanwhile, the recognition result is not ideal, especially when the observation frequency of the signal is close. After 30 groups of repeated experiments with four kinds of data, the comparison results of the experiments are shown in
Table 3,
Table 4 and
Table 5.
Table 3 shows the average accuracy of three methods for the 30 groups of experiments with four different events. When the SNR was low, the noise identification was the most error-prone. Under the condition of a small sample, the recognition rate of walking based on SVM was slightly lower than the average level. The reason for this was that the characteristics of a walking target are less prominent. The recognition rate of knocking based on time–frequency analysis obtained the lowest result, which may have been interfered with by the other similar frequency factors.
According to the time statistics of the above three methods in the experiment, the average efficiency results of the 30 groups of experiments are shown in
Table 4.
To facilitate the comparison of the characteristics of the three methods, four events were weighted equally to produce an average. The average results are shown in
Table 5. It can be seen from
Table 5 that the accuracy of the method proposed in this paper was significantly higher than the other two methods, and the calculation time was much lower with the same data sets.
4. Discussion and Conclusions
This paper introduces the principles of the Φ-OTDR system and describes how to complete a fast and accurate reconstruction of nonlinear and non-stationary signals based on CEEMDAN-KL. Then, it describes the AMNBP method of encoding, adaptive adjustment, location, and recognition. By designing three types of typical events and comparing the experimental results of four types of signals, the AMNBP values achieved an average gain of 30 times. This method takes into account the efficiency and accuracy of events. In multiple sets of experiments, the average recognition rate of the four types of events reached 94.03%, and the calculation efficiency increased by 20% compared with the two other conventional methods, namely SVM based on wavelets and frequency-domain analysis. The experimental results show that this method obtained a performance enhancement of the Φ-OTDR system. It should be pointed out that this method based on nonlinear signal enhancement and adaptive coding is a very feasible development direction for a Φ-OTDR system in practical applications.
The gradual maturity of 5G technology will strongly promote the development of the optical fiber field. Therefore, there is an urgent need for Φ-OTDR systems to overcome associated challenges. Due to the characteristics of high stability, low price, and long distance, research based on optical fiber transmission and sensing will receive a further burst. However, it should be mentioned that the current research also has its limitations that motivate further study. For example, since this method is only tested in intrusion events, whether this method can be applied to pipeline leakage fields needs furture study. Another question is whether multi-value coding can achieve excellent performance in terms of both efficiency and accuracy. The encoding length and window length also need further research. In the future, more research on the applications of Φ-OTDR system in practical scenes needs further study and discussion. All of this research will aim toward increasing the performance and providing more practical applications in various fields.


