Modeling the Functioning of the Half-Cells Photovoltaic Module under Partial Shading in the Matlab Package


Abstract

1. Introduction
2. Materials and Methods
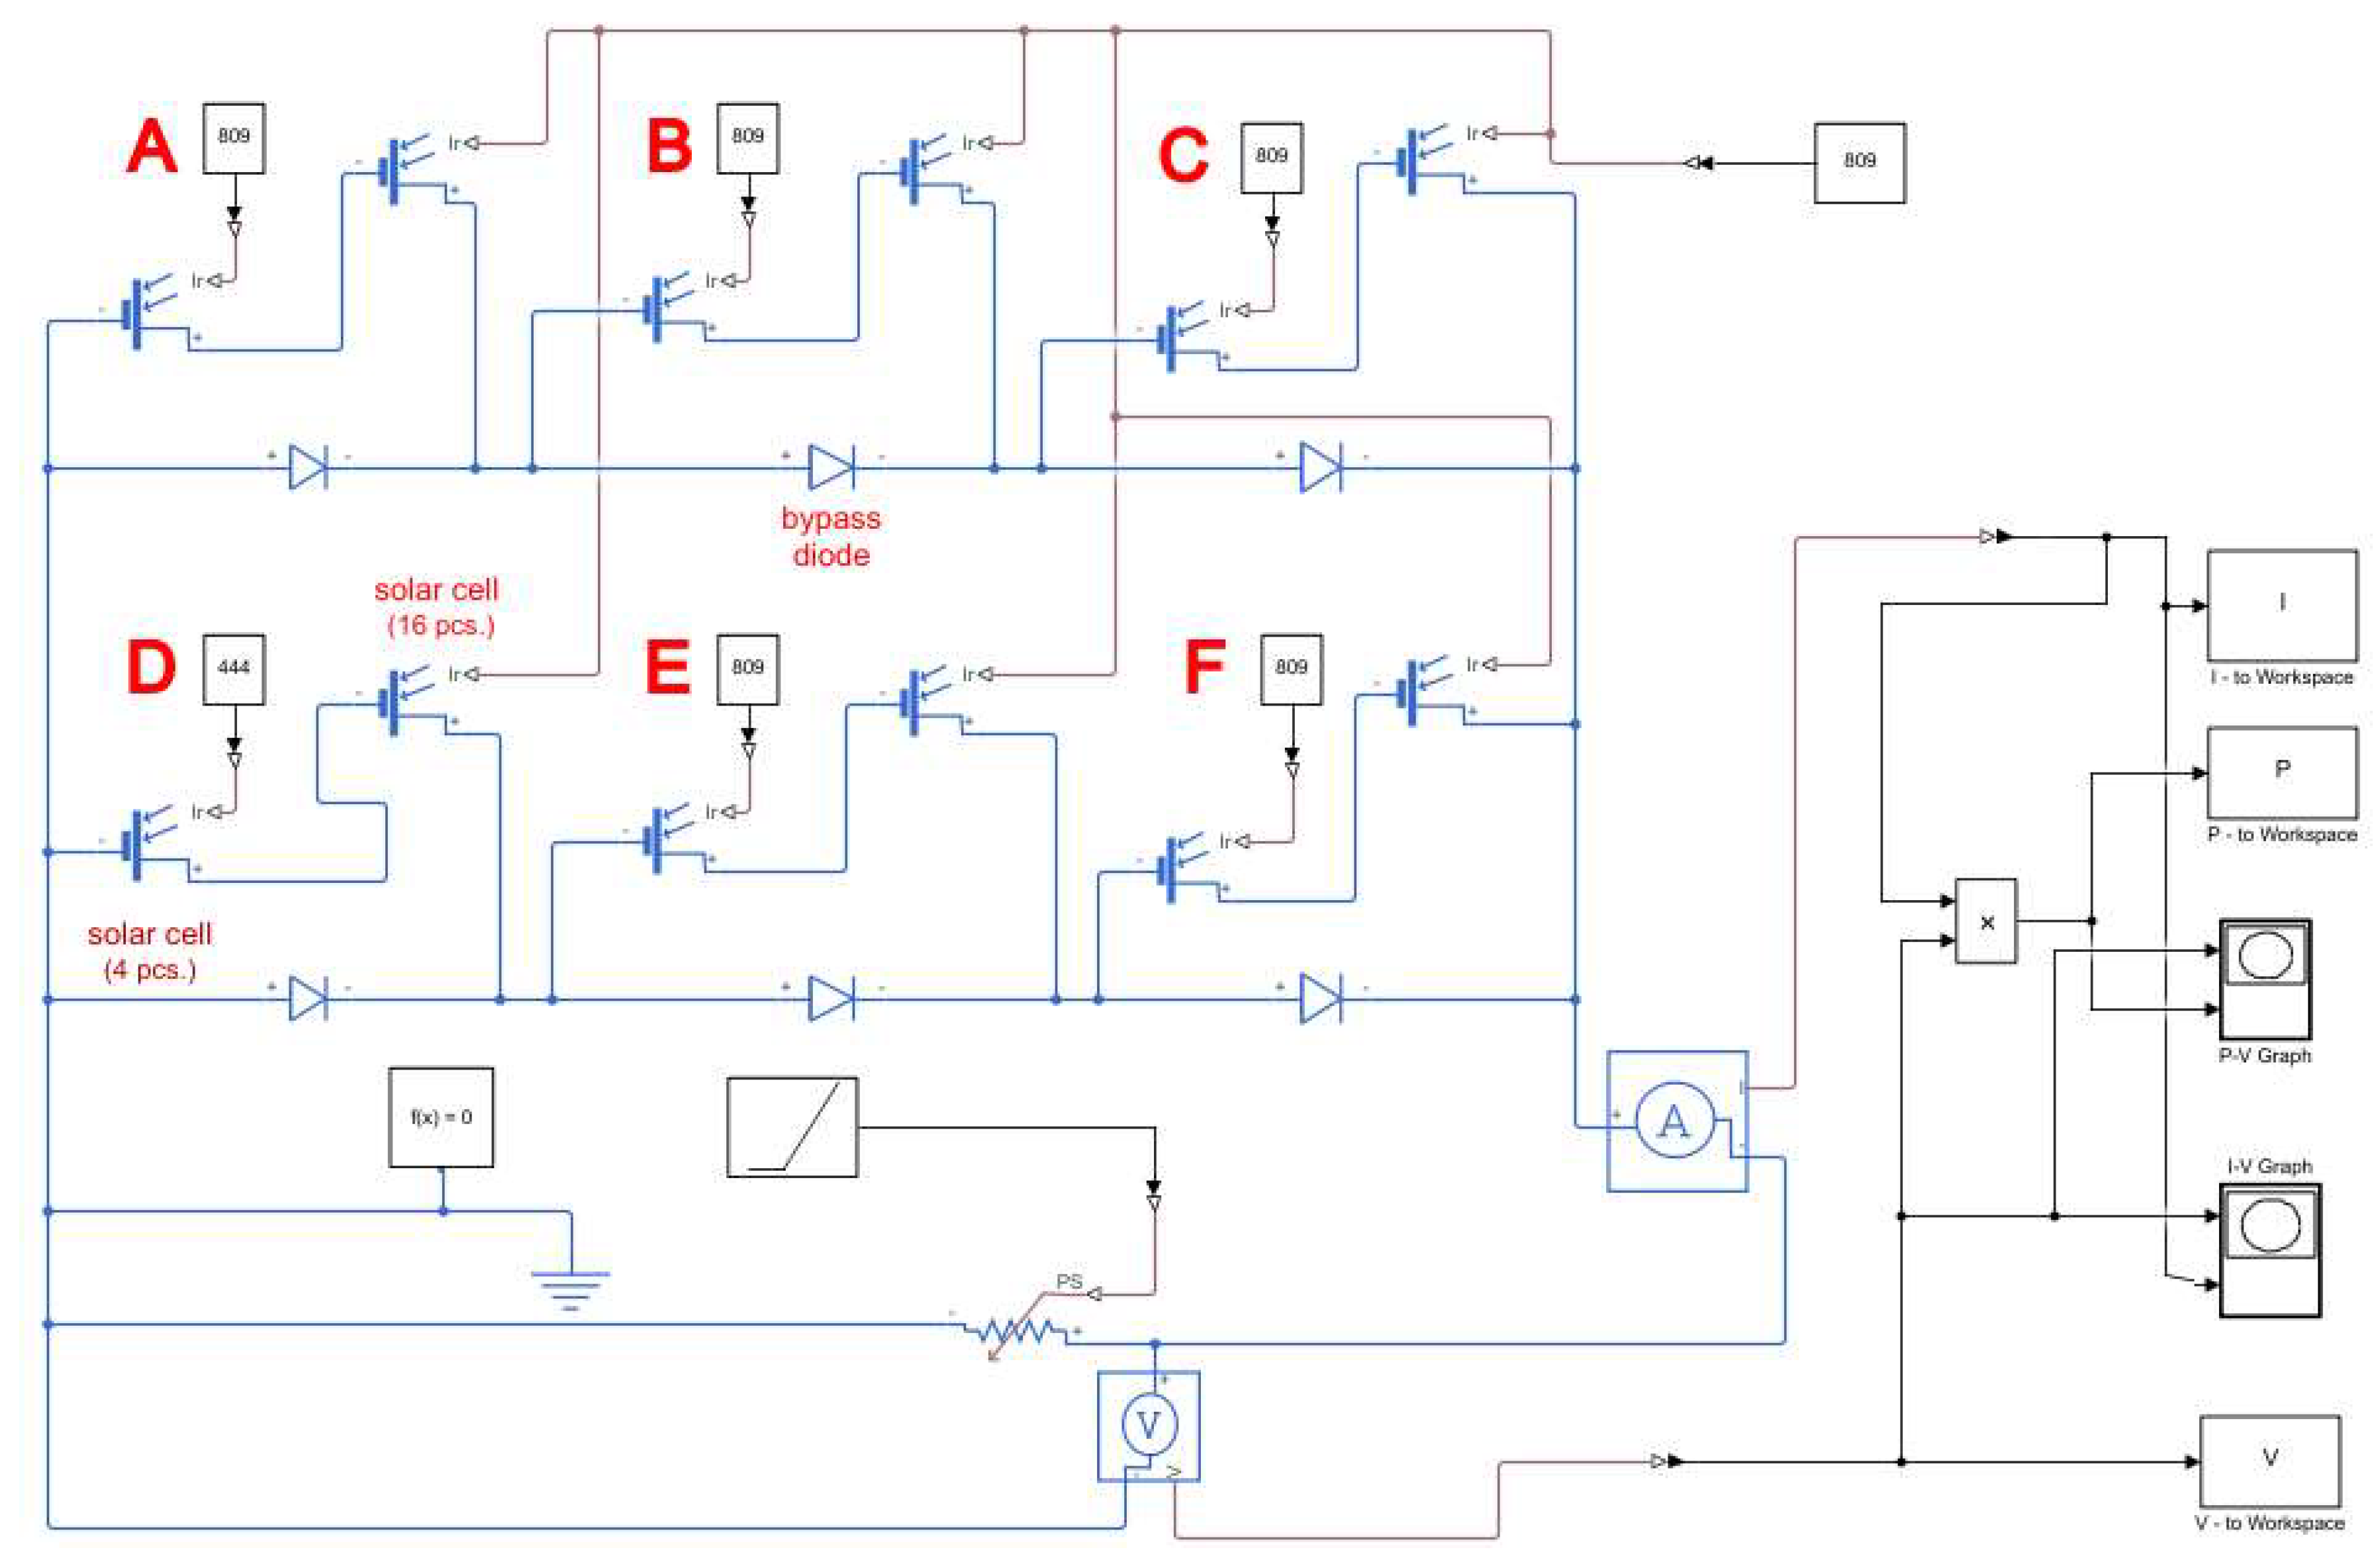
2.1. Construction of Simulation Model in Matlab Package
2.2. Verification Research Methodology
3. Results
4. Discussion and Conclusions
Funding
Conflicts of Interest
References
- Messenger, R.A.; Ventre, A. Photovoltaic Systems Engineering, 4th ed.; CRC Press Taylor & Francis Group: Boca Raton, FL, USA, 2017; ISBN 978-1-4398-0293-9. [Google Scholar]
- Conibeer, G.; Willoughby, A. Solar Cell Materials: Developing Technologies, 1st ed.; John Wiley & Son: Hoboken, NJ, USA, 2014; ISBN 978-1-118-69581-4. [Google Scholar]
- Hegedus, S.; Luque, A. Handbook of Photovoltaic Science and Engineering, 2nd ed.; John Wiley & Sons: Hoboken, NJ, USA, 2011; ISBN 978-0-470-72169-8. [Google Scholar]
- Kalogirou, S. McEvoy’s Handbook of Photovoltaics: Fundamentals and Applications, 3rd ed.; Elsevier: London, UK, 2017; ISBN 978-0-12-809921-6. [Google Scholar]
- Żdanowicz, T. Photovoltaic system (PV) reception—Procedures and documentation—Part 2. Magazynfotowoltaika 2018, 1, 16–20. (In Polish) [Google Scholar]
- Richter, A.; Hermle, M.; Glunz, S.W. Reassessment of the Limiting Efficiency for Crystalline Silicon Solar Cells. IEEE J. Photovolt. 2013, 3, 1184–1191. [Google Scholar] [CrossRef]
- Green, M.A.; Dunlop, E.D.; Levi, D.H.; Hohl-Ebinger, J.; Yoshita, M.; Ho-Baillie, A.W.Y. Solar cell efficiency tables (version 54). Prog. Photovolt. Res. Appl. 2019, 27, 565–575. [Google Scholar] [CrossRef]
- PSE S.A. Polish Power Grids. Available online: https://www.pse.pl/web/pse-eng (accessed on 1 January 2020).
- JaSolar Technical Data of the PV Modules. Available online: http://www.jasolar.com/html/en/en_pv/ (accessed on 30 January 2020).
- Gow, J.A.A.; Manning, C.D. Development of a Photovoltaic Array Model for Use in Power-Electronics Simulation Studies. IEEE Proc. Electr. Power Appl. 1999, 146, 193–200. [Google Scholar] [CrossRef]
- Abbassi, A.; Gammoudi, R.; Ali Dami, M.; Hasnaoui, O.; Jemli, M. An improved single-diode model parameters extraction at different operating conditions with a view to modeling a photovoltaic generator: A comparative study. Sol. Energy 2017, 155, 478–489. [Google Scholar] [CrossRef]
- Yıldıran, N.; Tacer, E. Identification of photovoltaic cell single diode discrete model parameters based on datasheet values. Sol. Energy 2016, 127, 175–183. [Google Scholar] [CrossRef]
- Hassan Hosseini, S.M.; Keymanesh, A.A. Design and construction of photovoltaic simulator based on dual-diode model. Sol. Energy 2016, 137, 594–607. [Google Scholar] [CrossRef]
- Attivissimo, F.; Adamo, F.; Carullo, A.; Lanzolla, A.M.L.; Spertino, F.; Vallan, A. On the performance of the double-diode model in estimating the maximum power point for different photovoltaic technologies. Measurement 2013, 46, 3549–3559. [Google Scholar] [CrossRef]
- Khanna, V.; Das, B.K.; Bisht, D.; Vandana; Singh, P.K. A three diode model for industrial solar cells and estimation of solar cell parameters using PSO algorithm. Renew. Energy 2015, 78, 105–113. [Google Scholar] [CrossRef]
- Gao, X.; Cui, Y.; Hu, J.; Xu, G.; Yu, Y. Lambert W -function based exact representation for double diode model of solar cells: Comparison on fitness and parameter extraction. Energy Convers. Manag. 2016, 127, 443–460. [Google Scholar] [CrossRef]
- Lim, L.H.I.; Ye, Z.; Ye, J.; Yang, D.; Du, H. A Linear Identification of Diode Models from Single I-V Characteristics of PV Panels. IEEE Trans. Ind. Electron. 2015, 62, 4181–4193. [Google Scholar] [CrossRef]
- Obbadi, A.; Errami, Y.; Rmaily, R.; Sahnoun, S.; El, A.; Agunaou, M. Parameters estimation of the single and double diode photovoltaic models using a Gauss—Seidel algorithm and analytical method: A comparative study. Energy Convers. Manag. 2017, 148, 1041–1054. [Google Scholar] [CrossRef]
- Chandani, S.; Anamika, J. Solar Panel Mathematical Modeling Using Simulink. J. Eng. Res. Appl. 2014, 4, 67–72. [Google Scholar]
- Savitha, P.B.; Shashikala, M.S.; Puttabuddhi, K.L. Modelling of 250Wp Photovoltaic Module and Its Performance Analysis Using Matlab /Simulink. Int. J. Electr. Electron. Data Commun. 2014, 2, 6–12. [Google Scholar]
- Tsai, H.-L. Insolation-oriented model of photovoltaic module using Matlab/Simulink. Sol. Energy 2010, 84, 1318–1326. [Google Scholar] [CrossRef]
- Usman, H.; Lawal, S.M.; Shehu, R.S. Behavioral Characteristics of Photovoltaic Cell with Different Irradiation in Matlab/Simuling/Simscape Environment. Int. Lett. Chem. Phys. Astron. 2014, 17, 316–326. [Google Scholar] [CrossRef]
- Sarniak, M.T.; Wernik, J.; Wołosz, K.J. Application of the Double Diode Model of Photovoltaic Cells for Simulation Studies on the Impact of Partial Shading of Silicon Photovoltaic Modules on the Waveforms of Their Current–Voltage Characteristic. Energies 2019, 12, 2421. [Google Scholar] [CrossRef]
- Mohamed, M.A.; Zaki Diab, A.A.; Rezk, H. Partial shading mitigation of PV systems via different meta-heuristic techniques. Renew. Energy 2019, 130, 1159–1175. [Google Scholar] [CrossRef]
- Pendem, S.R.; Mikkili, S. Modelling and performance assessment of PV array topologies under partial shading conditions to mitigate the mismatching power losses. Sol. Energy 2018, 160, 303–321. [Google Scholar] [CrossRef]
- Gallardo-Saavedra, S.; Karlsson, B. Simulation, validation and analysis of shading effects on a PV system. Sol. Energy 2018, 170, 828–839. [Google Scholar] [CrossRef]
- Jaszczur, M.; Teneta, J.; Hassan, Q.; Majewska, E.; Hanus, R. An Experimental and Numerical Investigation of Photovoltaic Module Temperature under Varying Environmental Conditions. Heat Transf. Eng. 2019, 1–14. [Google Scholar] [CrossRef]
- Sarniak, M. Influence of Solar Radiation and Ambient Temperature on the Unit Yield of a Photovoltaic System. Appl. Mech. Mater. 2015, 797, 202–209. [Google Scholar] [CrossRef]
- Kang, T.; Yao, J.; Jin, M.; Yang, S.; Duong, T. A Novel Improved Cuckoo Search Algorithm for Parameter Estimation of Photovoltaic (PV) Models. Energies 2018, 11, 1060. [Google Scholar] [CrossRef]
- Toledo, F.J.; Blanes, J.M.; Galiano, V. Two-Step Linear Least-Squares Method For Photovoltaic Single-Diode Model Parameters Extraction. IEEE Trans. Ind. Electron. 2018, 65, 6301–6308. [Google Scholar] [CrossRef]
- Orioli, A.; Di Gangi, A. A procedure to evaluate the seven parameters of the two-diode model for photovoltaic modules. Renew. Energy 2019, 139, 582–599. [Google Scholar] [CrossRef]
- Sarniak, M.T. Photovoltaic Systems; Warsaw University of Technology Publishing House: Warsaw, Polish, 2019; ISBN 978-83-7814-926-2. (In Polish) [Google Scholar]
- Drabczyk, K.; Panek, P. Silicon-Based Sollar Cells. Characteristics and Production Processes; Institute of Metallurgy and Materials Science of Polish Academy of Sciences: Krakow, Polish, 2012; ISBN 978-83-62098-07-1. [Google Scholar]
- International Electrotechnical Commission (IEC). IEC/PN-EN60891 Photovoltaic Devices—Procedures for Temperature and Irradiance Corrections to Measured I-V Characteristics; IEC: Genewa, Switzerland, 2009. [Google Scholar]
- Szymański, B. Photovoltaic Installations, 8th ed.; GLOBENERGIA: Kraków, Polish, 2019; ISBN 978-83-65874-00-9. (In Polish) [Google Scholar]


| Name of the PV Module Parameter: | Standard Module JAM60S01-320/PR | Half-Cell Module JAM60S03-320/PR |
|---|---|---|
| Type of PV cells | Monocrystalline Silicon | Monocrystalline Silicon |
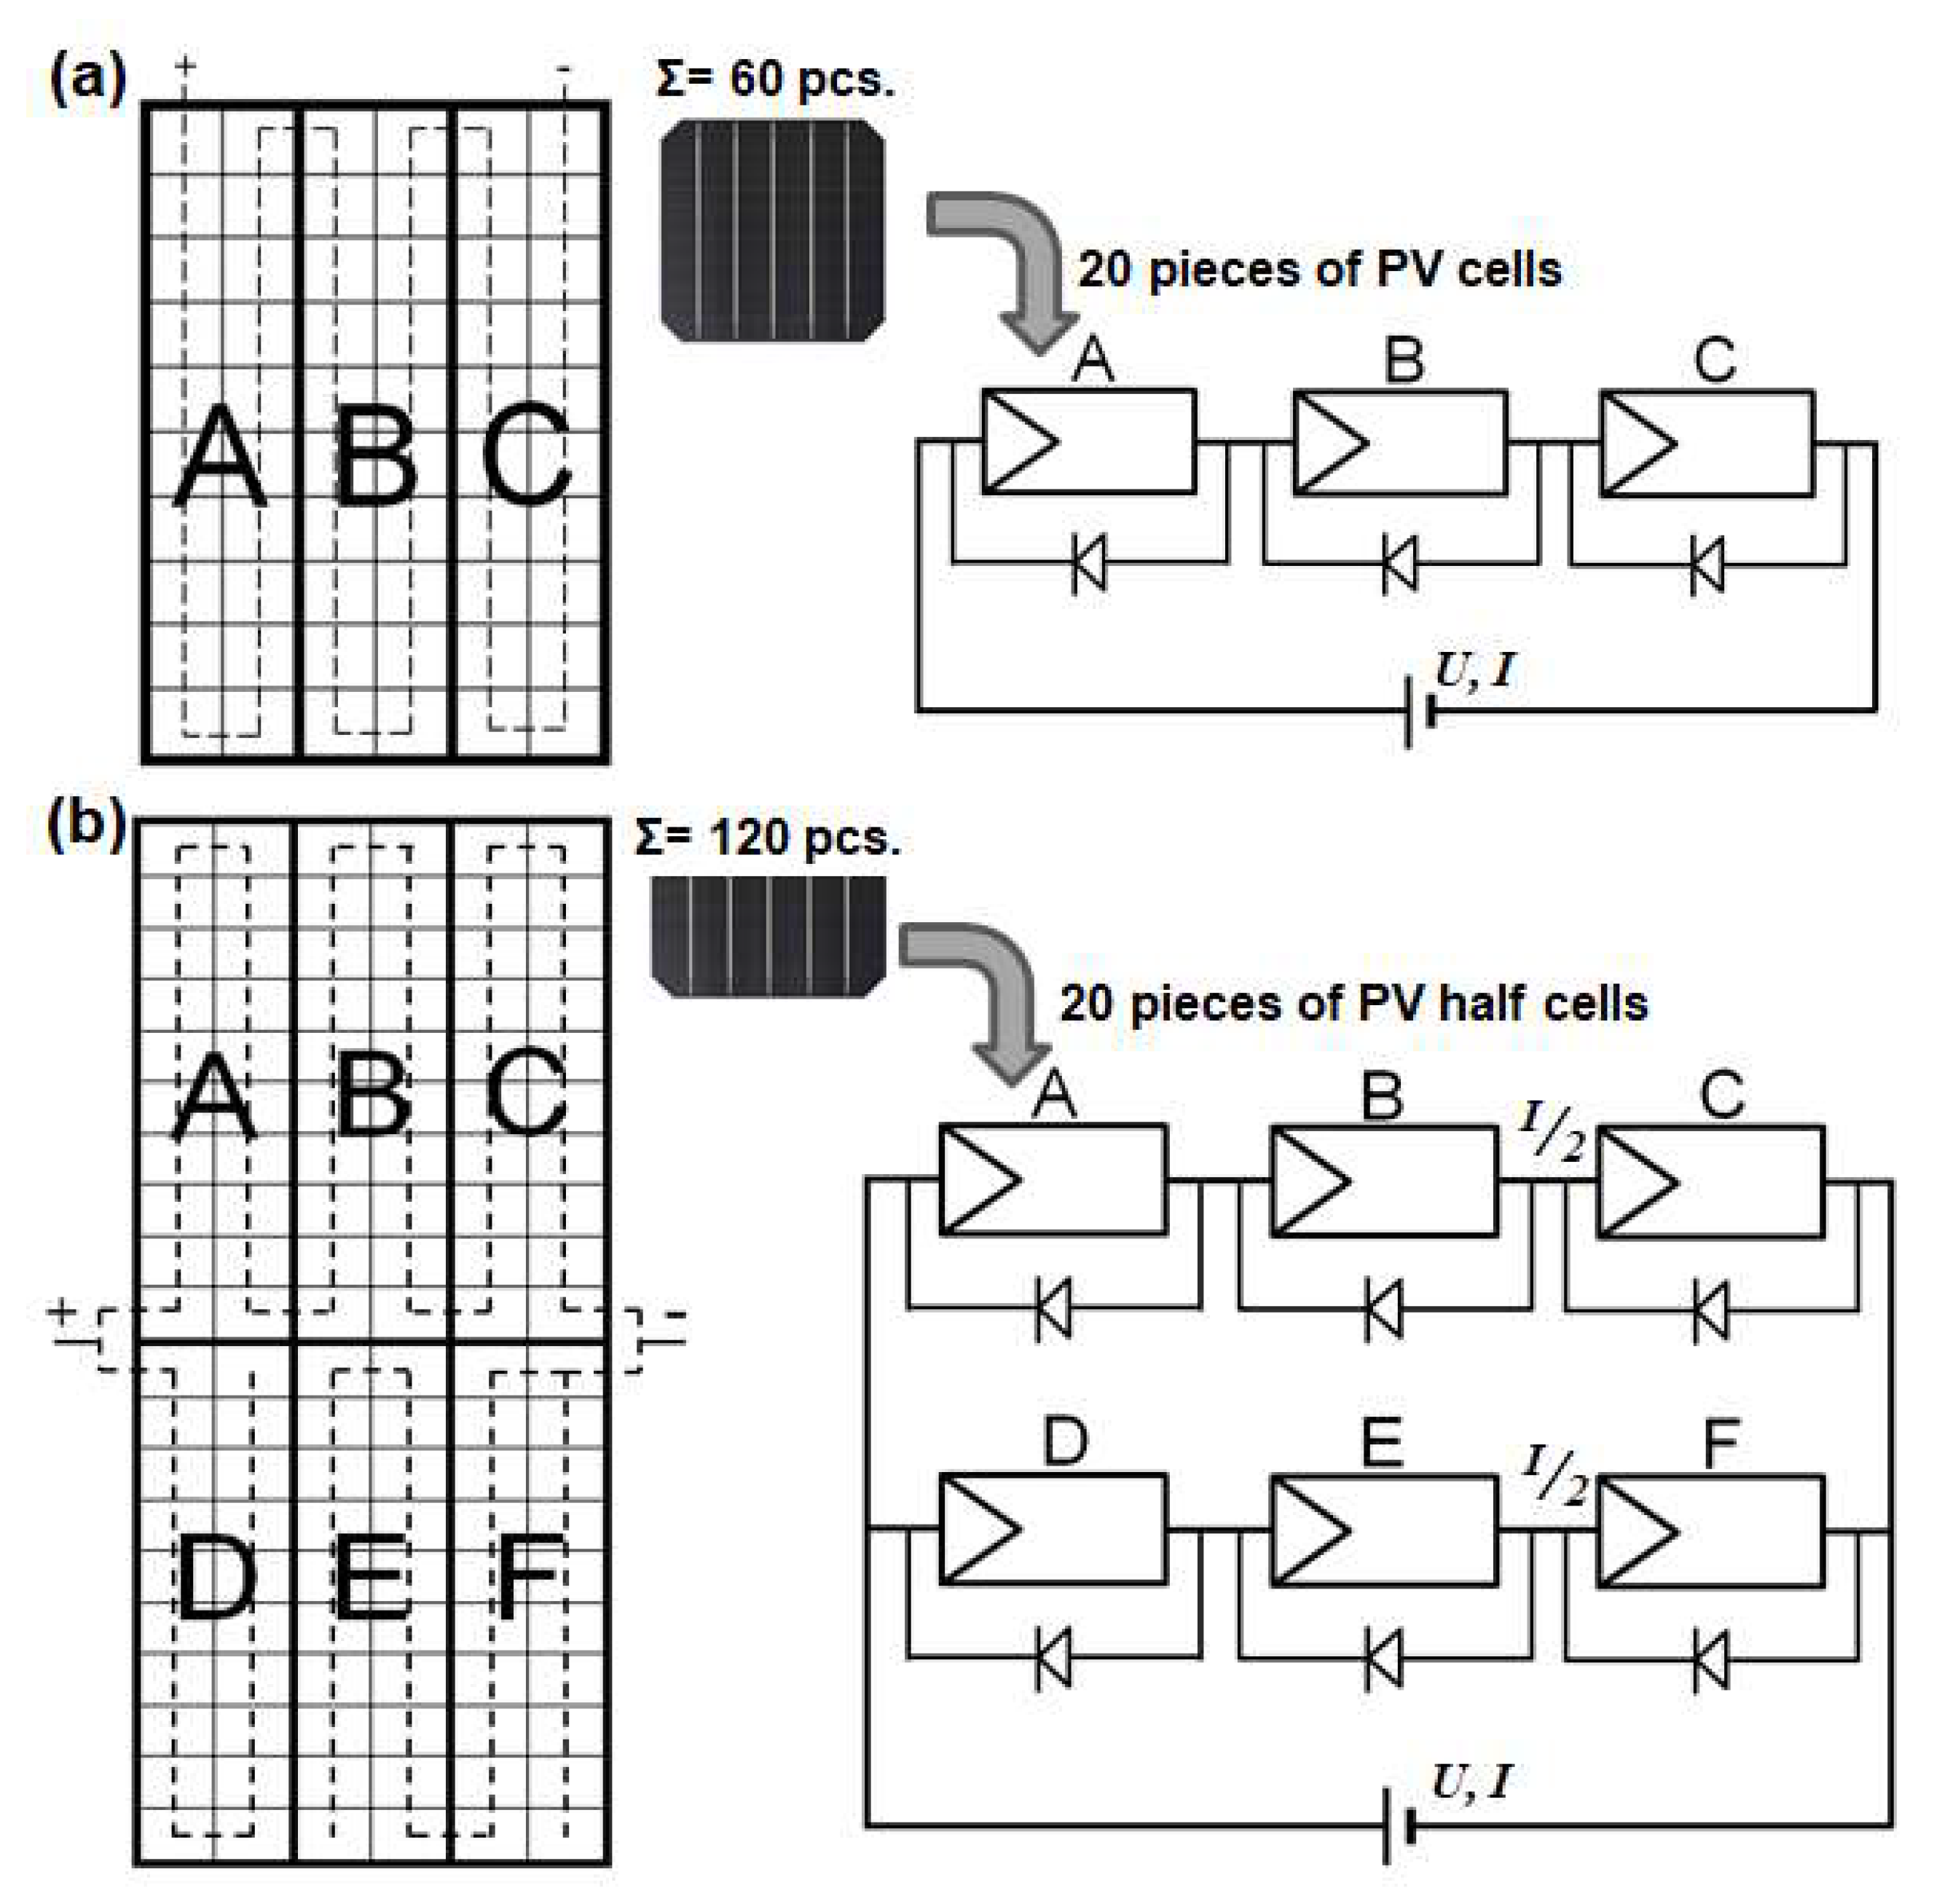
| Number of PV cells/half-cells, (pcs.) | 60 | 120 |
| Maximum Power Point—PMPP, (W) | 320 | 320 |
| Open Circuit Voltage—UOC, (V) | 40.8 | 40.22 |
| Voltage in MPP—UMPP, (V) | 33.48 | 33.34 |
| Short Circuit Current—ISC, (A) | 10.05 | 10.16 |
| Current in MPP—IMPP, (A) | 9.56 | 9.6 |
| Module Efficiency—η, (%) | 19.6 | 19.2 |
| Temperature Coefficient of ISC—αT, (%/°C) | +0.06 | +0,051 |
| Temperature Coefficient of UOC—βT, (%/°C) | −0.30 | −0.29 |
| Temperature Coefficient of PMPP—γT, (%/°C) | −0.38 | −0.36 |
| Temperature in NOCT conditions, (°C) | 45 | 45 |
| Dimensions of PV Module, (mm) | 1650 × 991 × 35 | 1678 × 991 × 35 |
| Mass, (kg) | 18.2 | 18.5 |
| Measurement Points: | PV Module Temperature TM, (°C) | Number of Shaded PV Cell Halves (pcs.) | Solar Surface Irradiance Unshaded/Shaded E, (W·m−2) |
|---|---|---|---|
| P1 (Figure 4) | 35.5 | 0 1 | 810/0 |
| P2 (Figure 5) | 36.9 | 4 (Figure 3a) | 809/444 |
| P3 (Figure 6) | 36.2 | 8 (Figure 3b) | 808/443 |
| P4 (Figure 7) | 33.5 | 12 (Figure 3c) | 805/442 |
| P5 (Figure 8) | 32.8 | 24 (Figure 3d) | 802/432 |
| Parameters and Coefficients: | Measurement Results | Simulation Results | Relative Error of Comparison, (%) |
|---|---|---|---|
| ISC, (A) | 8.23 | 8.09 | 1.7 |
| UOC, (V) | 37.87 | 38.28 | 1.1 |
| IMPP, (A) | 7.61 | 7.58 | 0.4 |
| UMPP, (V) | 31.58 | 32.98 | 4.4 |
| PMPP, (W) | 240 | 250 | 4 |
| FF, (%) | 77.1 | 80.7 | 4.7 |
| η, (%) | 17.8 | 18.6 | 4 |
| Parameters: | Model Calculations Results | Measurement Results | Relative Error of Comparison, (%) |
|---|---|---|---|
| ISC, (A) | 10.21 | 8.23 | 19% |
| UOC, (V) | 39 | 37.87 | 3% |
| PMPP, (W) | 307.9 | 240 | 22% |
| PV Module Type/Number of Shaded PV Cells | Relative Decrease in Current—δΔI, (%) | Relative Decrease in Voltage—δΔU, (%) |
|---|---|---|
| MonoSol 260 EX/2 | 59 | 39 |
| JAM60S03-320/PR/4 (Figure 5) | 24 | 42 |
| MonoSol 260 EX/4 | 61 | 71 |
| JAM60S03-320/PR/8 (Figure 6) | 22 | 70 |
© 2020 by the author. Licensee MDPI, Basel, Switzerland. This article is an open access article distributed under the terms and conditions of the Creative Commons Attribution (CC BY) license (http://creativecommons.org/licenses/by/4.0/).
Share and Cite
Sarniak, M.T. Modeling the Functioning of the Half-Cells Photovoltaic Module under Partial Shading in the Matlab Package. Appl. Sci. 2020, 10, 2575. https://doi.org/10.3390/app10072575
Sarniak MT. Modeling the Functioning of the Half-Cells Photovoltaic Module under Partial Shading in the Matlab Package. Applied Sciences. 2020; 10(7):2575. https://doi.org/10.3390/app10072575
Chicago/Turabian StyleSarniak, Mariusz T. 2020. "Modeling the Functioning of the Half-Cells Photovoltaic Module under Partial Shading in the Matlab Package" Applied Sciences 10, no. 7: 2575. https://doi.org/10.3390/app10072575
APA StyleSarniak, M. T. (2020). Modeling the Functioning of the Half-Cells Photovoltaic Module under Partial Shading in the Matlab Package. Applied Sciences, 10(7), 2575. https://doi.org/10.3390/app10072575