1. Introduction
The cyber space is recognized as the fifth battlespace following land, sea, air, and space. In addition to simply protecting information, cyber warfare can affect military strategies and operations that are directly linked to national security. Although the military is attempting to detect and mitigate cyber attacks to counter them, cyber attacks are evolving constantly and new types of attacks are continuing to emerge [
1,
2].
To effectively respond to the cyber attack that develops in various forms, it is necessary to analyze the effects of cyber attacks on the assets to be protected and establish defense policies. Furthermore, to respond more proactively, it is essential to analyze not only existing cyber attacks, but also the possible occurrence of new types of cyber attacks. In other words, the military should anticipate the possibility of an attack by the enemy, analyze in advance whether a specific situation would occur or what a 0-day vulnerability may cause, and then simulate the damage in various situations to select the best policy.
The assets to be protected by the military are not limited to information, but also include weapon systems deployed throughout the country. The ability to construct large-scale networks is therefore crucial in enabling the analysis of the effects of cyber attacks on each military asset, as well as on joint strategies and operations.
Many studies have been conducted on cyber attack modeling such as attack graph approach, attack tree approach, cyber kill chain modeling approach, etc. [
3,
4,
5,
6,
7,
8,
9,
10,
11,
12,
13,
14]. Note that previous studies on cyber attack modeling has induced some issues such as scalability in a large-scale network system composed of tens of thousands of hosts, which make the prediction of possible attack paths and patterns be difficult. Because limitations exist for fine-tuning the various attack types, it is therefore difficult to setup complex cyber attack scenarios. Recently, cyber attacks do not simply end with a single attack, but have a complex form of various types of attacks. Furthermore, new forms of cyber attacks are taking place continuously. To cope with these challenges, new approach for modeling method which is flexible enough to easily add newly emerging attack types and model complicated attack process systematically is required. In addition, a scalable modeling method is needed in view of analyzing the effect of cyber attacks on large-scale military networks at the national level.
We herein propose a hierarchical multi-stage attack scenario modeling based on the goal and effect (G&E) model. It is scalable to large network environments and has features to establish various attack types and effects. In addition, we propose an analysis system for cyber battles. This system can be used to proactively analyze damages caused by various cyber attacks and secure countermeasures. This paper not only suggests a methodology, but also proposes a practical modeling method and system. The actual cyber attack case is simulated using the proposed modeling method, and the performance of the proposed analysis system is quantitatively evaluated.
In
Section 2, we review previous studies regarding cyber attack modeling methods and cyber attack classification studies.
Section 3 describes the proposed cyber attack modeling method and analysis system.
Section 4 presents the simulation and performance evaluation results. Finally,
Section 5 concludes the paper.
2. Related Work
2.1. Cyber Attack Modeling
Cyber attack is modeled by various methods, such as the attack graph approach, attack tree approach, cyber kill chain modeling approach, diamond model, and simulation approach [
3].
The attack graph approach is a typical approach for modeling cyber attacks. The attack graph method is a method of graphing all possible paths that an attacker can attack by using information of hosts in a network. Research is underway to detect the most vulnerable or the most likely of the attack paths generated. In addition, research is being conducted to evaluate security risks based on attack graphs. The authors of [
4] introduced NetSPA tools that analyze firewall rules and vulnerabilities to construct attack graphs. NetSPA is a tool that derives a number of methods to attack vulnerable hosts behind a firewall. Using Vulnerability scans, Vulnerability databases, Firewall rules, and Topology information, reachability can be automatically calculated and an attack graph can then generated. However, it is difficult to create a full attack graph as the network size grows. The authors of [
5] proposed a bidirectional-based search strategy to improve the efficiency of attack graph generation and reduce system resource consumption. It defines the minimum cost to strengthen a network and combines the attack graph and genetic algorithm to suggest an optimized network. In [
6], the authors suggested a framework that implements attack graph generation, real-time event analysis techniques, attack effect assessments, and the anytime approach for attack graph building and analysis. Cauldron’s suggestion in [
7] is also based on the construction and analysis of attack graphs. Cauldron transformed raw security data into attack graphs to provide a common operating picture and a concrete understanding of how individual and combined vulnerabilities affect the overall network security. Generating attack graphs is computationally complex especially for large networks [
3]. Note that existing attack models have scalability issues for large network systems and predicting possible attack paths and patterns in large network systems is challenging [
8].
The attack tree is another typical approach for modeling cyber attacks. In [
9], cyber attack is represented in the form of a tree. The attack tree constitutes a cyber attack scenario by constructing the final cyber attack target as the root and sub-targets as leaves. In [
10], an attack model based on an attacker’s intent was proposed to determine the role of an individual intrusion detection system (IDS) in a distributed IDS environment. An attack tree based on cyber attack modeling can derive various attack scenarios to achieve the final attack target. However, the more complex the attack scenario, the more difficult it is to identify and describe an attacker’s intent.
The cyber kill chain is derived from the conventional military term—kill chain. A kill chain is a continuous process from detecting a target to destroying it. Cyber kill chain modeling has been used for many years by the U.S. Department of Defense (DoD), and this model defines an attack as a chain of actions [
3,
11]. The cyber kill chain has been proposed by various models including Lockheed Martin’s cyber kill chain model, the U.S. DoD’s cybersecurity kill chain model, and Gartner’s attack chain model. In particular, Lockheed Martin has developed a cyber kill chain model that comprises seven steps: reconnaissance, weaponization, delivery, exploitation, installation, command and control, and actions on objectives [
12]. The model is malware-focused and centers on the advanced persistent threat (APT) attack. Most cyber kill chain models use a simplified approach at the conceptual level, and there exist limitations in fine-tuning for various attack types or modeling complex attacks in a scalable manner.
The diamond model is a novel model for cyber intrusion analysis [
13]. The model comprises four main components: adversary, infrastructure, capability, and victim, all of which are connected in a diamond shape. Diamond-shaped nodes represent one attack event. The diamond model can express how and why an attack occurred and is primarily used as an analytical methodology for analyzing security incidents.
The cyber analysis modeling evaluation tool provides a simulation toolkit to evaluate the risk and enhance the resiliency of cyber attacks [
14]. Executing cyber attacks and analyzing their effects in a large-scale real network environment requires much time and cost. Furthermore, recovery from paralyzed network due to cyber attacks can cause another serious problem in terms of the stability of the network. This is why cyber attack modeling based on simulation has been proposed so far. However, simulation-based cyber attack model is confined to the modeling of specific attack types, and the setup and application of complex cyber attack scenarios are difficult to achieve.
2.2. Cyber Attack Classification and Modeling Resources
The ATT&CK model is a cyber adversary behavior model that reflects the attack life cycle of an attacker [
15]. It defines tactics that correspond to the target of the enemy attack, and presents the ATT&CK matrix, which defines techniques as a concrete method for achieving the attack purpose. This model systematically explains the attack activity that an attacker performs inside a network after the exploit phase in the cyber kill chain model in terms of tactics, techniques, and procedures (TTP). The ATT&CK matrix is available for Windows, Mac, and Linux platforms. In addition, the PRE ATT&CK model has been proposed to classify the types of actions to select attack objects, obtain information, and perform infiltration actions [
16].
The common attack pattern enumeration and classification (CAPEC) lists and categorizes the contents of known attacks [
17]. That is, it classifies an attacker’s attack patterns that penetrate security vulnerabilities. It is provided by MITRE and each attack pattern is assigned an identifier. Each attack pattern provides an attack procedure, attack essentials, countermeasures, and other related attack patterns. The attack patterns listed in the CAPEC comprises attack methods to exploit hardware or software vulnerabilities.
Common vulnerabilities and exposures (CVE) was established and operated by MITRE in 1999 as a standard for attack vulnerabilities [
18]. It was then systematically organized by the National Institute of Standards and Technology in the U.S. by developing the national vulnerability database. The CVE identifier consists of the CVE character, the year in which the vulnerability was found, and a unique value that can be used to identify publicly known vulnerabilities.
Common platform enumeration (CPE) is a standardized method for naming software applications, operating systems, and hardware platforms [
19]. The CPE value comprises seven fields: <part>, <vendor>, <produce>, <version>, <update>, <edition>, and <language>, some of which can be left blank. The <part> field is divided into application, hardware platform, and operating system.
The common vulnerability scoring system (CVSS) identifies the key features of a vulnerability and provides a method for generating a score that reflects the severity of the vulnerability. The CVSS can provide standardized vulnerability scores and an open framework as well as prioritize risks. The CVSS is categorized into version 2.0 and version 3.0 depending on the difference in the metric and scoring method [
20].
3. Proposed Hierarchical Multi-Stage Cyber Attack Scenario Modeling Based on G&E Model and Analysis System
We herein propose a hierarchical multi-stage attack scenario modeling method based on the G&E model. The G&E model can express various goals of an attack and damage effects without being limited to specific types. In recent years, cyber attacks have not been composed of a single attack, but have evolved into a combination of various attacks to achieve the final goal. The hierarchical multi-stage cyber attack scenario modeling method combines the G&E model to construct a unit attack, and the multi-stage configuration of unit attacks achieves the final goal of a cyber attack. The proposed method enables the organization of complex scenarios systematically and facilitates the intuitive understanding of cyber attack progress.
3.1. G&E Model
The proposed G&E model focuses on reflecting an attacker’s purpose of attack and the consequences of a successful attack, rather than on specific attack methods. It defines the attacker’s goal to the victim and the target’s damage effect from the attack. The goal or effect to be reflected in the model is identified by a unique number. Each G&E model has a unique name and an explanation. Additionally, it has various attributes to model the details.
Figure 1 shows the conceptual diagram of G&E model.
Referring to various cyber attack cases, 11 G&E models are identified and applied to the proposed model. The identified G&E models are social engineering, reconnaissance, privilege escalation, forgery, denial of service, command and control, exfiltration, destroy device, spreading, resource consumption, and unknown.
Table 1 shows explanation and attributes.
As shown in
Table 1, the G&E model has individual attributes and can be expressed in detail through the settings. In reconnaissance with G&E 2, six attribute values exist. Scan Range sets the range for scanning, and Target Device specifies the target to find through the scan. Start Time sets the time to start the scan and Inter-arrival Time means the interval to perform the scan. Packet Size sets the size of the packet to be transmitted during the scan, and Duration means the duration of the scan.
For privilege escalation with G&E 3, three attribute values exist. CVE List is a list of CVE IDs used to obtain privileges. Gain Privilege Probability specifies the probability of obtaining a privilege if the CVE List is not specified. Privilege Type sets whether the privilege type is user or administrator.
The G&E model can be mapped to the tactic concept of ATT&CK, and various attack patterns of CAPEC can be applied. New attacks will continue to emerge, and the G&E model can be extended to reflect this.
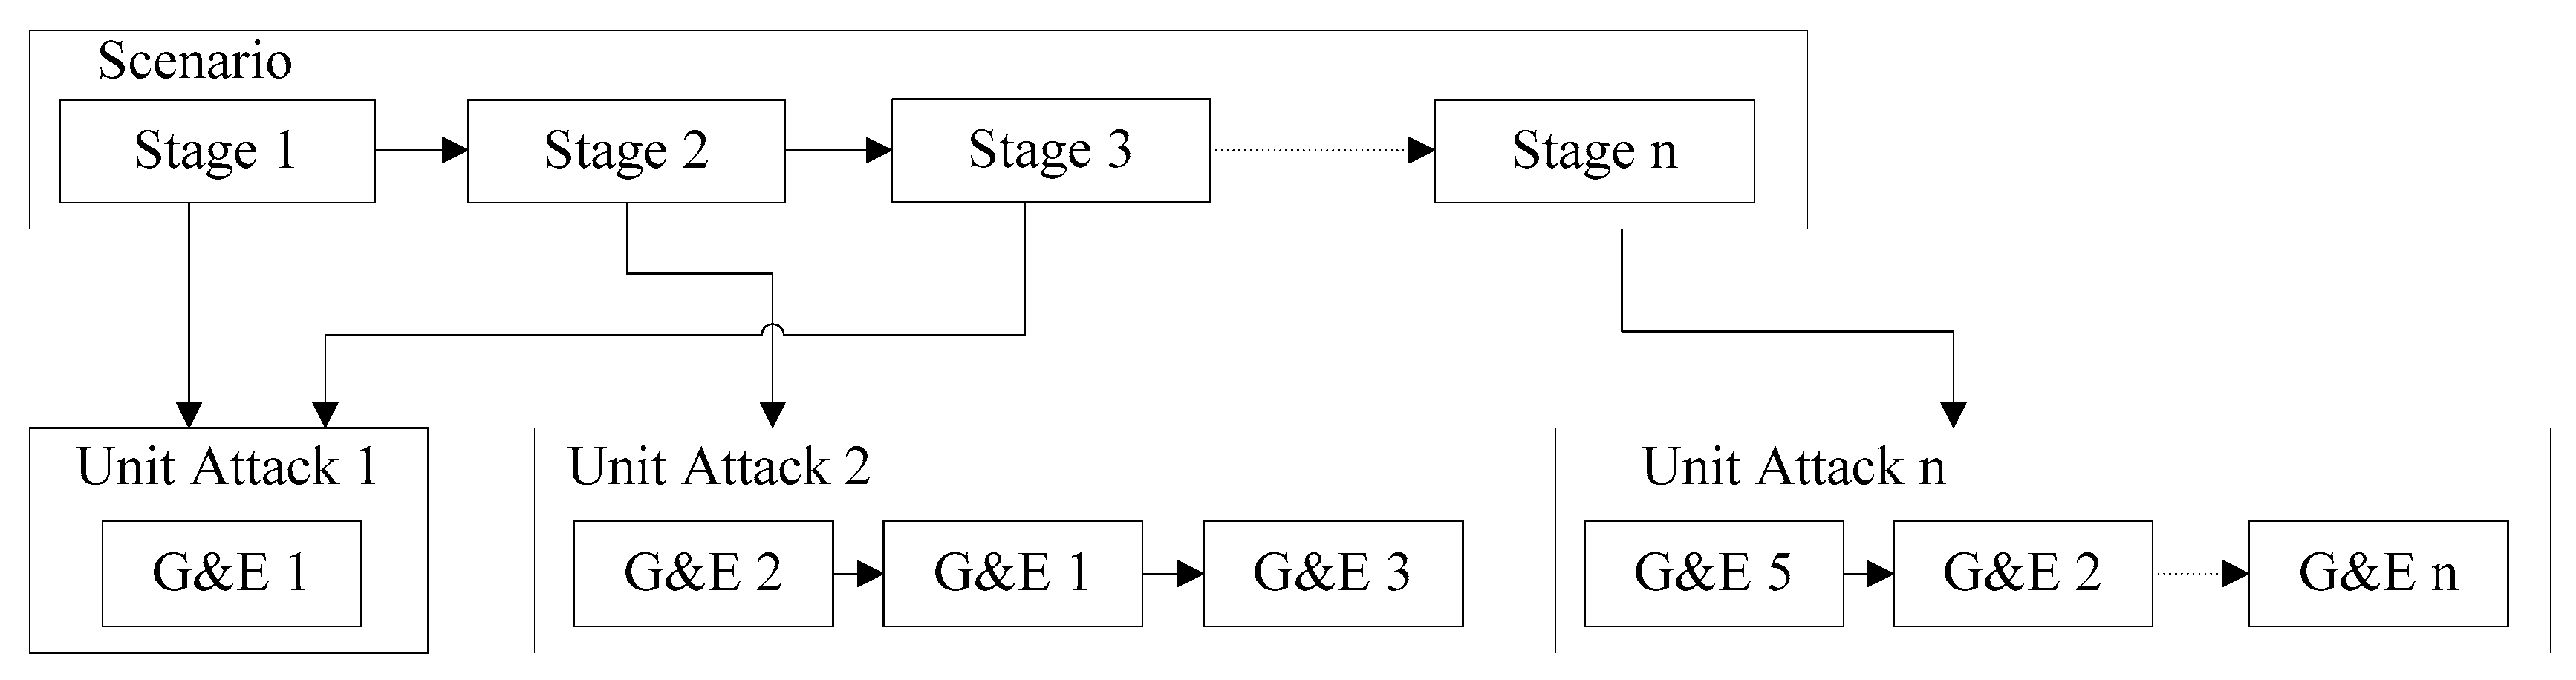
3.2. Hierarchical Multi-Stage Cyber Attack Scenario Modeling
We herein propose a hierarchical multi-stage cyber attack scenario modeling method, as shown in
Figure 2. The philosophy of this modeling method is that attack scenarios can be constructed to be extremely short or extremely long and complex, and should be able to express the desired attack goals and damage effects. Stages in the scenarios define the subgoals to achieve the end goal and can be long and complex. Depending on the success and failure of the current stage, progress to the next stage can be set. Attack graphs also have this concept, but only focus on the view of connected nodes. A unit attack is a payload of a stage, which describes a series of actions for specifying the stage. In particular, the goals and effects are composed of a combination of G&E models.
The components of the stage are presented in
Table 2. Label indicates the name of the Stage. Minimum Delivery Delay is the time to wait after the start of the Stage and can simulate an attacker’s start-up time of attack. Unit Attack Payload refers to the Unit Attack called on the Stage. The Execution Condition comprises the execution conditions of the other stage and the current stage to be referenced. Destination is a field that defines a cyber attack target. Success is a field that defines the success condition of the stage.
The components of the unit attack are shown in
Table 3. Label indicates the name of a unit attack. G&E is the name of the G&E model. To express the goals and effects, a combination of G&E models called in the unit attack is described. Execution Condition consists of the name of the other G&E model to be referenced and the current G&E execution condition. Arguments is a field that defines the properties required for each G&E model.
The proposed modeling scheme can be mapped to a cyber kill chain model, and more specific configurations are possible.
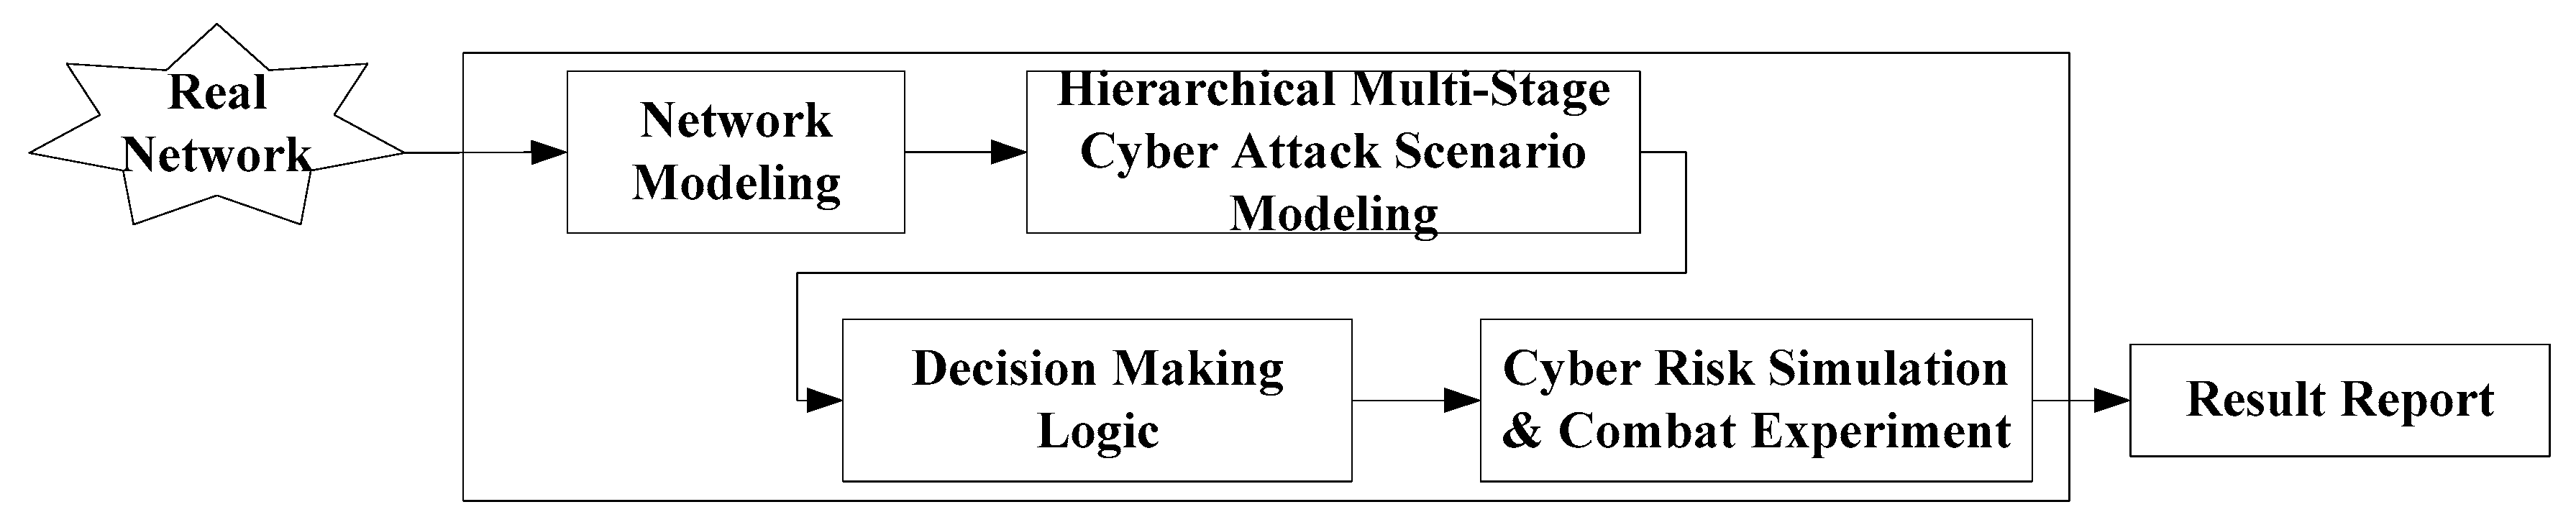
3.3. Analysis System for Cyber Risk Management
In this section, we propose an analysis system that can perform cyber risk simulation and combat experiment over time in a large-scale network environment developed based on the OPNET simulator. The conceptual diagram of the analysis system is shown in
Figure 3. The operation of the analysis system proceeds in the following order. First, the real network is scanned to gather the information needed to create a simulated network model.
In the simulated network model, the main asset, which is a host or a security device, is composed of a network. The host contains CPE information and Vulnerabilities information. Security Devices consist of Firewall, IDS/IPS, Anti-DDoS, and Anti-Virus. An attacker’s behavior is modeled by creating a hierarchical multi-stage cyber attack scenario and setting a goal or damage effect. Compromise and effect of damage are based on decision-making logic. Finally, when the combat experiment is completed, the simulation results will be reported.
The decision-making logic is summarized in
Figure 4. In the G&E model that utilizes the CVE-ID attribute value, a breach is determined by the combination of the host’s CPE information, vulnerability information, and security device information. The exploitability score is a metric of the CVSS. This is used as a probability of attack success to determine a breach. If determined as comprised, the attacker’s G&E will affect the victim’s host and network.
4. Simulation and Performance Evaluation
We ran simulation over APT cyber attack cases using the proposed modeling method and analysis system. A few years ago, a massive APT attack aimed at paralyzing major press and corporate networks occurred in this country. Several tens of thousands of systems were infected with BotNets, causing serious damages such as corruption of disk information including data, boot area, and the system. If a civilian damage occurs on a large-scale military tactical network, the results of the simulation can be analyzed through the simulation methodology proposed herein. Additionally, the performance of the proposed analysis system was quantitatively evaluated.
4.1. Advanced Persistent Threat Modeling under Proposed System
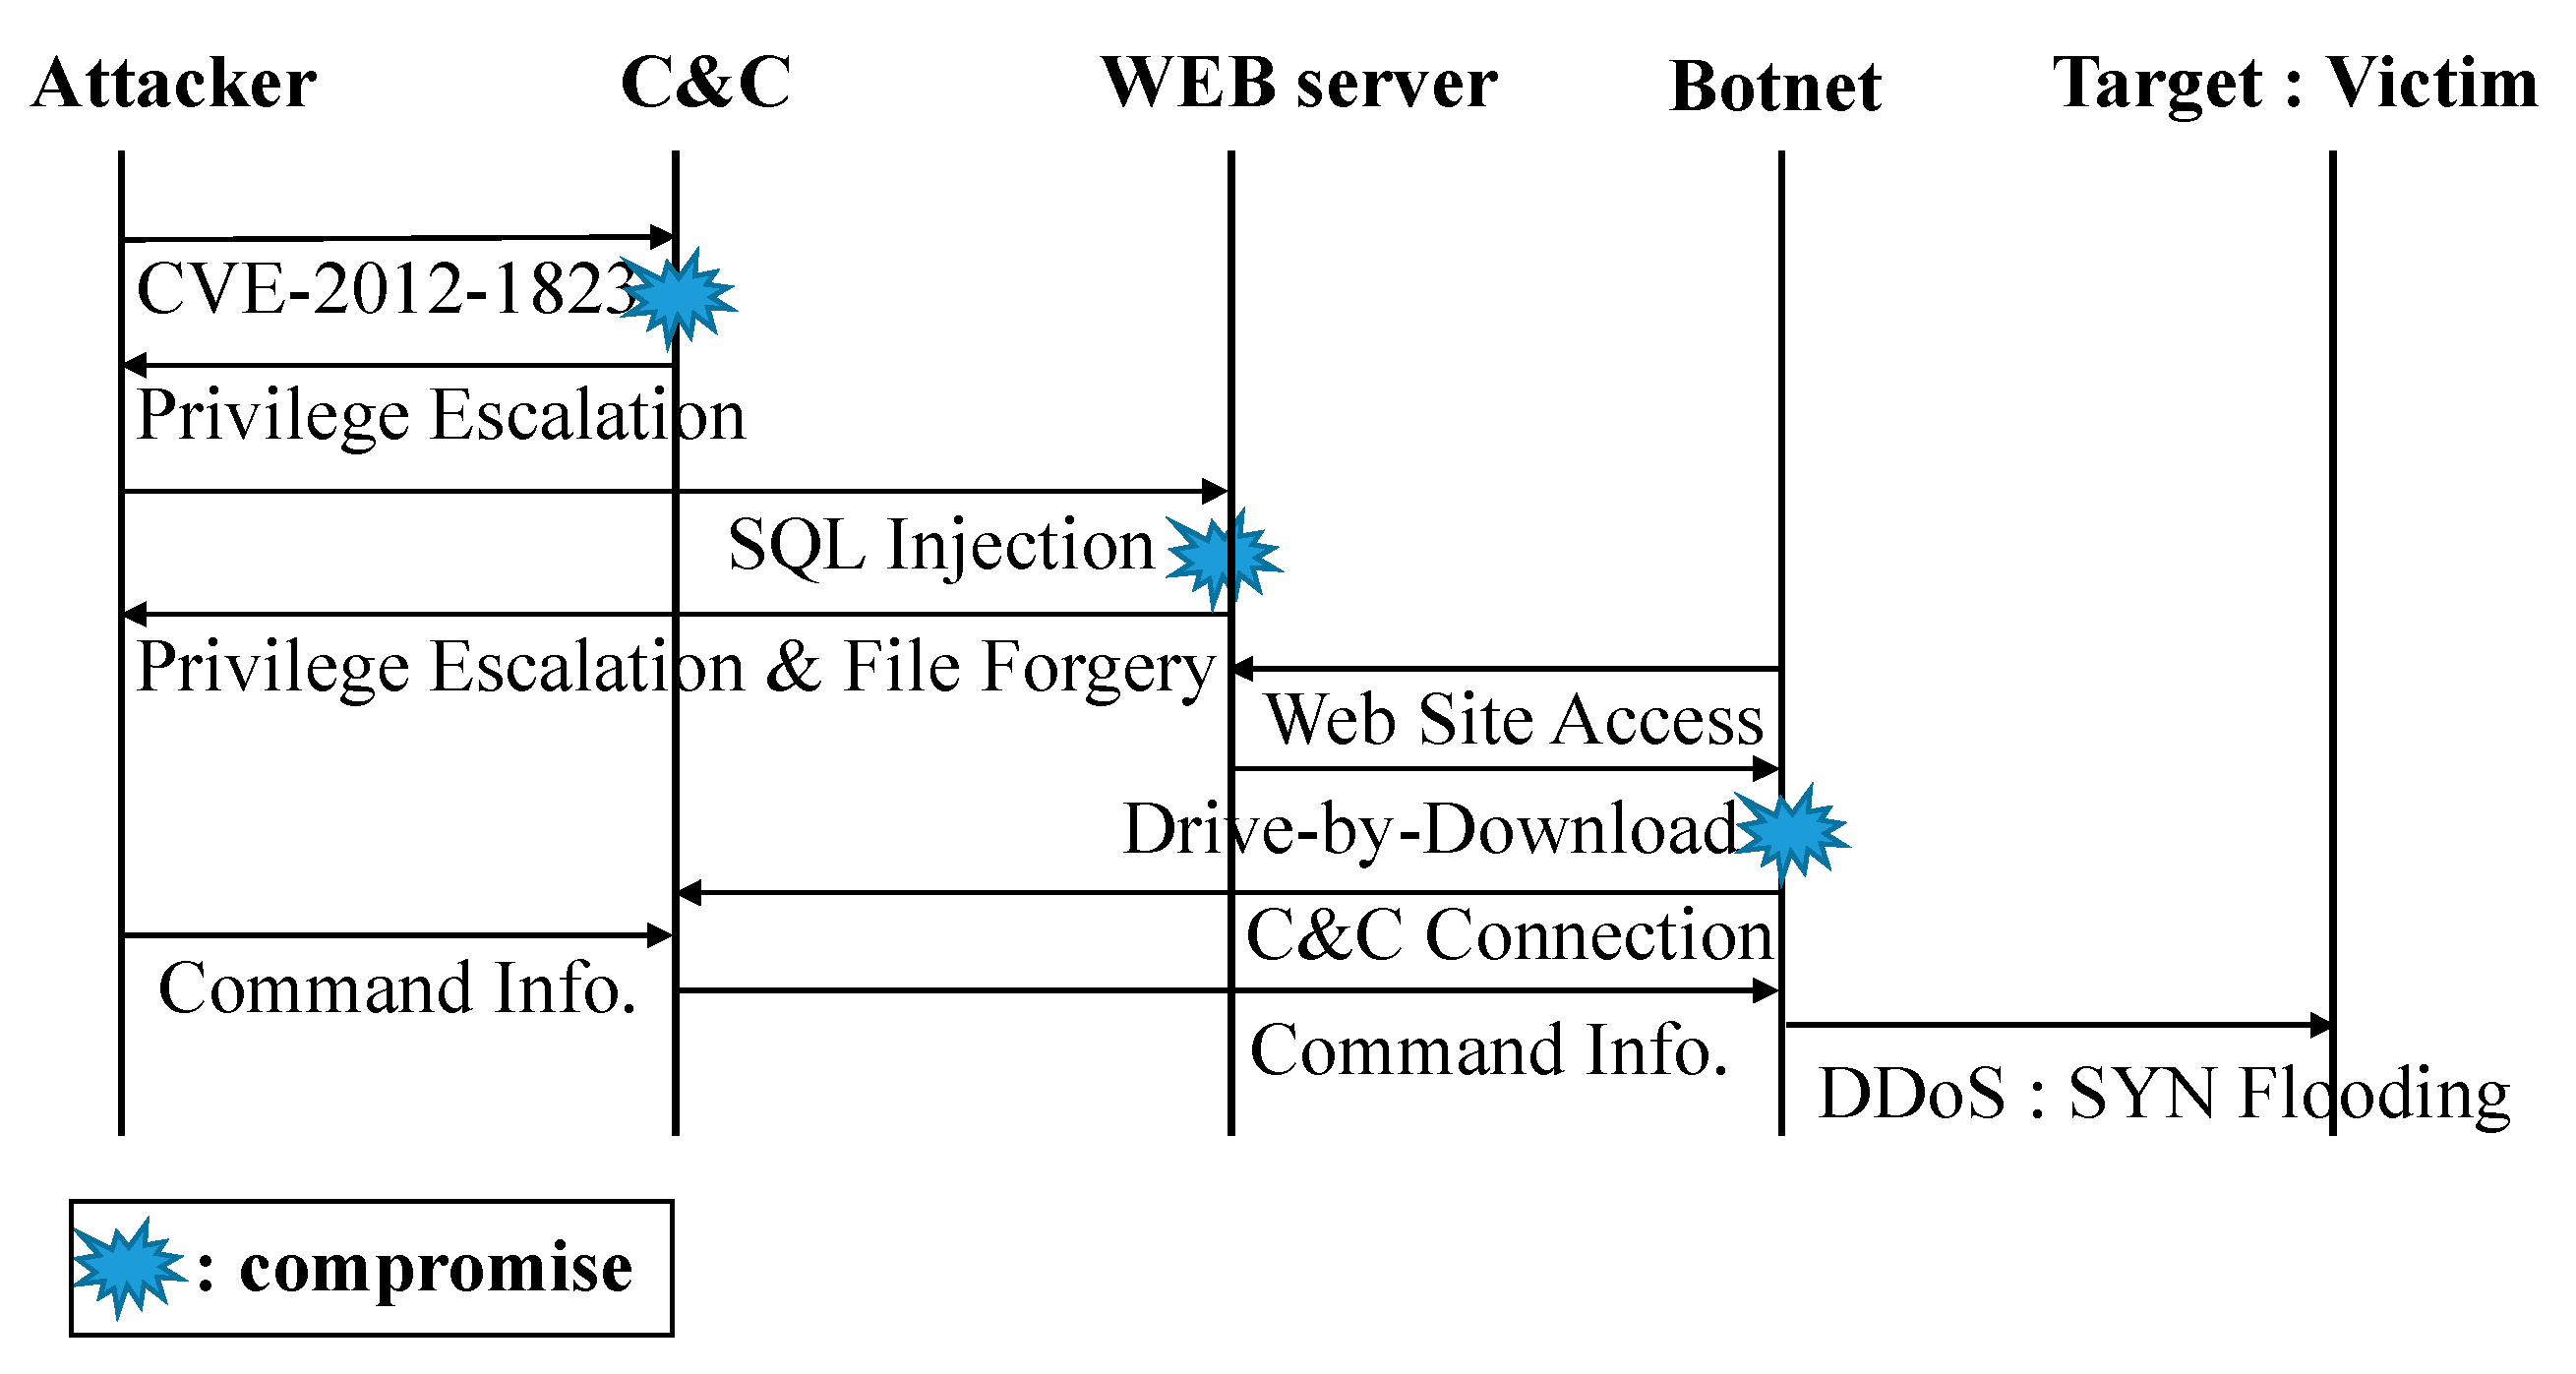
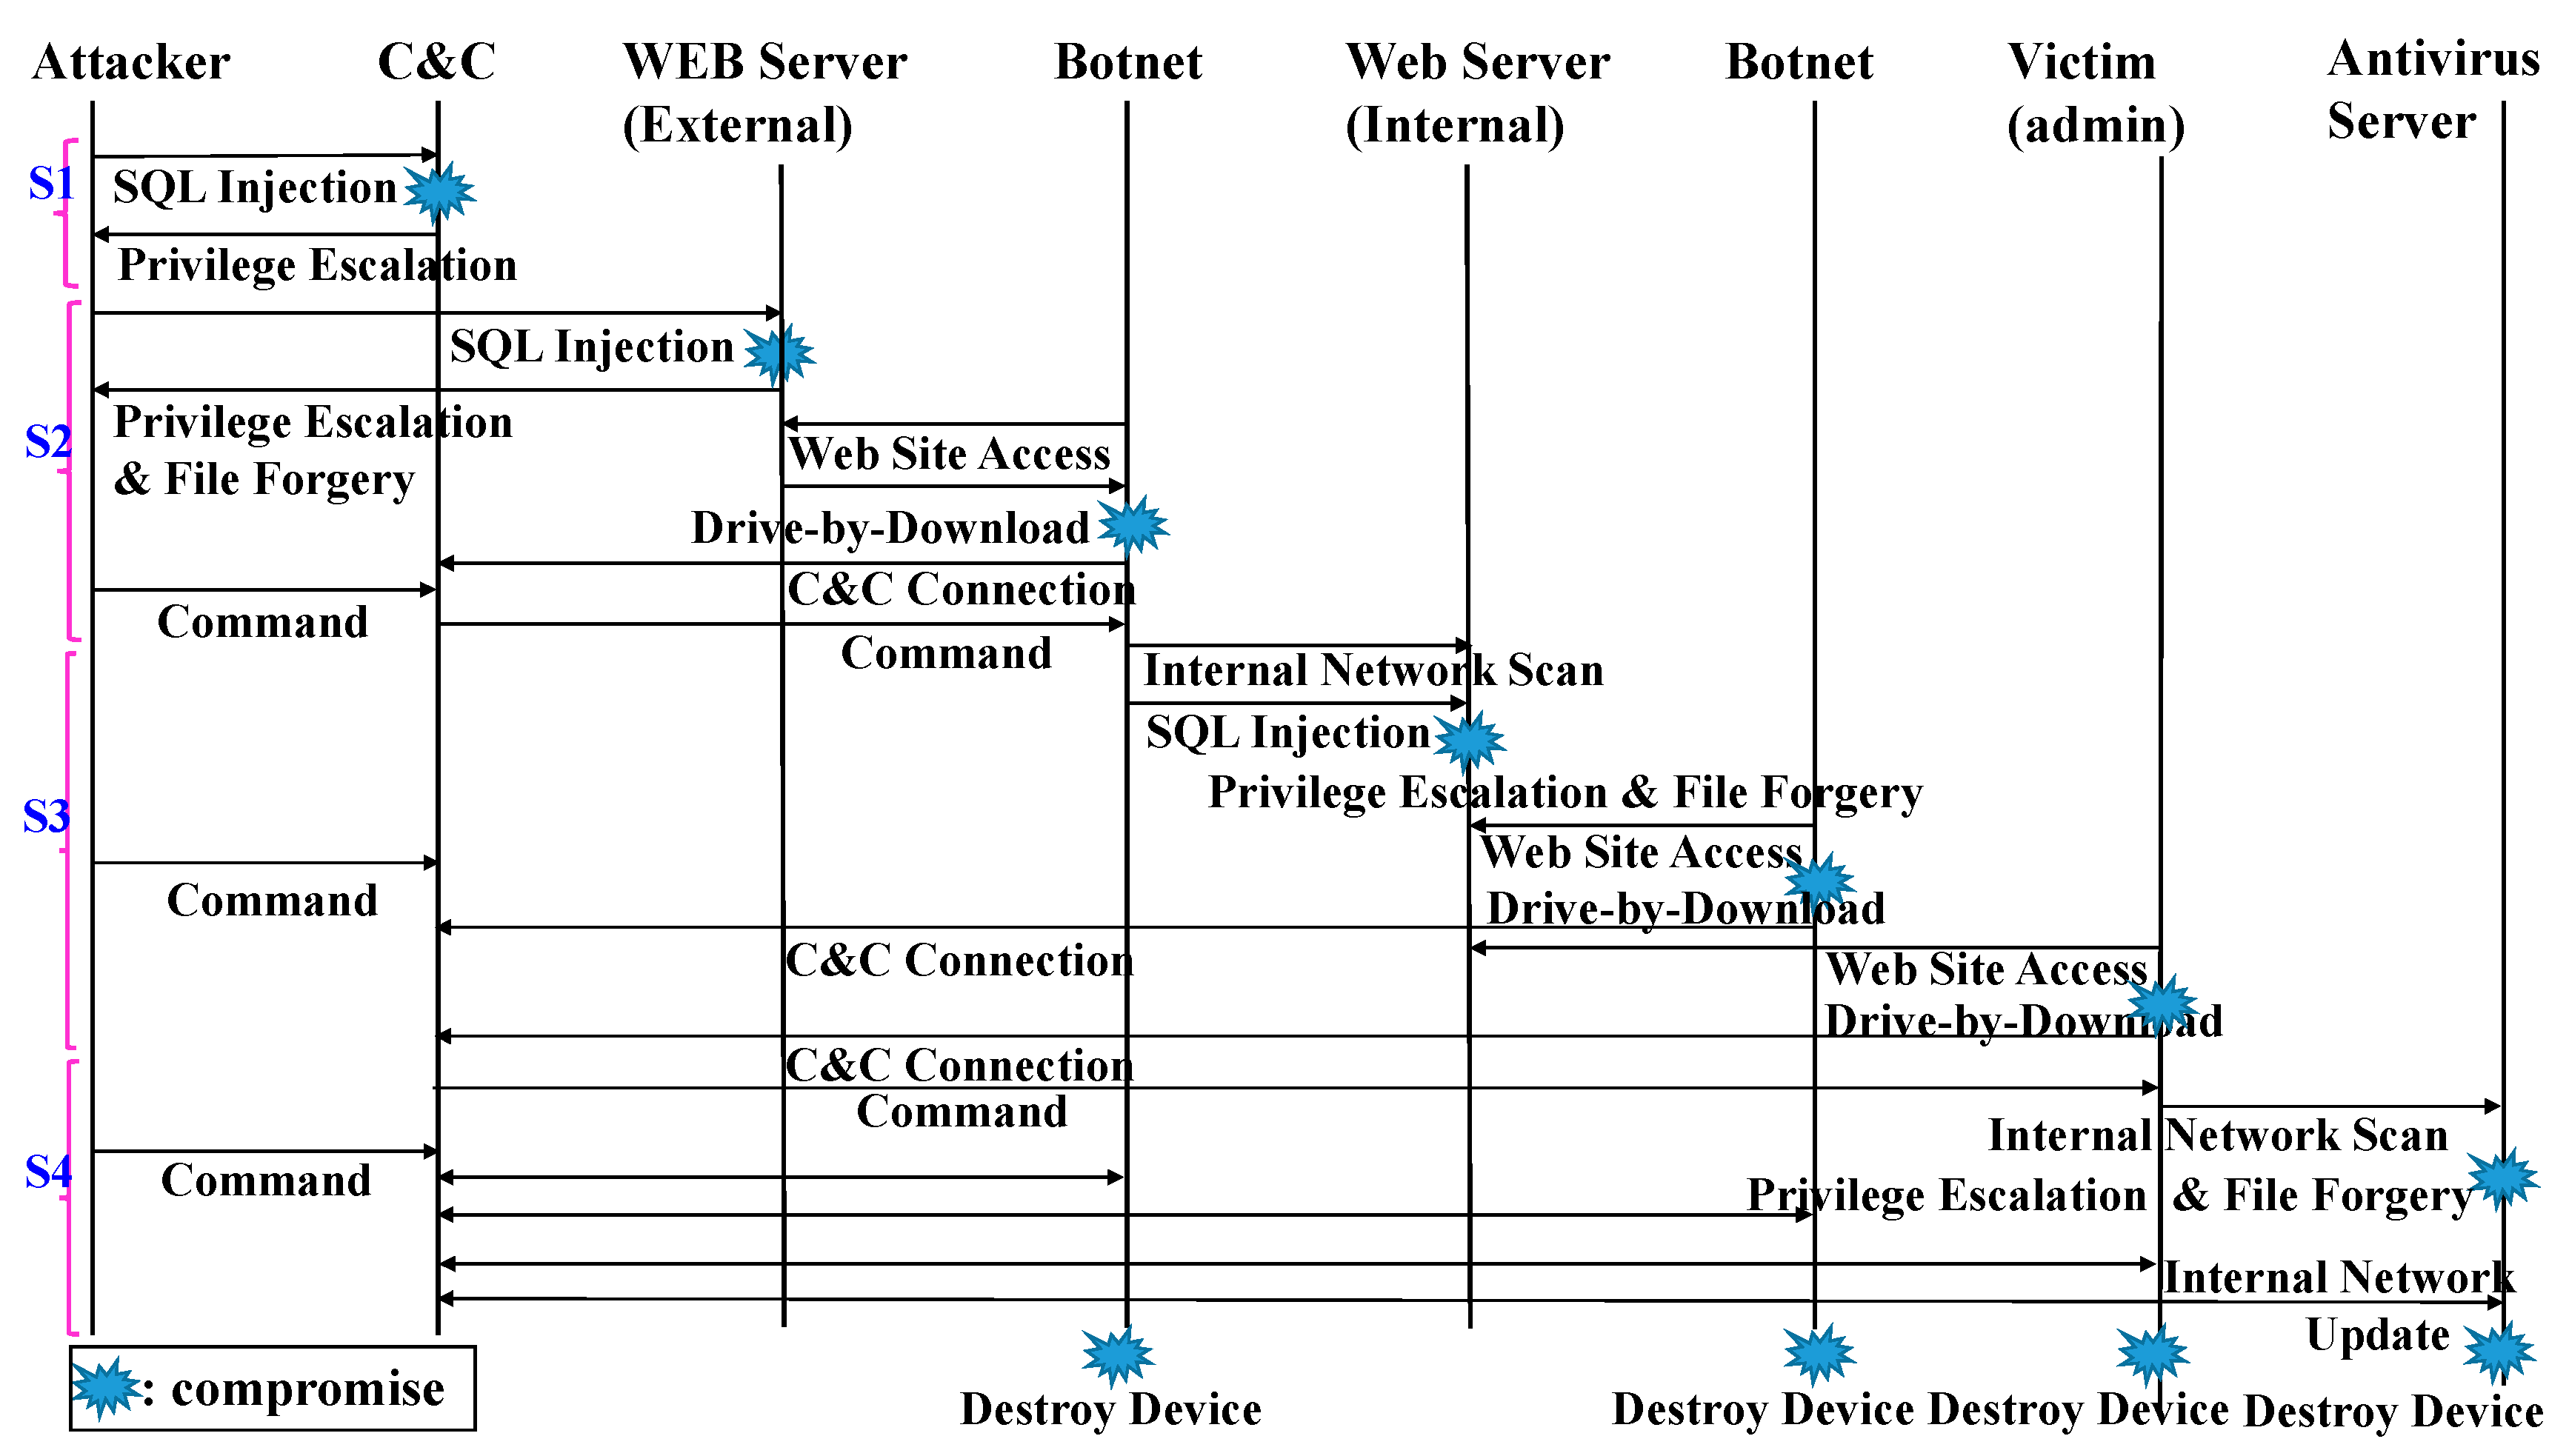
The procedure of the large-scale APT attack is shown in
Figure 5. First, an external attacker builds a command & control (C&C) server and infects an external web server. The terminal connecting to the infected external web server in the target network is used as BotNet. A BotNet refers to a group of computers which have been infected by malware and have come under the control of a malicious actor. BotNet infects the web server of the target internal network, administrator terminal by accessing the web server, antivirus server, and terminals by accessing the antivirus server, in that order. Finally, all internal systems in the target network are destroyed by infected anti-virus update files.
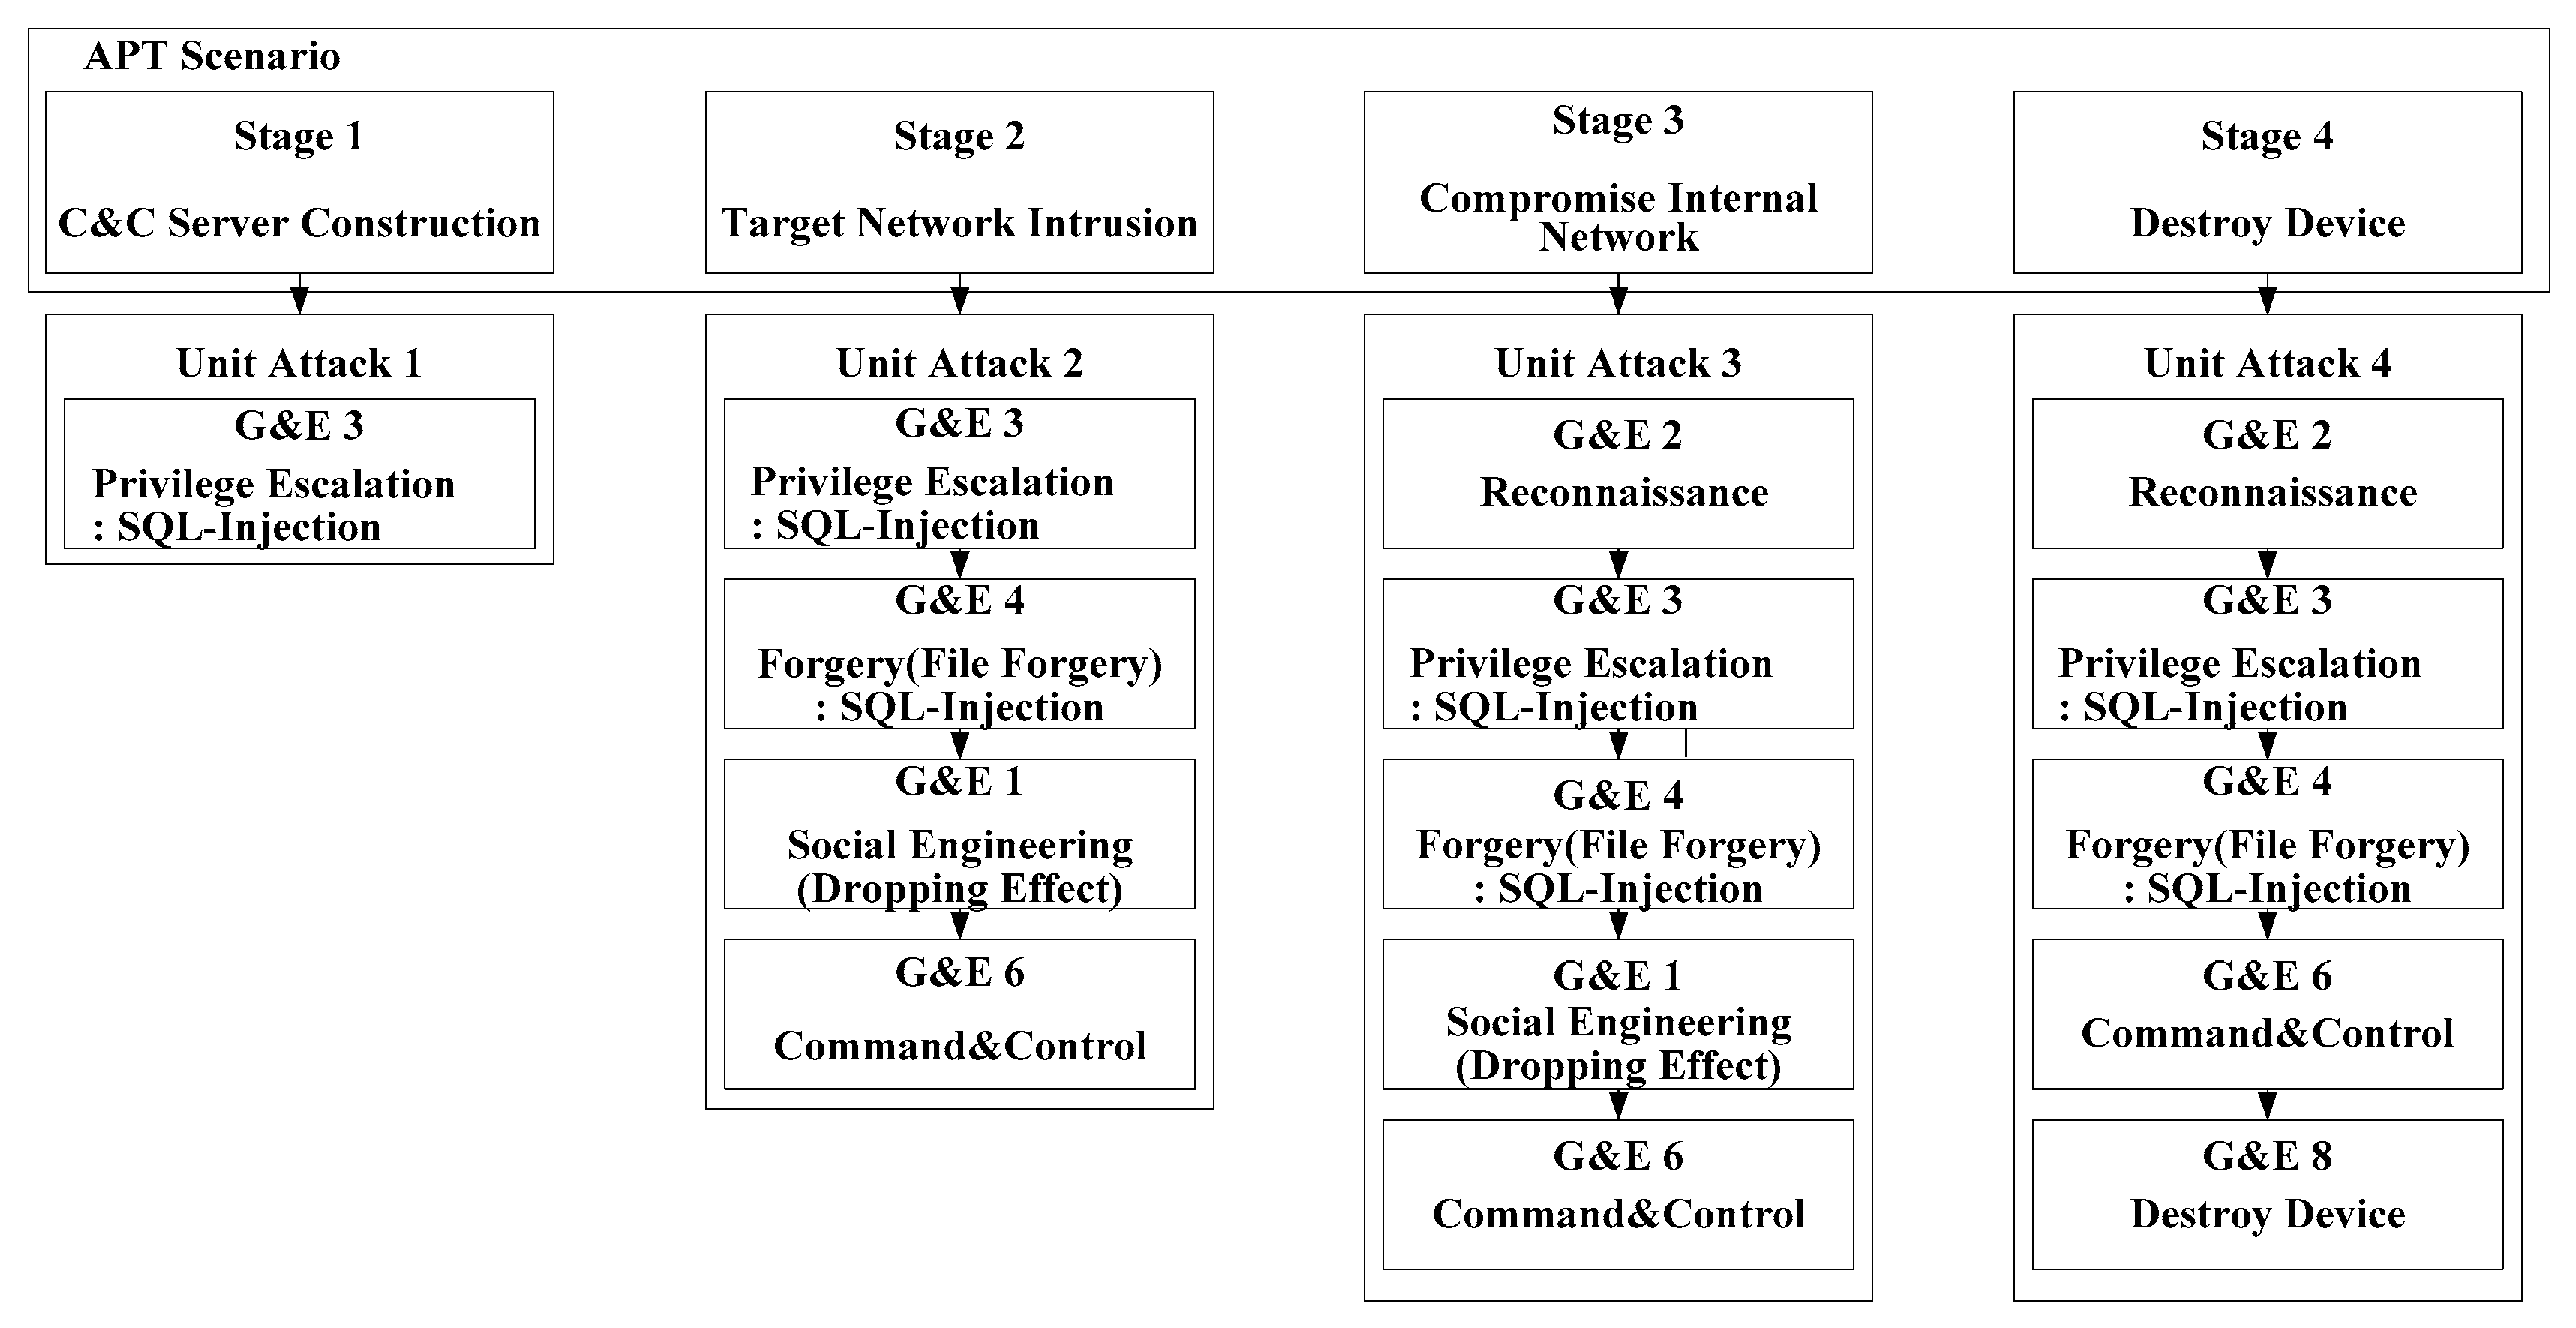
This complicated procedure comprises four stages, as shown in S1–S4 in
Figure 5. The stage of the attacker building a C&C server is defined as Stage 1, and the stage of penetration into the target network is defined as Stage 2. The process of infecting the target network is defined as Stage 3, and the process of finally destroying the target network is defined as Stage 4.
Each stage is embodied through a unit attack utilizing the G&E model. Through the hierarchical multi-stage attack scenario modeling proposed herein, can be constructed systematically, as shown in
Figure 6.
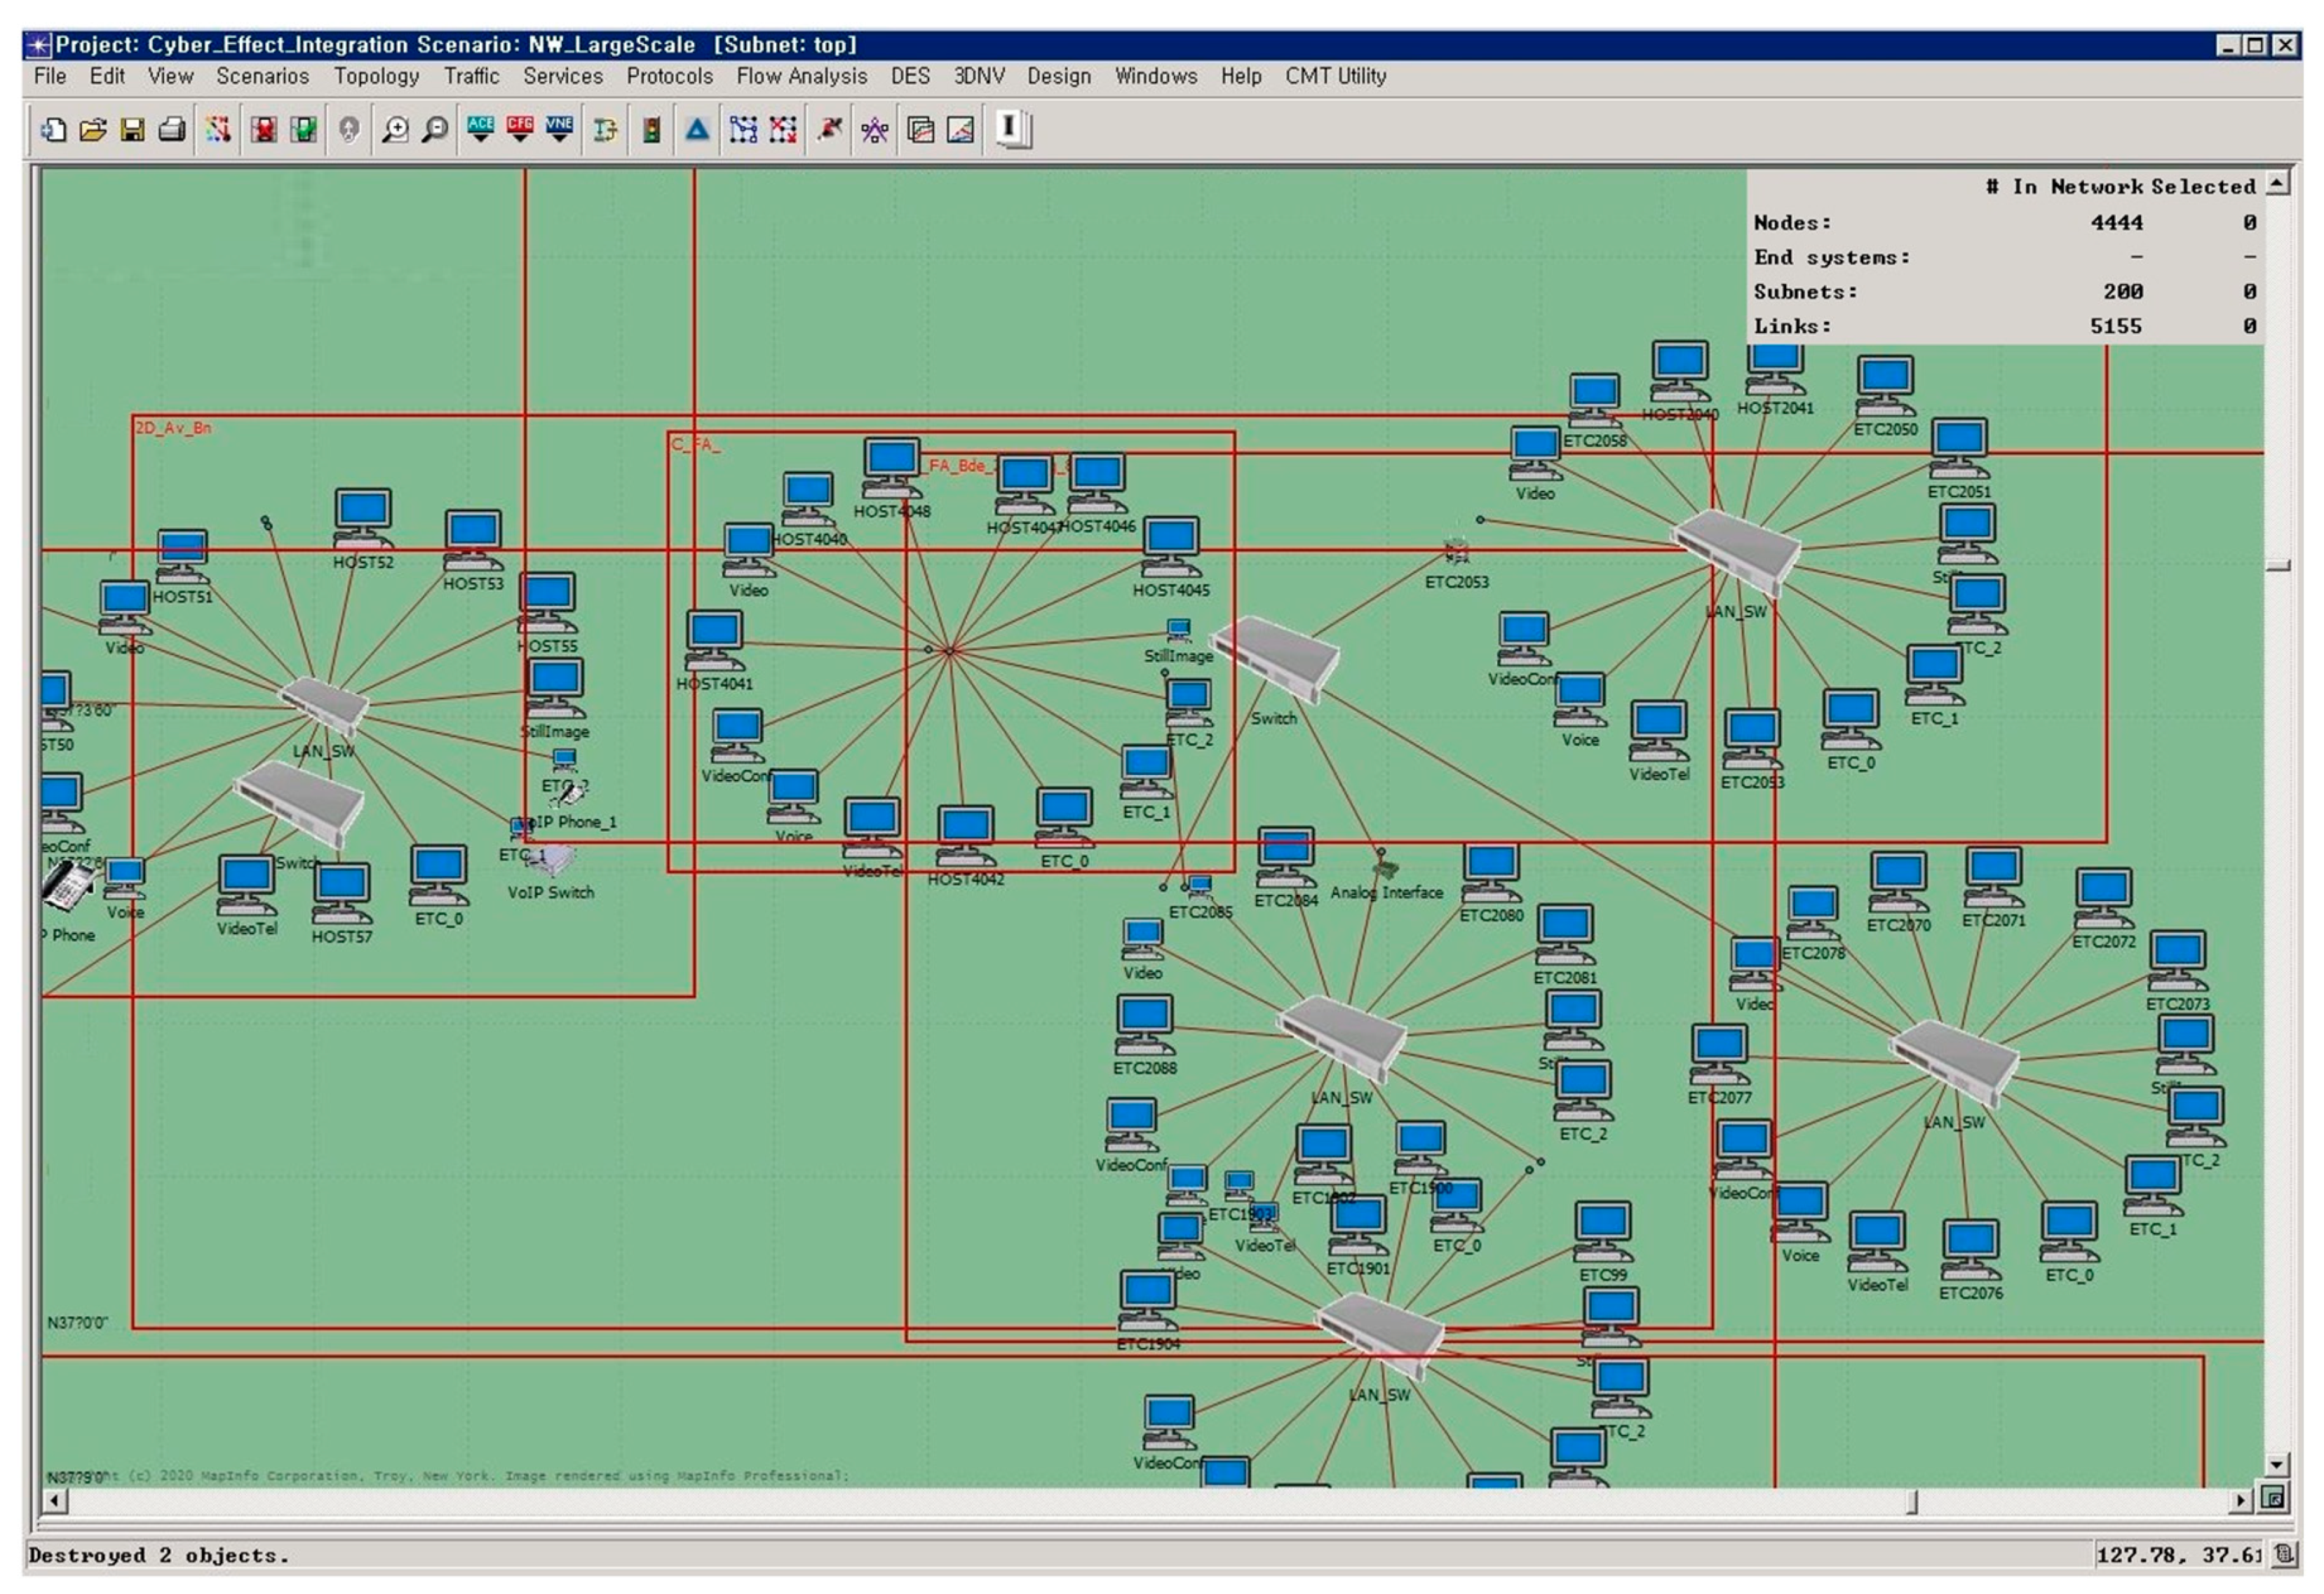
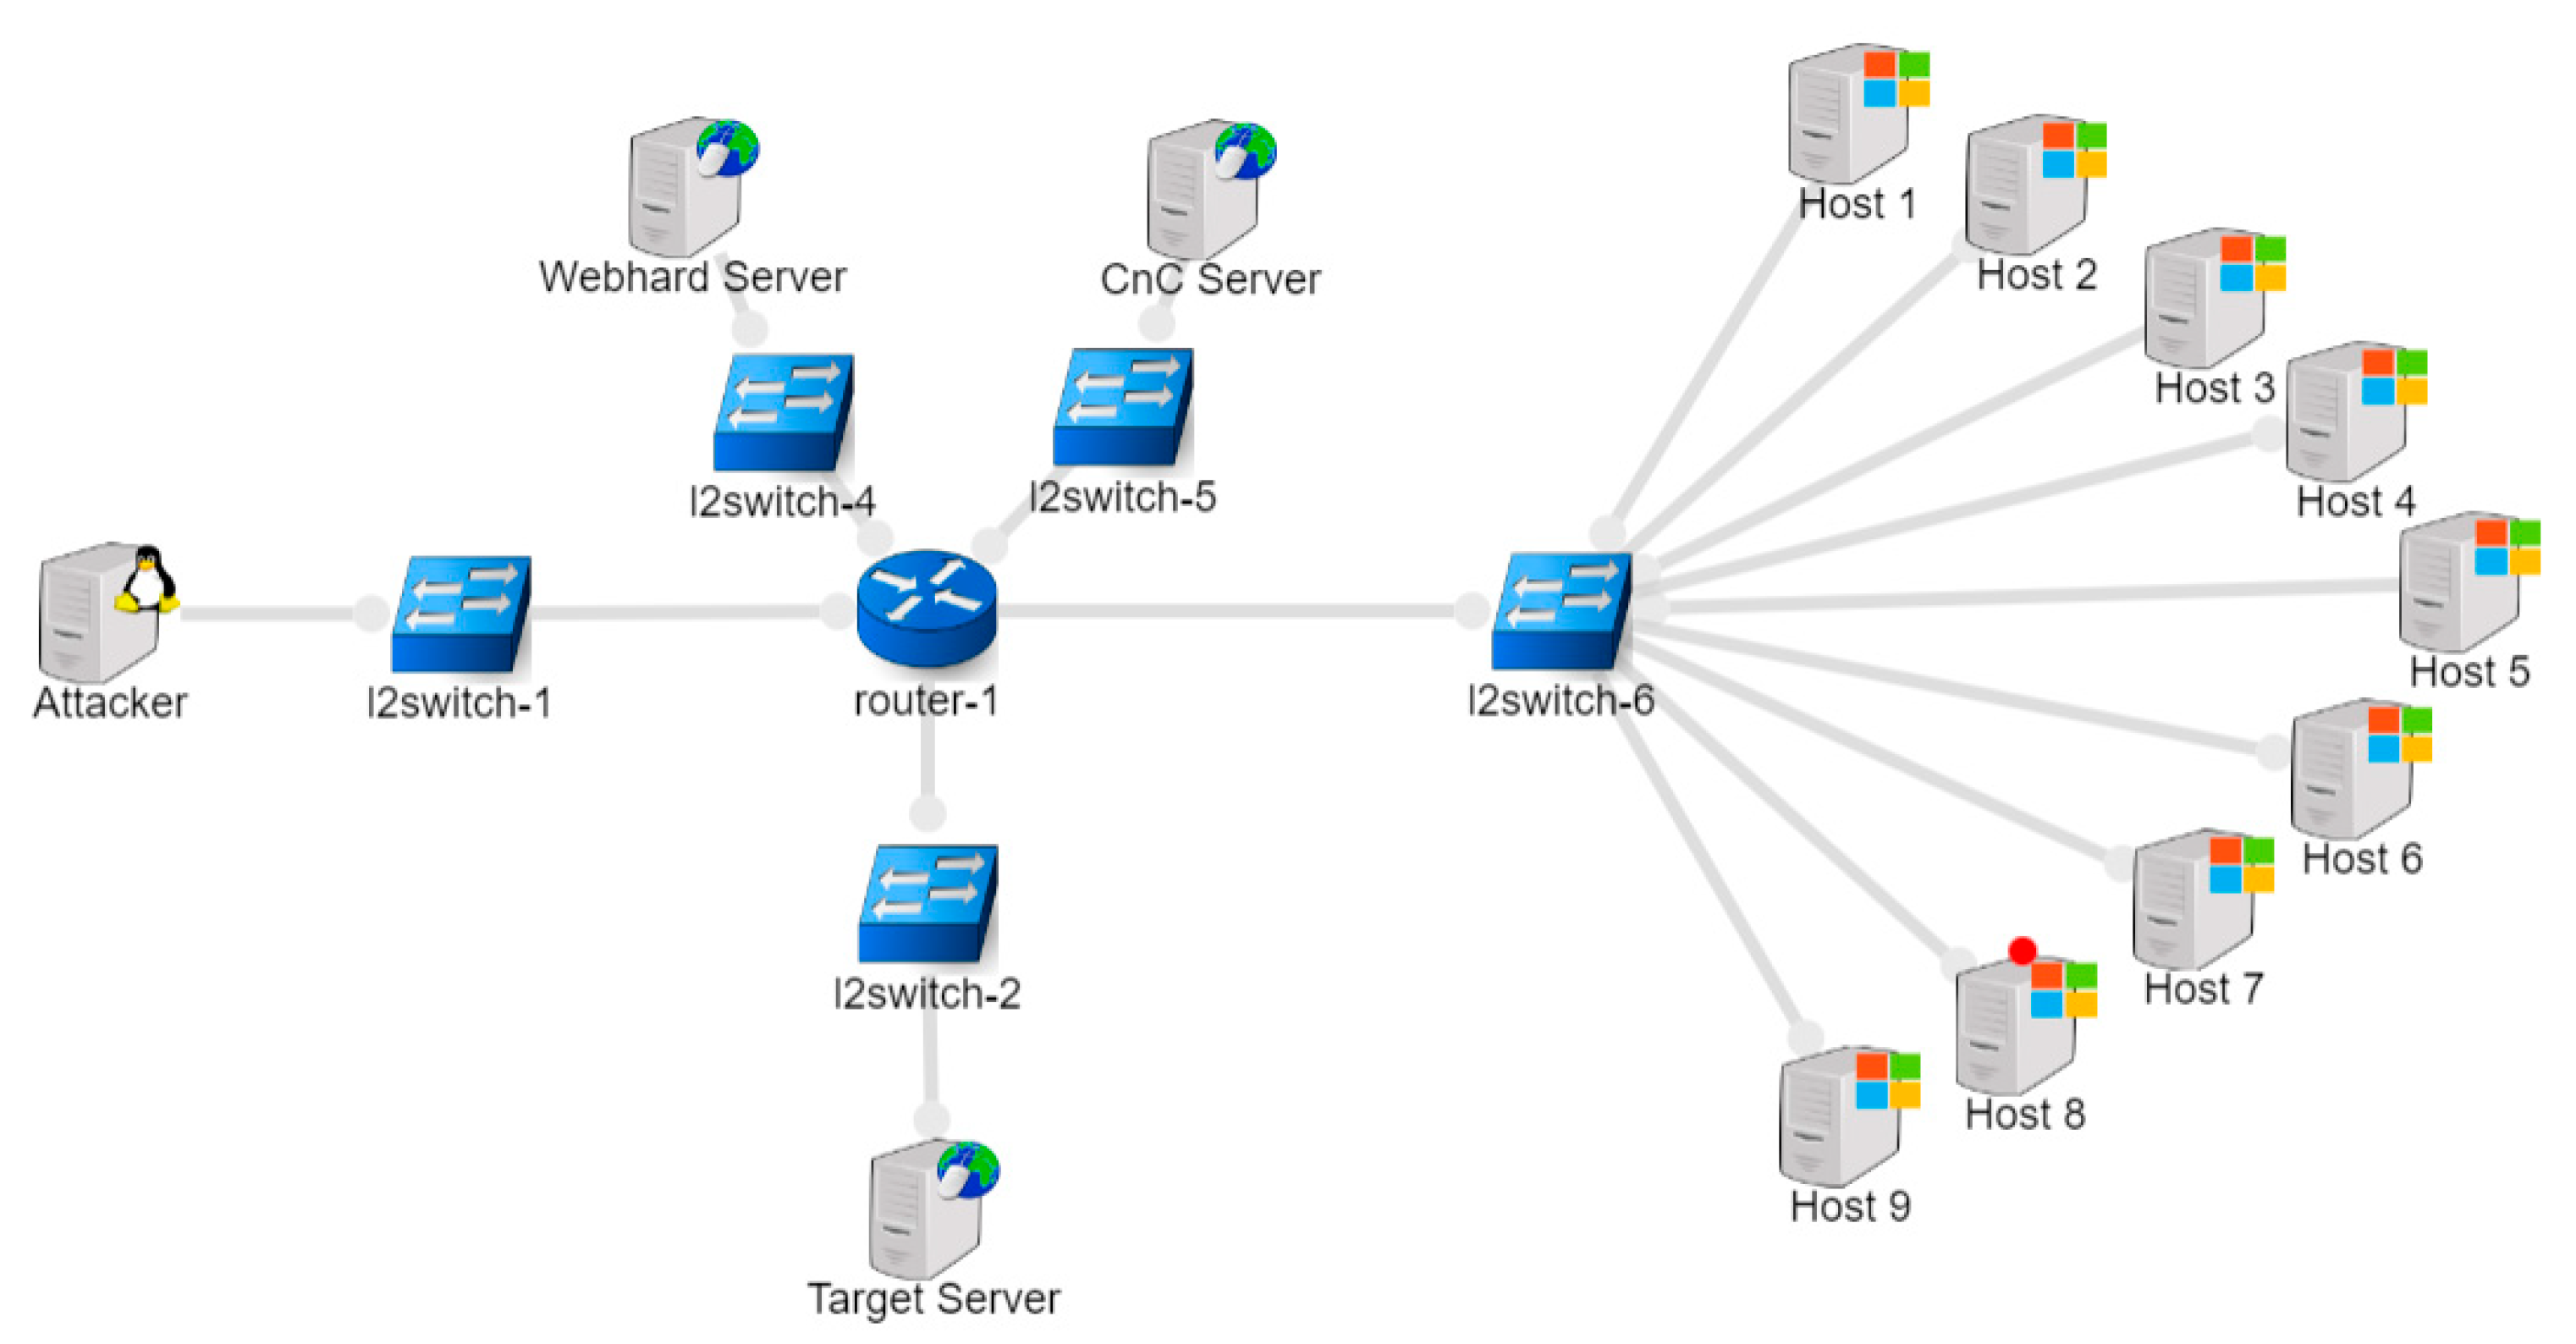
Through the analysis system proposed herein, cyber risk simulation and combat experiment analysis can be performed over time in a large-scale military tactical network environment. The network is constructed as shown in
Figure 7. Additionally, the APT attack of
Figure 6, which is represented by the hierarchical multi-stage cyber attack scenario proposed herein, can be performed to analyze the damage of the internal network in advance.
An information exchange requirement (IER) is the description of the requirement to transfer information between hosts for military operations. To perform missions for military operations, we assume the scenario where there is a critical IER between hosts 14 and 34 and information with the size of 1500 bytes should arrive at the other host within 1 s every 5 s.
In an APT attack scenario, Host 14 is infected with BotNet and eventually the system is destroyed in 2000 s, as shown in
Figure 8a. This causes loss of IER message to be transmitted from Host 14 to Host 34. As shown in
Figure 8b, The IER success ratio is reduced to 0% and the IER traffic is reduced to 0 bits/sec. These results have a fatal effect on military operations.
To proactively prepare for the possible damages from these cyber attacks, various alternatives can be prepared in advance. Alternatively, preparations for threats can be implemented by setting up course of actions such as installing additional security devices in major sections, changing firewall policies, and performing OS updates.
The ability to organize large assets that the military must protect and analyze the effect of cyber attacks is critical.
Figure 9 shows part of a large-scale network, which consists of thousands of assets and hundreds of subnets. To construct such a large-scale network in a real environment, significant cost and resources are required, and it is difficult to construct in reality. The attack graph approach has been widely used in the literature and industry for a long time. However, in large-scale network, as shown in
Figure 9, the calculation is very complicated and there is a problem of scalability, so it is not easy to utilize well. However, the proposed analysis system and cyber attack scenario modeling make it possible. Especially, the proposed approach enables the organization of complex scenarios systematically and facilitates the intuitive understanding cyber attack progress. In addition, the proposed approach can represent various attack goals and damage effects. Thus, it can be used to analyze the impact of cyber attacks on large assets that need to be protected in large-scale networks.
4.2. Performance Evaluation
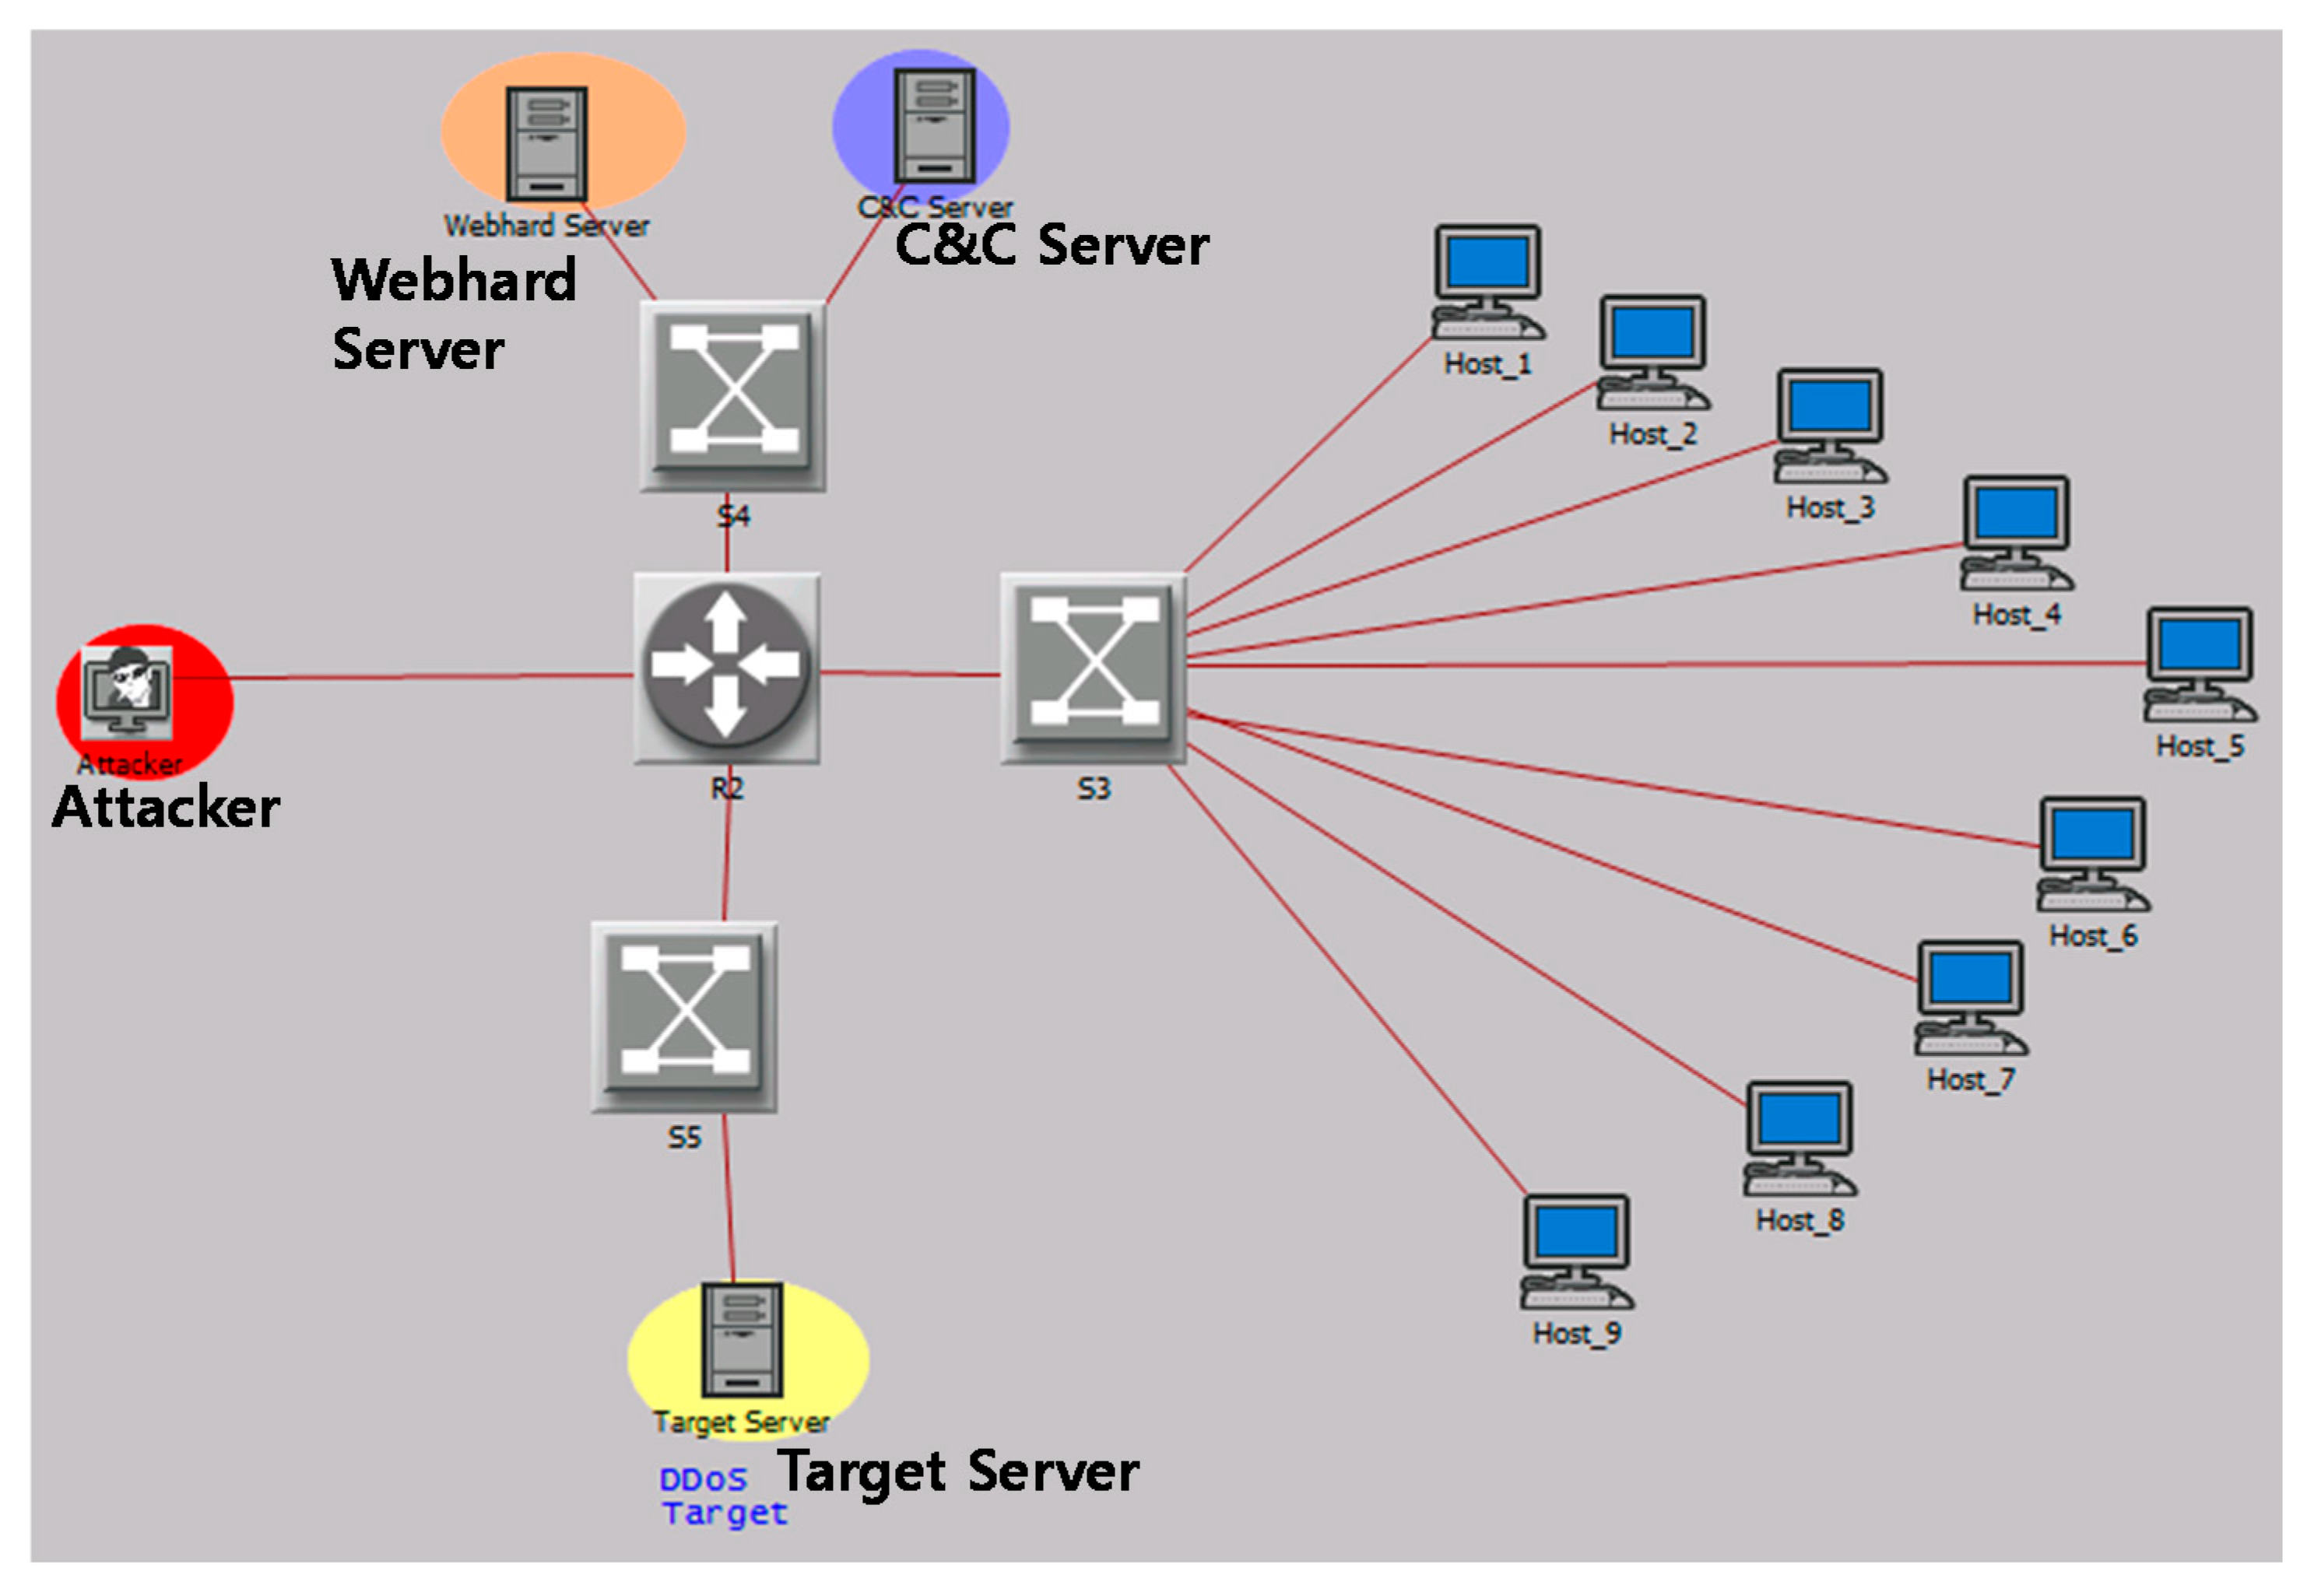
To evaluate the performance of the cyber attack modeling method and analysis system proposed herein, we constructed a small real-world network and performed a SYN (Synchronize) flooding attack. The scenario of a SYN flooding attack is shown in
Figure 10. An attacker builds a C&C server and infects a web server. Additionally, terminals accessing a web server become BotNets. Using BotNets, a SYN flooding distributed denial-of-service (DDoS) attack is performed against the target network.
The network configuration consists of an attacker, C&C server, Webhard server, target server, and hosts infected with BotNet, as shown in
Figure 10. The small real-world network is constructed based on virtual machines, as shown in
Figure 11, and the hierarchical multi-stage scenario based network proposed herein is constructed as shown in
Figure 12.
Because of the attack, the total number of infected hosts is 11. Nine of them are BotNet hosts, the other two are C&C server and Webhard server. In the small real-world network, the total number of BotNet in the C&C server can be verified, as shown in
Figure 13a. In the hierarchical multi-stage scenario network proposed herein, the total number of infected hosts shown in
Figure 13b can be confirmed.
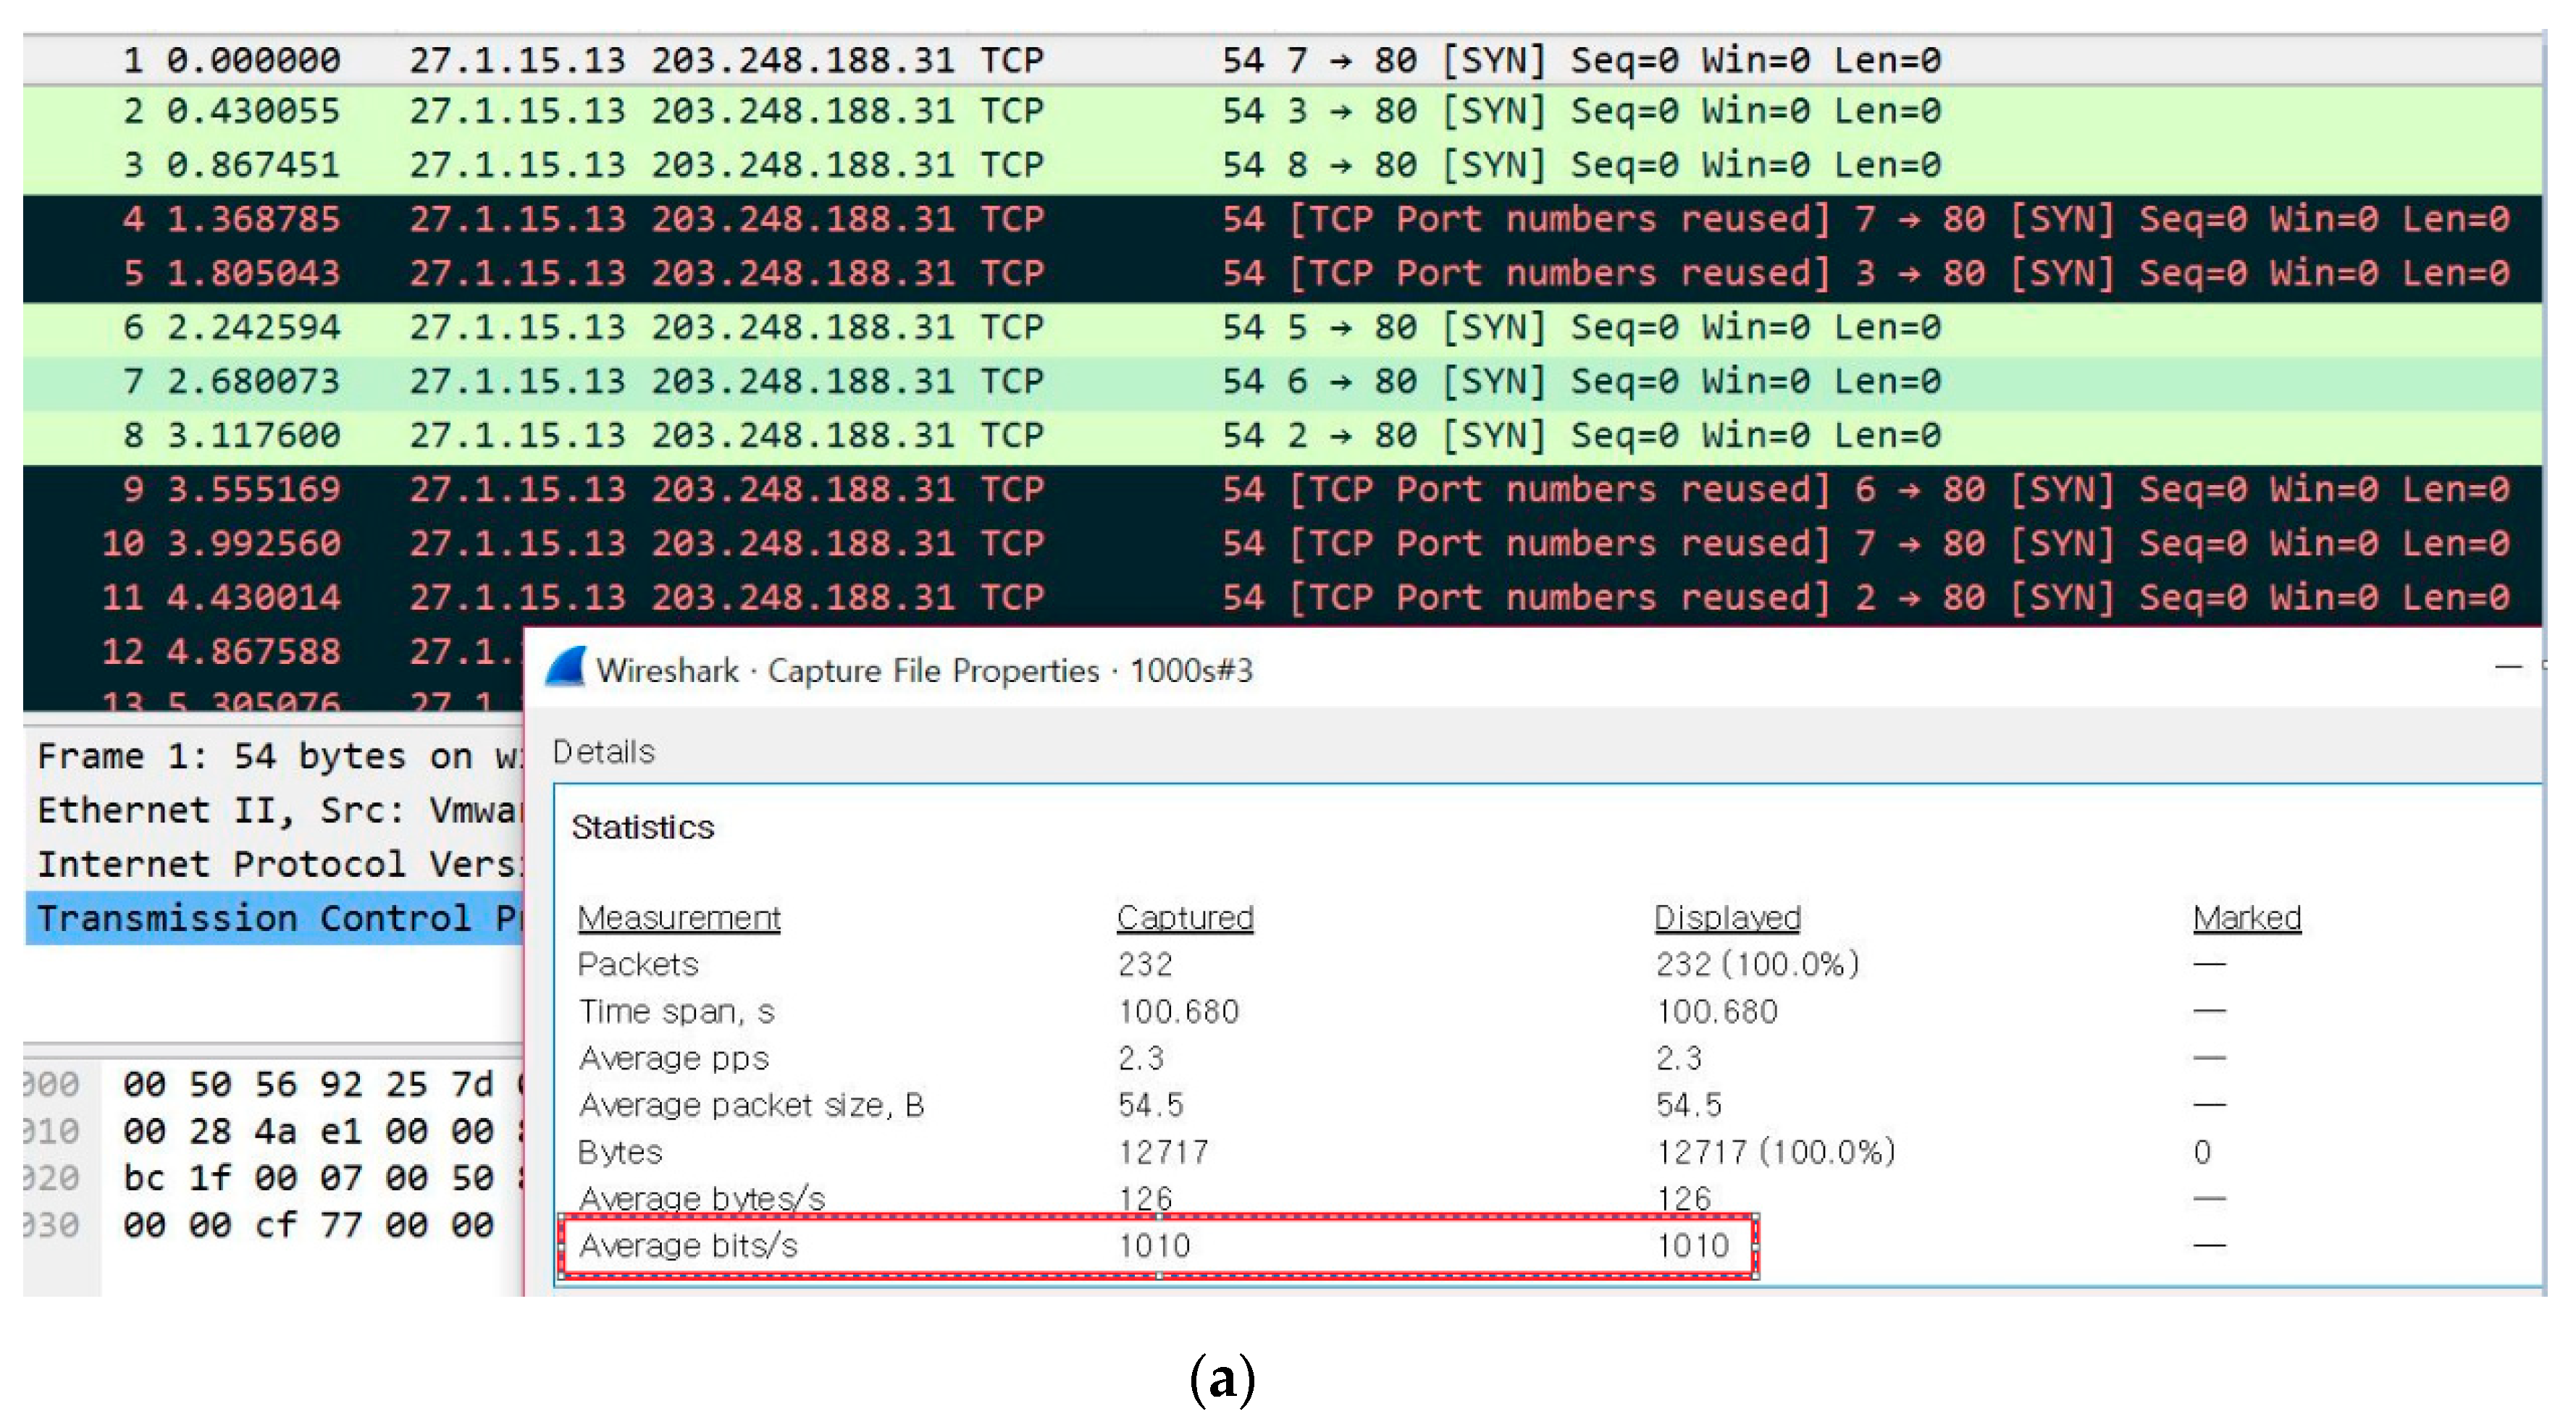
As shown, the DoS traffic transmitted from each BotNet to the target server is approximately 1000 bits/s, as shown in
Figure 14.
Based on the results of the SYN flooding attack, we can confirm that the attack pattern of the proposed system is similar to the real one. In addition, the number of infected hosts, and the amount of transmitted DoS traffic are almost the same as those of the small real-world network, as shown in
Table 4. Through the performance evaluation results, we can quantitatively confirm that the proposed analysis system is almost identical to the real world system.
5. Conclusions
In this paper, we proposed a hierarchical multi-stage attack scenario modeling method based on the G&E model, which is not limited to specific types of attacks, but can represent various goals of attacks and their damage effects. The proposed method enables the organization of complex scenarios systematically and facilitates the intuitive understanding cyber attack progress. Furthermore, it provides scalability to large-scale network environments and can be used to analyze the effect of cyber attacks on large assets that must be protected by the military. Additionally, we proposed a combat experiment analysis system that enabled cyber risk simulation over time in a large-scale network environment. Combat experiments for various cyber attacks could be conducted to analyze potential threats and damages in advance and secure the course of action. We evaluated the performance of the proposed modeling method and analysis system via simulation runs. Results showed that the proposed method can be used to proactively analyze vulnerabilities. Preparation for countermeasures is possible in advance when a cyber attack occurs against a military tactical network. In addition, to evaluate the applicability of the proposed modeling method and analysis system to real world, we implemented a small real-world network. A real SYN flooding attack occurred, and the performance of the proposed method was analyzed. Results showed that the attack deployment pattern, number of infected hosts, and amount of transmitted DoS traffic of the proposed analysis system were almost the same as those of the small real-world network. Proposed modeling method and analysis system are expected to be used for strengthening the military’s ability to prepare for cyber attacks. In the future, we will continue our research by expanding the battle experimental analysis area to analyze its effect on military operations or combat missions.
Author Contributions
Writing—original draft, M.K.A.; Writing—review & editing, Y.H.K. and J.-R.L. All authors have read and agreed to the published version of the manuscript.
Funding
This work was supported by the Chung-Ang University research grant and Agency for Defense Development.
Conflicts of Interest
The authors declare no conflict of interest.
Acronyms
The following acronyms are used in this manuscript:
G&E (Goal & Effect): the attacker’s goal to the victim and the target’s damage effect from the attack.
APT (Advanced Persistent Threat): a covert cyber attack on a computer network where the attacker gains and maintains unauthorized access to the targeted network and remains undetected for a significant period [
21].
TTP (Tactics, Techniques, and Procedures): the behavior of an attacker. Tactics are high-level descriptions of behavior, techniques are detailed descriptions of behavior in the context of a tactic, and procedures are even lower-level, highly detailed descriptions in the context of a technique [
22].
CAPEC (Common Attack Pattern Enumeration and Classification): a comprehensive dictionary of known patterns of attack employed by adversaries to exploit known weaknesses in cyber-enabled capabilities.
CVE (Common vulnerabilities and exposures): a list of entries—each containing an identification number, a description, and at least one public reference—for publicly known cybersecurity vulnerabilities.
CPE (Common platform enumeration): a standardized method of describing and identifying classes of applications, operating systems, and hardware devices present among an enterprise’s computing assets.
CVSS (Common Vulnerability Scoring System): a way to capture the principal characteristics of a vulnerability and produce a numerical score reflecting its severity.
C&C (Command & Control) Server: a computer controlled by an attacker or cybercriminal which is used to send commands to systems compromised by malware and receive stolen data from a target network [
23].
IER (Information Exchange Requirement): An exchange of information that is essential to command and control, enabling the situational needs of the joint task force and component commanders’ to support force employment and decision making [
24].
DDoS (Distributed Denial-of-Service): A Denial of Service technique that uses numerous hosts to perform the attack [
22].
References
- Internet Security Threat Report; Symantec: Mountain View, CA, USA, 2018.
- Asec Report; AhnLab: Gyeonggi-do, Korea, 2018.
- Al-Mohannadi, H.; Mirza, Q.; Namanya, A.; Awan, I.; Cullen, A.; Disso, J. Cyber-attack modeling analysis techniques: An overview. In Proceedings of the IEEE 4th International Conference on Future Internet of Things and Cloud Workshops (FiCloudW), Vienna, Austria, 22–24 August 2016; pp. 69–76. [Google Scholar]
- Lippmann, R.; Ingols, K.; Scott, C.; Piwowarski, K.; Kratkiewicz, K.; Artz, M.; Cunningham, R. Validating and restoring defense in depth using attack graphs. In Proceedings of the Milcom, Washington, DC, USA, 23–25 October 2006. [Google Scholar]
- Ma, J.; Wang, Y.; Sun, J.; Chen, S. A minimum cost of network hardening model based on attack graphs. Procedia Eng. 2011, 15, 3227–3233. [Google Scholar]
- Kotenko, I.; Chechulin, A. A cyber attack modeling and impact assessment framework. In Proceedings of the 5th International Conference on Cyber Conflict 2013 (CyCon 2013), IEEE and NATO COE Publications, Tallinn, Estonia, 4–7 June 2013; pp. 119–142. [Google Scholar]
- Jajodia, S.; Noel, S.; Kalapa, P.; Albanese, M.; Williams, J. Cauldron: Mission-centric cyber situational awareness with defense in depth. In Proceedings of the 30th Military Communications Conference (MILCOM), Baltimore, MD, USA, 7–10 November 2011. [Google Scholar]
- Hong, J.; Kim, D.S. HARMs: Hierarchical attack representation models for network security analysis. In Proceedings of the 10th Australian Information Security Management Conference on SECAU Security Congress (SECAU 2012), Perth, WA, USA, 3–5 December 2012. [Google Scholar]
- Attack Modeling for Information Security and Survivability; CarnegieMellon Software Engineering Institute: Pittsburgh, PA, USA, 2001.
- Huang, M.Y.; Wicks, T.M. A Large-scale Distributed Intrusion Detection Framework Based on Attack Strategy Analysis. Comput. Netw. 1999, 31, 2465–2475. [Google Scholar] [CrossRef]
- United States. Joint Chiefs of Staff, Joint Tactics, Techniques, and Procedures for Joint Intelligence Preparation of the Battlespace; Joint Chiefs of Staff: Washington, WA, USA, 2000. [Google Scholar]
- Hutchins, E.M.; Cloppert, M.J.; Amin, R.M. Intelligence-driven computer network defense informed by analysis of adversary campaigns and intrusion kill chains. Lead. Issues Inf. Warf. Secur. Res. 2011, 1, 80. [Google Scholar]
- Caltagirone, S.; Pendergast, A.; Betz, C. The diamond model of intrusion analysis. DTIC Doc. Tech. Rep. 2013. [Google Scholar]
- Hassell, S.; Beraud, P.; Cruz, A.; Ganga, G.; Martin, S.; Toennies, J.; Vazquez, P.; Wright, G.; Gomez, D.; Pietryka, F.; et al. Evaluating network cyber resiliency methods using cyber threat, vulnerability and defense modeling and simulation. In Proceedings of the MILCOM 2012–2012 IEEE Military Communications Conference, Orlando, FL, USA, 29 October–1 November 2012; pp. 1–6. [Google Scholar]
- ATT&CK, Adversarial Tactics, Techniques, and Common knowledge. Available online: https://attack.mitre.org (accessed on 12 February 2020).
- PRE ATT&CK, PRE Adversarial Tactics, Techniques, and Common knowledge. Available online: https://attack.mitre.org/matrices/pre/ (accessed on 12 February 2020).
- CAPEC, Common Attack Pattern Enumeration and Classification. Available online: http://capec.mitre.org/ (accessed on 12 February 2020).
- CVE, Common Vulnerabilities and Exposures (CVE). Available online: http://cve.mitre.org/ (accessed on 12 February 2020).
- CPE, Common Platform Enumeration (CPE). Available online: http://cpe.mitre.org/ (accessed on 12 February 2020).
- CVSS, Common Vulnerability Scoring System (CVSS). Available online: http://www.first.org/cvss/ (accessed on 12 February 2020).
- APT. Available online: https://www.cisco.com/c/en/us/products/security/advanced-persistent-threat.html (accessed on 12 February 2020).
- Nist Csrc Glossary. Available online: https://csrc.nist.gov/glossary (accessed on 12 February 2020).
- Trend Micro. Available online: https://www.trendmicro.com/vinfo/us/security/definition/command-and-control-server (accessed on 12 February 2020).
- Dod Dictionary of Military and Associated Terms; Joint Chiefs of Staff US: Washington, WA, USA, 2020.
© 2020 by the authors. Licensee MDPI, Basel, Switzerland. This article is an open access article distributed under the terms and conditions of the Creative Commons Attribution (CC BY) license (http://creativecommons.org/licenses/by/4.0/).


