Article

Failure Type Prediction Using Physical Indices and Data Features for Solenoid Valve †

1
School of Computer Science and Engineering, Central South University, Changsha 410075, China
2
School of Automation, Central South University, Changsha 410075, China
*
Author to whom correspondence should be addressed.
This paper is an extended version of our paper published in 2019 10st International Conference on Prognostics and Health Management, Hyatt Regency San Francisco Airport, Burlingame, CA, USA, 17–19 June 2019.
Appl. Sci. 2020, 10(4), 1323; https://doi.org/10.3390/app10041323
Submission received: 2 January 2020 / Revised: 1 February 2020 / Accepted: 11 February 2020 / Published: 15 February 2020
(This article belongs to the Section Computing and Artificial Intelligence)

Abstract

:
A high-speed solenoid valve is a key component of the braking system. Accurately predicting the failure type of the solenoid valve is an important guarantee for safe operation of the braking system. However, electrical, magnetic, and mechanical coupling aging mechanism; individual differences; and uncertainty of aging processes have remained major challenges. To address this problem, a method combining physical indices and data features is proposed to predict the failure type of solenoid valve. Firstly, the mechanism model of the solenoid valve is established and five physical indices are extracted from the driven current curve. Then, the frequency band energy characteristics are obtained from the current change rate curve of the solenoid valve by wavelet packet decomposition. Combining physical indices and frequency band energy characteristics into a comprehensive feature vector, we applied random forest to both predict and classify the failure type. We generate a data set consisting of 60 high-speed solenoid valves periodically switched under accelerated aging test conditions, including driven current, final failure type, and switching cycles. The prediction result shows that the proposed method achieves 95.95% and 94.68% precision for the two failures using the driven current data of the 3000th cycle and has better prediction performance than other algorithms.

1. Introduction

The braking system is a part of high-speed train safety systems [1]. The high-speed solenoid valve is a critical component in the braking system [2]. Accurately predicting the failure type of the solenoid valve is an important guarantee for safe operation of the braking system.
In general, methods of prognostic and diagnostics can be categorized into physics-based, data-driven, and hybrid approaches [3,4]. The physics-based method uses a specific physical model to represent the normal machine state and detects the potential failure types based on the deviations between the actual system and the physical model [5,6,7,8,9,10,11]. Hashemnia et al. [5,6] used frequency response analysis diagnostics to improve the fault detection of power transformer winding. Leturiondo et al. [7] presented an electromechanical model of a rotating machine for its diagnosis. Lu et al. [8] proposed a physics-based prognostic model for the rolling element bearings using the realized volatility and wavelet neural network to predict their remaining life. Eker et al. [9] integrated a physics-based clogging progression model with particle filter to predict the future clogging levels and the remaining useful life of the fuel filters. However, due to the electrical, magnetic, and mechanical coupling aging mechanism; individual differences; and uncertainty of aging process [12], it is difficult to establish an accurate and reliable physical model for the solenoid valve.
Data-driven approaches use information from previously collected data to identify the relationship between the failure and the measurement of system state and do not depend on the physical mechanism or prior knowledge of the system [13,14,15,16,17,18]. Cosme et al. [13] proposed an improved fault prognostic approach based on a modified particle filter with a built-in differential evolution characteristic. Wang et al. [14] developed a two-stage data-driven prognostic approach based on an enhanced Kalman filter and an expectation-maximization algorithm to estimate the remaining useful life of the bearing. Mashhadi et al. [15] aggregated predictions of long short-term memory and convolutional long short-term memory via a meta model to boost the performance of diagnostic models for automotive. Wu et al. [16] presented a unified fault diagnosis and prognosis strategy to identify faults and to predict the remaining useful life for solid oxide fuel cell systems. The disadvantage of data-driven approaches is that they rely heavily on the failure histories of the system components collected from the field or laboratory.
Hybrid approaches combine the physical model and date-driven method to improve the prediction performance [19,20,21]. However, existing researches of hybrid approaches focus on the fault diagnosis and the remaining useful life prediction of devices, few of which pay attention to the prediction of the type of failure. In our previous research, we proposed an adaptive data-driven approach which combines Bayesian updating and particle filter to predict the remaining useful life for solenoid valve [22]. Based on the prediction result, the solenoid valve could be timely replaced before it fails. Furthermore, in the paper, the failure type can be determined and the proper maintenance decision can be obtained. For instance, the high-speed solenoid valve with aged coil can only be replaced to ensure the reliability of the braking system, while it is more reasonable to repair the solenoid valve by lubricating with oil rather than replacing it directly. However, in actual operation, the aging of the high-speed solenoid valve is usually the result of a combination of both factors. Thus, we develop a novel method combining the physical modeling and history failure data to accurately predict the failure type of the solenoid valve in this paper.
In this paper, a failure type prediction method for high-speed solenoid valve is proposed to address the aforementioned problems and uses physical indices and data features. Firstly, we establish a physical model for the high-speed solenoid valve and extract the physical indices from its dynamic driven current. Then, the wavelet packet decomposition is used to extract the energy features of the frequency bands from the current change rate curve of the high-speed solenoid valve. Afterwards, the physical indices and energy features are combined into a comprehensive feature vector. Finally, considering the performance superiority of random forest in terms of fault prediction and diagnosis of various systems [23,24,25,26,27], it is utilized for failure type prediction of the high-speed solenoid valve using the obtained comprehensive feature vector. In this way, the performance of the data-driven prediction method can be improved even when the physical model cannot be accurately constructed.
The main contributions of this paper are as follows:
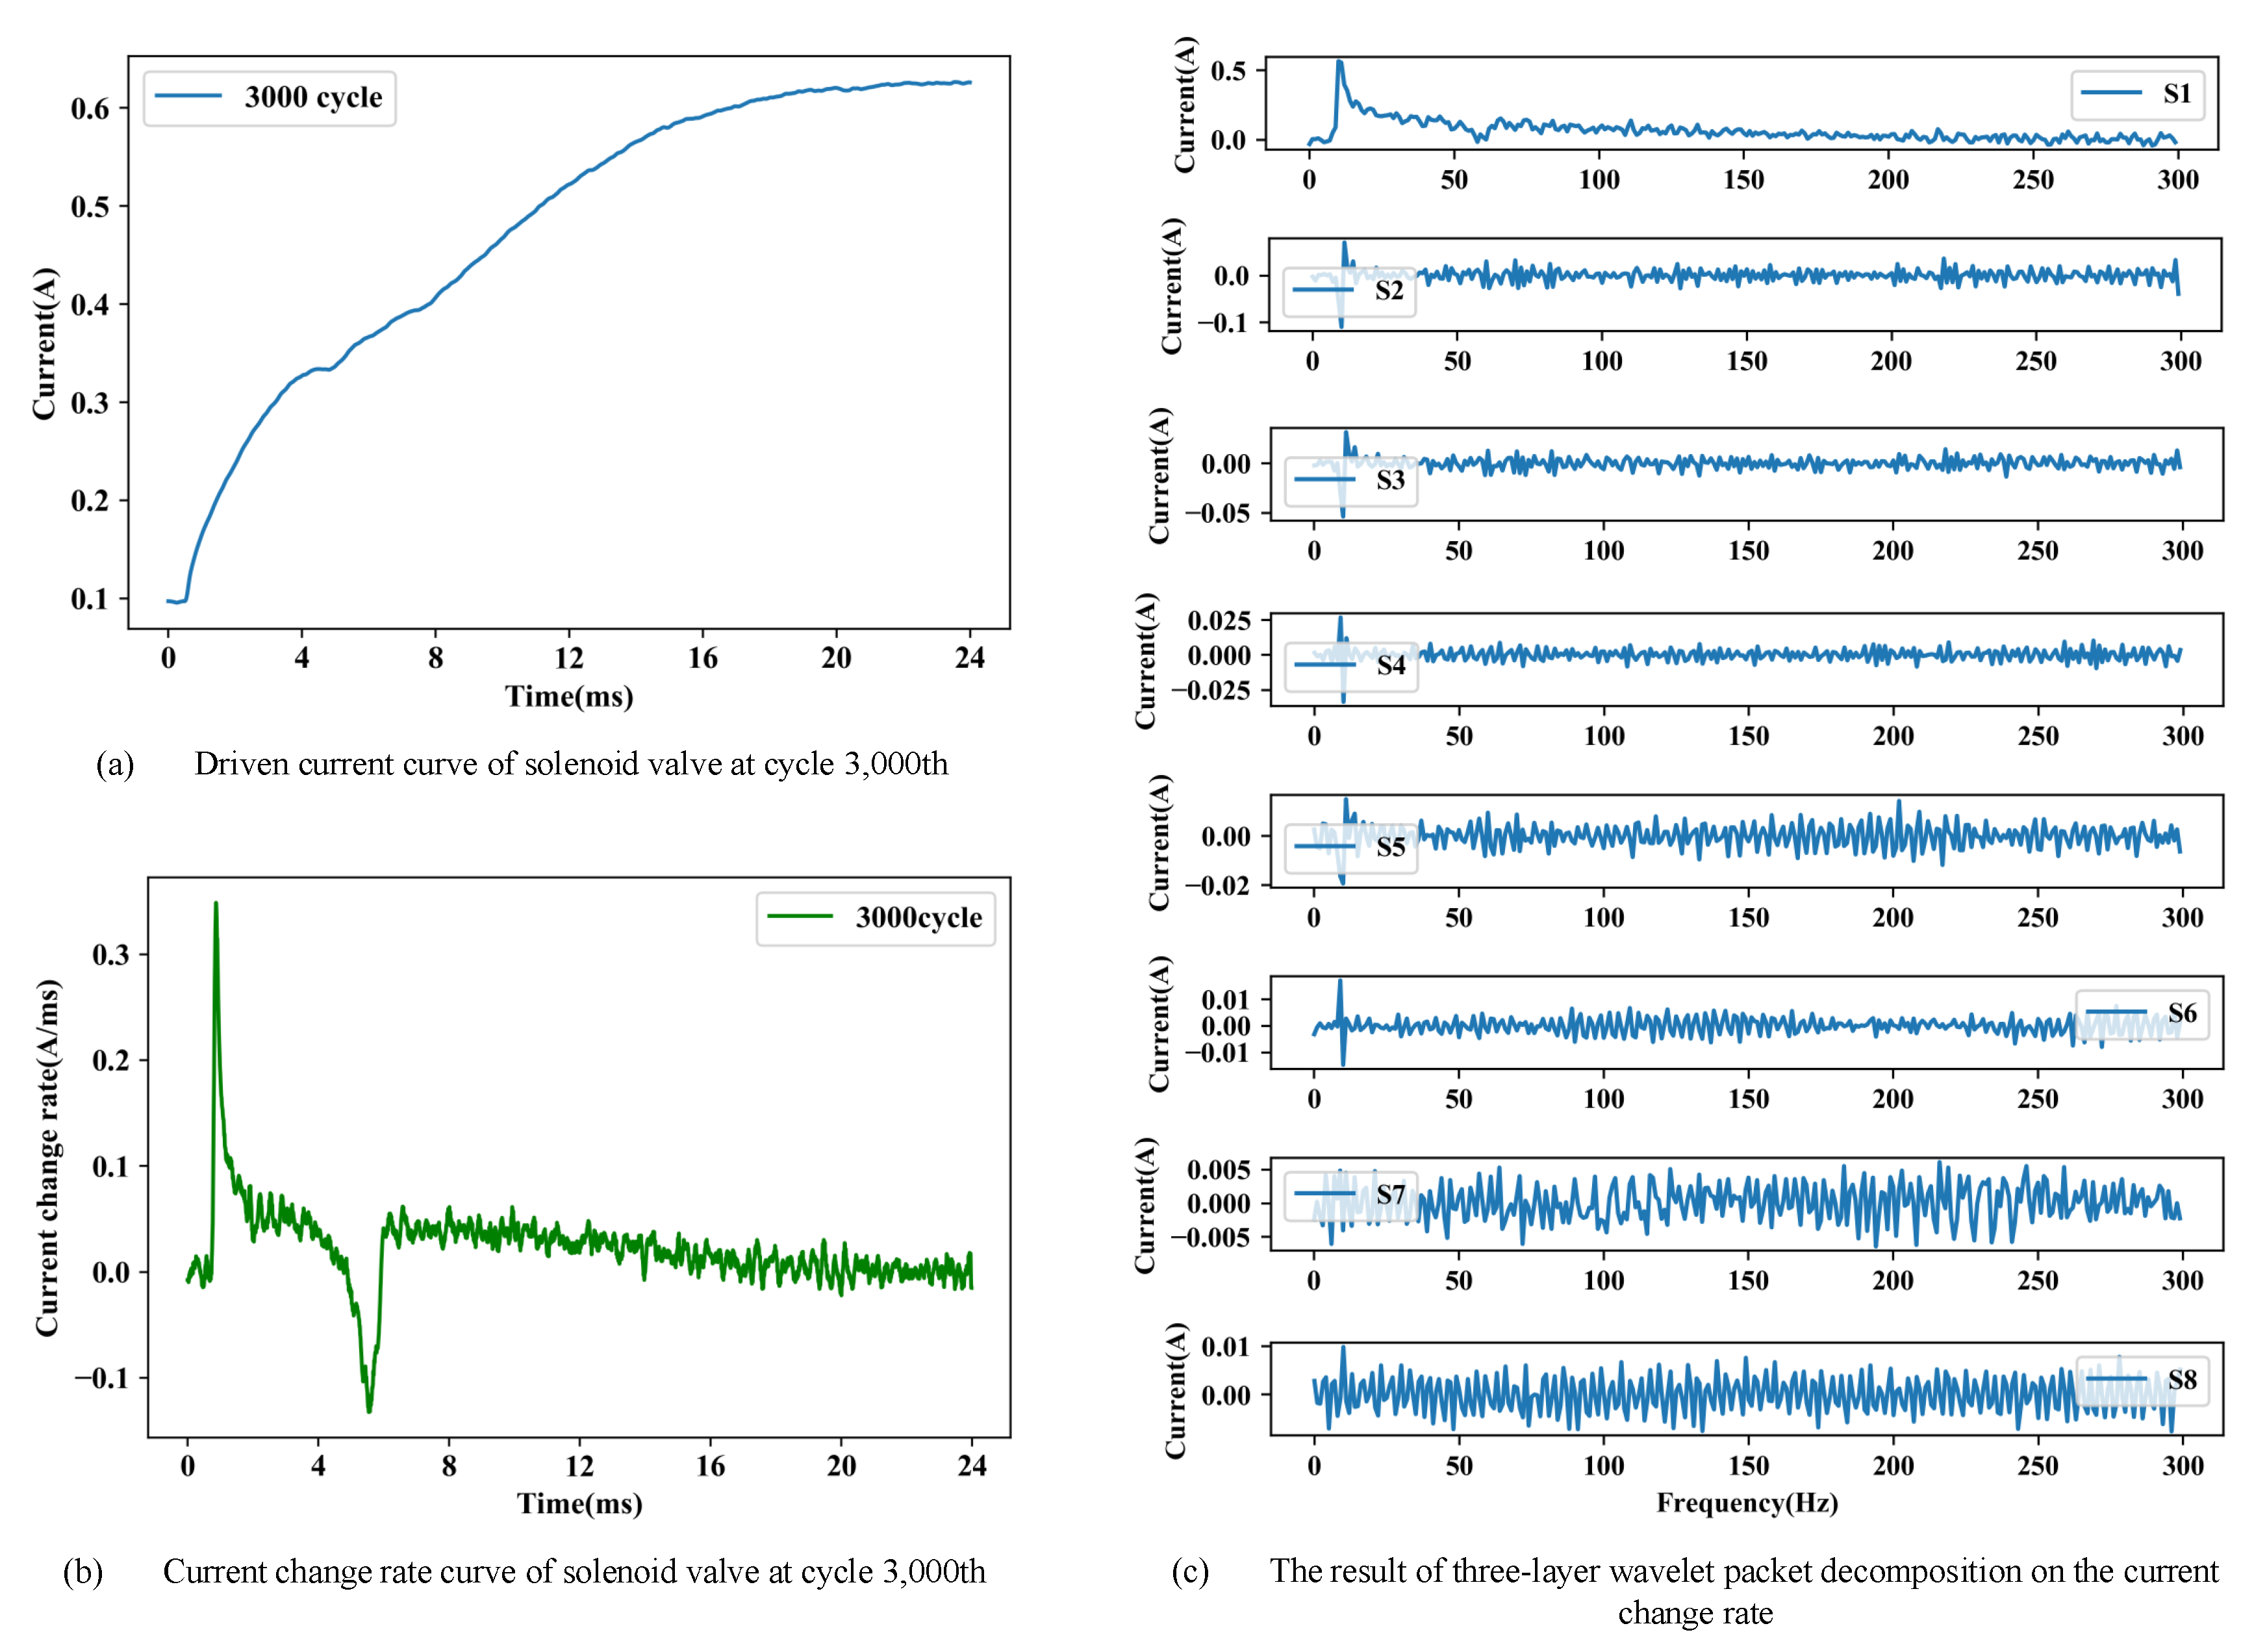
  • The physical model of the high-speed solenoid valve is established to extract the physical indices from its dynamic driven current curve, and the energy features of the frequency bands are obtained by wavelet packet decomposition from the current change rate curve of the high-speed solenoid valve. Then, the comprehensive feature vector composed of the above physical indices and data features is proposed to characterize the working performance of the high-speed solenoid valve in braking systems.
  • Random forest classifier is used to predict the failure type of the high-speed solenoid valve based on the proposed comprehensive feature vector at different life cycles, and the relationship between the prediction accuracy and the life cycle is explored.
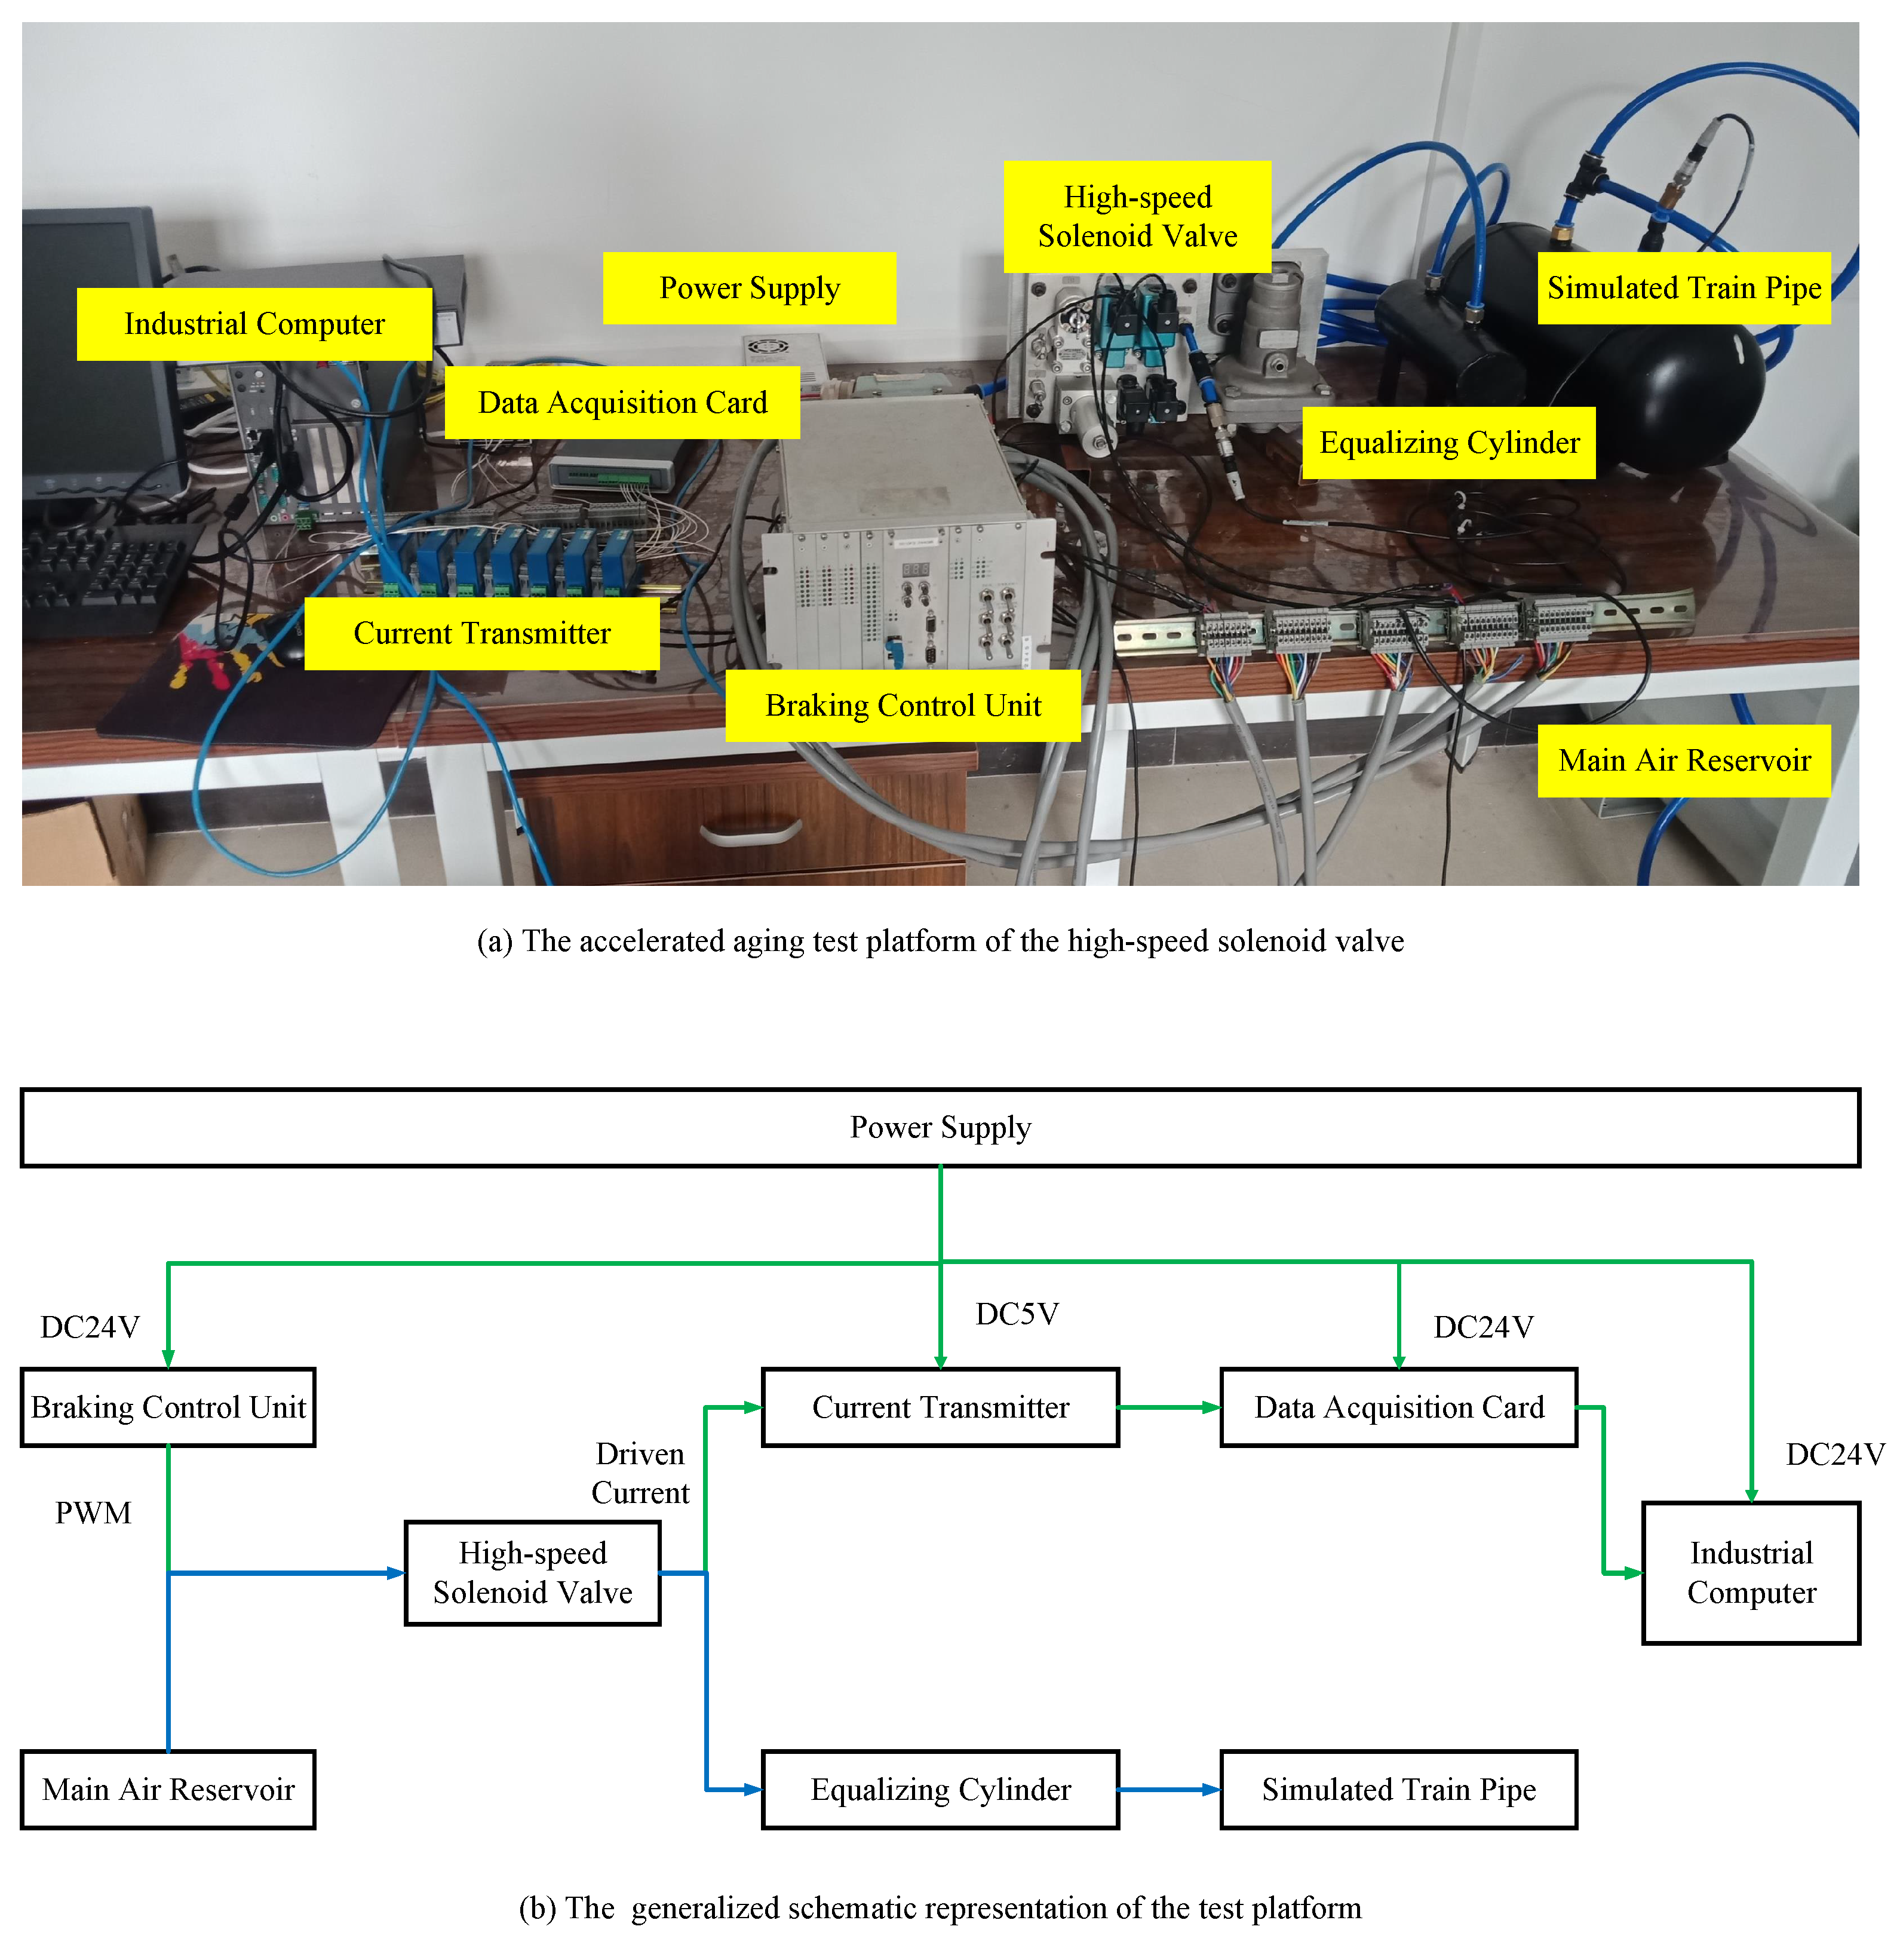
  • Experiments on an accelerated aging test dataset composed of 60 high-speed solenoid valves and comparisons with the other related algorithms validate the effectiveness and superiority of the proposed method.
The remainder of the paper is organized as follows: In Section 2, the structure of the high-speed solenoid valve and its failure mechanism are analyzed, based on which its physical model is established. Section 3 presents the proposed failure type prediction method for the solenoid valve, and the experiment platform as well as the dataset is introduced. In Section 4, the effectiveness of the proposed method is validated through experimental results. Finally Section 5 draws the conclusion.

2. Failure Mechanism of High-Speed Solenoid Valve and Modeling

2.1. Structure Analysis

The high-speed solenoid valve can be divided into electromagnetic and mechanical components. The electromagnetic part is mainly composed of electromagnetic armature, coil, and movable pole block. The mechanical components usually include the valve body, valve stem, lifting spool, spring, and O-sealing ring. The structure of high-speed solenoid valve is shown as Figure 1.
When the high-speed solenoid valve is not energized, the air inlet and outlet are disconnected by the valve element. After it is powered, the electromagnetic armature moves downward due to the magnetic force, driving the push rod to press down the valve core, and the air path is connected.

2.2. Failure Mechanism

There are many factors that cause failure of the solenoid valve, such as failure of sealing parts and aging of the coil and the sealing parts [28]. In fact, the high-speed solenoid valve in the braking system of high-speed train mainly has two kinds of failure: aging of coil and drying up of lubricant. Their influences on solenoid valves are shown in Table 1.
Aging of the coil will reduce the coil resistance of the solenoid valve and increase the stable current. Dried lubricant will increase the resistance to the spool and slow down the movement speed.

2.3. Modeling

The working process of the solenoid valve can be divided into five stages: suction touching stage, suction motion stage, power-on holding stage, release touching stage, and release motion stage [29]. Reference [30] analyzed the touching and moving stages of the solenoid valve and simplified the suction process into three mathematical equations: circuit equation, magnetic circuit equation, and mechanical equation.
If we do not consider the influence of temperature on resistance, the circuit equation [31] is
U = I R + R L + L + L 1 d I d t + I d L + L 1 d t
where U is the excitation voltage of the coil, I is the coil current, R is the coil resistance, R L is the additional resistance of coil circuit, L is the coil inductance, and L 1 is the additional inductance of coil circuit.
The magnetic circuit equation [31] is
L x = μ 0 π D 2 N 2 l v 4 l v l 0 - x + r D
where L is the coil inductance, μ 0 is the permeability of vacuum, D is the diameter of spool, N is turns of coil, l v is the length of armature part of valve core, l 0 is the maximum width of working air gap, r is the length of working air gap, and x is the displacement of valve element. By deriving L(x), we can get the following:
d L d x = 4 μ 0 π D 2 N 2 l 2 v 4 l v l 0 - x + r D 2 = 4 L 2 x μ 0 π D 2 N 2
Based on the mechanical analysis of the movement of the valve core, the mechanical equation can be obtained as follows:
F e = 1 2 I 2 d L x d t
F e - k x - C v + C f d x d t = m d 2 x d t 2
where F e is electromagnetic force, k is the force coefficient of spring, C v is the dynamic friction factor of valve element, C f is the viscous damping coefficient, and m is the quality of valve element.
By combining Equations (3)–(5), we could get the following equation [28]:
2 L 2 x I 2 μ 0 π D 2 N 2 - C v + C f d x d t - k x = m d 2 x d t 2
According to Equation (6), the displacement of the solenoid valve core is closely related to the change process of driving current.
The dynamic driven current and core displacement of the solenoid valve are shown as Figure 2.
There are three indices related to the driving current and two related to the spool movement: trigger current i 1 , stable current i 2 , current drop Δi, reaction time t 1 , and action time t 2 .
The movement of the valve core and the driving current curve of the solenoid valve are different under each fault condition. The relationship between physical indices and failure factors is shown in Table 2.
The coil aging is mainly caused by aging of the insulation layer, resulting in a smaller coil resistance. Therefore, the stable current i 2 will increase. And after the insulation layer is aged, part of the wire contact is equivalent to the reduction of the number of coil turns, which causes the coil self-induction to become smaller. Consequently, the current drop Δi, reaction time t 1 , and action time t 2 will be reduced.
Drying up of lubricant will increase resistance when the spool is moving, so that the electromagnetic force to overcome the resistance is required to increase, which means the trigger current i 1 and the reaction time t 1 will increase. The increased resistance results in slower spool movement, which reduces the action time t 2 and current drop Δi.
From Table 2, we can see that the influence of these two fault factors on current characteristics is different. In theory, we can judge the fault type by the change of these five physical characteristics. However, in the practical application of the solenoid valve, its degradation process is usually the result of the combined effect of two failure factors. Therefore, it is necessary to extract more information from the current to predict the type of failure. In this paper, the wavelet packet decomposition is used to process the current data to obtain more failure information.

3. Failure Type Prediction Method Using Physical Indices and Data Features

In this section, the scheme of the proposed failure type prediction method using physical indices and data features is presented as Figure 3.
Firstly, the original current signal is collected and the five physical indices are abstracted. Secondly, the current change rate curve is analyzed by the wavelet packet decomposition to get the energy value of each frequency band. Then, the five physical indices and energies of frequency bands are combined into a comprehensive feature vector. Finally, the random forest classifier is applied to get failure type prediction and classification results.

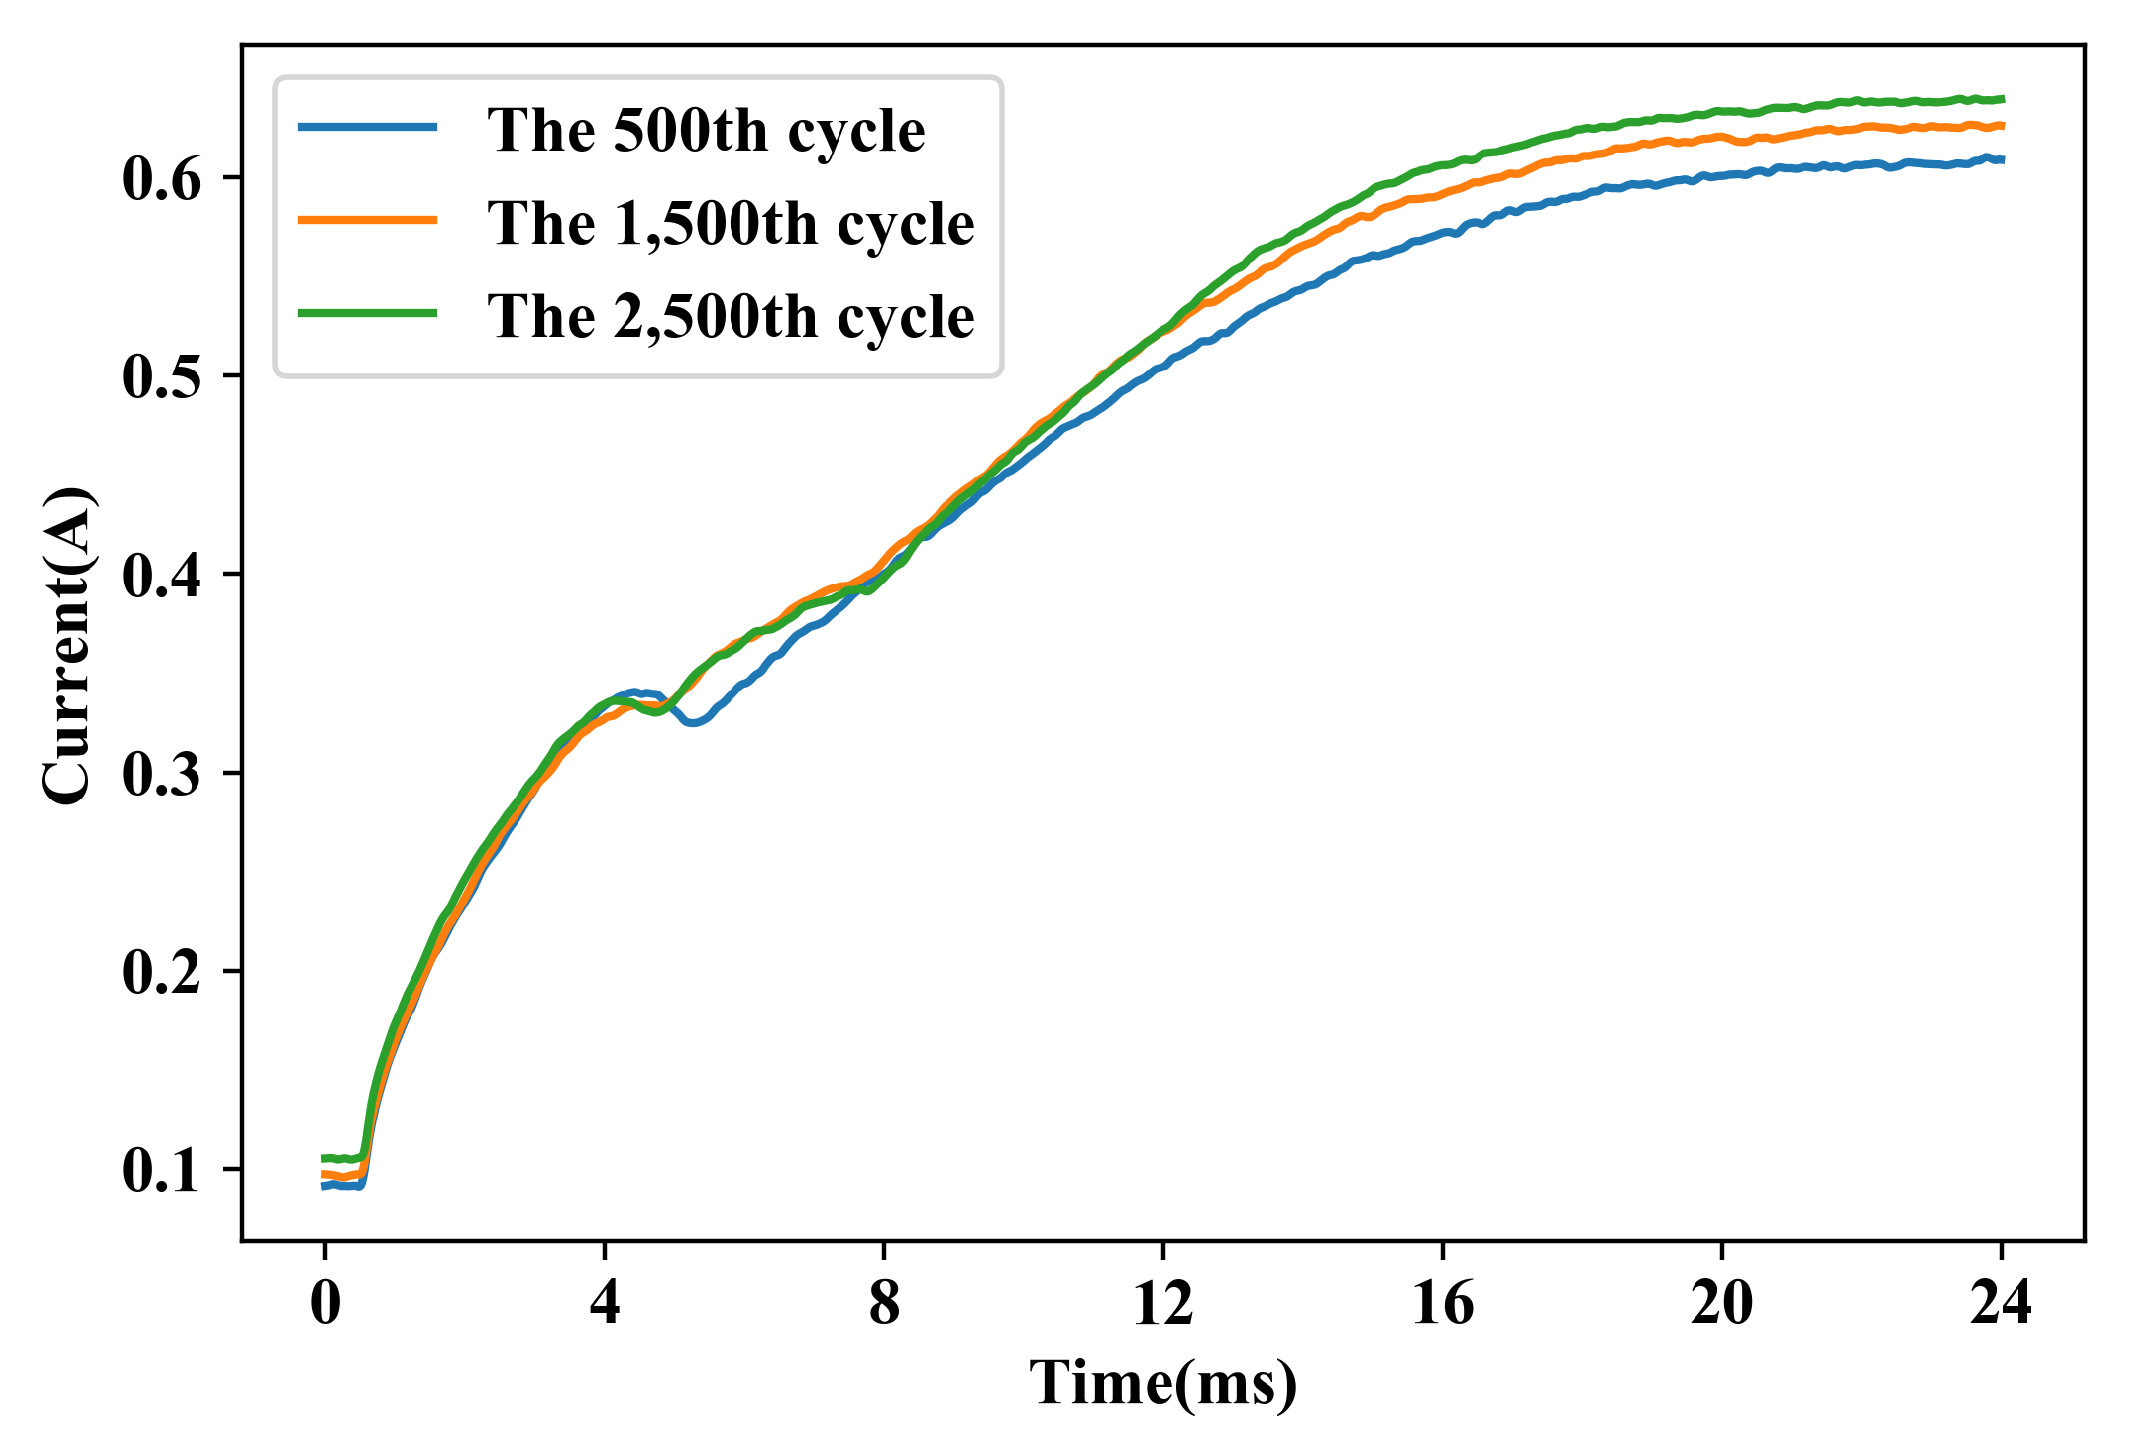
3.1. Data Generation

As mentioned in Section 2, the main failure causes of the high-speed solenoid valve in the actual work process are coil degradation and drying up of lubricant. To collect the driven current signal of high-speed solenoid valve under the influence of these two failure factors in different life stages, we built an accelerated aging test platform.
The physical figure of the test platform is shown in Figure 4. The braking control unit outputs the Pulse Width Modulation (PWM) control signal to make the high-speed solenoid valve operate periodically in 30 ms. The data acquisition card will store the current signal measured by the current transmitter in the industrial computer. The data acquisition period is 5 min, the acquisition time is 1 s, and the sampling frequency is 100,000 Hz
The current data of the high-speed solenoid valve is collected every five minutes. Regarding every five minutes as a cycle, the generated data set consists of 60 solenoid valves, each with more than 3000 cycles.
The driven current curve of the high-speed solenoid valve at the 500th, 1500th, and 2500th cycles are shown in Figure 5. From Figure 5, we can see that as the cycle increases, the stable current increases. In contrast, the action time and the current drop reduce. It is obvious that, as the number of operations increases, the coil has a certain degree of aging and the lubricant has dried up to some extent while we cannot directly judge the change trend of trigger current and reaction time because it is the result of combined action of these two failure factors.

3.2. Feature Extraction

Wavelet packet decomposition can decompose nonstationary signals into independent, arbitrary, and fine frequency bands without redundancy, omission, and orthogonality. It can solve the problem that the frequency resolution of wavelet decomposition is poor in the high-frequency band but that the time resolution is poor in the low-frequency band.
In this section, three-layer wavelet packet decomposition is used to process the current change rate curve and the energy of each frequency band is calculated. The result of three-layer wavelet packet decomposition is shown in Figure 6. As the energy value of each frequency band may vary too much, it is normalized as the data feature.
The calculation and normalization of frequency band energy are shown as Equations (7)–(12) [30].
E j = k = 1 n x j k 2
where x j k (j = 1:7,k = 1:n) is the amplitude of discrete point of reconstructed signal S j .
The energy feature vector is as follows:
E = E 1 , E 2 , E 3 , E 4 , E 5 , E 6 , E 7 , E 8
E s = j = 1 8 E j 2 1 2
E i * = E i E s ( i = 1 , 2 , . . . , 3 )
The standard data feature vector is as follows:
E * = E 1 * , E 2 * , . . . , E 8 *
The comprehensive feature vector (CFV) is composed of physical indices and data feature vector:
C F V = i 1 , i 2 , t 1 , t 2 , Δ i , E *
The comprehensive feature vectors of the new valve, the valve with aged coil, and the valve with dried lubricant are shown in Table 3.

3.3. Failure Type Prediction Using Random Forest

Random forest classifier is an ensemble algorithm based on bagging. On one hand, as a “forest" that builds multiple decision trees to vote for making decisions, it can effectively improve the classification accuracy of new samples and get better performances than just single classifier. On the other hand, compared with other ensemble algorithms, the random forest does not need to perform feature selection and is not sensitive to abnormal samples. Therefore, we choose the random forest to predict the failure type of high-speed solenoid valves in this paper. The method using the random forest to predict the failure type is shown in Figure 7.
We randomly select n samples from the generated data set and randomly select k features from the comprehensive feature vector to construct a decision tree. Then, the m decision trees obtained by repeating the above process m times form a decision forest. The prediction and classification results are determined by majority voting.
The random forest samples both the training samples and the features, which fully guarantees the independence between each tree constructed and makes the voting results more accurate. Its randomness is reflected in that the training samples of each tree are random, and the splitting properties of each node in the tree are also randomly selected. With these two random factors, even if each decision tree is not pruned, the random forest will not produce overfitting.

4. Experiment and Result Analysis

In fact, when the solenoid valve could be opened normally, as the number of actions increases, the coil will age and the lubricant will dry up. The final failure type depends on the severity of each of the two failure factors. To predict the failure type before it breaks down, the random forest is applied for prediction and classification based on the comprehensive feature vector extracted in Section 3.2.
Based on the accelerated aging test platform, we obtained the driven current data of the full life cycle of 60 high-speed solenoid valves. Among them, 37 high-speed solenoid valves finally failed due to the aged coils and the other 23 broke down because of the dried lubricant.
In this section, the random forest is used to predict the failure type of high-speed solenoid valves. To evaluate the prediction performance of the random forest, the model is tested by three-fold cross validation. It means, that in each round of three-fold cross validation, 40 samples are randomly selected as the training set and the remaining 20 samples are used as the test set; then, the average of the three test results is used as the estimate of the model performance. The prediction performance of the random forest model based on the comprehensive feature vector, the physical feature vector, and the data feature vector at cycle 3000 are shown in Table 4.
The calculation formula for precision, recall, and F1-score are shown as Equations (13)–(15) [32].
P r e c i s i o n = T P T P + F P
where TP is the number of coil aged samples predicted to be coil aged and FP is the number of samples with dried lubricant predicted to be coil aged.
R e c a l l = T P T P + F N
where FN is the number of coil aged samples predicted to be dried lubricant.
F 1 = 2 × P r e c i s i o n × R e c a l l P r e c i s i o n + R e c a l l
Similar to the prediction of the aged coils for a high-speed solenoid valve, we predict the lubricant failure of the solenoid valve, and the results of its three-fold cross validation are shown in Table 5.
From Table 4 and Table 5, we can see that the comprehensive feature vector combining physical and data features helps the random forest get the best prediction performance. The prediction performance of the aged coils is better than the lubricant failure.
In order to study the relationship between the life cycles of the high-speed solenoid valve and the prediction performance, the current data at different stages are used for prediction. We use the accuracy to evaluate the prediction performance of models. The accuracy is calculated as Equation (16).
A c c u r a c y = T P + T N P + N
where TP is the number of coil aged samples predicted to be coil aged, TN is the number of samples with dried lubricant predicted to be lubricant failure, P is the number of coil aged samples, and N is the number of samples with dried lubricant.
The prediction performance comparison result with several common classification algorithms, such as k nearest neighbors (KNN), support vector machine (SVM), and Decision Tree (DT), is shown in Figure 8. We can see that, as the number of cycles increases, the accuracies of all algorithms become higher. The reason is that, with the continuous aging of the high-speed solenoid valve, its failure trend becomes more and more obvious, which means it is getting closer to a certain failure type. The F1-score of random forest is higher than other algorithms at any stage, which means it has the best prediction performance to the compared algorithms.

5. Conclusions

The high-speed solenoid valve is a key component of the braking system. Its reliability is closely related to the safe operation of the braking system. Previous work paid more attention to predicting the remaining useful life of the solenoid valve, based on which the solenoid valve could be replaced timely before it fails. However, in actual operations, there are two main causes of the failure of the high-speed solenoid valve: the aging of the coil and the failure of the lubricant. It is more reasonable to repair the solenoid valve with lubricant failure rather than to replace it directly by adding lubricant oil. To improve the maintenance quality and to ensure the reliability of the solenoid valve, this paper proposes a failure type prediction method using physical indices and data features for high-speed solenoid valve in braking systems. Five physical indices are extracted from the driven current curve, and eight frequency band energy features are extracted from the current change rate curve by wavelet packet decomposition. Then, the physical indices and energy features are combined into a comprehensive feature vector. Finally, the random forest is applied to predict the failure type based on the comprehensive feature vector.
The proposed method is validated on a data set consisting of 60 high-speed solenoid valves periodically switched under accelerated aging test conditions. The prediction performance of the proposed method is compared with the performance based on physical index vector and data feature vector, and the result shows that the proposed method has the precision of 95.95% and 94.68% for the two failures at the 3000th life cycle of the solenoid valve, respectively. It is higher than both physical-based and data-based methods, which means that the combination of physical indices and data features is effective in improving the prediction performance of the random forest. In addition, the prediction performance of the applied random forest is compared with several commonly used machine learning algorithms such as KNN, SVM, and DT. As an ensemble classifier with multiple decision trees, the random forest makes decisions based on the predictions of all decision trees and thus could get better performance than just a single classifier. The experiment results also prove that the prediction performance of the random forest is the best in almost all life stages of the high-speed solenoid valve.

Author Contributions

Conceptualization, J.P. and X.T.; methodology, X.T. and R.Z.; software, X.T.; validation, X.T.; formal analysis, F.J.; investigation, R.Z., and X.Z.; resources, D.G.; data curation, B.C.; writing—original draft preparation, X.T.; writing—review and editing, R.Z.; visualization, Y.Y.; supervision, Z.H.; project administration, J.P.; funding acquisition, J.P. and X.T. All authors have read and agreed to the published version of the manuscript.

Funding

This research was funded by the National Natural Science Foundation of China (grant Nos.61672537, 61873353, and 61672539).

Acknowledgments

This research was funded by the National Natural Science Foundation of China (grant Nos. 61672537, 61873353, and 61672539).

Conflicts of Interest

The authors declare no conflict of interest.

Abbreviations

The following abbreviations are used in this manuscript:
PWMPulse Width Modulation
CFVComprehensive feature vector
KNNk nearest neighbors
SVMSupport vector machine
DTDecision tree

References

  1. Belmon, L.; Liu, C. High-speed train pneumatic braking system with wheel-slide protection device: A modelling application from system design to HIL testing. In Proceedings of the 2011 8th International Modelica Conference (IMC2011), Technical Univeristy, Dresden, Germany, 20–22 March 2011; pp. 549–556. [Google Scholar]
  2. Yang, J.W.; Wang, J.H.; Huang, Q. Reliability Assessment for the Solenoid Valve of a High-Speed Train Braking System under Small Sample Size. Chin. J. Mech. Eng. 2018, 311, 47. [Google Scholar] [CrossRef] [Green Version]
  3. Vogl, G.W.; Weiss, B.A.; Helu, M. A review of diagnostic and prognostic capabilities and best practices for manufacturing. J. Intell. Manuf. 2019, 30, 79–95. [Google Scholar] [CrossRef] [PubMed]
  4. An, D.; Kim, N.H.; Choi, J.H. Practical options for selecting data-driven or physics-based prognostics algorithms with reviews. Reliab. Eng. Syst. Saf. 2015, 133, 223–236. [Google Scholar] [CrossRef]
  5. Hashemnia, N.; Abu-Siada, A.; Islam, S. Improved power transformer winding fault detection using FRA diagnostics–part 1: Axial displacement simulation. IEEE Trans. Dielectr. Electr. Insul. 2015, 221, 556–563. [Google Scholar] [CrossRef]
  6. Hashemnia, N.; Abu-Siada, A.; Islam, S. Improved power transformer winding fault detection using FRA diagnostics–part 2: Radial deformation simulation. IEEE Trans. Dielectr. Electr. Insul. 2015, 221, 564–570. [Google Scholar] [CrossRef] [Green Version]
  7. Leturiondo, U.; Salgado, O.; Galar, D. Validation of a physics-based model of a rotating machine for synthetic data generation in hybrid diagnosis. Struct. Health Monit. 2017, 164, 458–470. [Google Scholar] [CrossRef]
  8. Lu, Y.; Li, Q.; Liang, S.Y. Physics-based intelligent prognosis for rolling bearing with fault feature extraction. Int. J. Adv. Manuf. Technol. 2018, 97, 611–620. [Google Scholar] [CrossRef]
  9. Eker, O.F.; Camci, F.; Jennions, I.K. Physics-based prognostic modelling of filter clogging phenomena. Mech. Syst. Signal Process. 2016, 75, 395–412. [Google Scholar] [CrossRef] [Green Version]
  10. Huang, B.; Cohen, K.; Zhao, Q. Active anomaly detection in heterogeneous processes. IEEE Trans. Inf. Theory 2018, 65, 2284–2301. [Google Scholar] [CrossRef] [Green Version]
  11. Huang, B.; Cohen, K.; Zhao, Q. Active anomaly detection in heterogeneous processes. In Proceedings of the International Conference on Acoustics, Speech and Signal Processing (ICASSP), Calgary, AB, Canada, 15–20 April 2018; Volume 65, pp. 3924–3928. [Google Scholar]
  12. Liu, Y.F.; Mao, M.C.; Xu, X.Y. Multi-physics coupled thermo-mechanics analysis of a hydraulic solenoid valve. Appl. Mech. Mater. 2013, 321, 102–107. [Google Scholar] [CrossRef]
  13. Cosme, L.B.; D’Angelo, M.F.S.V.; Caminhas, W.M. A novel fault prognostic approach based on particle filters and differential evolution. Appl. Intell. 2018, 484, 834–853. [Google Scholar] [CrossRef]
  14. Wang, Y.; Peng, Y.; Zi, Y. A two-stage data-driven-based prognostic approach for bearing degradation problem. IEEE Trans. Ind. Inf. 2016, 123, 924–932. [Google Scholar] [CrossRef]
  15. Mashhadi, P.S.; Nowaczyk, S.; Pashami, S. Stacked Ensemble of Recurrent Neural Networks for Predicting Turbocharger Remaining Useful Life. Appl. Sci. 2020, 10, 69–88. [Google Scholar] [CrossRef] [Green Version]
  16. Wu, X.J.; Ye, Q. Fault diagnosis and prognostic of solid oxide fuel cells. J. Power Sources 2016, 321, 47–56. [Google Scholar] [CrossRef]
  17. Mosallam, A.; Medjaher, K.; Zerhouni, N. Data-driven prognostic method based on Bayesian approaches for direct remaining useful life prediction. J. Intell. Manuf. 2016, 27, 1037–1048. [Google Scholar] [CrossRef]
  18. Wang, T.; Lu, G.; Liu, J. Graph-Based Change Detection for Condition Monitoring of Rotating Machines: Techniques for Graph Similarity. IEEE Trans. Reliab. 2018, 9-3, 1034–1049. [Google Scholar] [CrossRef]
  19. Liao, L.; Köttig, F. A hybrid framework combining data-driven and model-based methods for system remaining useful life prediction. Appl. Soft Comput. 2016, 44, 191–199. [Google Scholar] [CrossRef]
  20. Xu, J.; Xu, L. Health management based on fusion prognostics for avionics systems. J. Syst. Eng. Electron. 2011, 223, 428–436. [Google Scholar] [CrossRef]
  21. Liao, L.; Köttig, F. Review of hybrid prognostics approaches for remaining useful life prediction of engineered systems, and an application to battery life prediction. IEEE Trans. Reliab. 2014, 63, 191–207. [Google Scholar] [CrossRef]
  22. Tang, X.H.; Peng, J. A parameter adaptive data-driven approach for remaining useful life prediction of solenoid valves. In Proceedings of the 2019 10th IEEE International Conference on Prognostics and Health Management (ICPHM2019), Hyatt Regency San Francisco Airport, Burlingame, America, 17–19 June 2019; pp. 1–6. [Google Scholar]
  23. Li, C.; Sanchez, R.V.; Zurita, G. Gearbox fault diagnosis based on deep random forest fusion of acoustic and vibratory signals. Mech. Syst. Signal Process. 2016, 76, 283–293. [Google Scholar] [CrossRef]
  24. Cabrera, D.; Sancho, F.; Sánchez, R.V. Fault diagnosis of spur gearbox based on random forest and wavelet packet decomposition. Front. Mech. Eng. 2015, 10, 277–286. [Google Scholar] [CrossRef]
  25. Chen, Z.; Han, F.; Wu, L. Random forest based intelligent fault diagnosis for PV arrays using array voltage and string currents. Energy Convers. Manag. 2018, 178, 250–264. [Google Scholar] [CrossRef]
  26. Santur, Y.; Karaköse, M.; Akin, E. Random forest based diagnosis approach for rail fault inspection in railways. In Proceedings of the 2016 National Conference on Electrical, Electronics and Biomedical Engineering (ELECO2016), Bursa, Turkey, 1–3 December 2016; pp. 745–750. [Google Scholar]
  27. Wang, Z.; Zhang, Q.; Xiong, J. Fault diagnosis of a rolling bearing using wavelet packet denoising and random forests. IEEE Sens. J. 2017, 17, 5581–5588. [Google Scholar] [CrossRef]
  28. Tan, Y.B.; Cheng, J.J.; Liu, S. Liquid solenoid valve fault diagnosis based on EMD and neighborhood rough set. Comput. Eng. Appl. 2017, 52, 255–260. [Google Scholar]
  29. Pimao, L.; Youtong, Z.; Chengqun, N. Simulation and experiment of dynamic characteristics of common-rail injector solenoid valve. Trans. Chin. Soc. Agric. Mach. 2013, 44, 7–12. [Google Scholar]
  30. Liu, Z.; Gao, Q.; Niu, H. The Fault Diagnosis of Electromagnetic Valves Based on Driving Current Detection. Acta Armamentarii 2014, 35, 1083–1090. [Google Scholar]
  31. Cai, W.; Zheng, X.; Zhang, Z. Failure mechanism analysis and transient characteristic simulation of hydraulic electromagnetic valve. Chin. J. Sci. Instrum. 2011, 32, 2726–2733. [Google Scholar]
  32. Tatbul, N.; Lee, T.J. Precision and recall for time series. In Proceedings of the 2018 32nd Conference on Neural Information Processing Systems (NeurIPS 2018), Montréal, QC, Canada, 2–8 December 2018; pp. 1920–1930. [Google Scholar]
Figure 1. The structure of the high-speed switching solenoid valve.
Applsci 10 01323 g001
Figure 2. Dynamic driven current and core displacement of the high-speed solenoid valve.
Applsci 10 01323 g002
Figure 3. Scheme of proposed failure type prediction using physical indices and data features.
Applsci 10 01323 g003
Figure 4. Accelerated aging test platform: (a) the accelerated aging test platform of the high-speed solenoid valve and (b) the generalized representation of the test platform, where the green lines are the signal flow and the blue lines are the air flow.
Applsci 10 01323 g004
Figure 5. Driven current curves of the high-speed solenoid valve at different life cycles.
Applsci 10 01323 g005
Figure 6. Results of feature extraction by wavelet packet decomposition on the current change rate curve of the high-speed solenoid valve: (a) Driven current curve of the solenoid valve on the 3000th cycle; (b) current change rate curve of the solenoid valve on the 3000th cycle; and (c) the result of three-layer wavelet packet decomposition on the current change rate curve of the solenoid valve on the 3000th cycle.
Applsci 10 01323 g006
Figure 7. Algorithm flow of random forest applied to failure type prediction.
Applsci 10 01323 g007
Figure 8. The prediction performance comparison result.
Applsci 10 01323 g008
Table 1. The impact of each type of failure.
Failure TypeRepresentation
Aging of coilthe resistance of the coil decreases
the steady state current increases
Drying up of lubricantthe movement resistance increases
spool speed reduces
Table 2. Relationship between physical indices and failure types.
Physical IndexAging of CoilDrying up of Lubricant
Trigger current i 1 -
Stable current i 2 -
Reaction time t 1
Action time t 2
Current drop Δi
Table 3. Comprehensive feature vectors of solenoid valves under different states.
CFVNew ValveValve with Aged CoilValve with Dried Lubricant
i 1 (A)0.28640.19260.3254
i 2 (A)0.64220.51010.6188
t 1 (ms)3.314.064.37
t 2 (ms)1.270.950.30
Δ i (A)0.09720.02490.0026
E 1 * 0.345650.303320.21379
E 2 * 0.00750.004890.00356
E 3 * 0.000760.000530.00028
E 4 * 0.001550.001130.00086
E 5 * 0.000260.000150.00009
E 6 * 0.000480.000350.0002
E 7 * 0.000370.000350.00013
E 8 * 0.000810.000610.00027
Table 4. Prediction performance of aged coils.
Performance MatricsPrecisionRecallF1-Score
Proposed method95.95%94.83%95.39%
Physical index vector94.71%91.12%92.88%
Data feature vector93.37%92.32%92.84%
Table 5. Prediction performance of lubricant failure.
Performance MatricsPrecisionRecallF1-Score
Proposed method94.68%94.04%94.36%
Physical index vector94.05%92.48%93.26%
Data feature vector93.56%92.78%93.17%

