Article

Classification Maps in Studies on the Retirement Threshold

by
Agnieszka Bielińska
1,
Dorota Bielińska-Wa̧ż
2,* and
Piotr Wa̧ż
3
1
Department of Quality of Life Research, Medical University of Gdańsk, 80-210 Gdańsk, Poland
2
Department of Radiological Informatics and Statistics, Medical University of Gdańsk, 80-210 Gdańsk, Poland
3
Department of Nuclear Medicine, Medical University of Gdańsk, 80-210 Gdańsk, Poland
*
Author to whom correspondence should be addressed.
Appl. Sci. 2020, 10(4), 1282; https://doi.org/10.3390/app10041282
Submission received: 20 January 2020 / Revised: 6 February 2020 / Accepted: 8 February 2020 / Published: 14 February 2020
(This article belongs to the Special Issue Medical Informatics and Data Analysis)

Abstract

:
The aim of this work is to present new classification maps in health informatics and to show that they are useful in data analysis. A statistical method, correspondence analysis, has been applied for obtaining these maps. This approach has been applied to studies on expectations and worries related to the retirement threshold. For this purpose two questionnaires formulated by ourselves have been constructed. Groups of individuals and their answers to particular questions are represented by points in the classification maps. The distribution of these points reflects psychological attitudes of the considered population. In particular, we compared structures of the maps searching for factors such as gender, marital status, kind of work, economic situation, and intellectual activity related to the attendance the University of the Third Age, which are essential at the retirement threshold. Generally, in Polish society, retirement is evaluated as a positive experience and the majority of retirees do not want to return to their professional work. This result is independent of the kind of work and of the gender.

1. Introduction

Classification studies are a valuable source of information in various areas of science. The problem of classification is related to the problem of similarity of objects. Objects arranged in simple, one-dimensional sets may be classified in a unique way according to one, properly chosen, aspect of similarity. The problem becomes more complicated if we consider multidimensional sets, i.e., objects characterized by several different aspects. The degree of similarity depends on the selected aspects, on the number of aspects considered and on the mathematical measure establishing the relations between different properties.
One of class of objects considered by us is biological sequences. Both graphical and numerical classification of these objects is possible using methods based on Graphical Representations [1,2]. Within these methods, one can create a large number of different types of numerical characteristics (descriptors) of the plots representing the sequences. One kind of descriptors we propose are the distribution moments related to different statistical distributions describing the DNA sequences. We have shown that using these descriptors a pair of the sequences that differ by only one base can be distinguished. The coordinates of the descriptors representing these sequences are different in the classification maps [1]. The distribution moments we have also introduced as new descriptors of another class of objects—the molecular spectra [3,4]. The applications of the theory of molecular similarity are broad. Except for the studies of the properties of the systems explicitly considered in our works, the new descriptors may have broad range of interdisciplinary applications. For example, they may be applied in computational pharmacology and toxicology [5]. Our new descriptors have also found their application in the classification of the solutions in the chaotic systems [6], or in the classification of the stellar spectra [7,8]. Another kind of descriptor we propose are values used in the classical dynamics such as coordinates of center of mass or the moments of inertia. Examples of the classification studies using these descriptors may be found in the theory of molecular similarity [9] or in bioinformatics [10].
A class of objects considered in this work are groups of individuals. The studies are focused on the retirement threshold. A graphical representation of the results known as the Correspondence Analysis (CA) proves to be very useful in this kind of study [11]. Recently, CA was applied for studies on a variety of problems, for example, on high school dropouts [12], and also in archeology [13], in food science [14], etc. In the CA the information about the whole system is stored on maps in which objects under consideration are represented by points located in a specific way. The classification of the objects is here performed by studying distances between the points and, in particular, by identifying clusters of the points. Objects corresponding to the points which form a cluster are similar in some way.
Progress of medicine and lower fertility rate caused significant changes in the structure of modern societies. The number of seniors in developed countries is growing dynamically. In Poland in 2010 the percentage of people aged 65 and over was 19%. According to Eurostat forecasts, in 2030 the ratio of elderly people to the population aged 15–64 will be 36%, and in 2050—56% [15].
Due to acceleration of aging process, it seems reasonable to study the quality of life of older people. An important role in shaping the quality of life of seniors plays the retirement threshold, which is described in literature as symbolic moment—starting a new chapter in life. It involves many negative changes such as loss of professional status, deterioration of the economic situation, as well as reduction in the number of social interactions. On the other hand, pensioners have much free time for family life and hobby. Therefore, despite losing one of the most important roles in life, one can set new goals and develop non-professional passions. The change of social role from employee to retiree is a natural process, but such a big change in life may lead to negative psychological effects [16,17,18,19]. Changes in different aspects of life due to the retirement threshold have been studied in many countries. For example, changes in the sleep duration were studied in the United States [20] and Finland [21]; changes in the physical activity were studied in Canada [22], Belgium [23], and Finland [24,25,26]; and changes in the body mass index were studied in the United States [27] and Finland [28]. A variety of changes in the quality of life in different domains have been observed, for example, in the subjective wellbeing [29], in the use of time, activity patterns, in health and wellbeing [30], in the health-related quality of life [31], in the enjoyment of everyday activities [32], and in mobility [33]. The observed changes at the retirement threshold are not unique. Different factors, e.g., sex, social background, and education level, may determine whether they are positive or negative. Education is one of the most important factors determining worry-free retirement [34]. Recently, the Universities of the Third Age (U3A) became popular in many countries, and their positive influence has been broadly discussed [35,36,37,38,39]. The International Association of Universities of the Third Age (AU3A) is a global international organization. The AU3A network includes institutions from Asia, both Americas, Europe, and Australia. The attendance of U3A grows exponentially in the global scale. In China alone the number of universities for senior citizens has grown from 19,000 in 2002 to 70,000 in 2017. The corresponding numbers of students of U3A in China is even more impressive: from 1.8 million to 8 million.
In the present work, we study the influence of factors, such as gender, kind of work, marital status, intellectual activity related to the attendance the University of the Third Age, economic situation, on the expectations and on the worries related to the retirement threshold from the Polish perspective. Some pilot studies on the changes of the quality of life related to the retirement threshold using the World Health Organization Quality of Life-BREF (WHOQOL-BREF) questionnaire, and this graphical representation of the results we have already published [40,41,42,43,44,45]. The WHOQOL-BREF questionnaire is a standard tool in the quality of life research and many versions of this questionnaire have been created in different countries, for example, the Polish version [46], the Bangla version [47], the Spanish version [48], or the Finnish version [49]. This questionnaire is composed of 26 questions. Two questions are related to Overall Quality of Life and General Health. The remaining 24 questions concern four domains: Physical Health, Psychological, Social Relationships, and Environment. Using this questionnaire, we have shown that CA classification maps are a convenient tool for the studies on the role of different factors in changing the quality of life after the retirement threshold, such as gender [42] and marital status [43] in four domains, job position in Physical Health and Psychological domains [44], or in Social Relationships and Environment domains [45]. In most of cases, these factors play an important role. The considered factors are particularly important in the Psychological and in the Social Relationships domains. The influence of different factors, such as age, education, marital status, and job position on the Overall Quality of Life and General Health has also been studied by us using this graphical approach and WHOQOL-BREF questionnaire [40,41].

2. Materials and Methods

In the present work, the points forming clusters in CA maps correspond to subgroups of all individuals and to their answers to the questions. We used two our own questionnaires: Questionnaire for an Employed or a Self-Employed Person and Questionnaire for a Retiree (see Appendix A).
The studies have been performed in the period from February 2017 to May 2017 in Bydgoszcz, the eighth largest city in Poland (~350,000 inhabitants). We considered 449 individuals (older than 50): 160 employees (100 females and 60 males) and 289 retirees (186 females and 103 males).
We split the group of the retirees to two subgroups: students of U3A denoted in the figures as retirees2 and non-students of U3A denoted as retirees1 (Appendix A, question No. 9R). We also split all the subgroups (employees, retirees1, retirees2) according to the marital status. We consider two subgroups: married and others (Appendix A, question No. 7ER). In subgroup others are those individuals who are single, separated, divorced, or widowed.
Groups of individuals and their answers to particular questions (e.g., answer No. 1: A1) are represented by points in the classification maps. In this way, we can classify different subgroups, i.e., we can find subgroups of these individuals who answer in a similar way to some specific questions considered in the questionnaires.
The clusters of points are defined by the angles between vectors and the lengths of these vectors. The initial points of all vectors are located at the central point (CP) of the map, i.e., at the crossing point of the dotted lines marked in the maps. The terminal points of the vectors are denoted in the figures by empty squares (groups of individuals) and by full circles (answers). The squares and the circles belong to one cluster if the angles between the vectors (CP-square and CP-circle) are small. The longer are the vectors, the stronger is the positive association. Angles close to 90 degrees indicate no relationship. It the angles are close to 180 degrees, then they indicate a negative association. The longer are the vectors, the stronger is the negative association.
The final results have been generated using the R statistics language [50].

3. Results and Discussion

Figure 1, Figure 2, Figure 3 and Figure 4 show the results (maps) obtained using CA.
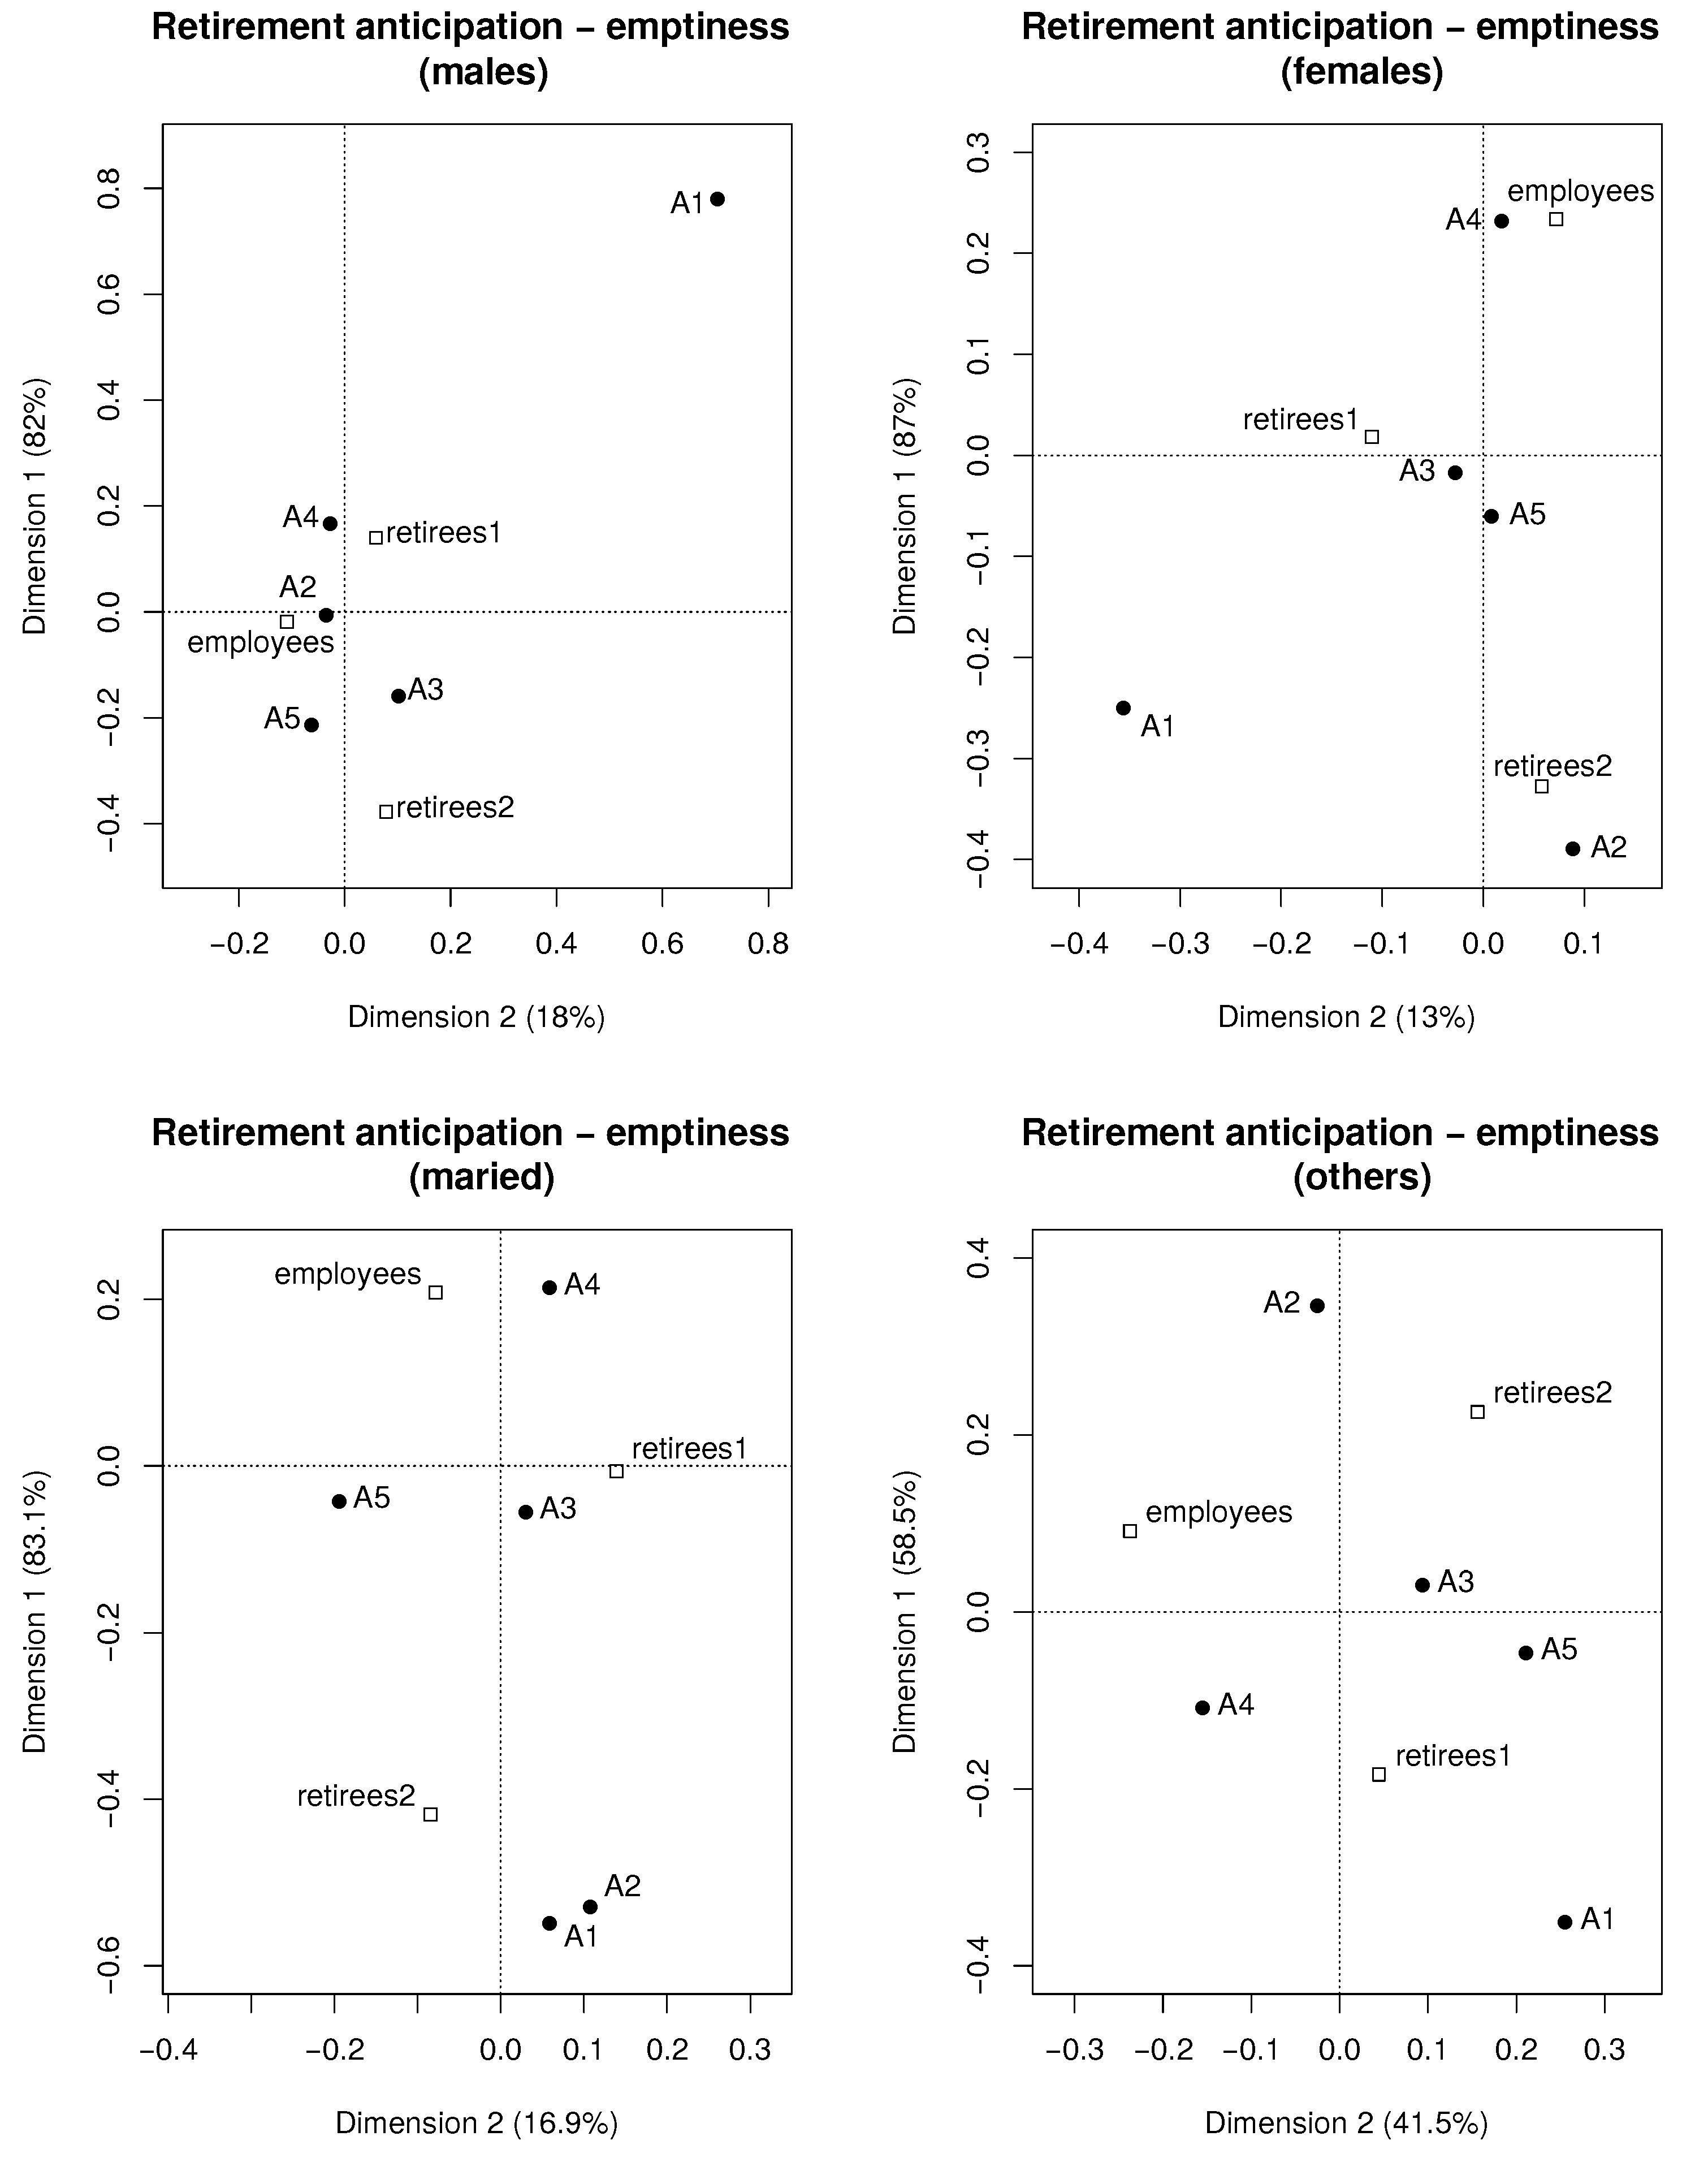
Figure 1 shows maps related to the answers to questions about emptiness after the retirement (Appendix A, questions No. 21E and 18R). The structure of the maps for males and for females (top panels) are different. For females (top right panel), the angles between the vectors CP-employees and CP-A4, between CP-retirees2 and CP-A2 are small. Consequently, we can extract two clusters:
  • employees—A4,
  • retirees2—A2.
The lengths of all of the vectors CP-employees, CP-A4, CP-retirees2, and CP-A2 are large. Then, the two associations are strong.
For males (top left panel), the angles are nearly 180 degrees between vectors CP-retirees2 and CP-A4, between CP-retirees1 and CP-A5. Therefore, in this case, we have negative associations:
  • retirees2—A4,
  • retirees1—A5.
If the spread between the number of answers to different questions is large then the least common answers usually correspond to the negative associations. The least common answer about emptiness after retirement given by retirees2 is A4 “I was not afraid”. The least common answer about emptiness after retirement given by retirees1 is A5 “I was not afraid at all”. Depending on the lengths of the corresponding vectors, the strengths of the association may vary. In this case, the negative association for males is weak since the lengths of these vectors are smaller than for females. The point representing employees (males) is located close to the central point, so there are no strong associations of this group with any of the answers, while the most frequent answer for the employees (females) is A4 “I am not afraid” (cluster employees—A4).
Transition to retirement is a key moment when an individual must redefine his or her social roles, which is not always successful. Women more often define their social role as a family member: housewife and mother. After the end of their professional activity they find themselves in the role of grandmothers, participating in the family life of their children [51]. According to opinion polls in Polish society men are less involved in family life and performing household duties so after they terminate professional life they would stay without any activities and many of them may feel emptiness [52].
If we consider the marital status, we observe negative associations for married (Figure 1, bottom left panel):
  • employees—A1,
  • employees—A2,
  • retirees2—A4,
  • retirees1—A5.
The angles between the vectors CP-employees and CP-A1, between CP-employees and CP-A2, between CP-retirees2 and CP-A4, and between CP-retirees1 and CP-A5 are close to 180 degrees. The least common answers for employees (married) about emptiness after the retirement are A1 “Yes, I am very much afraid” and A2 “Yes, I am slightly afraid”. The least common answer to this question of retirees2 (married) is A4 “I was not afraid”. The least common answer to this question of retirees1 (married) is A5 “I was not afraid at all”. As the lengths of CP-A5 and CP-retirees1 are smaller comparing to other vectors, the association for retirees1 is the weakest.
For others (Figure 1, bottom right panel), the structure of the map is different than for married. We observe different negative associations:
  • employees—A5,
  • retirees2—A4,
  • retirees1—A2.
Analogously, as for married, the least common answer to this question of retirees2 (others) is A4 “I was not afraid”. The marital status is not an important factor determining the kind of answer to this question for retirees2. For retirees1 (others) the least common answer is A2, whereas for married is A5. For employees (others) the least common answer is A5, whereas for employees (married) the least common answers are A1 and A2. For employees and retirees1, the marital status changes the results of the classification.
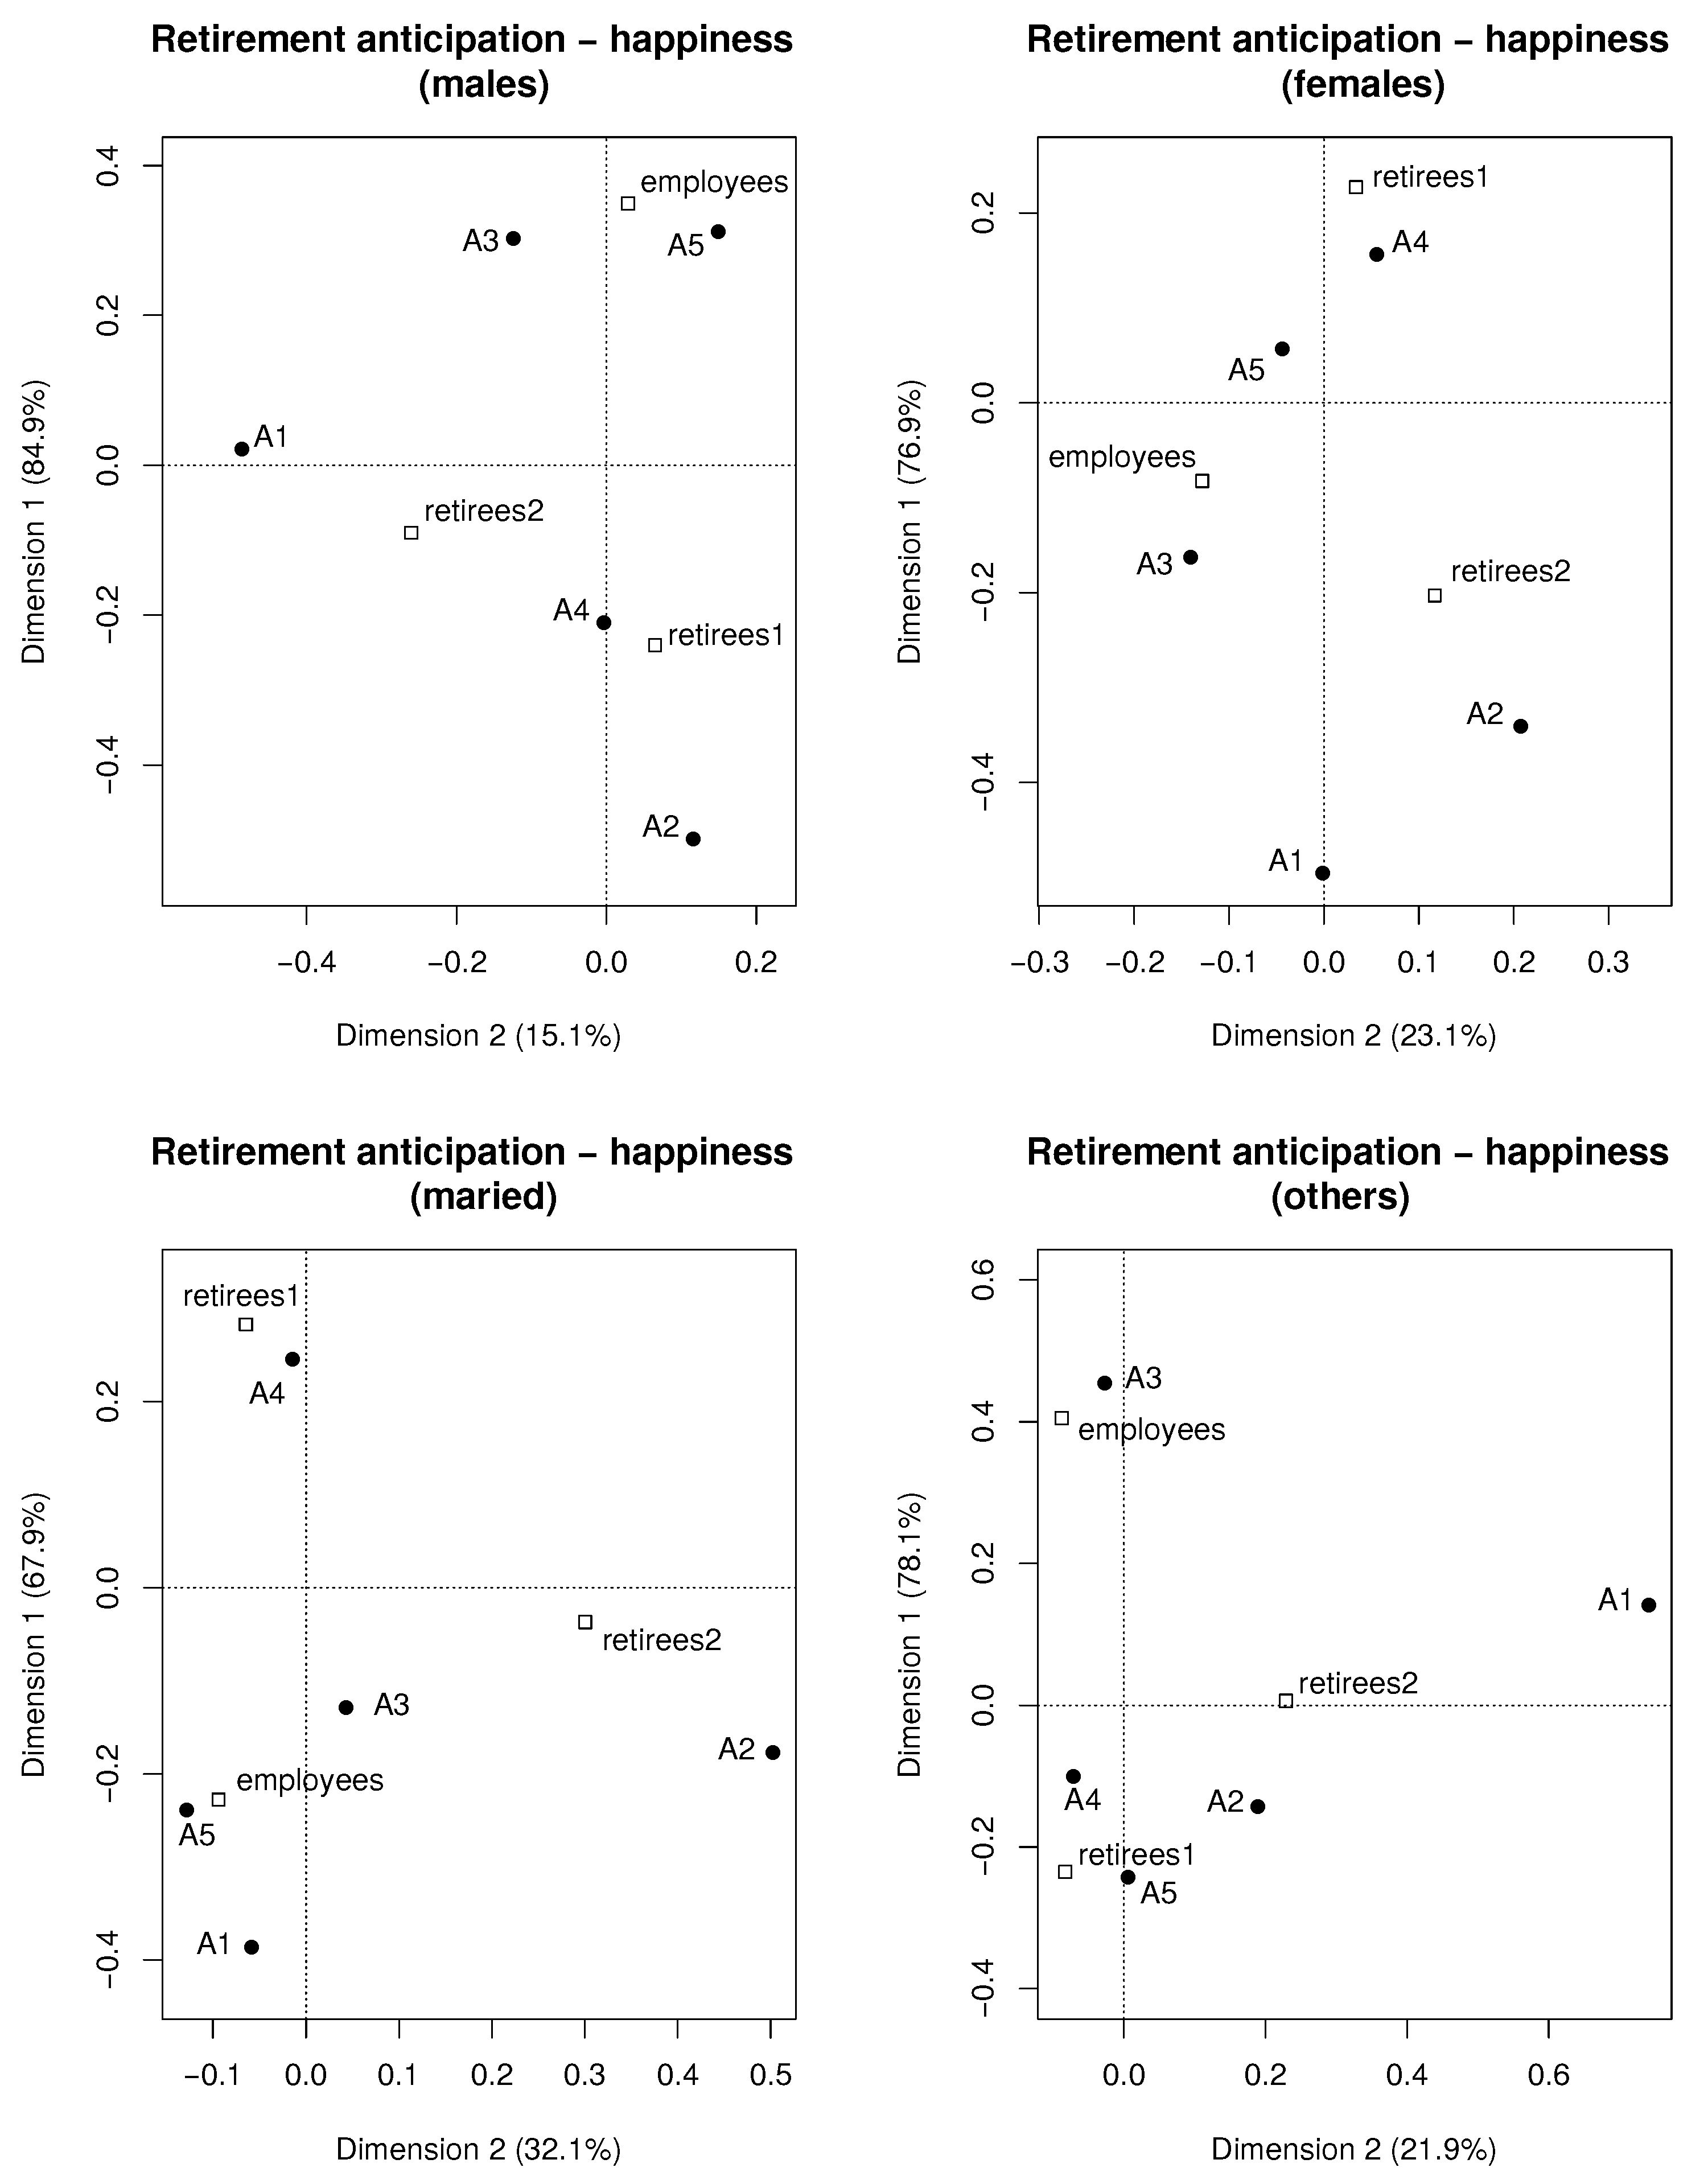
Similar studies can be performed for other aspects, for example, satisfaction with retirement (Appendix A, questions No. 15E and 15R). The results are shown in Figure 2: males (Figure 2, top left panel), females (Figure 2, top right panel), married (Figure 2, bottom left panel), and others (Figure 2, bottom right panel). The answer A1 corresponds to “Very unhappy”, whereas A5 corresponds to “Very happy”. We observe different clusters for males and females, so gender is an important factor influencing the kind of answer to this question. In particular, for males we observe the following clusters:
  • retirees1—A2,
  • employees—A5.
For females the clusters are:
  • retirees1—A4,
  • retirees2—A2.
The most frequent answer of females attending the U3A (retirees2) is the same as retirees1 (males), i.e., A2. There are also several negative associations for males:
  • employees—A4,
  • retirees1—A3.
The least common answer for retirees1 (males) is A3. For females the negative associations are:
  • retirees2—A5,
  • retirees1—A1.
The least common answer for retirees1 (females) is A1. A5 is located close to the central point so the association for retirees2 (females) is weak.
If we consider the marital status, for this question, we also observe different clusters for married and for others. The marital status is an important factor influencing the results of the classification in this case. In particular, for married we observe the clusters (Figure 2, bottom left panel):
  • employees—A5,
  • retirees1—A4,
and for others (Figure 2, bottom right panel)
  • employees—A3,
  • retirees1—A5,
  • retirees2—A1.
The associations retirees1—A5 and retirees2—A1 are weak for others. The most frequent answer for employees (married) is A5 “Very happy”, while for employees (others) the least common answer is A5 (negative association).
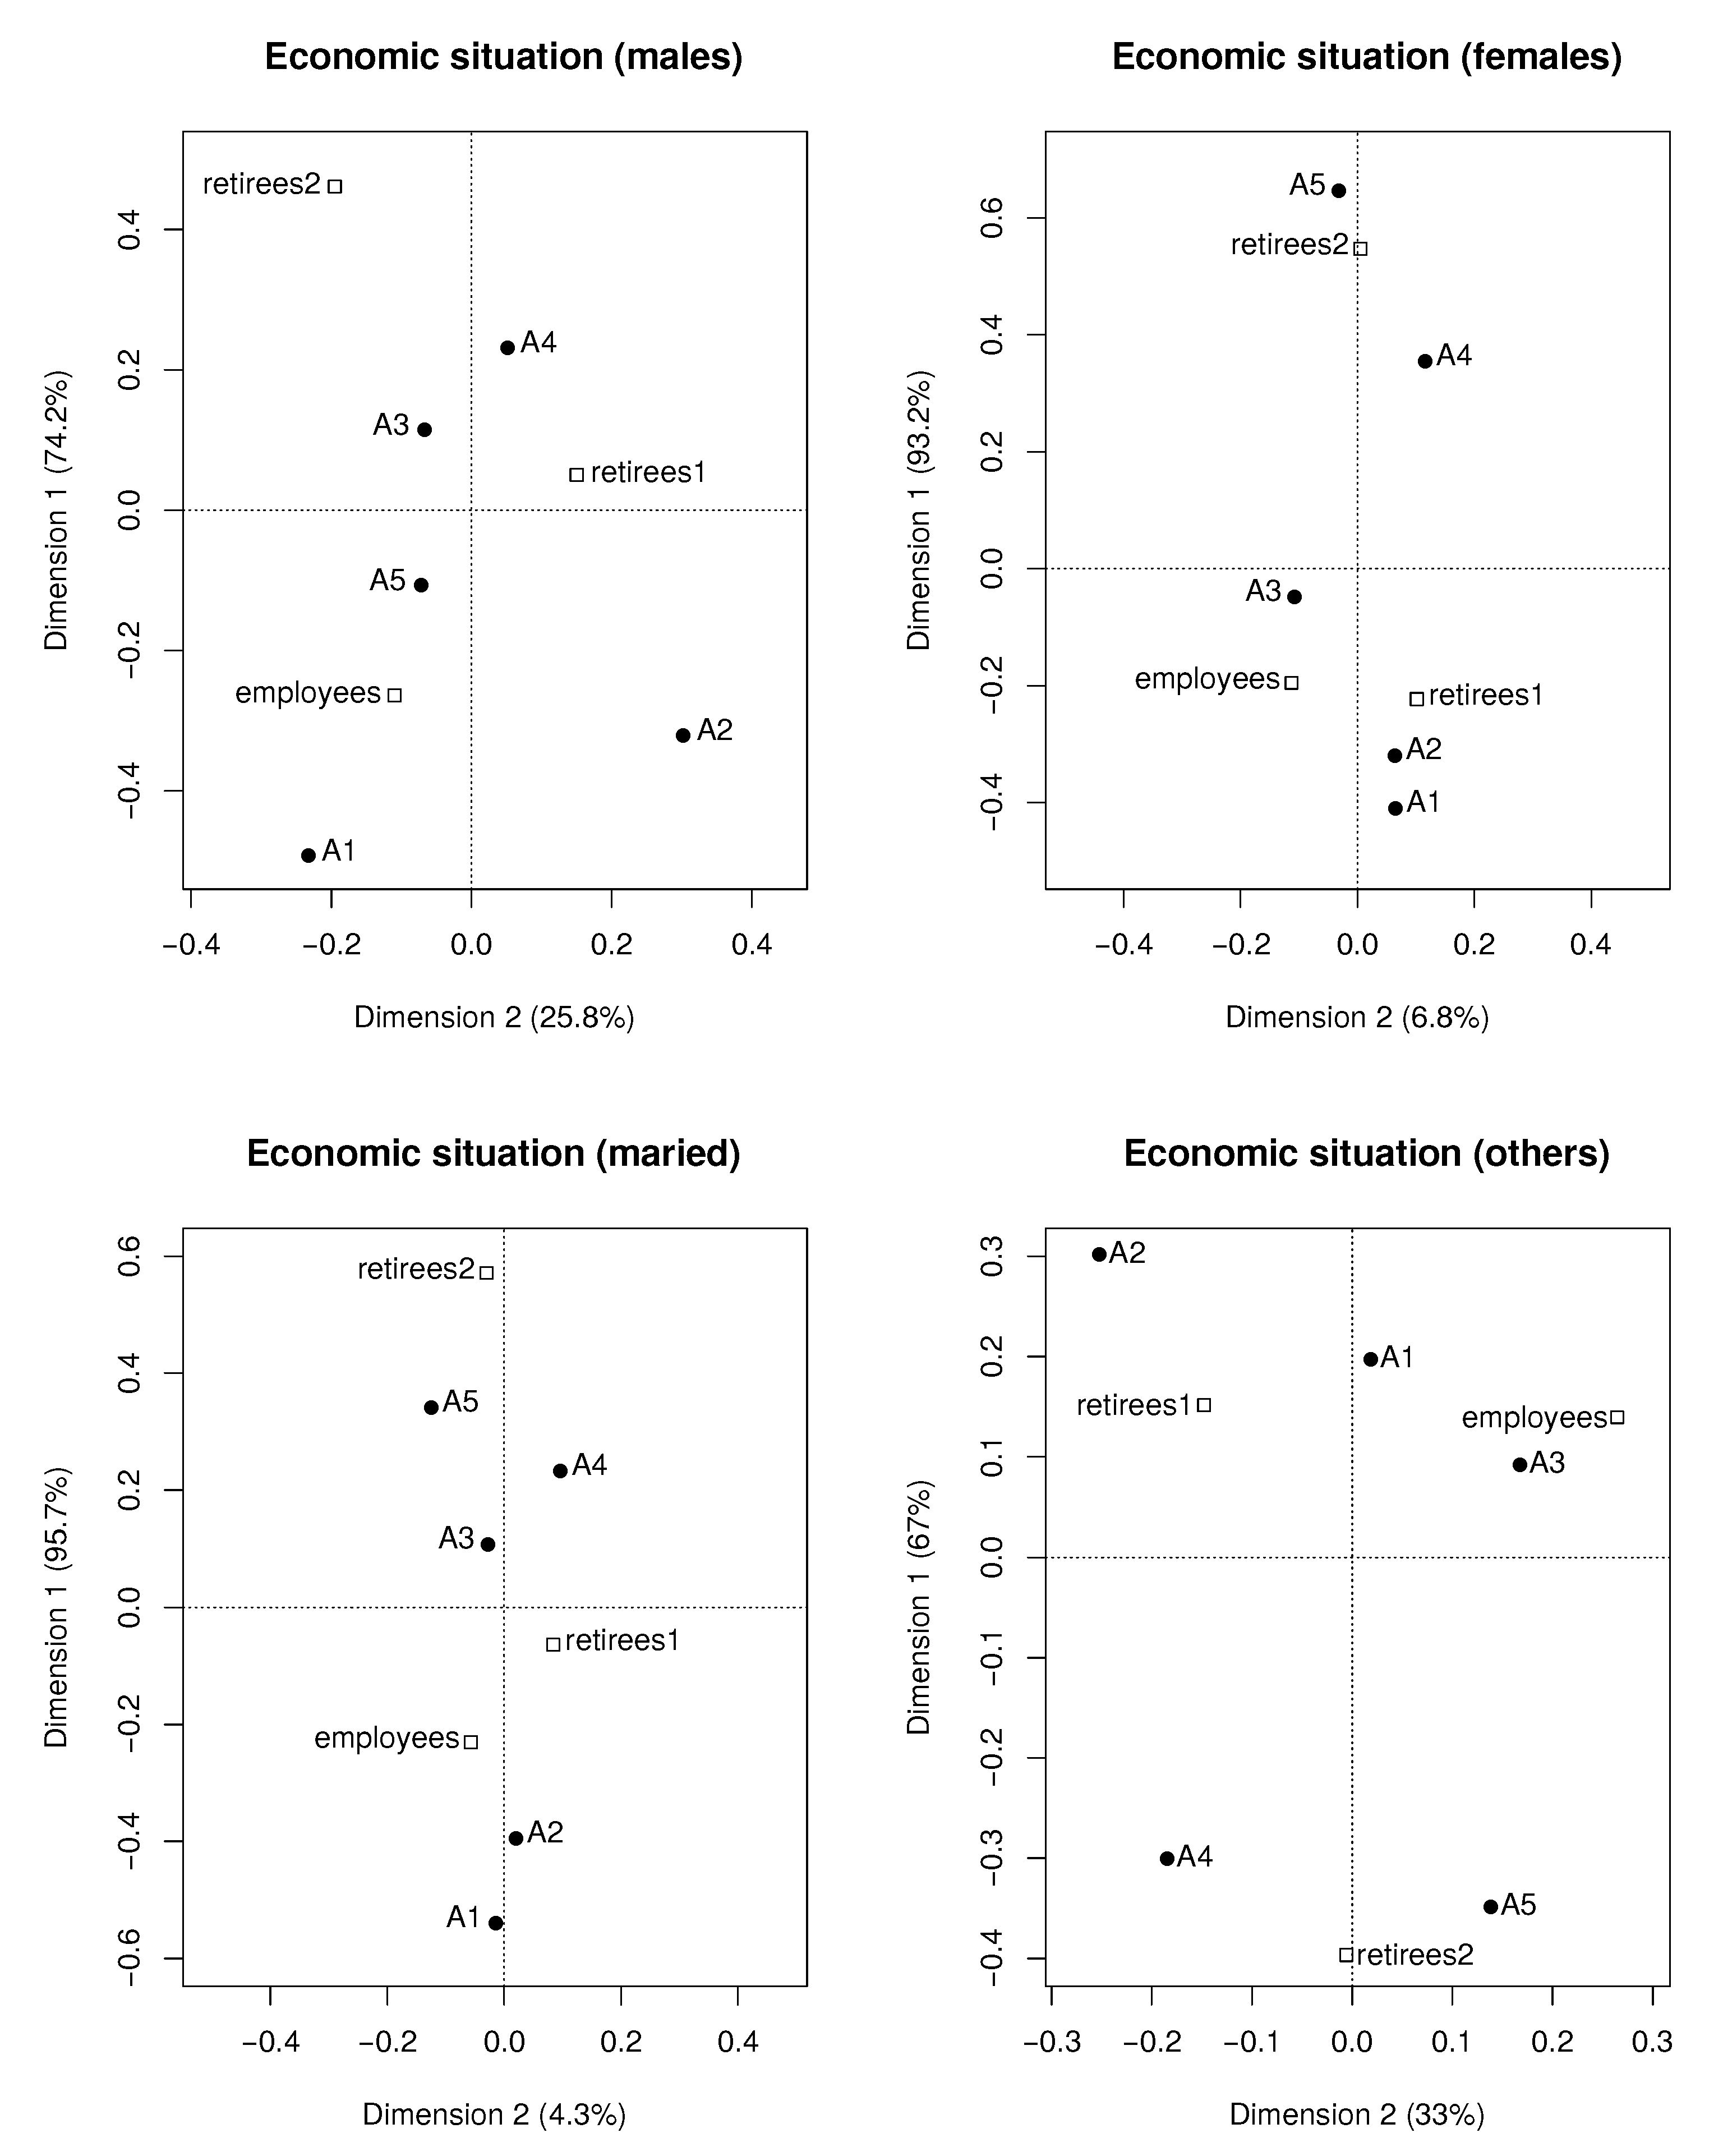
Figure 3 is concerned about the question on the adequate amount of money after retirement (Appendix A, questions No. 19E and 20R). Analogously to Figure 1 and Figure 2, the top panels refer to males and to females and the bottom ones to married and to others. A1 corresponds to the answer “Not at all”, and A5 to “Quite enough”. For males (top left panel) the clusters are the following:
  • employees—A5,
  • retirees2—A3,
and for females (Figure 3, top right panel)
  • retirees1—A1,
  • retirees1—A2,
  • retirees2—A5.
The negative associations for males are:
  • employees—A4,
  • retirees2—A2,
and for females
  • employees—A4,
  • retirees2—A1,
  • retirees1—A5.
Employees and retirees estimate in a different way the economic situation during the retirement. Some differences are also between males and females. Considering the marital status, the clusters are also different. In particular, the group employees (married) clusters with A1, whereas employees (others) clusters with A3.
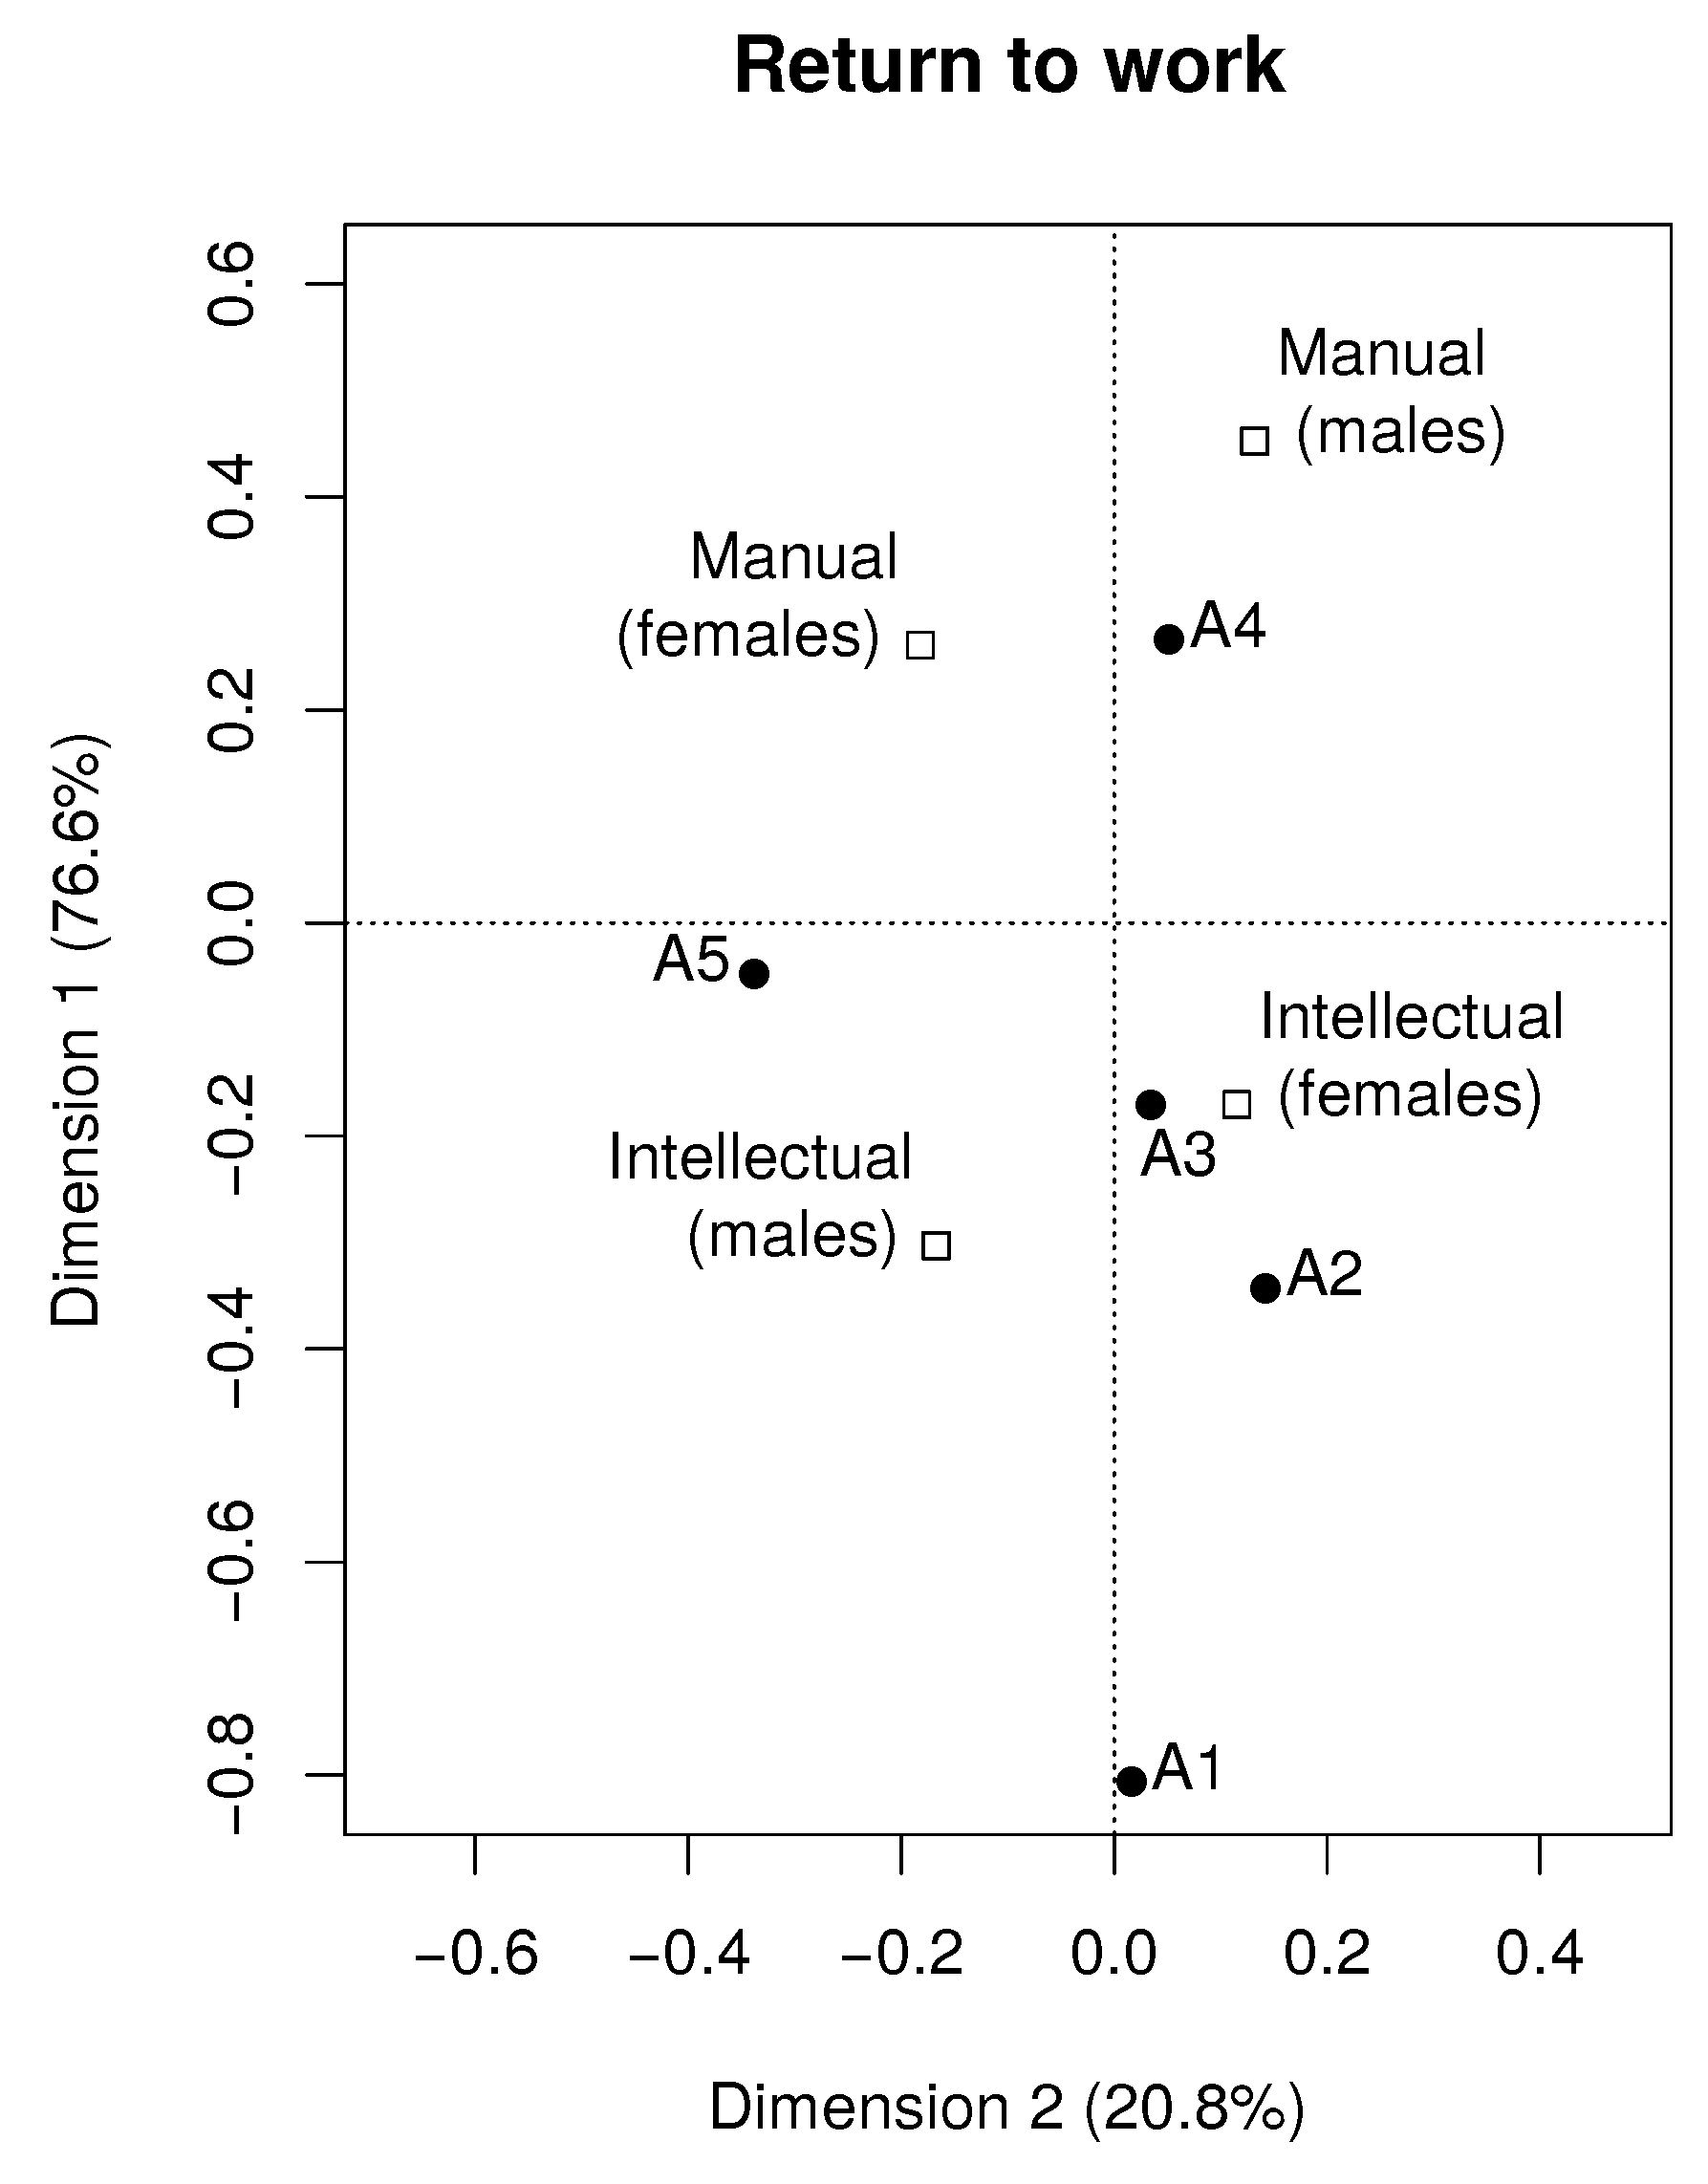
The summary is contained in the question about the return to the professional work (Appendix A, question No. 25R). The results are shown in Figure 4. The groups are split according to the kind of work—Manual labor and Intellectual labor (Appendix A, question No. 4ER)—and according to the gender. Finally, four subgroups are considered and denoted in the figure as Manual (females), Manual (males), Intellectual (females), and Intellectual (males). The answer A1 is “Yes, full-time”, and the answer A5 is “Absolutely not”. We observe the cluster
  • Manual (males)—A4.
The negative associations are as follows:
  • Manual (females)—A2,
  • Manual (males)—A1,
  • Intellectual (males)—A4.
The most frequent answer of Manual (males) is A4 “No”. The associations of Intellectual (females) with A3 and A2 are weak. None of the groups clusters with A1 “Yes, full-time”. Our analysis shows that in Poland in 2017, reaching the retirement threshold is rather a positive experience.
In line with social expectations, the retirement age was reduced to 60 for females and 65 for males in October 2017.
4. Conclusions

Summarizing, we described a non-standard approach to deriving information about objects met in the medical sciences based on an analysis of classification maps. We demonstrate that the graphical representation of the considered data (of the answers to some questions in the case of groups of individuals) is useful in health informatics, i.e., a lot of information is stored on one map. Searching for the so-called clusters of points, we can classify the objects. In this way, one can discover new properties of the considered objects. In the case of groups of individuals, we search for factors such as gender, marital status, kind of work, intellectual activity related to the attendance the University of the Third Age, economic situation, and determining the psychological attitudes of the considered population. For the creation of the classification maps, a statistical method, Correspondence Analysis, is used. New applications of the method are proposed: studies on expectations and worries related to the retirement threshold. Using standard methods, some considerable part of information may be lost. In particular, the commonly used Pearson’s coefficients measure the strength of the linear correlation between the variables. If the correlation is strong but nonlinear, for example, quadratic or exponential, then the standard methods, contrary to the CA, may show that there is no correlation or that the correlation is weak. Similar classification maps we are also going to apply in other medical informatics areas in forthcoming papers related to the studies on the quality of life and to bioinformatics.

Author Contributions

Conceptualization, A.B., D.B.-W., and P.W.; methodology, A.B., D.B.-W., and P.W.; software, P.W., formal analysis, D.B.-W.; data curation, A.B.; writing—original draft preparation, D.B.-W. and A.B.; visualization, P.W. All authors have read and agreed to the published version of the manuscript.

Funding

This research received no external funding.

Conflicts of Interest

The authors declare no conflicts of interest.

Appendix A

Appendix A.1. Questionnaire for an Employed or a Self-Employed Person

I. Personal information
1ER. Gender:
A1. MaleA2. Female
2ER. Age (years):
3ER. Education:
A1. Elementary schoolA2. Vocational educationA3. High schoolA4. University educationA5. Doctor’s degree
4ER. Kind of work:
A1. Manual laborA2. Intellectual labor
5ER. Business position:
A1. StaffA2. Supervisor/managerA3. Director/presidentA4. Business owner
6ER. In how many years do you plan to retire?
7ER. Marital status
A1. SingleA2. MarriedA3. SeparatedA4. DivorcedA5. Widowed
8ER. Are you chronically ill?
A1. YesA2. No
If yes, which disease you suffer from?
II. Questions about your current satisfaction level
9E. Are you satisfied with your job?
A1. Very dissatisfiedA2. DissatisfiedA3. Neither satisfied nor dissatisfiedA4. SatisfiedA5. Very satisfied
10E. Does your job make your life meaningful?
A1. Not at allA2. SlightlyA3. ModeratelyA4. Very muchA5. Essentially
11E. How do you rate the interpersonal relations in your work?
A1. Very badA2. BadA3. Neither bad nor goodA4. GoodA5. Very good
12E. Are you satisfied with your salary?
A1. Very dissatisfiedA2. DissatisfiedA3. Neither satisfied nor dissatisfiedA4. SatisfiedA5. Very satisfied
13E. Do you feel that you have enough energy to perform your work?
A1. Not at allA2. Slightly enoughA3. Moderately enoughA4. Nearly enoughA5. Quite enough
14E. Are you satisfied with your social life?
A1. Very dissatisfiedA2. DissatisfiedA3. Neither satisfied nor dissatisfiedA4. SatisfiedA5. Very satisfied
III. Retirement-related questions
15E. Are you happy that in several years/months you will retire?
A1. Very unhappyA2. UnhappyA3. Neither happy nor unhappyA4. HappyA5. Very happy
16E. Do you think that after the retirement you will have enough energy to implement your aims?
A1. Not at allA2. Slightly enoughA3. Moderately enoughA4. Nearly enoughA5. Quite enough
17E. Are you afraid that after the retirement you may not be self-sufficient?
A1. Yes, I am very much afraidA2. Yes, I am slightly afraidA3. I do not think of itA4. I am not afraidA5. I am not afraid at all
18E. Are you afraid that after the retirement you will feel lonely?
A1. Yes, I am very much afraidA2. Yes, I am slightly afraidA3. I do not know yetA4. I am not afraidA5. I am not afraid at all
19E. Do you expect to have enough retirement income to support yourself?
A1. Not at allA2. Slightly enoughA3. Moderately enoughA4. Nearly enoughA5. Quite enough
20E. Do you think that you will be satisfied having a lot of free time during retirement?
A1. Very dissatisfiedA2. DissatisfiedA3. Neither satisfied nor dissatisfiedA4. SatisfiedA5. Very satisfied
21E. Are you afraid of emptiness after the retirement, because you will not be so active as before?
A1. Yes, I am very much afraidA2. Yes, I am slightly afraidA3. I do not think of itA4. I am not afraidA5. I am not afraid at all
22E. Are you afraid that during the next several years your health is going to deteriorate?
A1. Yes, I am very much afraidA2. Yes, I am slightly afraidA3. I do not think of itA4. I am not afraidA5. I am not afraid at all

Appendix A.2. Questionnaire for a Retiree

I. Personal information
1ER, 2ER, 8ER (see Appendix A.1)
9R. Do you attend classes at the University of the Third Age?
A1. YesA2. No
II. Professional work-related questions
10R. Were you satisfied with your job?
A1. Very dissatisfiedA2. DissatisfiedA3. Neither satisfied nor dissatisfiedA4. SatisfiedA5. Very satisfied
11R. Did your job make your life meaningful?
A1. Not at allA2. SlightlyA3. ModeratelyA4. Very muchA5. Essentially
12R. How did you rate the interpersonal relations in your work?
A1. Very badA2. BadA3. Neither bad nor goodA4. GoodA5. Very good
13R. Were you satisfied with your salary?
A1. Very dissatisfiedA2. DissatisfiedA3. Neither satisfied nor dissatisfiedA4. SatisfiedA5. Very satisfied
III. Just before retirement-questions
14R. Did you have enough energy to perform your work?
A1. Not at allA2. Slightly enoughA3. Moderately enoughA4. Nearly enoughA5. Quite enough
15R. Were you happy that in several years/months you would retire?
A1. Very unhappyA2. UnhappyA3. Neither happy nor unhappyA4. HappyA5. Very happy
16R. Were you afraid that you would have not enough retirement income to support yourself?
A1. Yes, I was very much afraidA2. Yes, I was slightly afraidA3. I did not think of itA4. I was not afraidA5. I was not afraid at all
17R. Were you satisfied that after the retirement you would have a lot of free time?
A1. Very dissatisfiedA2. DissatisfiedA3. Neither satisfied nor dissatisfiedA4. SatisfiedA5. Very satisfied
18R. Were you afraid of emptiness after the retirement, because you would not be so active as before?
A1. Yes, I was very much afraidA2. Yes, I was slightly afraidA3. I did not think of itA4. I was not afraidA5. I was not afraid at all
IV. Questions about your current satisfaction level
19R. Do you think that after the retirement your health deteriorated?
A1. Yes, it did very muchA2. Yes, it did a littleA3. It is the sameA4. It is not worseA5. On the contrary, I feel better
20R. Do you have enough retirement income to support yourself?
A1. Not at allA2.Slightly enoughA3. Moderately enoughA4. Nearly enoughA5. Quite enough
21R. Are you afraid that due to your bad health you will not manage with your housework?
A1. Yes, I am very much afraidA2. Yes, I am slightly afraidA3. I do not think of itA4. I am not afraidA5. I am not afraid at all
22R. Do you feel lonely?
A1. Yes, very muchA2. Yes, a littleA3. Neither yes nor noA4. NoA5. Absolutely not
23R. Are you satisfied with your social life?
A1. Very dissatisfiedA2. DissatisfiedA3. Neither satisfied nor dissatisfiedA4. SatisfiedA5. Very satisfied
24R. Are you satisfied with relations with your children and grandchildren (emotional relations, frequency of visits)?
A1. Very dissatisfiedA2. DissatisfiedA3. Neither satisfied nor dissatisfiedA4. SatisfiedA5. Very satisfied
25R. Would you like to return to your professional work?
A1. Yes, full-timeA2. Yes, part-timeA3. I do not think of itA4. NoA5. Absolutely not

References

  1. Bielińska-Wa̧ż, D. Graphical and numerical representations of DNA sequences: Statistical aspects of similarity. J. Math. Chem. 2011, 49, 2345–2407. [Google Scholar] [CrossRef] [Green Version]
  2. Randić, M.; Novič, M.; Plavšić, D. Milestones in graphical bioinformatics. Int. J. Quant. Chem. 2013, 113, 2413–2446. [Google Scholar] [CrossRef]
  3. Bielińska-Wa̧ż, D.; Wa̧ż, P.; Basak, S.C. Similarity studies using statistical and genetical methods. J. Math. Chem. 2007, 42, 1003–1013. [Google Scholar] [CrossRef]
  4. Bielińska-Wa̧ż, D.; Wa̧ż, P. Correlations in Spectral Statistics. J. Math. Chem. 2008, 43, 1287–1300. [Google Scholar] [CrossRef]
  5. Bielińska-Wa̧ż, D.; Wa̧ż, P.; Jagiełło, K.; Puzyn, T. Spectral Density Distribution Moments as Novel Descriptors for QSAR/QSPR. Struct. Chem. 2014, 25, 29–35. [Google Scholar] [CrossRef] [Green Version]
  6. Wa̧ż, P.; Bielińska-Wa̧ż, D. Asymmetry Coefficients as Indicators of Chaos. Acta Phys. Pol. A 2009, 116, 987–991. [Google Scholar] [CrossRef]
  7. Wa̧ż, P.; Bielińska-Wa̧ż, D.; Pleskacz, A.; Strobel, A. Identification of Stellar Spectra Using Methods of Statistical Spectroscopy. Acta Phys. Polon. B 2008, 39, 1993–2001. [Google Scholar]
  8. Wa̧ż, P.; Bielińska-Wa̧ż, D.; Strobel, A.; Pleskacz, A. Statistical indicators of astrophysical parameters. Acta Astronom. 2010, 60, 283–293. [Google Scholar]
  9. Wa̧ż, P.; Bielińska-Wa̧ż, D. Moments of Inertia of Spectra and Distribution Moments as Molecular Descriptors. MATCH Commun. Math. Comput. Chem. 2013, 70, 851–865. [Google Scholar]
  10. Wa̧ż, P.; Bielińska-Wa̧ż, D.; Nandy, A. Descriptors of 2D-dynamic graphs as a classification tool of DNA sequences. J. Math. Chem. 2014, 52, 132–140. [Google Scholar] [CrossRef] [Green Version]
  11. Beh, E.J.; Lombardo, R. Correspondence Analysis: Theory, Practice and New Strategies; John Wiley & Sons: Oxford, UK, 2014. [Google Scholar]
  12. Ziemer, K.S.; Pires, B.; Lancaster, V.; Keller, S.; Orr, M.; Shipp, S. A New Lens on High School Dropout: Use of Correspondence Analysis and the Statewide Longitudinal Data System. Am. Stat. 2018, 72, 191–198. [Google Scholar] [CrossRef]
  13. Beh, E.J.; Lombardo, R.; Alberti, G. Correspondence analysis and the Freeman-Tukey statistic: A study of archaeological data. Comput. Stat. Data Anal. 2018, 128, 73–86. [Google Scholar] [CrossRef]
  14. Frost, S.C.; Blackman, J.W.; Ebeler, S.E.; Heymann, H. Analysis of temporal dominance of sensation data using correspondence analysis on Merlot wine with differing maceration and cap management regimes. Food Qual. Prefer. 2018, 64, 245–252. [Google Scholar] [CrossRef]
  15. Parnowski, T. Medyczne i psychologiczne problemy wieku podeszłego. Probl. Rodz. 1996, 5, 41–50. (In Polish) [Google Scholar]
  16. Skarborn, M.; Nicki, R. Worry in pre- and post-retirement persons. Int. J. Aging Hum. Dev. 2000, 50, 61–71. [Google Scholar] [CrossRef]
  17. Hershey, D.A.; Henkens, K.; van Dalen, H.P. What drives retirement income worries in Europe? A multilevel analysis. Eur. J. Ageing 2010, 7, 301–311. [Google Scholar] [CrossRef] [Green Version]
  18. Gutierrez, H.C.; Hershey, D.A. Impact of Retirement Worry on Information Processing. J. Neurosci. Psychol. Econ. 2013, 6, 264–277. [Google Scholar] [CrossRef] [Green Version]
  19. Kail, B. The Mental and Physical Health Consequences of Changes in Private Insurance Before and After Early Retirement. J. Gerontol. B Psychol. Sci. Soc. Sci. 2016, 71, 358–368. [Google Scholar] [CrossRef] [Green Version]
  20. Hagen, E.W.; Barnet, J.H.; Hale, L.; Peppard, P.E. Changes in Sleep Duration and Sleep Timing Associated with Retirement Transitions. Sleep 2016, 39, 665–673. [Google Scholar] [CrossRef] [Green Version]
  21. Myllyntausta, S.; Salo, P.; Kronholm, E.; Aalto, V.; Kivimaki, M.; Vahtera, J.; Stenholm, S. Changes in Sleep Duration During Transition to Statutory Retirement: A Longitudinal Cohort Study. Sleep 2017, 40. [Google Scholar] [CrossRef] [Green Version]
  22. Regan, K.; Intzandt, B.; Swatridge, K.; Myers, A.; Roy, E.; Middleton, L.E. Changes in Physical Activity and Function with Transition to Retirement Living: A Pilot Study. Can. J. Aging 2016, 35, 526–532. [Google Scholar] [CrossRef] [PubMed]
  23. Van Dyck, D.; Cardon, G.; De Bourdeaudhuij, I. Longitudinal changes in physical activity and sedentary time in adults around retirement age: What is the moderating role of retirement status, gender and educational level? BMC Public Health 2016, 16, 1125. [Google Scholar] [CrossRef] [PubMed] [Green Version]
  24. Manty, M.; Kouvonen, A.; Lallukka, T.; Lahti, J.; Lahelma, E.; Rahkonen, O. Pre-retirement physical working conditions and changes in physical health functioning during retirement transition process. Scand. J. Work Environ. Health 2016, 42, 405–412. [Google Scholar] [CrossRef] [PubMed] [Green Version]
  25. Stenholm, S.; Pulakka, A.; Kawachi, I.; Oksanen, T.; Halonen, J.I.; Aalto, V.; Kivimaki, M.; Vahtera, J. Changes in physical activity during transition to retirement: A cohort study. Int. J. Behav. Nutr. Phys. Act. 2016, 13, 51. [Google Scholar] [CrossRef] [Green Version]
  26. Holstila, A.; Manty, M.; Rahkonen, O.; Lahelma, E.; Lahti, J. Statutory retirement and changes in self-reported leisure-time physical activity: A follow-up study with three time-points. BMC Public Health 2017, 17, 528. [Google Scholar] [CrossRef] [Green Version]
  27. Gueorguieva, R.; Sindelar, J.L.; Wu, R.; Gallo, W.T. Differential changes in body mass index after retirement by occupation: Hierarchical models. Int. J. Public Health 2011, 56, 111–116. [Google Scholar] [CrossRef] [Green Version]
  28. Stenholm, S.; Solovieva, S.; Viikari-Juntura, E.; Aalto, V.; Kivimaki, M.; Vahtera, J. Change in body mass index during transition to statutory retirement: An occupational cohort study. Int. J. Behav. Nutr. Phys. Act. 2007, 14, 85. [Google Scholar] [CrossRef]
  29. Barrett, G.F.; Kecmanovic, M. Changes in subjective well-being with retirement: Assessing savings adequacy. Appl. Econ. 2013, 45, 4883–4893. [Google Scholar] [CrossRef]
  30. Maher, C.A.; Burton, N.W.; van Uffelen, J.G.Z.; Brown, W.J.; Sprod, J.A.; Olds, T.S. Changes in use of time, activity patterns, and health and wellbeing across retirement: Design and methods of the life after work study. BMC Public Health 2013, 13, 952. [Google Scholar] [CrossRef] [Green Version]
  31. Vercambre, M.N.; Okereke, O.I.; Kawachi, I.; Grodstein, F.; Kang, J.H. Self-Reported Change in Quality of Life with Retirement and Later Cognitive Decline: Prospective Data from the Nurses’ Health Study. J. Alzheimers Dis. 2016, 52, 887–897. [Google Scholar] [CrossRef] [Green Version]
  32. Olds, T.S.; Sprod, J.; Ferrar, K.; Burton, N.; Brown, W.; van Uffelen, J.; Maher, C. Everybody’s working for the weekend: Changes in enjoyment of everyday activities across the retirement threshold. Age Ageing 2016, 45, 850–855. [Google Scholar] [CrossRef] [Green Version]
  33. Berg, J. Mobility changes during the first years of retirement. Qual. Ageing Older Adults 2016, 17, 131–140. [Google Scholar] [CrossRef]
  34. Cho, H.; Suh, W.; Lee, J.; Jang, Y.; Kim, M. A worry-free retirement in Korea: Effectiveness of retirement coaching education. Educ. Gerontol. 2016, 42, 785–794. [Google Scholar] [CrossRef]
  35. Jun, S.K.; Evans, K. The learning cultures of Third Age participants: Institutional management and participants’ experience in U3A in the UK and SU in Korea. KEDI J. Educ. Policy 2007, 4, 53–72. [Google Scholar]
  36. Hebestreit, L. The role of the University of the Third Age in meeting needs of adult learners in Victoria, Australia. Aust. J. Adult Learn. 2008, 48, 547–565. [Google Scholar]
  37. Sonati, J.G.; Modeneze, D.M.; Vilarta, R.; Maciel, É.S.; Boccaletto, E.M.A.; da Silva, C.C. Body composition and quality of life (QoL) of the elderly offered by the “University Third Age” (UTA) in Brazil. Arch. Gerontol. Geriatr. 2011, 52, e31–e35. [Google Scholar] [CrossRef]
  38. Mackowicz, J.; Wnek-Gozdek, J. “It’s never too late to learn”—How does the Polish U3A change the quality of life for seniors? Educ. Gerontol. 2016, 42, 186–197. [Google Scholar] [CrossRef]
  39. Nascimento, M.D.; Giannouli, E. Active aging through the University of the Third Age: The Brazilian model. Educ. Gerontol. 2019, 45, 11–21. [Google Scholar] [CrossRef]
  40. Bielińska, A.; Majkowicz, M.; Wa̧ż, P.; Bielińska-Wa̧ż, D. Overall Quality of Life and General Health—Changes Related to the Retirement Threshold. In Proceedings of the eTELEMED 2018, The Tenth International Conference on eHealth, Telemedicine, and Social Medicine, Rome, Italy, 25–29 March 2018; XPS IARIA Press: Copenhagen, Denmark, 2018; pp. 1–5. [Google Scholar]
  41. Bielińska, A.; Majkowicz, M.; Bielińska-Wa̧ż, D.; Wa̧ż, P. Influence of the Education Level on Health of Elderly People. In Proceedings of the eTELEMED 2018, The Tenth International Conference on eHealth, Telemedicine, and Social Medicine, Rome, Italy, 25–29 March 2018; XPS IARIA Press: Copenhagen, Denmark, 2018; pp. 6–11. [Google Scholar]
  42. Bielińska, A.; Majkowicz, M.; Bielińska-Wa̧ż, D.; Wa̧ż, P. Classification Studies in Various Areas of Science. In Numerical Methods and Applications; NMA 2018, Lecture Notes in Computer Science; Nikolov, G., Kolkovska, N., Georgiev, K., Eds.; Springer: Cham, Switzerland, 2019; Volume 11189, pp. 326–333. [Google Scholar]
  43. Bielińska, A.; Majkowicz, M.; Wa̧ż, P.; Bielińska-Wa̧ż, D. Mathematical Modeling: Interdisciplinary Similarity Studies. In Numerical Methods and Applications; NMA 2018, Lecture Notes in Computer Science; Nikolov, G., Kolkovska, N., Georgiev, K., Eds.; Springer: Cham, Switzerland, 2019; Volume 11189, pp. 334–341. [Google Scholar]
  44. Bielińska, A.; Majkowicz, M.; Bielińska-Wa̧ż, D.; Wa̧ż, P. A New Method in Bioinformatics—Interdisciplinary Similarity Studies. AIP Conf. Proc. 2019, 2116, 450013. [Google Scholar]
  45. Bielińska, A.; Majkowicz, M.; Wa̧ż, P.; Bielińska-Wa̧ż, D. A New Computational Method: Interdisciplinary Classification Analysis. AIP Conf. Proc. 2019, 2116, 450014. [Google Scholar]
  46. Jaracz, K.; Kalfoss, M.; Ba̧czyk, G. Quality of life in Polish respondents: Psychometric properties of the Polish WHOQOL—Bref. Scand. J. Caring Sci. 2006, 20, 251–260. [Google Scholar] [CrossRef] [PubMed]
  47. Tsutsumi, A.; Izutsu, T.; Kato, S.; Islam, A.; Yamada, H.S.; Kato, H.; Wakai, S. Reliability and validity of the Bangla version of WHOQOL-BREF in an adult population in Dhaka, Bangladesh. Psychiatry Clin. Neurosci. 2006, 60, 493–498. [Google Scholar] [CrossRef] [PubMed]
  48. Benitez-Borrego, S.; Guardia-Olmos, J.; Urzua-Morales, A. Factorial structural analysis of the Spanish version of WHOQOL-BREF: An exploratory structural equation model study. Qual. Life Res. 2014, 23, 2205–2212. [Google Scholar] [CrossRef] [PubMed]
  49. Siljander, E.; Luoma, M.L.; Merilainen-Porras, S. Validity and reliability of Finnish version of WHOQOL-Bref on adult population in Finland. IJHD 2015, 2, 52–68. [Google Scholar] [CrossRef]
  50. R Core Team. R: A Language and Environment for Statistical Computing; R Foundation for Statistical Computing: Vienna, Austria, 2018. [Google Scholar]
  51. Kim, J.E.; Moen, P. Is Retirement Good or Bad for Subjective Well-Being? Curr. Dir. Psychol. Sci. 2001, 10, 83–86. [Google Scholar] [CrossRef]
  52. Bożewicz, M. Kobiety i Mȩżczyźni w Domu. CBOS, Komunikat z Badań 2018, 127. Available online: https://www.cbos.pl/SPISKOM.POL/2018/K_127_18.PDF (accessed on 1 December 2019). (In Polish).
Figure 1. Classification maps (questions No. 21E and 18R).
Applsci 10 01282 g001
Figure 2. Classification maps (questions No. 15E and 15R).
Applsci 10 01282 g002
Figure 3. Classification maps (questions No. 19E and 20R).
Applsci 10 01282 g003
Figure 4. Classification map (question No. 25R).
Applsci 10 01282 g004