A Robust Real-Time Automatic Recognition Prototype for Maritime Optical Morse-Based Communication Employing Modified Clustering Algorithm


Abstract
1. Introduction
2. Principle
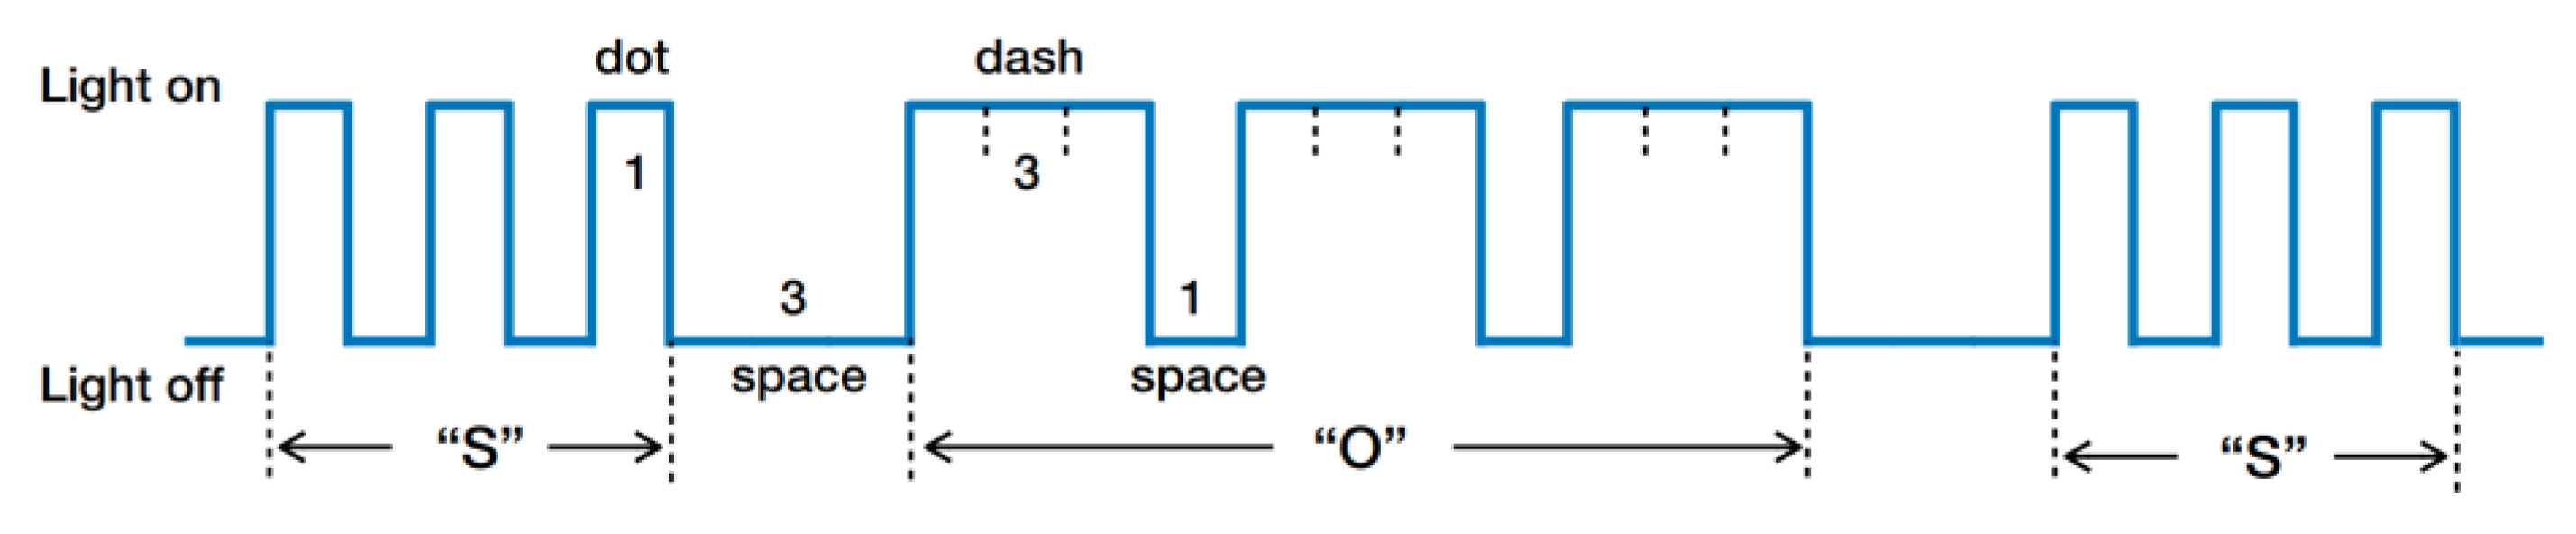
2.1. Optical Morse Signal Characterization
2.2. Modified K-Means Clustering Algorithm
- Cluster Centroid Initialization: The digital filter will cause an amplitude level hopping effect in the head and tail of the passing signal, leading to significant deviation. Thus, this part of the signal is designed to be abandoned in this case while selecting the cluster centroid during the iteration.
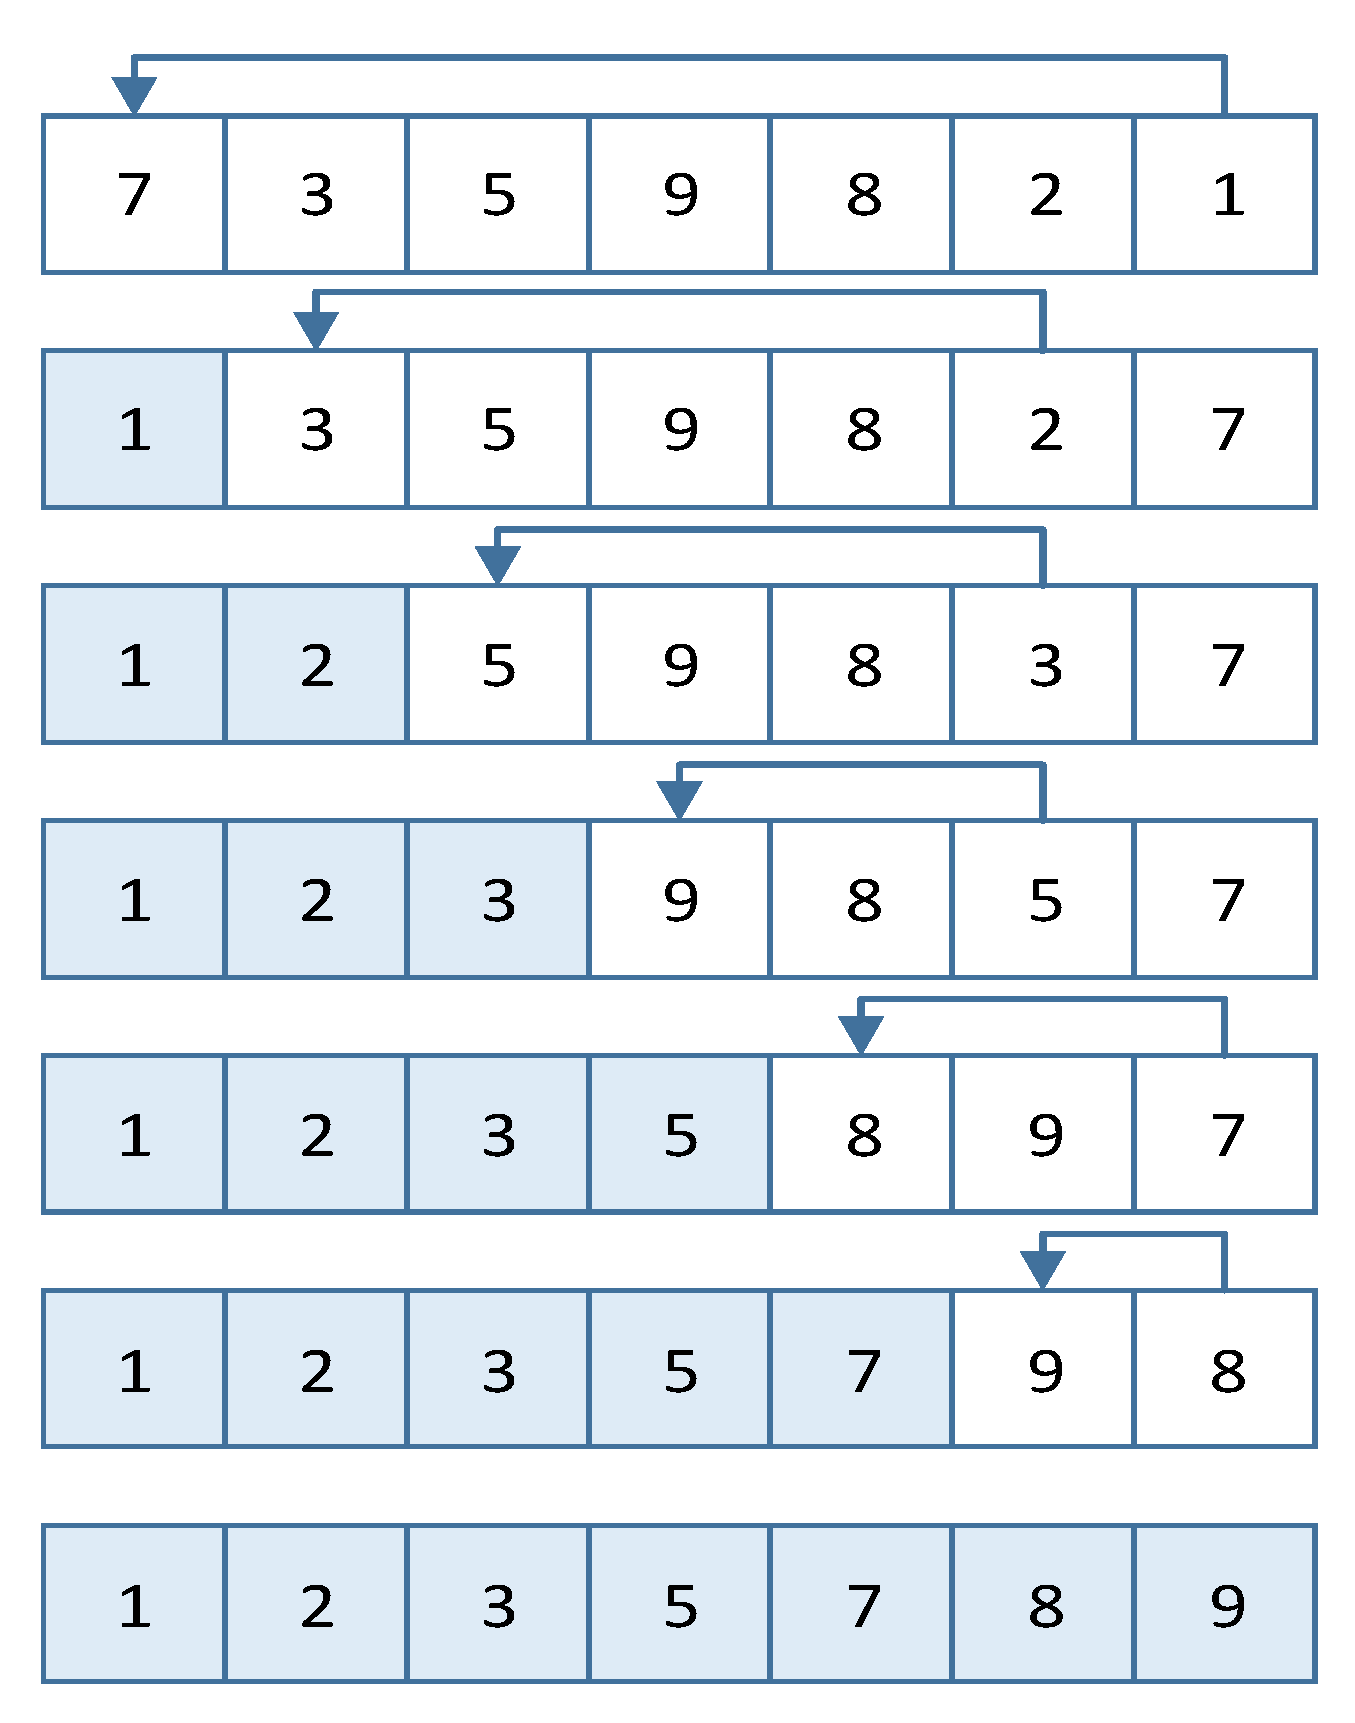
- Selection Sort-Assisted (Figure 4): It can be easily known that the obtained k cluster centroids are in an unordered state. As the purpose of cluster analysis is to distinguish the signals with different durations in the Morse decoding, it is necessary to sort the final k centroids so that the device can effectively identify different clusters. Considering the small quantity of centroids and easy implementation in this case, we exploit the widely used selection sort algorithm to rearrange the centroids in a certain order [28].
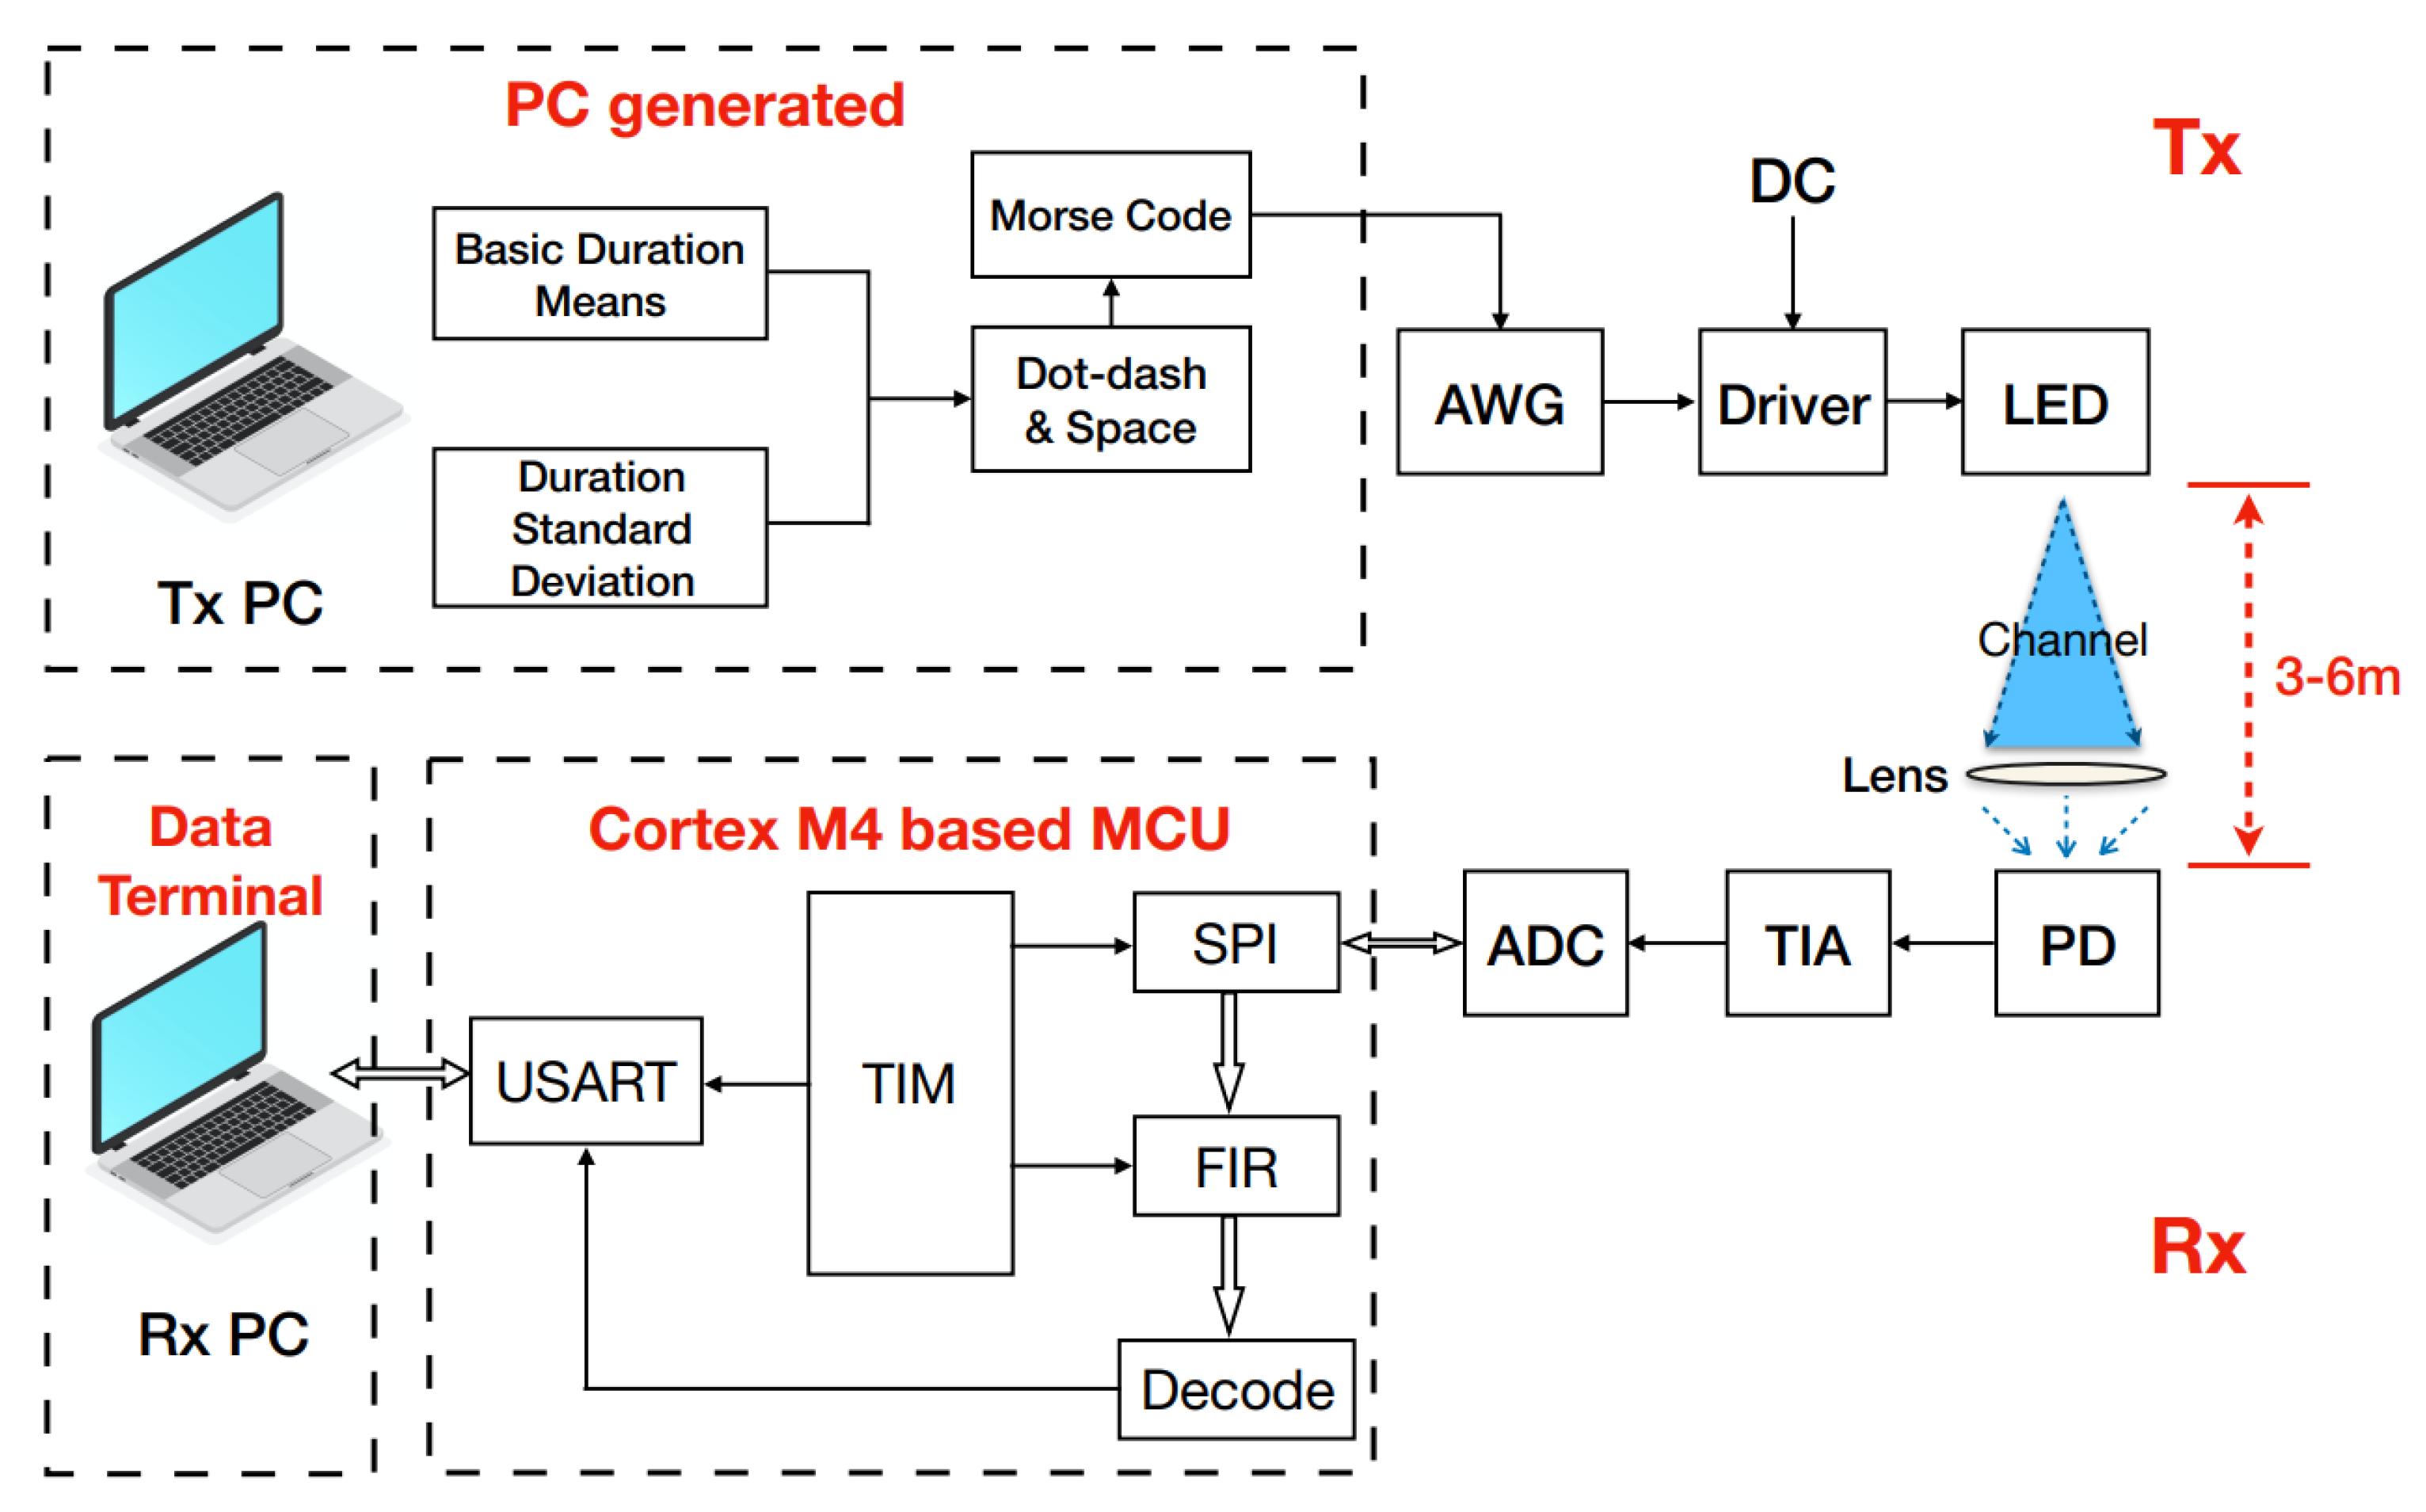
3. System Overview
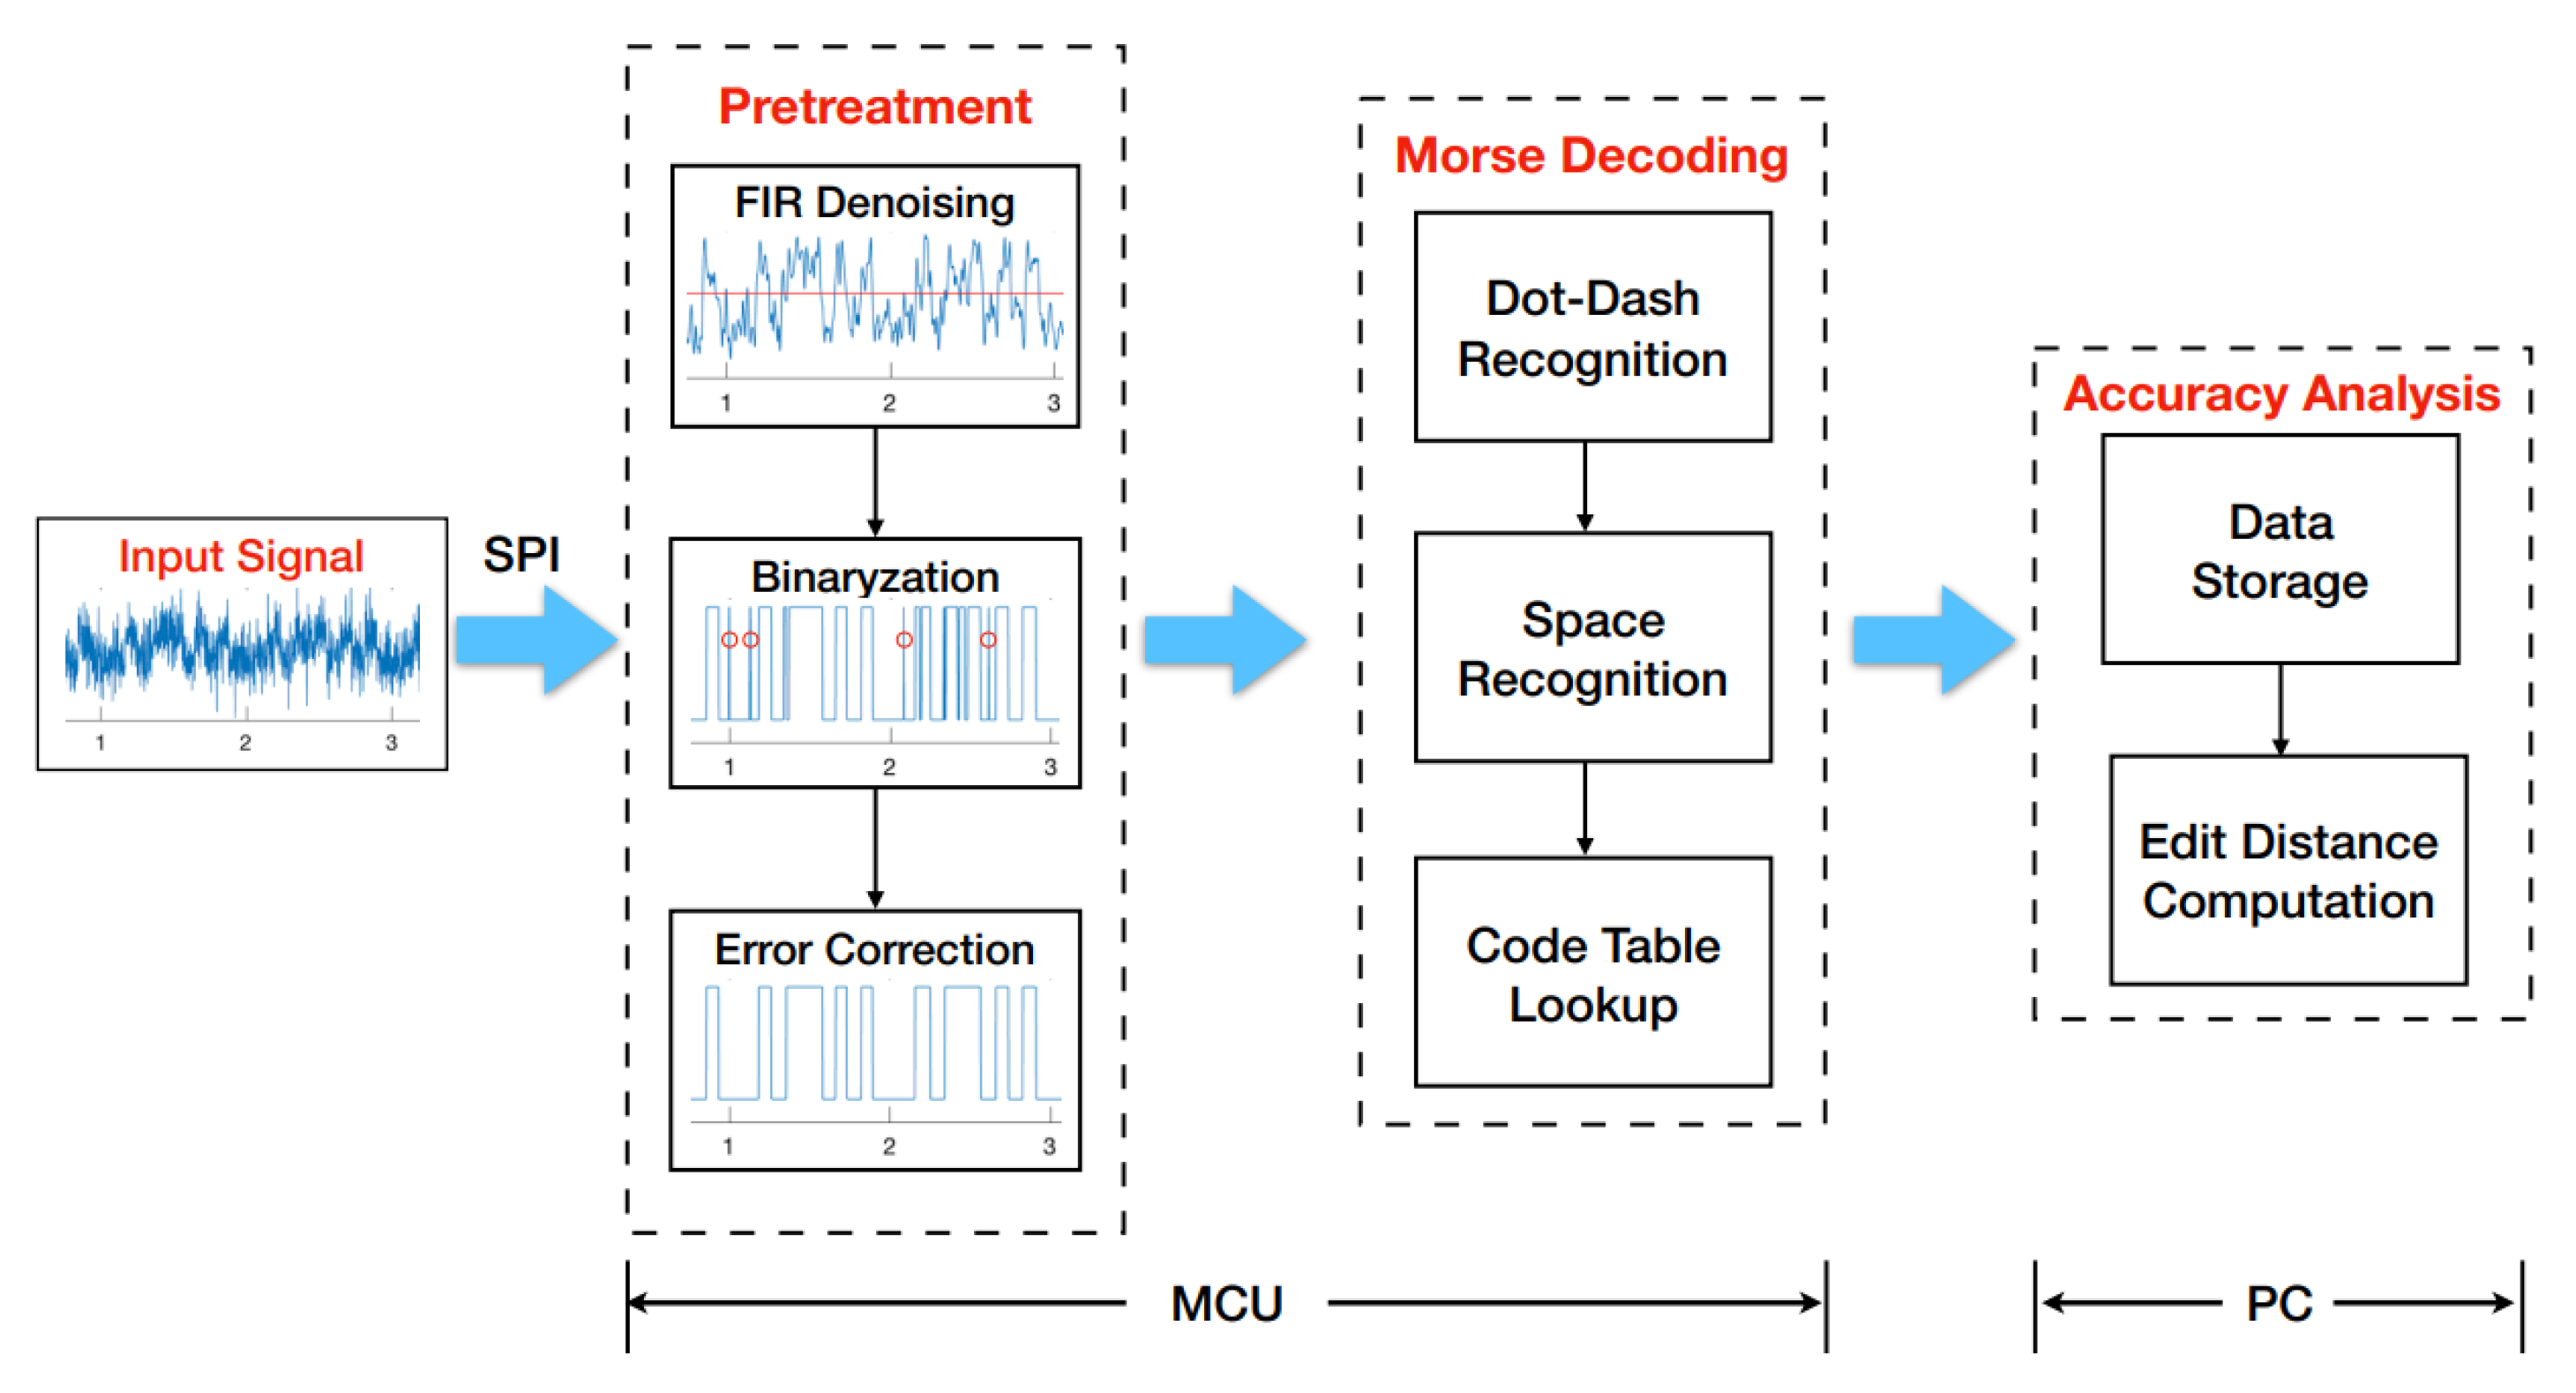
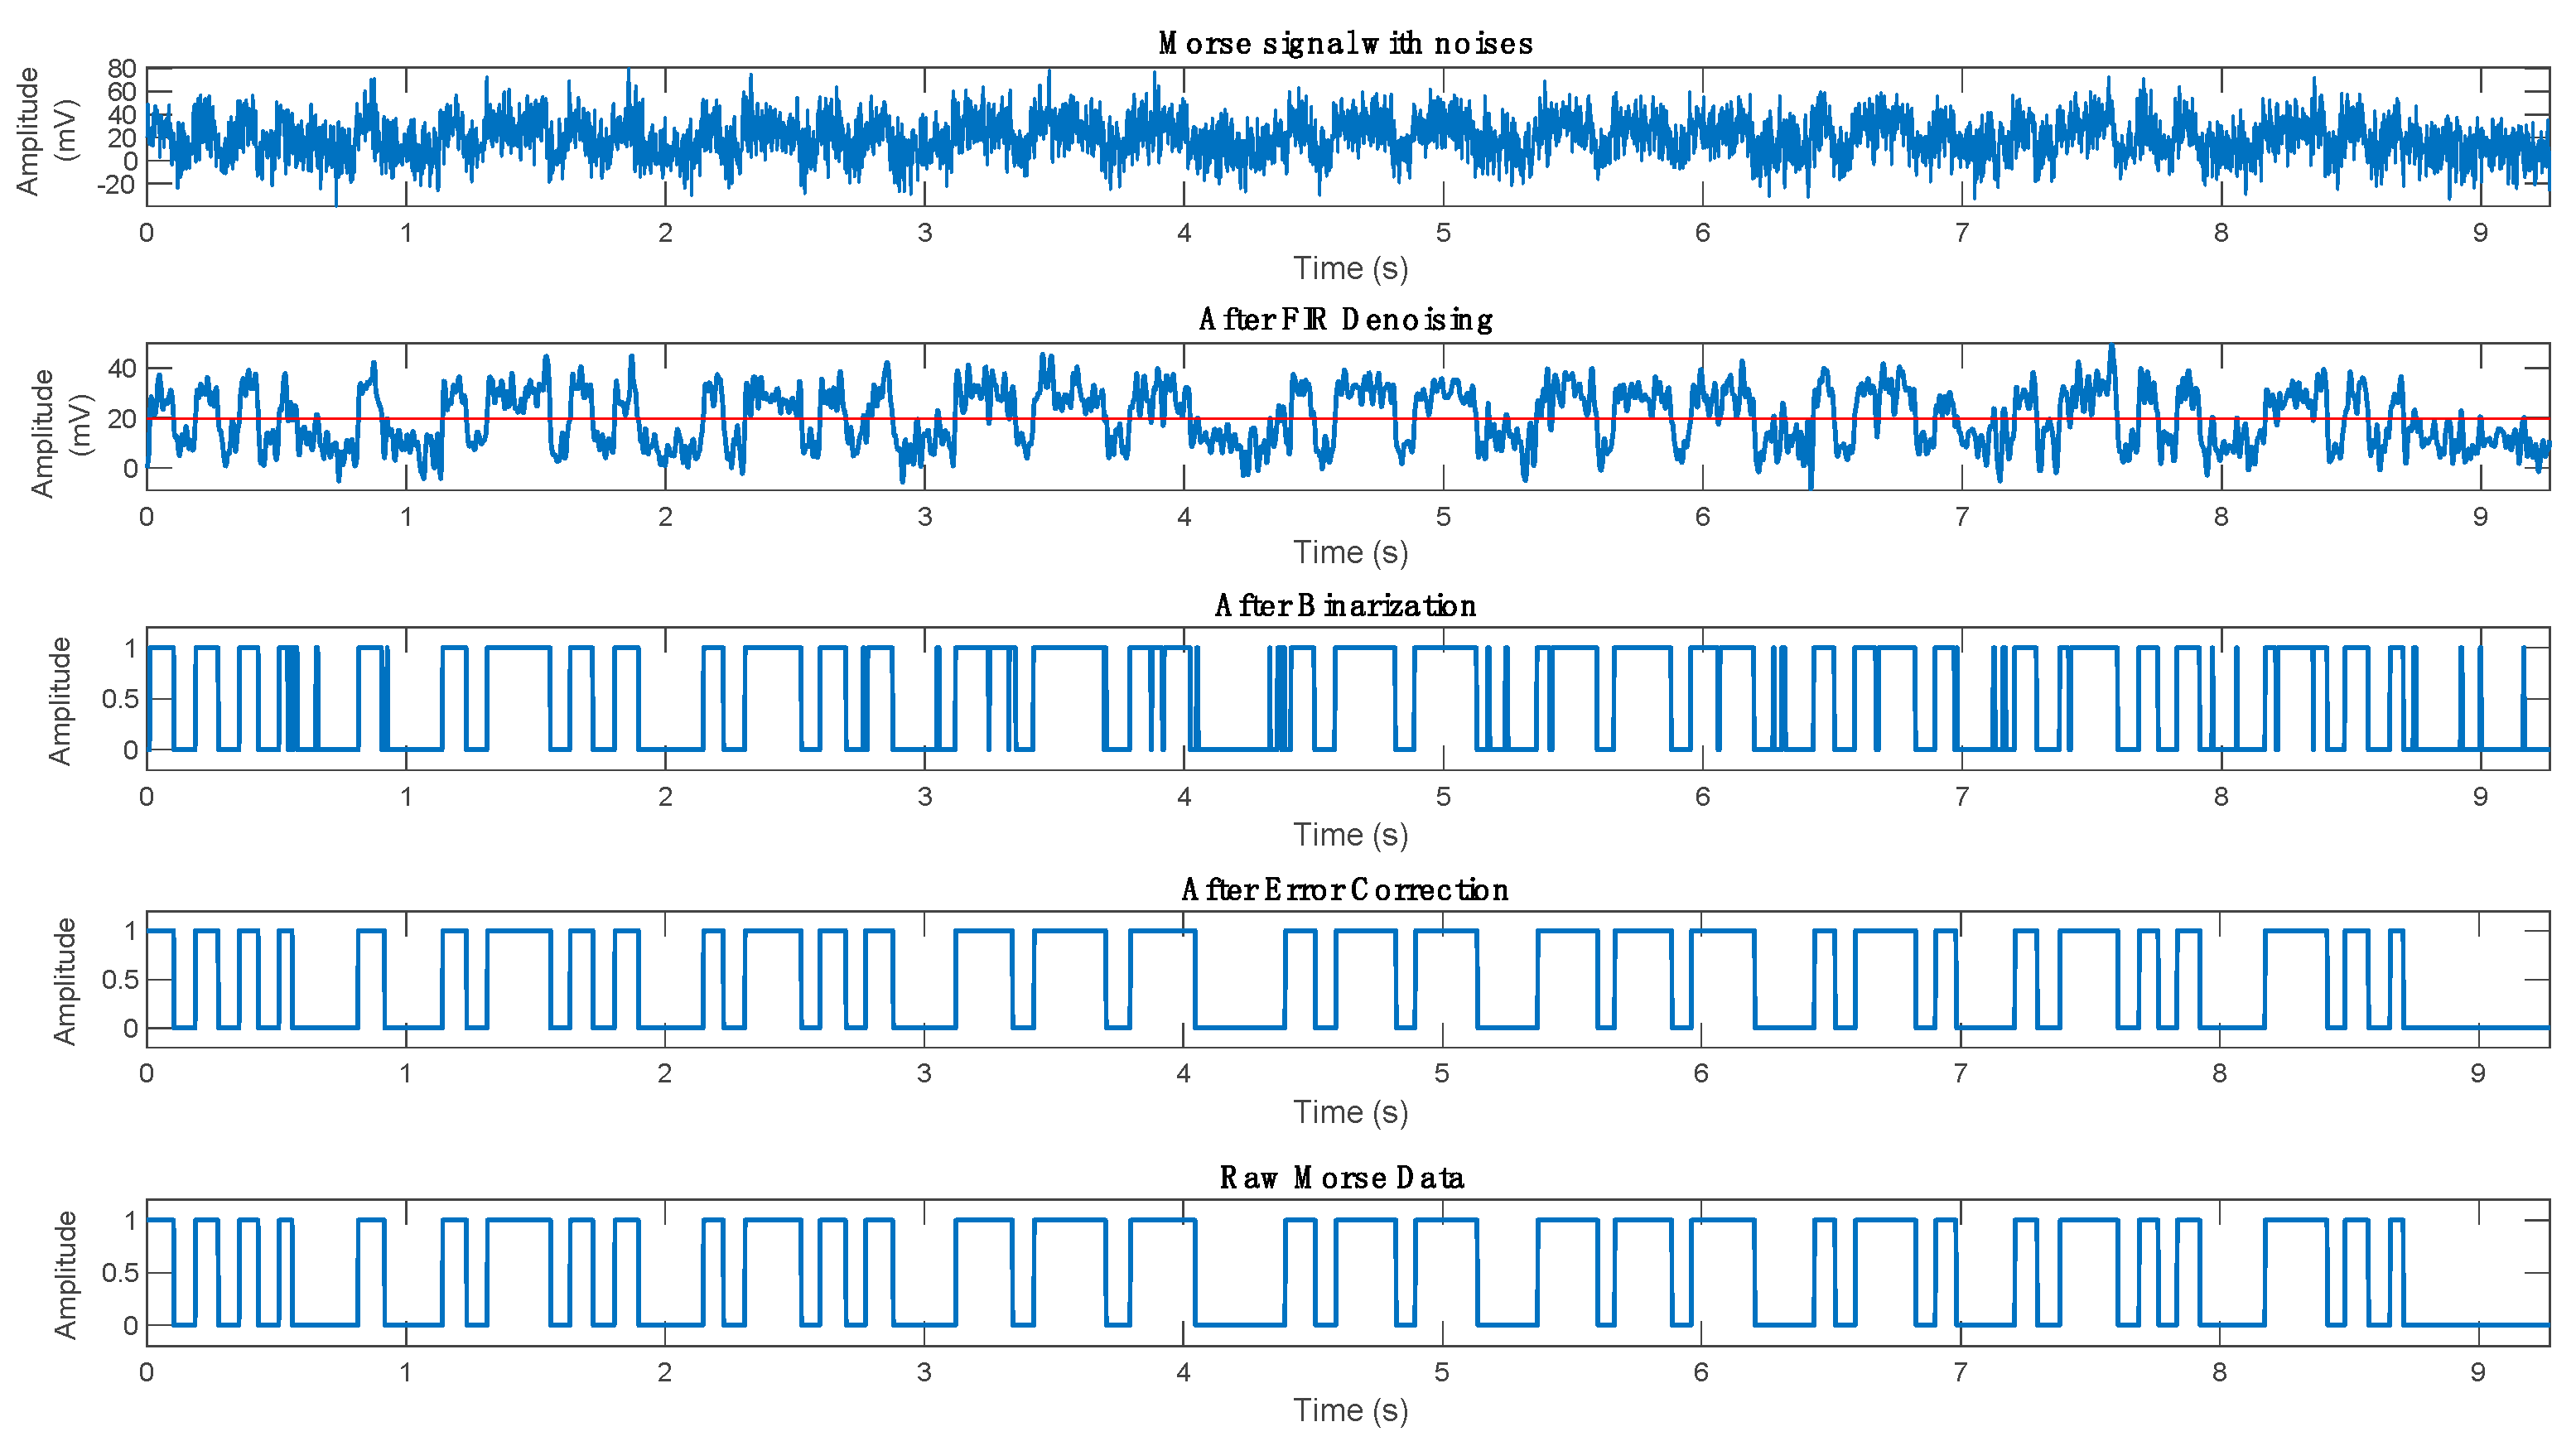
4. Signal Pretreatment
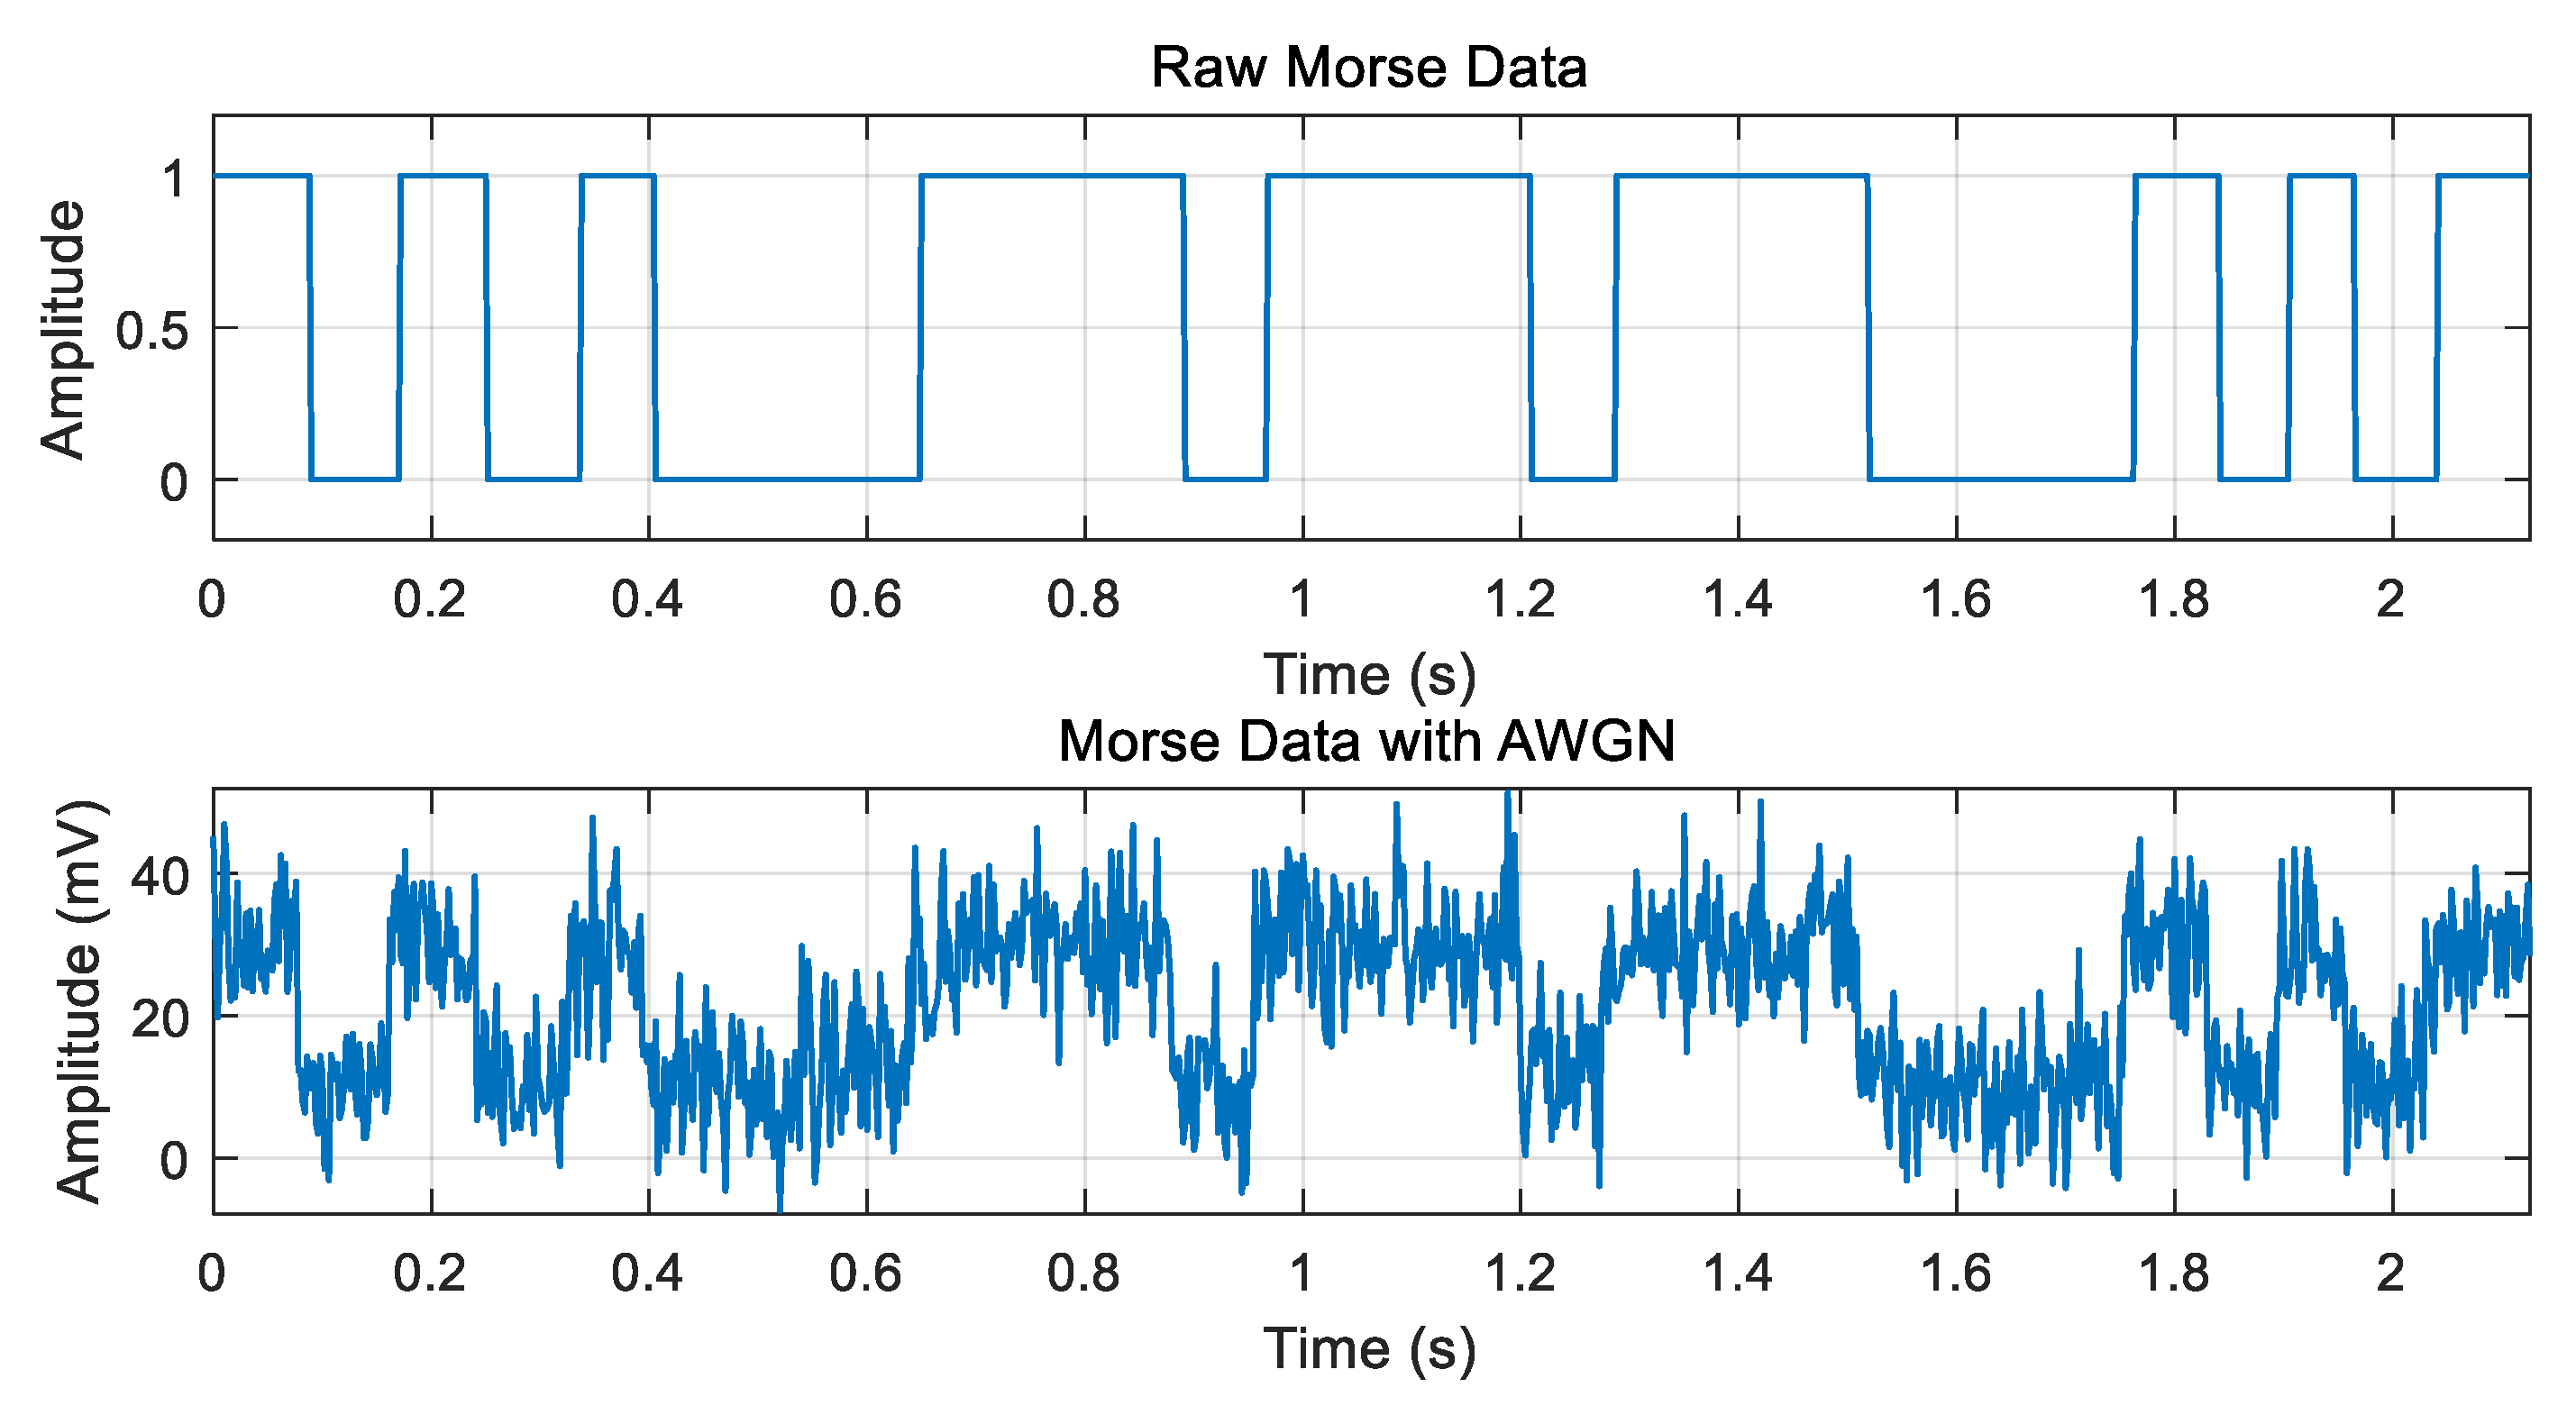
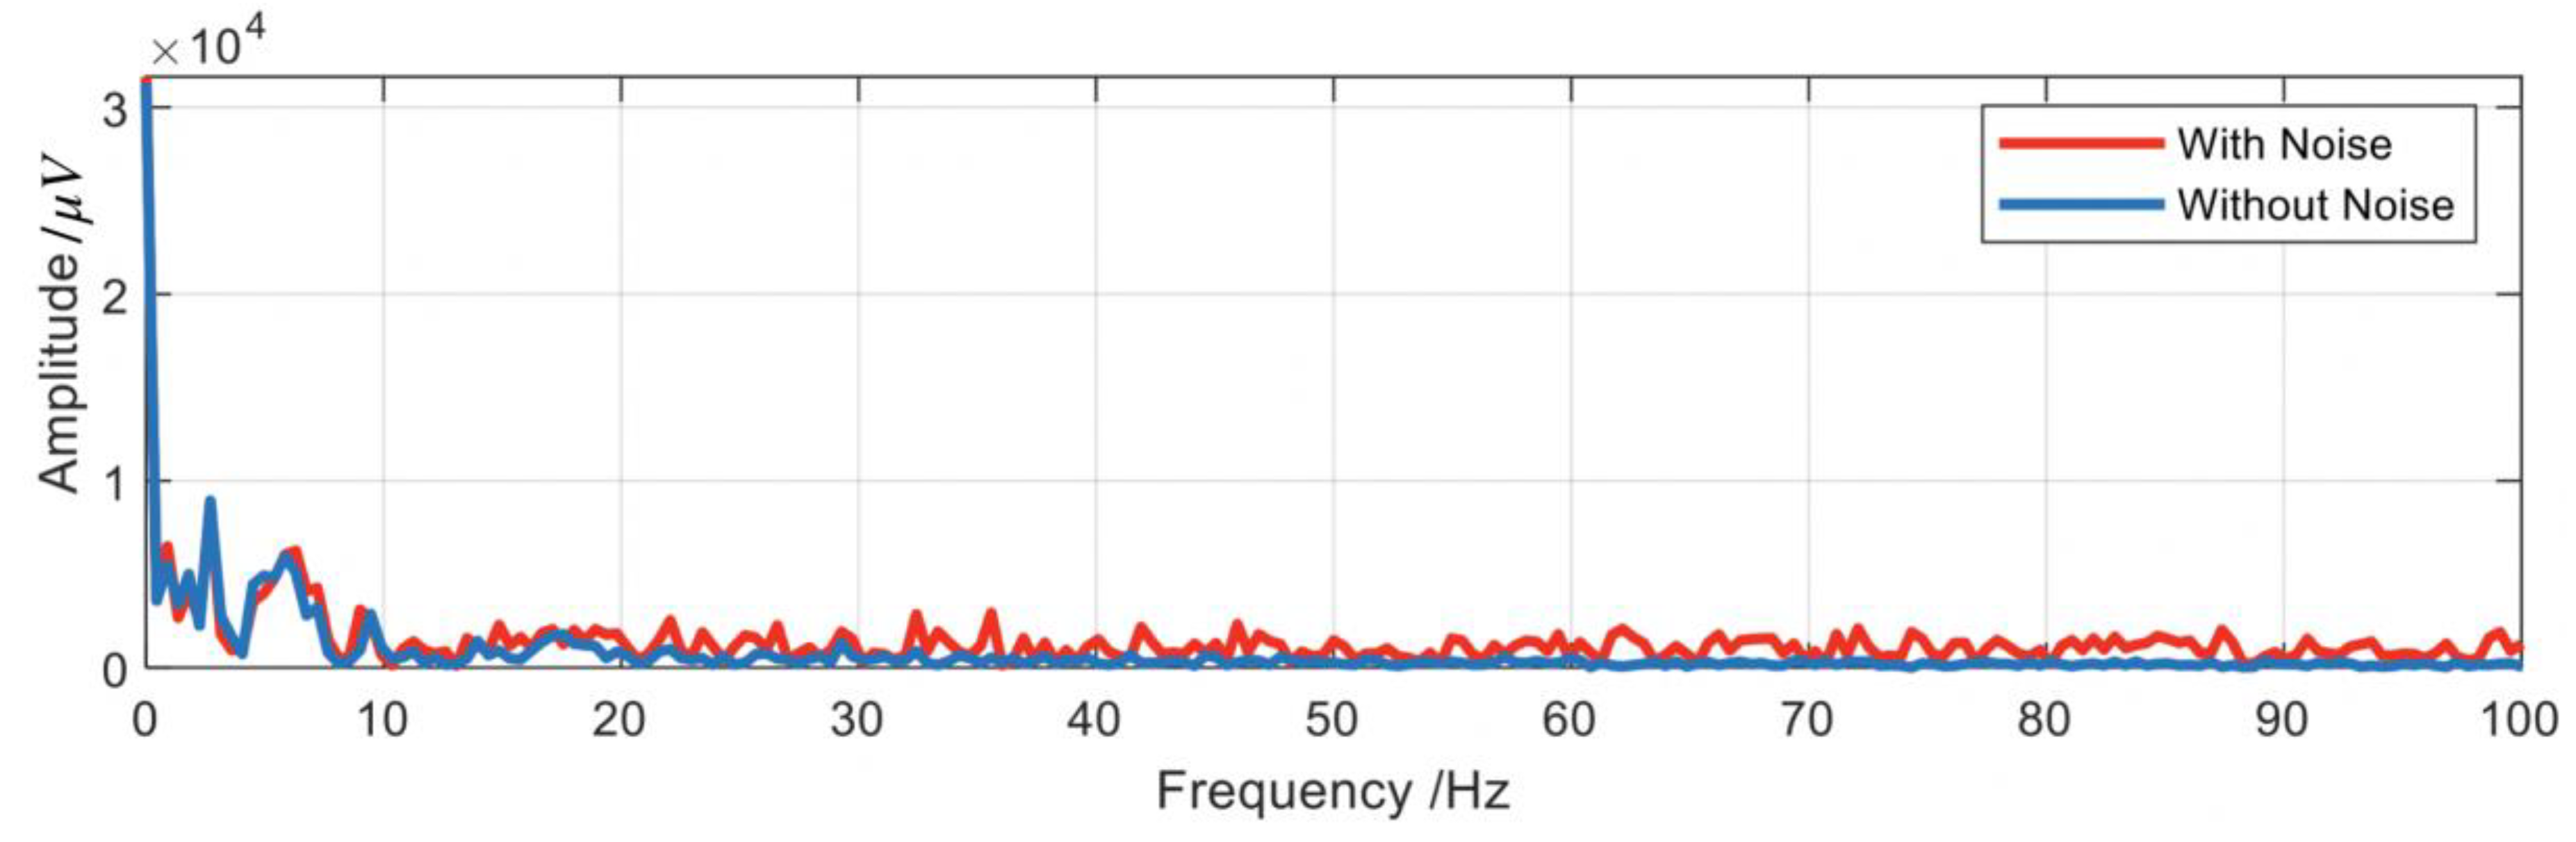
4.1. Digital Filter Denoising
4.2. Binarization
- Initialize a similarity value s, to quantify how similar two clusters are to one another;
- Perform the mk-means algorithm to classify all the voltage data samples into two sets with the cluster centroids of CV1 and CV2;
- Calculate the distance between two centroids by d = abs (CV2 − CV1). If d < s, it means that two clusters are similar. At this time, all sampling values are divided into high or low level. Then, set VT = 0; otherwise, set VT = (CV2 + CV1)/2;
- Iterate over all data samples; a value above the obtained threshold in step (3) indicates “1;” meanwhile, a value below indicates “0.”
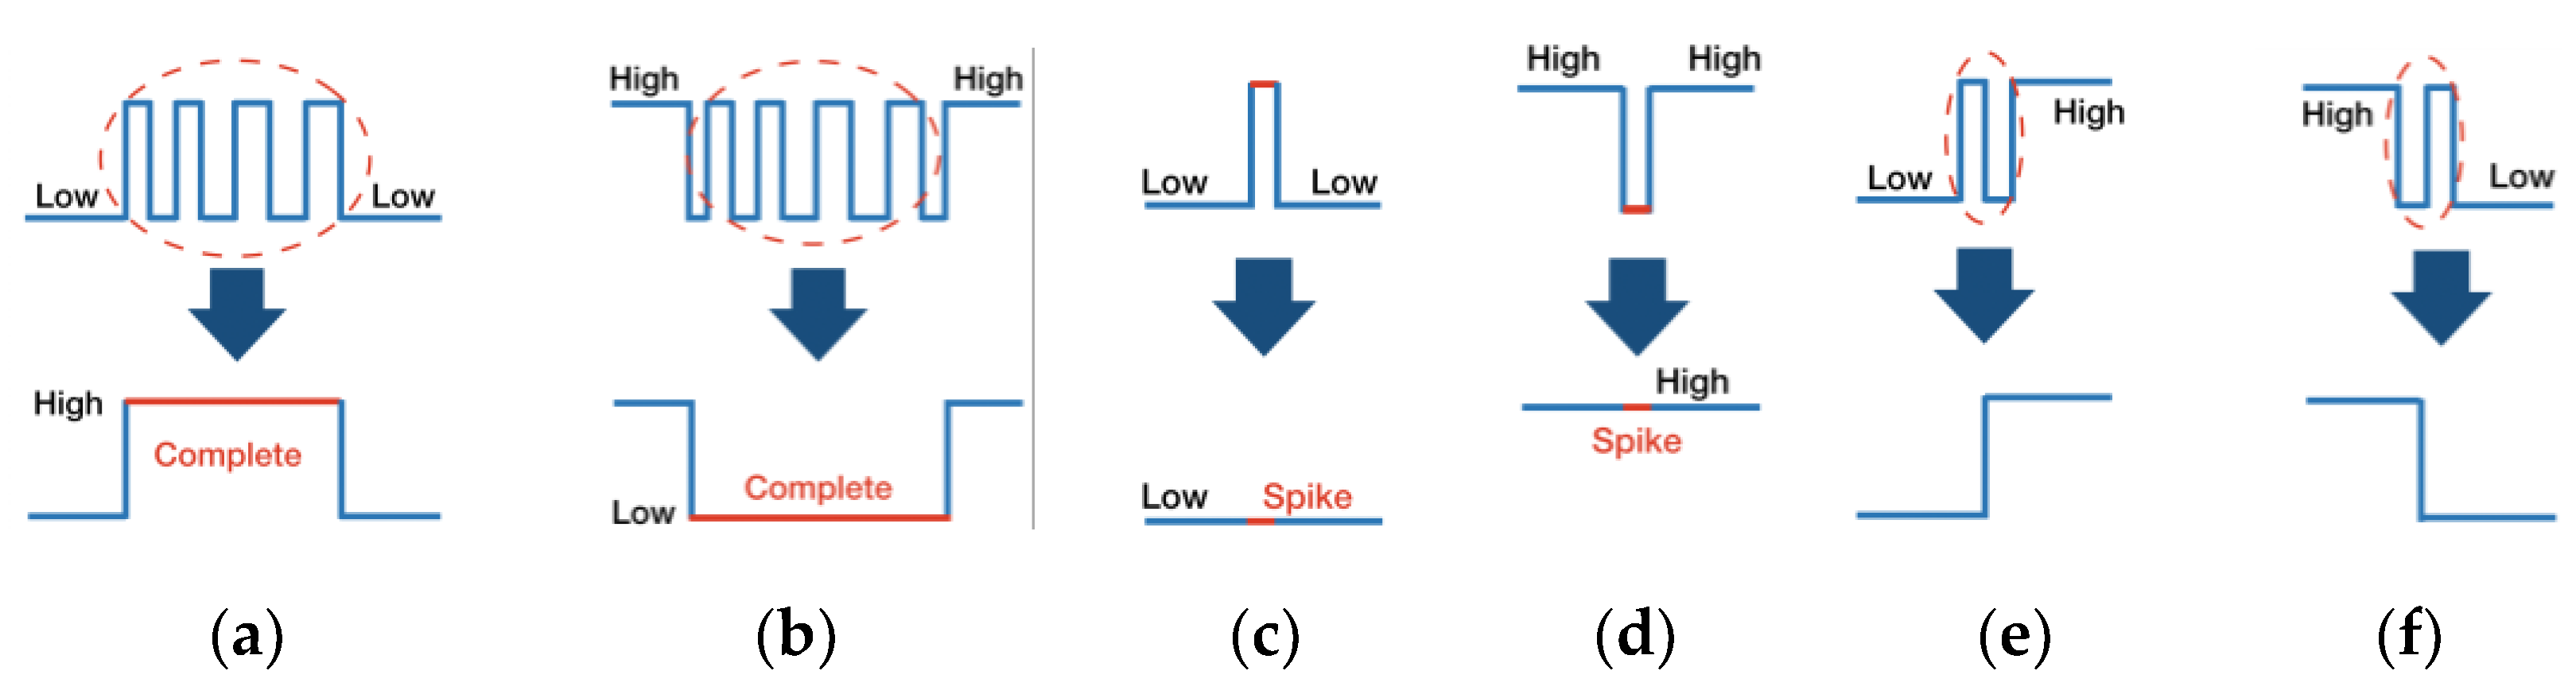
4.3. Error Correction
5. Morse Code Decoding
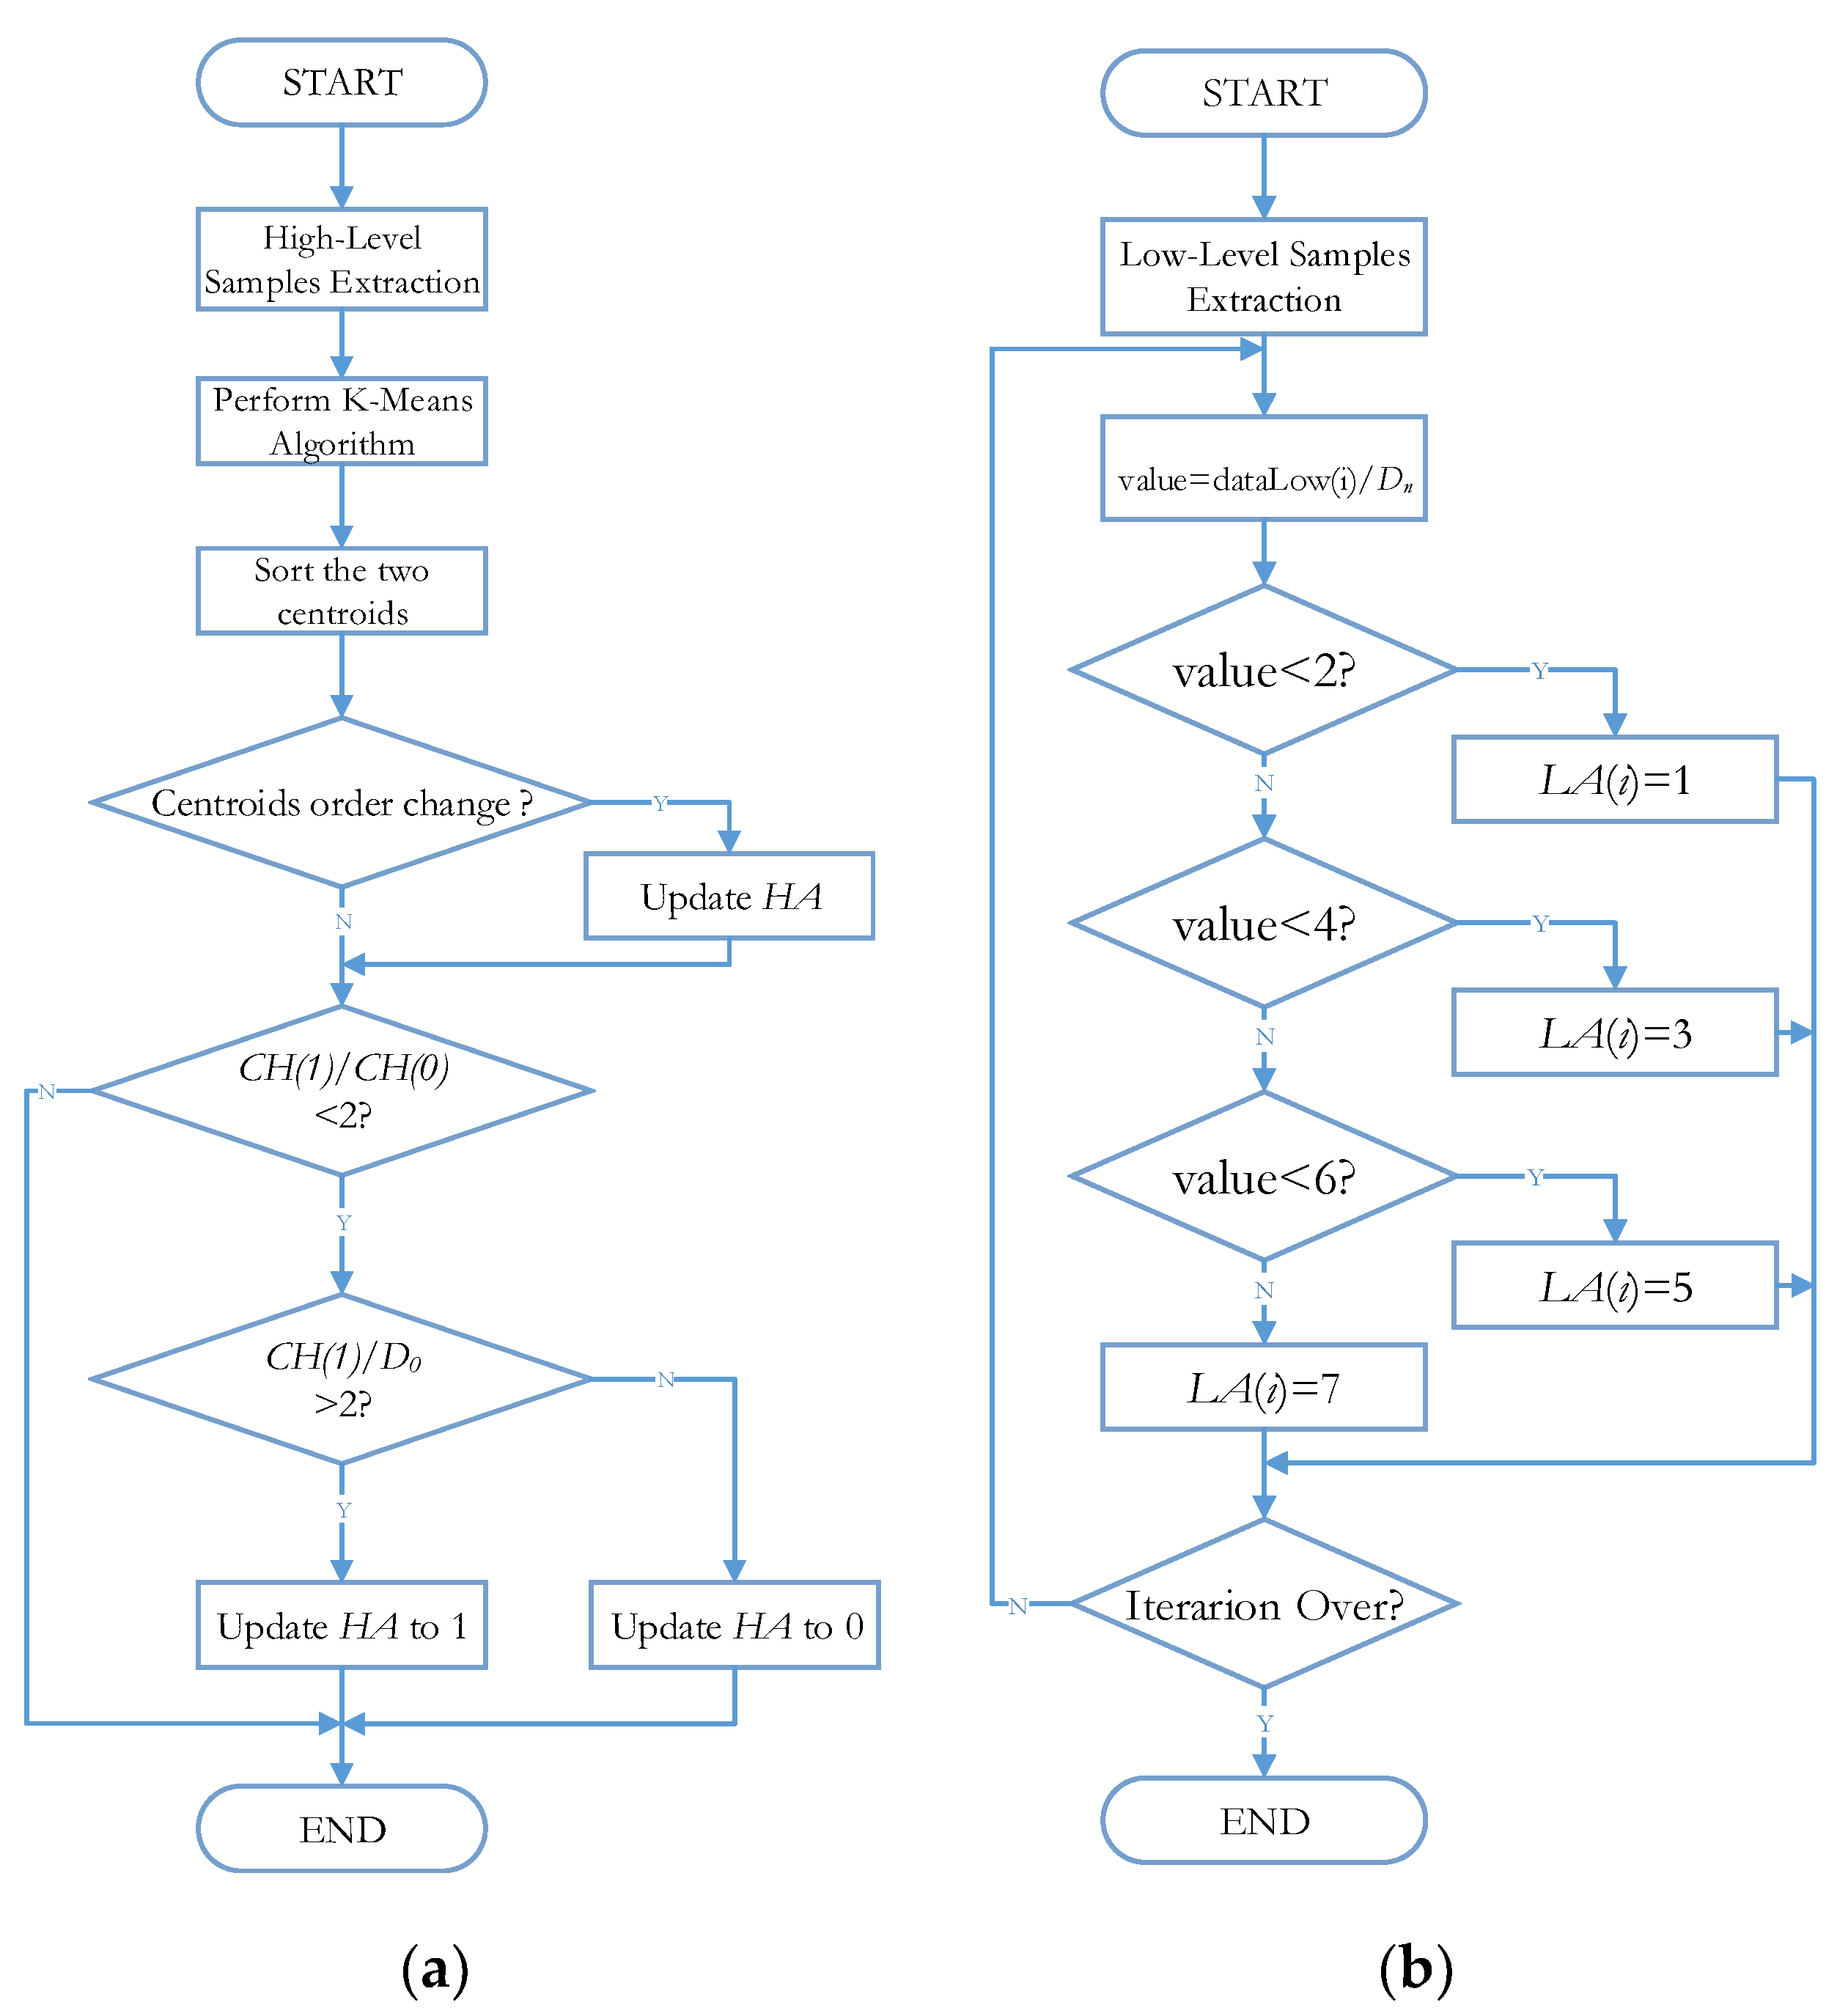
5.1. Dot–Dash Recognition
- Extract the high-level samples output after signal pretreatment, stored in an array;
- Perform the mk-means method to partition these data samples into two clusters, and store the classification results in a new array HA;
- Sort the two cluster centroids in ascending order, stored in an array CH, and ensure that CH(0) is less than CH(1). If the order of the cluster centroids changes, then update the centroid index stored in HA;
- Assume the basic dot duration computed above is D0 and s = CH(1)/CH(0). If s < 2, it indicates that the two clusters belong to one common category. At this point, if CH(1)/D0 ≤ 2, then it means all the samples in HA denote “dot,” and all indexes in the array need to be updated to 0; else, if CH(1)/D0 > 2, then it means HA represents “dash,” and the indexes should be updated to 1.
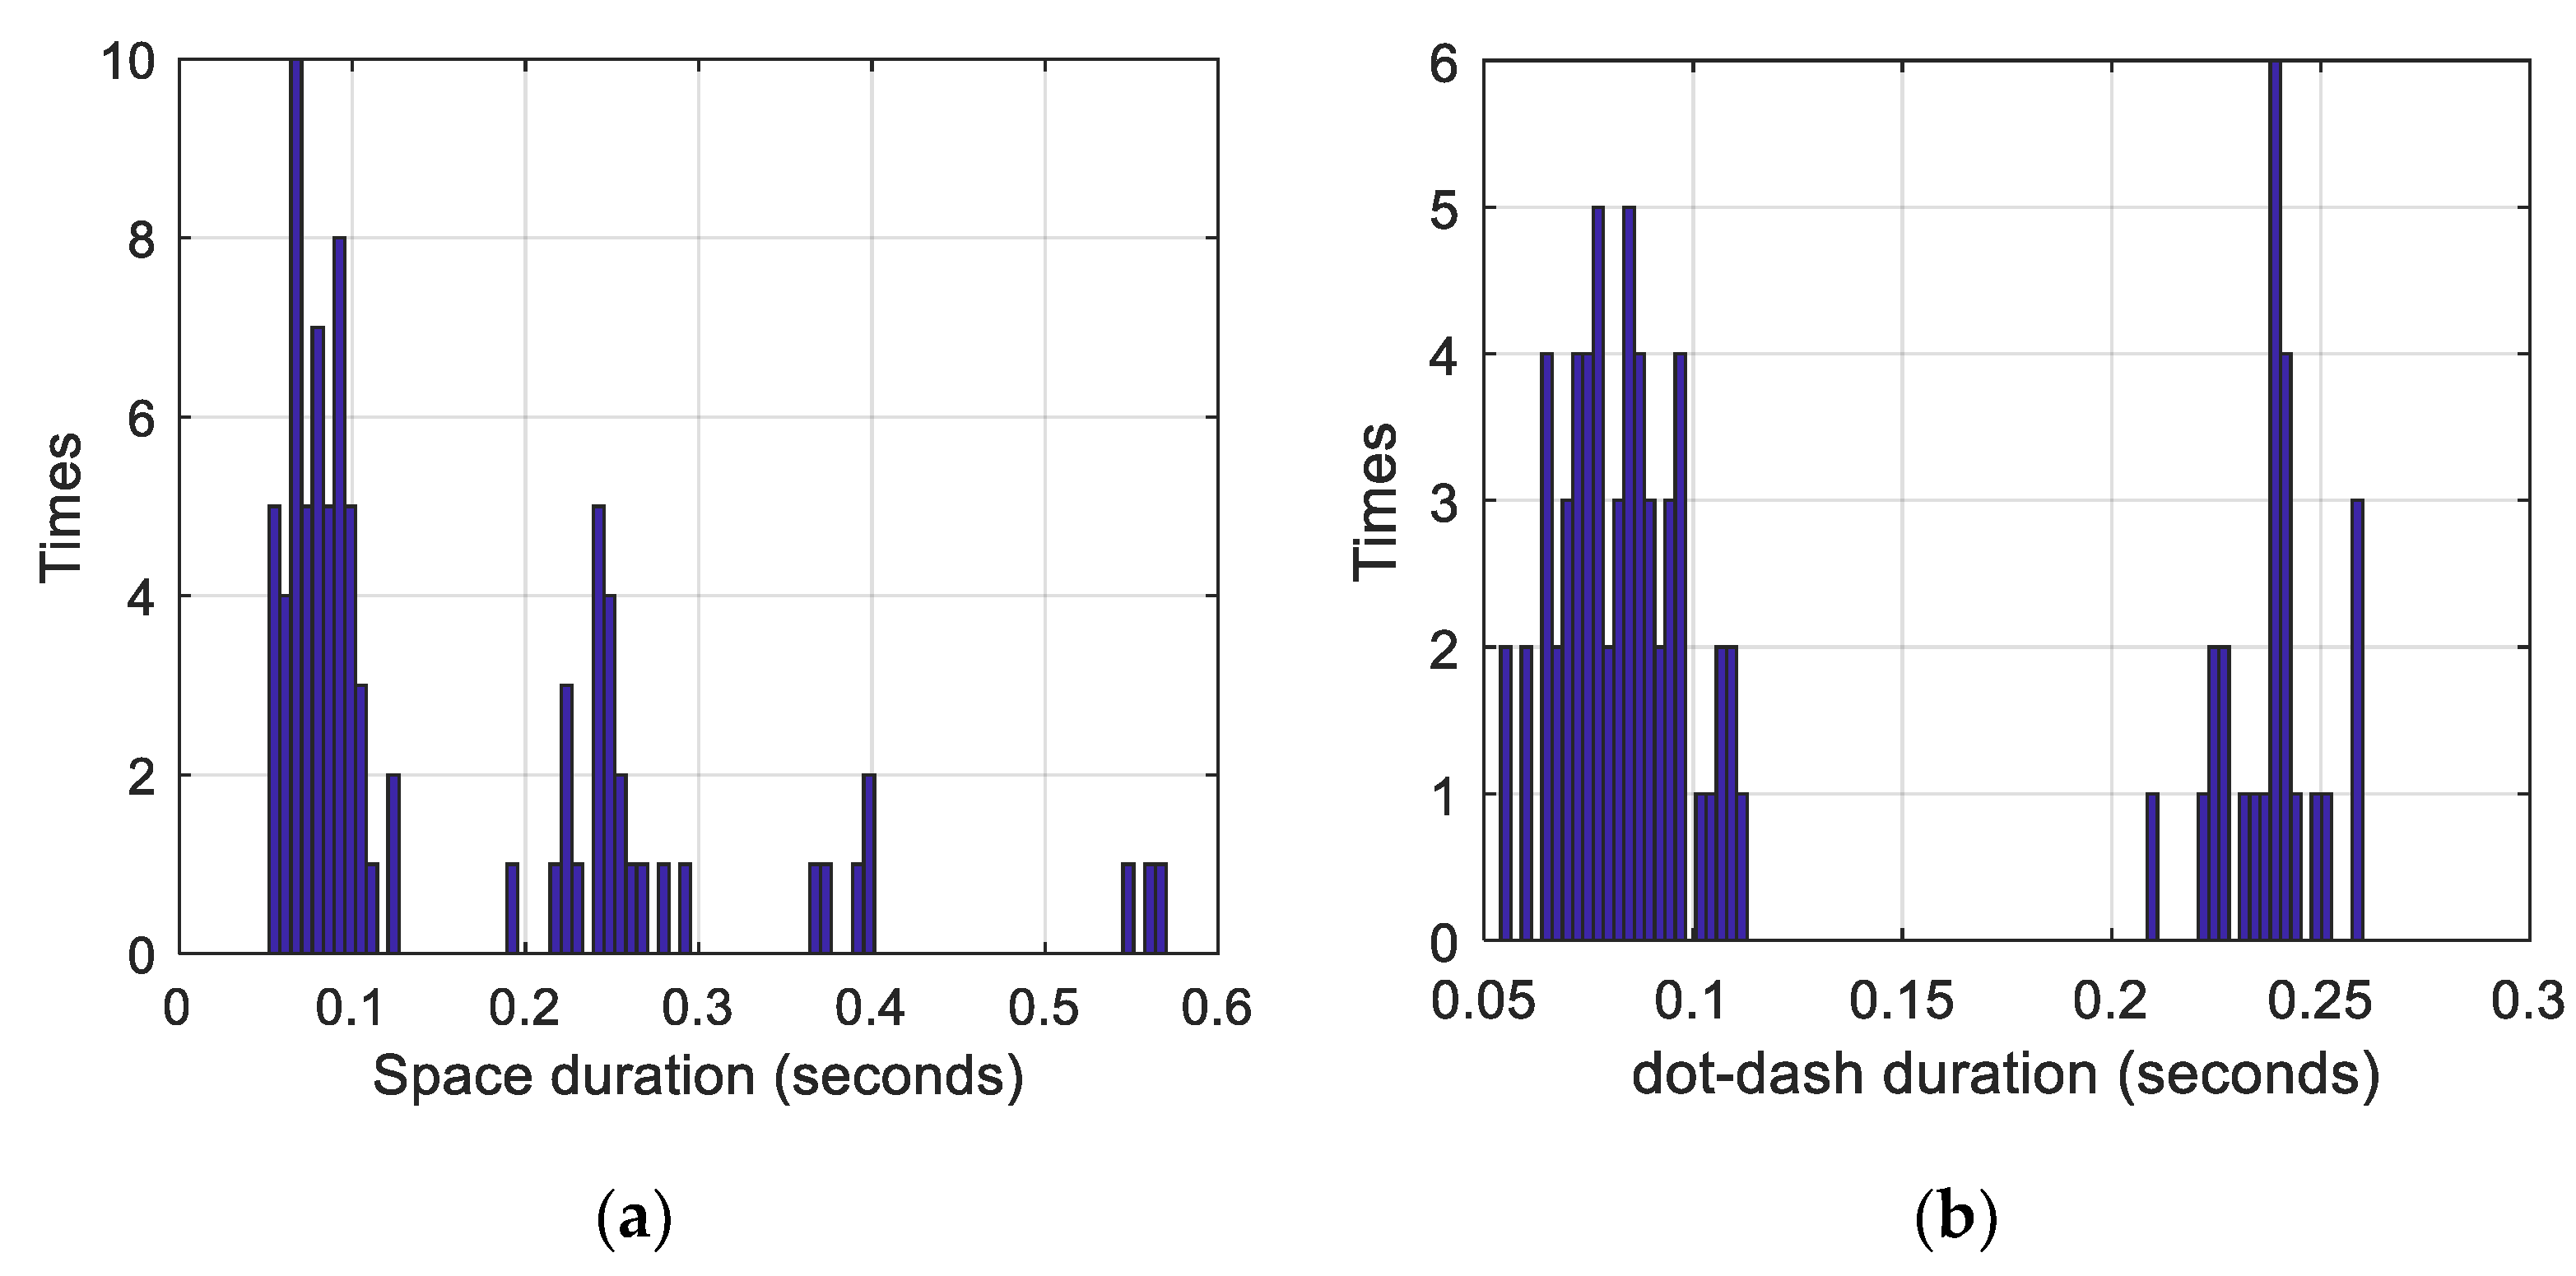
5.2. Space Recognition
5.3. Accuracy Computation
| Algorithm 1 String similarity algorithm |
| 1: procedure Levenshtein Distance (R, D) 2: int m[i,j] = 0 3: for each i ←1 to |R| do 4: m[i,0] = i 5: end for 6: for each j ←1 to |D| do 7: m[0, j] = j 8: end for 9: for each i ←1 to |R| do 10: for each j ←1 to |D| do 11: t ← if (R[i] = D[j]) then 0 else if 1 12: m[i,j] = min{ m[i−1,j−1] + t, m[i−1,j] + 1, m[i,j−1] + 1} 13: end for 14: end for 15: return m[|R|, |D|] 16: end procedure |
6. Experimental Validation
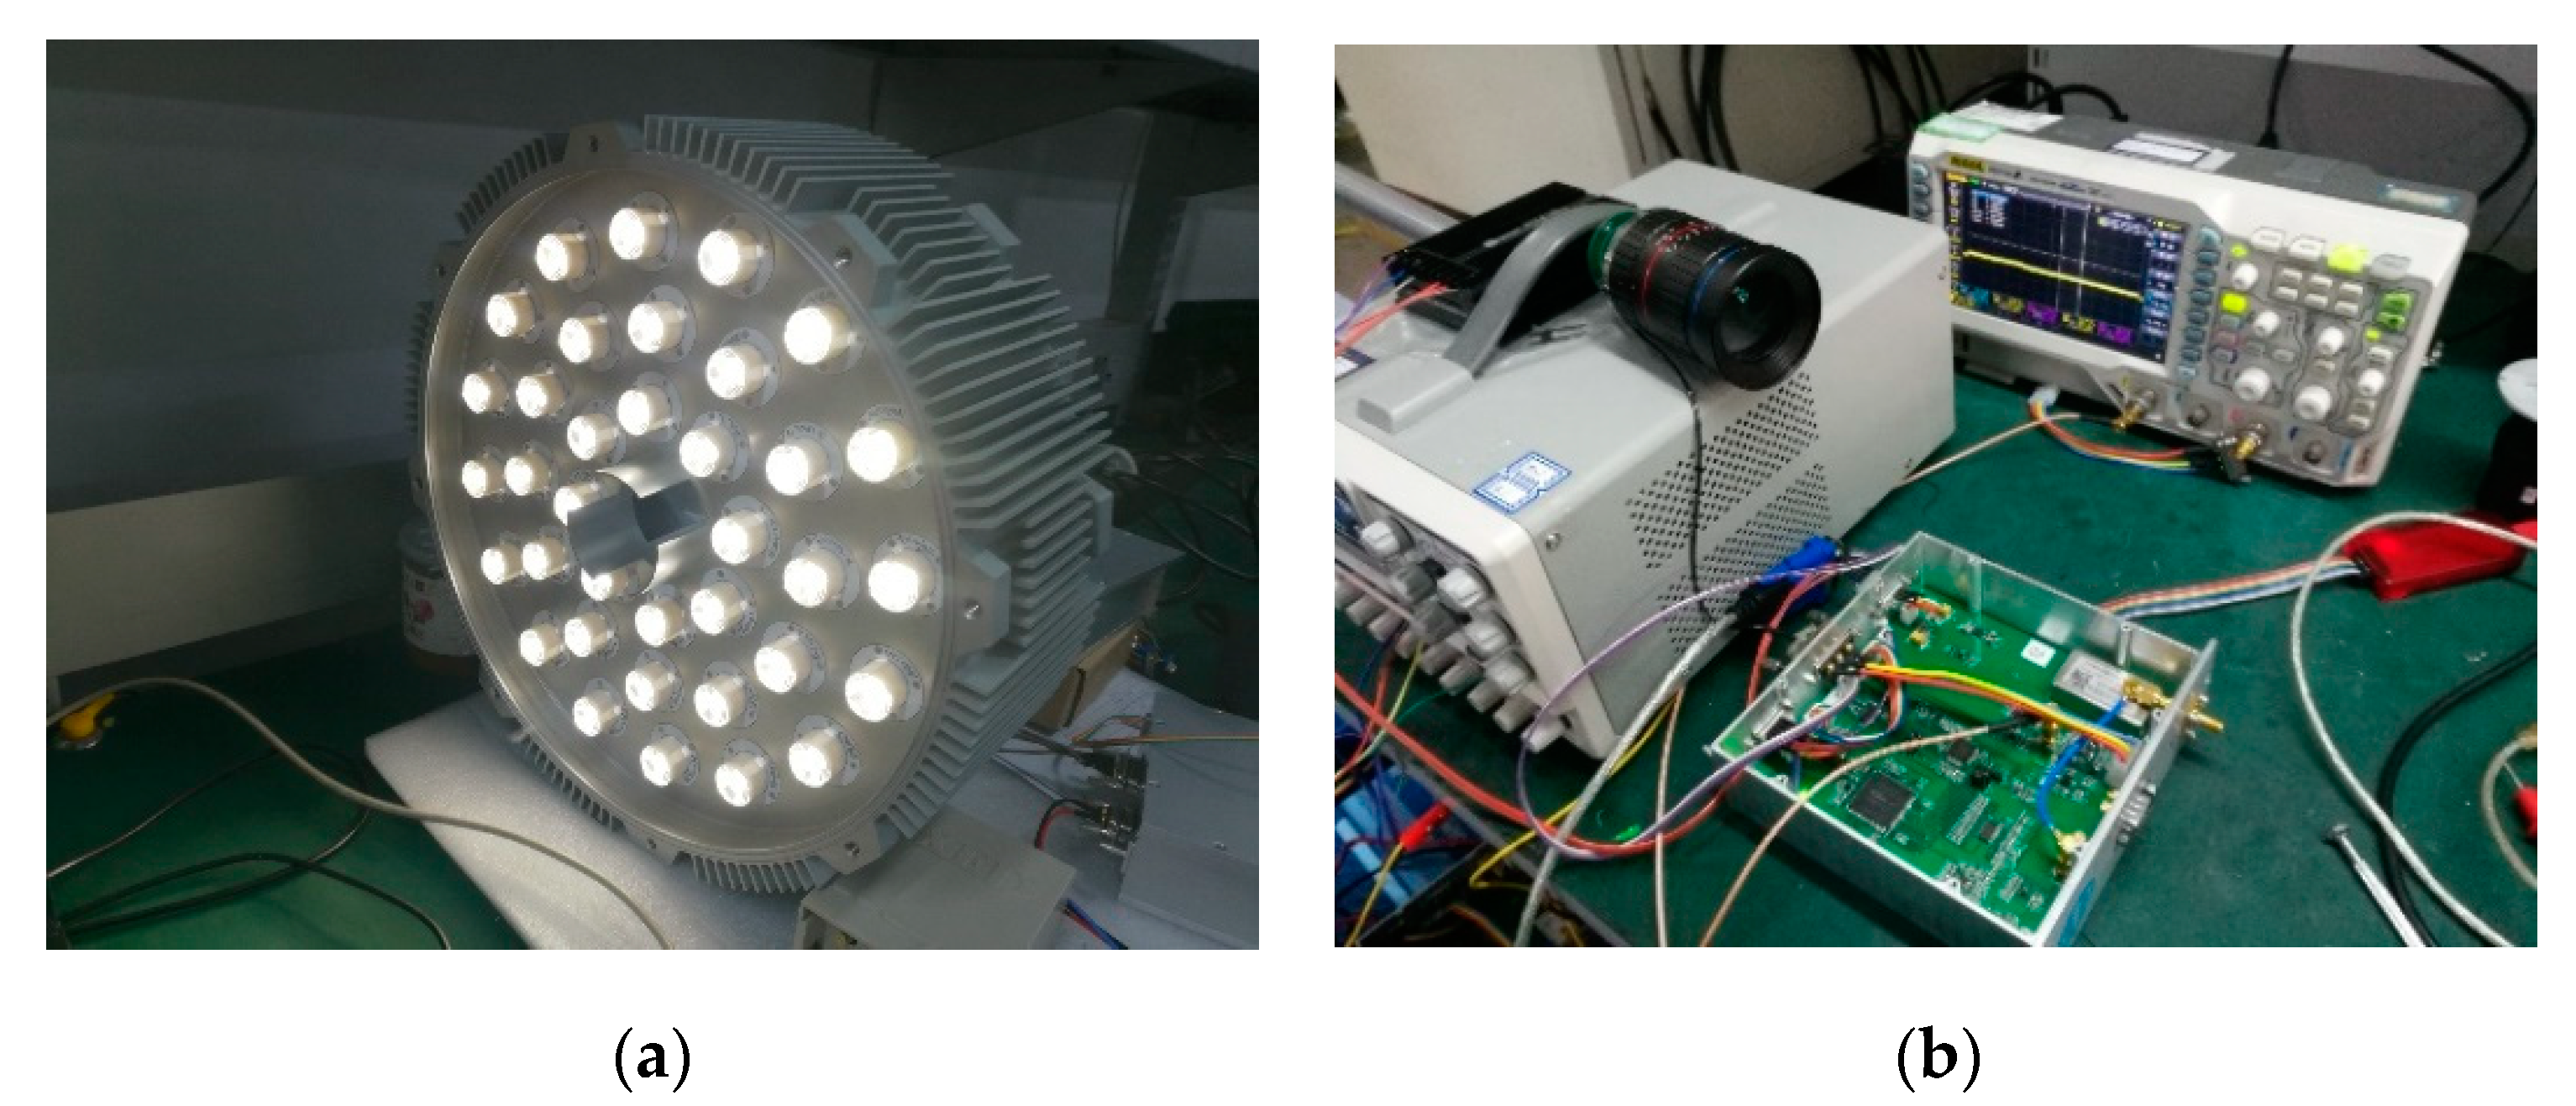
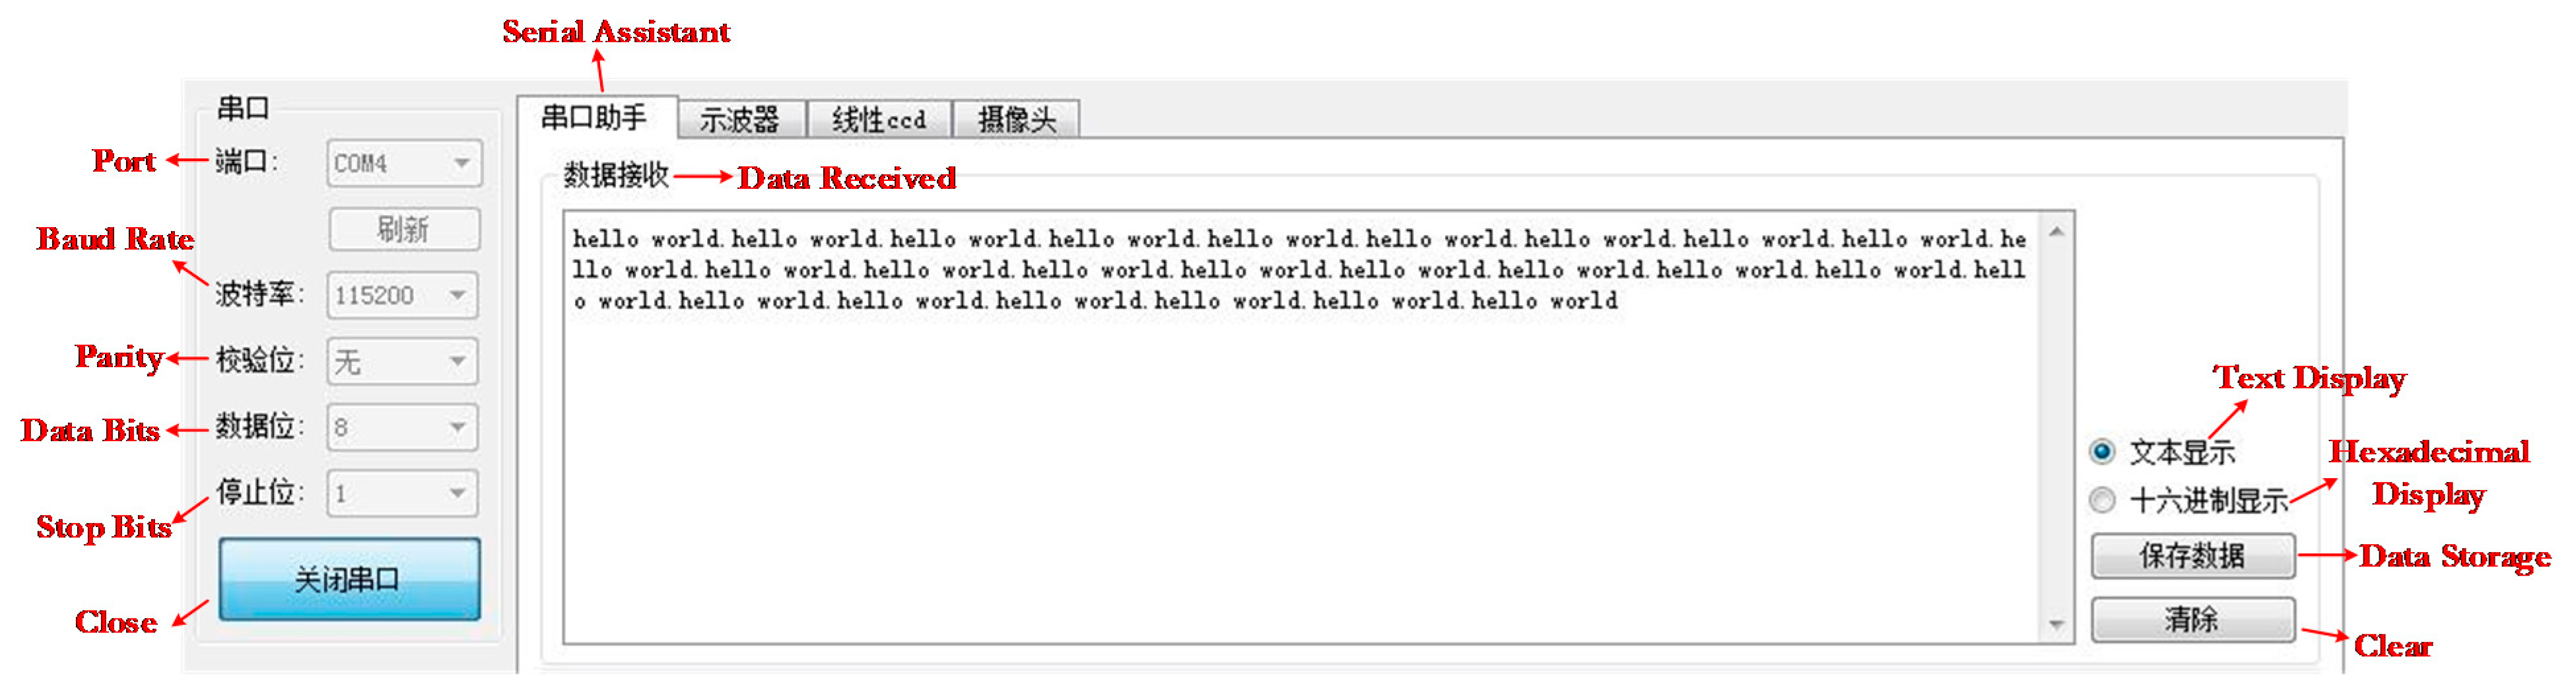
6.1. Experimental Setup
6.2. Recognition Accuracy Evaluation
6.3. System Robustness Evaluation
7. Conclusions
Author Contributions
Funding
Conflicts of Interest
References
- Khalighi, M.A.; Uysal, M. Survey on free space optical communication: A communication theory perspective. IEEE Commun. Surv. Tutor. 2014, 16, 2231–2258. [Google Scholar] [CrossRef]
- Grant, K.J.; Mudge, K.A.; Clare, B.A.; Perejma, A.S.; Martinsen, W.M. Maritime Laser Communications Trial 98152-19703, DSTO; Endinburgh: South Australia, Australia, 2012. [Google Scholar]
- Sluz, J.E.; Riggins, J., II; Juarez, J.C.; Sova, R.M.; Young, D.W.; Nelson, C. Characterization of data transmission through a maritime free-space optical channel with a custom bit error rate tester. Proc. Spie 2010, 7700, 77000D. [Google Scholar]
- Yu, J.; Li, Q.; Li, H.; Wang, Q.; Zhou, G.; He, D.; Xu, S.; Xia, Y.; Huang, Y. High-Precision Light Spot Position Detection in Low SNR Condition Based on Quadrant Detector. Appl. Sci. 2019, 9, 1299. [Google Scholar] [CrossRef]
- New Atlas. Available online: https://newatlas.com/us-navy-signal-lamps-fltc-texting/50523/ (accessed on 10 October 2019).
- Sapaico, L.R.; Sato, M. Analysis of vision-based text entry using Morse code generated by tongue gestures. In Proceedings of the 2011 4th International Conference on Human System Interactions (HSI), Yokohama, Japan, 19–21 May 2011; pp. 158–164. [Google Scholar]
- Hsieh, M.C.; Luo, C.H.; Mao, C.W. Unstable Morse code recognition with adaptive variable-ratio threshold prediction for physically disabled persons. IEEE Trans. Rehabil. Eng. 2000, 8, 405–413. [Google Scholar] [CrossRef] [PubMed]
- Popular Mechanics. Available online: https://www.popularmechanics.com/military/navy-ships/a27391/us-navy-Morse-code-software/ (accessed on 10 October 2019).
- Ma, W.; Zhang, J.; Wang, H. Automatic Decoding System of Morse Code. O.I. Autom. 2007, 26, 51–52. [Google Scholar]
- Xiao-Na, Z.; Guo-Jun, L.; Yong, J.; Li, Z. Automatic reception of High-frequency CW telegraph with Support Vector Machine. In Proceedings of the 2nd IEEE International Conference on Future Computer and Communication, Wuhan, China, 21–24 May 2010; pp. 335–338. [Google Scholar]
- Zahradnik, P.; Šimák, B. Implementation of Morse decoder on the TMS320C6748 DSP development kit. In Proceedings of the 2014 6th IEEE European Embedded Design in Education and Research Conference, Milan, Italy, 11–12 September 2014; pp. 128–131. [Google Scholar]
- Xiao, S.; Gao, Y. Multiplexed Morse Telegraph Automatic Decoding Based on Wavelet Transform. Comput. Digit. Eng. 2017, 45, 632–636. [Google Scholar]
- Wei, Z.; Jia, K.; Sun, Z. An Automatic Detection Method for Morse Signal Based on Machine Learning. In Proceedings of the 12th International Conference on Intelligent Information Hiding and Multimedia Signal, Matsue, Japan, 12–15 August 2017; pp. 185–191. [Google Scholar]
- Wang, X.; Zhao, Q.; Ma, C.; Xiong, J. Automatic Morse Code Recognition Under Low SNR. In Proceedings of the 2018 International Conference on Mechanical, Electronic, Control and Automation Engineering, Manila, Philippines, 5–7 January 2018. [Google Scholar]
- Yuan, Y.; Sun, Z.; Wei, Z.; Jia, K. DeepMorse: A Deep Convolutional Learning Method for Blind Morse Signal Detection in Wideband Wireless Spectrum. IEEE Access 2019, 7, 80577–80587. [Google Scholar] [CrossRef]
- Wang, Y.; Sun, Z.; Jia, K. An Automatic Decoding Method for Morse Signal based on Clustering Algorithm. In Proceedings of the 12th International Conference on Intelligent Information Hiding and Multimedia Signal Processing, Kaohsiung, China, 21–23 November 2016; pp. 235–242. [Google Scholar]
- Qu, S.; Liu, H.; Zhang, X. Morse Recognition Algorithm Based on K-means. In Proceedings of the 2019 IEEE Cross Strait Quad-Regional Radio Science and Wireless Technology Conference, Taiyuan, China, 19–22 July 2019; pp. 1–2. [Google Scholar]
- Lee, C.T.; Shen, T.C.; Lee, W.D. A Novel Optical Morse Code-Based Electronic Lock Using the Ambient Light Sensor and Fuzzy Controller. Appl. Sci. 2017, 7, 140. [Google Scholar] [CrossRef]
- Bilal, M.; Liu, S.; Qiao, G.; Wan, L.; Tao, Y. Bionic Morse Coding Mimicking Humpback Whale Song for Covert Underwater Communication. Appl. Sci. 2020, 10, 186. [Google Scholar] [CrossRef]
- Ma, S.; Dai, J.; Lu, S.; Li, H.; Zhang, H.; Du, C.; Li, S. Signal Demodulation with Machine Learning Methods for Physical Layer Visible Light Communications: Prototype Platform, Open Dataset, and Algorithms. IEEE Access 2019, 7, 30588–30598. [Google Scholar] [CrossRef]
- Zhang, X. The Distinction of Ship’s Communication Signals. J. Jimei. Navig. Inst. 1996, 14, 19–25. [Google Scholar]
- Zhang, J.; Chen, W.; Gao, M.; Shen, G. K-means-clustering-based fiber nonlinearity equalization techniques for 64-QAM coherent optical communication system. Opt. Express 2017, 25, 27570–27580. [Google Scholar] [CrossRef] [PubMed]
- Peng, Y.; Liu, X.; Shen, C.; Huang, H.; Zhao, D.; Cao, H.; Guo, X. An Improved Optical Flow Algorithm Based on Mask-R-CNN and K-Means for Velocity Calculation. Appl. Sci. 2019, 9, 2808. [Google Scholar] [CrossRef]
- Hou, X. An Improved K-means Clustering Algorithm Based on Hadoop Platform. In Proceedings of the International Conference on Cyber Security Intelligence and Analytics, Shenyang, China, 21–22 February 2019; pp. 1101–1109. [Google Scholar]
- Cardarilli, G.C.; Di Nunzio, L.; Fazzolari, R.; Re, M.; Spanó, S. AW-SOM, an algorithm for high-speed learning in hardware self-organizing maps. IEEE Trans. Circuits Syst. IiExp. Briefs 2019, 67, 380–384. [Google Scholar] [CrossRef]
- Cardarilli, G.C.; Di Nunzio, L.; Fazzolari, R.; Nannarelli, A.; Re, M.; Spanò, S. N-Dimensional Approximation of Euclidean Distance. IEEE Trans. Circuits Syst. IiExp. Briefs 2019, 55, 161. [Google Scholar] [CrossRef]
- Tolentino, J.A.; Gerardo, B.D.; Medina, R.P. Enhanced Manhattan-Based Clustering Using Fuzzy C-Means Algorithm. In Proceedings of the International Conference on Computing and Information Technology, Chiangmai, Thailand, 5–6 July 2018; pp. 126–134. [Google Scholar]
- Heineman, G.T.; Pollice, G.; Selkow, S. Algorithms in a Nutshell: A Practical Guide, 2rd ed.; O’Reilly Media, Inc.: Sebastopol, CA, USA, 2016; pp. 53–89. [Google Scholar]
- Zhao, Z.; Yin, Z.; Wang, Q.; Xu, X.; Jiang, H. An improved algorithm of Levenshtein Distance and its application in data processing. J. Comput. Applicat. 2009, 29, 424–426. [Google Scholar] [CrossRef]
- STMicroelectronics 32-bit Arm Cortex MCUs. Available online: https://www.st.com/en/microcontrollers-microprocessors/stm32f446.html (accessed on 26 January 2020).
- Zhou, H.; Zhang, M.; Wang, X.; Ren, X. Implementation of High Gain Optical Receiver with the Large Photosensitive Area in Visible Light Communication. In Proceedings of the Asia Communications and Photonics Conference, Chengdu, China, 2–5 November 2019; pp. 99–101. [Google Scholar]


| Device | Manufacturer | Model |
|---|---|---|
| AWG | Tektronix | AWG 7051 |
| LED | Cree Inc | XLamp® XP-L2 |
| Lens | ZhiSai Technology | ZLKC-KM5012MP8 |
| APD | Hamamatsu Photonics | S8664-50K |
| TIA | Linear Technology | LTC6268-10 |
| ADC | Texas Instruments | ADS 8866 |
| MCU | STMicroelectronics | STM32F446 |
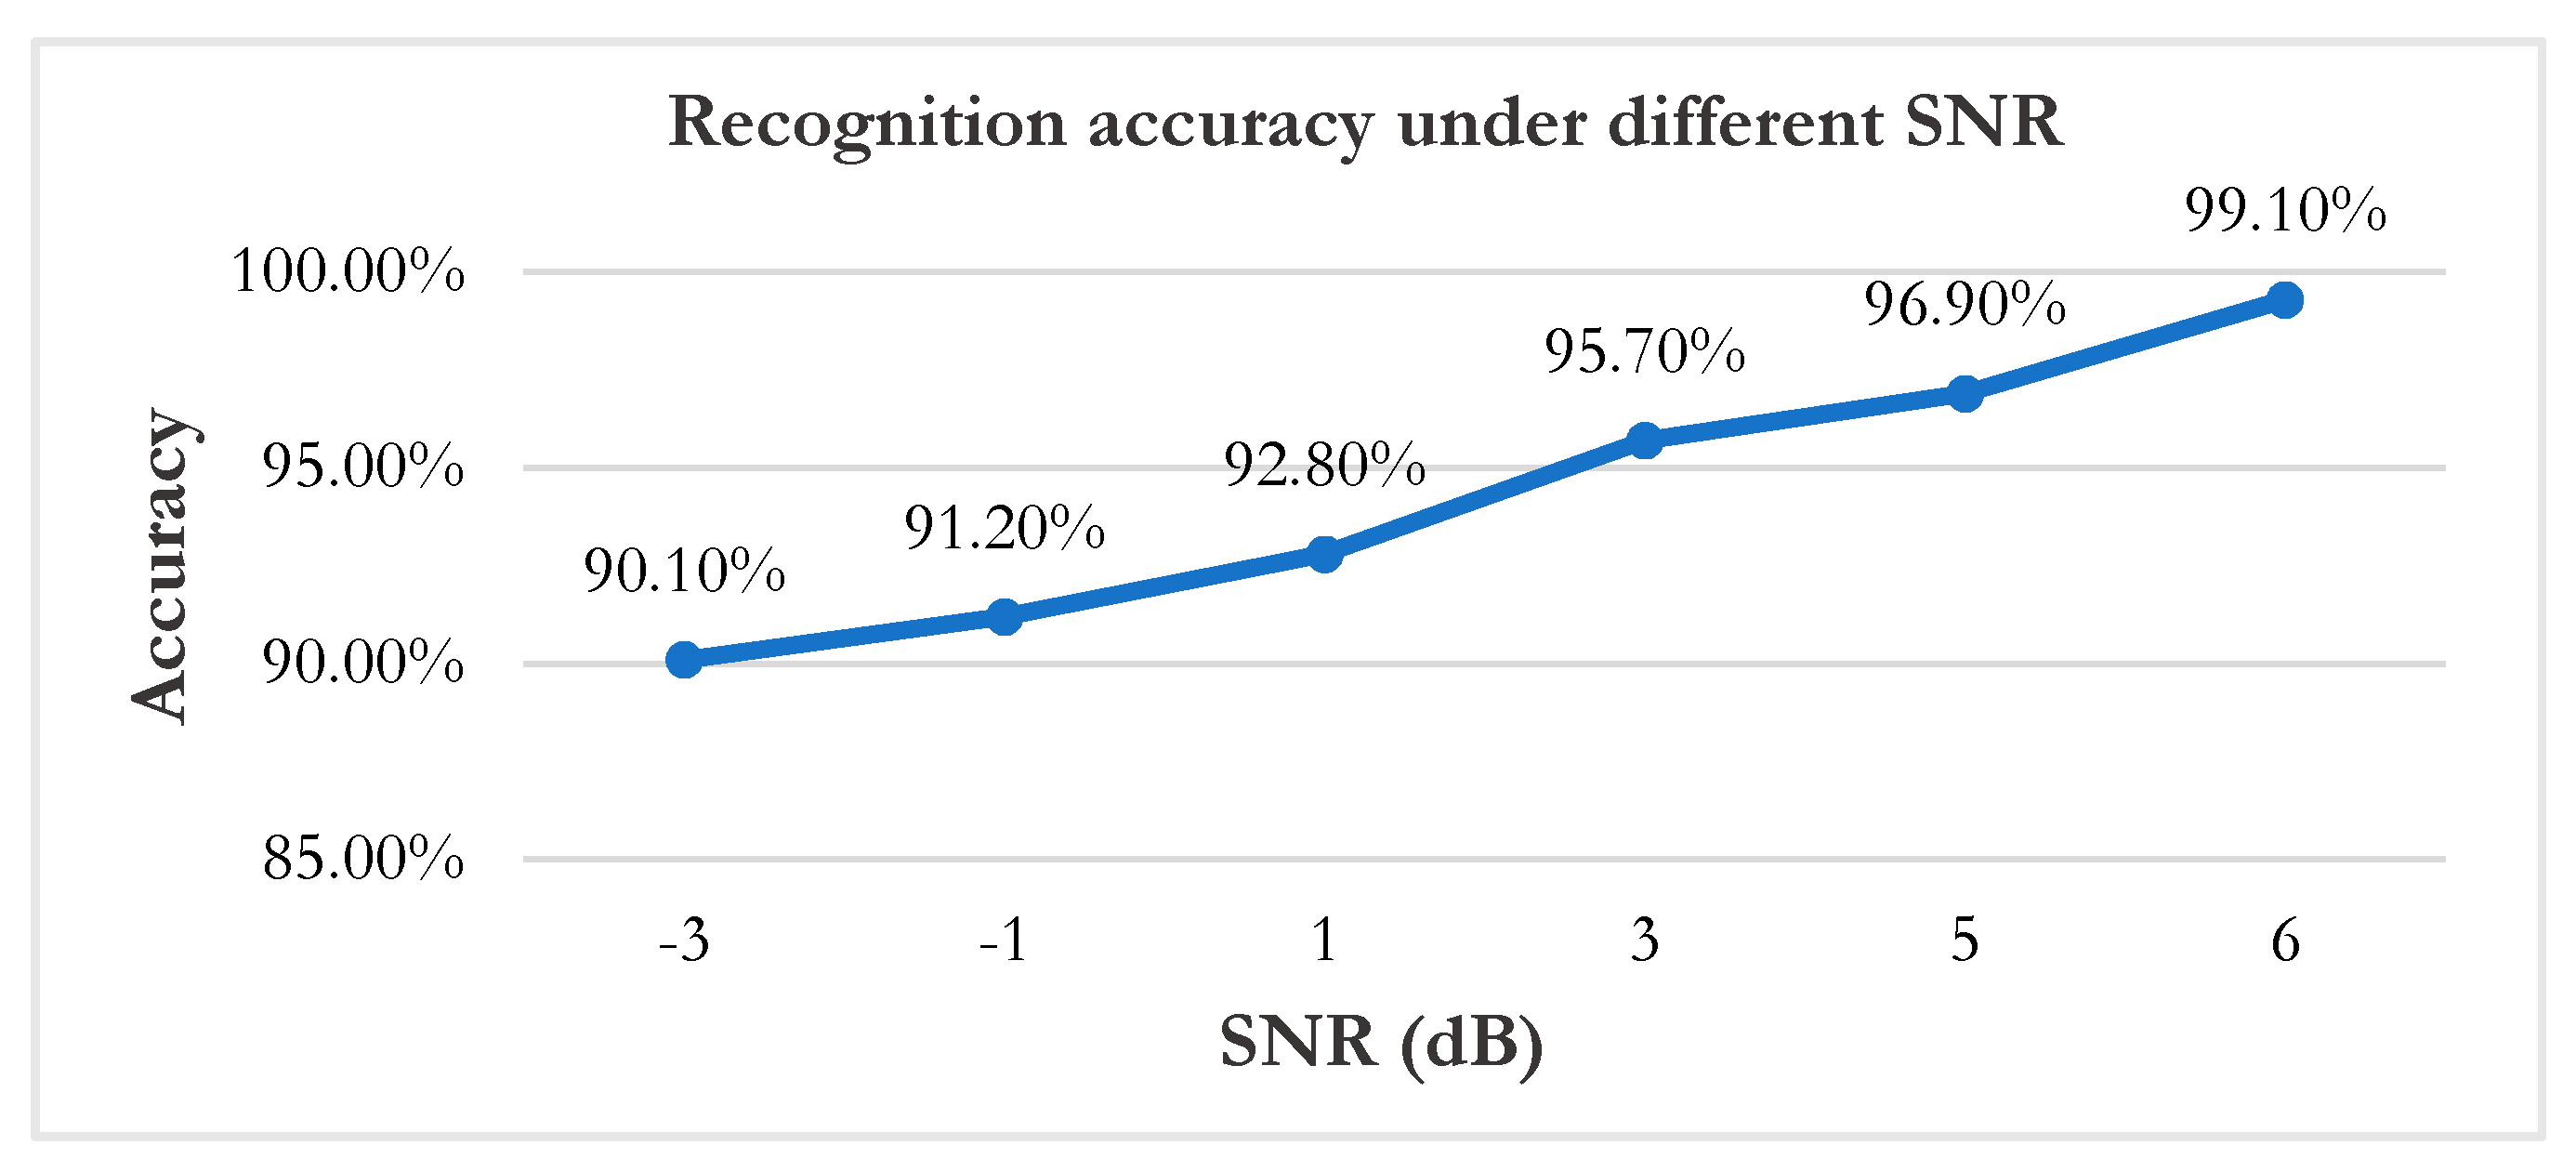
| SNR (dB) | Total Characters | Correct Characters | Accuracy |
|---|---|---|---|
| −3 | 2196 | 1979 | 90.1% |
| −1 | 2196 | 2003 | 91.2% |
| 1 | 2196 | 2038 | 92.8% |
| 3 | 2196 | 2102 | 95.7% |
| 5 | 2196 | 2128 | 96.9% |
| 6 | 2196 | 2176 | 99.1% |
© 2020 by the authors. Licensee MDPI, Basel, Switzerland. This article is an open access article distributed under the terms and conditions of the Creative Commons Attribution (CC BY) license (http://creativecommons.org/licenses/by/4.0/).
Share and Cite
Wang, X.; Zhang, M.; Zhou, H.; Lin, X.; Ren, X. A Robust Real-Time Automatic Recognition Prototype for Maritime Optical Morse-Based Communication Employing Modified Clustering Algorithm. Appl. Sci. 2020, 10, 1227. https://doi.org/10.3390/app10041227
Wang X, Zhang M, Zhou H, Lin X, Ren X. A Robust Real-Time Automatic Recognition Prototype for Maritime Optical Morse-Based Communication Employing Modified Clustering Algorithm. Applied Sciences. 2020; 10(4):1227. https://doi.org/10.3390/app10041227
Chicago/Turabian StyleWang, Xiaozheng, Minglun Zhang, Hongyu Zhou, Xinglong Lin, and Xiaomin Ren. 2020. "A Robust Real-Time Automatic Recognition Prototype for Maritime Optical Morse-Based Communication Employing Modified Clustering Algorithm" Applied Sciences 10, no. 4: 1227. https://doi.org/10.3390/app10041227
APA StyleWang, X., Zhang, M., Zhou, H., Lin, X., & Ren, X. (2020). A Robust Real-Time Automatic Recognition Prototype for Maritime Optical Morse-Based Communication Employing Modified Clustering Algorithm. Applied Sciences, 10(4), 1227. https://doi.org/10.3390/app10041227