Abstract
Bioelectric impedance spectroscopy (BIS) has been widely used to study the electrical properties of biological tissue based on the characteristics of the complex electrical impedance dispersions. One of the problems in using the BIS method is the length of time required for the data acquisition process and possibly data analysis as well. In this research, a compact and work rapidly BIS instrumentation system has been developed at a low cost. It is designed to work in the frequency range of 100 Hz to 100 kHz, which is generally used in the fields of biophysics and medical physics. The BIS instrumentation system is built using several integrated modules. The modules are an AC current source to produce a selectable injection current; a data acquisition system to measure voltage, current, and phase difference rapidly and simultaneously; and software to calculate and display measurement results in the form of Bode and Nyquist plots in real time. The developed BIS system has been validated using a simple RC circuit as the sample being tested. The average time needed in the process of data acquisition and analysis until the formation of impedance dispersion curves in the form of Bode and Nyquist plots, for 54 sample frequencies, is less than one minute. The system is able to identify R and C values of the sample with a maximum error of 1.5%. In addition, some simple application examples are also presented in this paper.
1. Introduction
Bioelectrical impedance spectroscopy (BIS) has been currently used in broad fields of studies, such as biophysics, medical physics, agriculture, and other fields of life-sciences. BIS is a non-invasive method for characterizing biological materials based on their electrical properties, which is expressed in terms of complex electrical impedance dispersion curves over a certain frequency range [1,2]. In here, there are three regions of bioelectrical impedance dispersion, α, β, and γ. The α-dispersion (10 Hz to 10 kHz) is related to the phenomena of ionic diffusion of the cell membrane and the counterion effects, the β-dispersion (10 kHz to 100 MHz) is related to the polarization phenomenon of cell membranes, and the γ-dispersion (in GHz order) is related to the polarization of water molecules [3]. Properties of electrical impedance have been reported to understand the nature and behavior of cell [4,5,6,7,8], bacteria detection and identification [9,10], identification of beverages and food ingredients [11,12,13,14,15,16], and so on. In the medical field, BIS is used to characterizations of serum and blood [17,18,19], identification of body composition and disease [20,21,22], and to assist the process of diagnosis and functional electrical stimulation of the body [23,24,25]. Research on BIS, as mentioned, mostly covers α and β dispersion, and is carried out using a frequency of 10 Hz to 1 MHz.
In principle, identification of the electrical impedance of biological tissue performed by injecting alternating current, I, into the sample through a pair of current electrodes, and measuring the voltage, V, which arises through a pair of voltage electrodes. Then, the impedance, Z, is calculated by using formula Z = V/I. It should be noted that V, I, and Z is complex variables, therefore a BIS instrumentation system must not only be able to measure the magnitudes of current and voltage, but must also be able to measure their phase difference. Therefore, a BIS instrumentation system is at least having three functional units. First is an AC current source, which must be stable within working frequency range; second is a data acquisition system to record voltage, current, and their phase difference; and third is software for computing and displaying the impedance dispersion curves, which is commonly in the Bode plot or Nyquist plot.
Furthermore, in an effort to provide a BIS instrumentation system in good performance, some researchers have offered the new design. Starting from precision AC current sources [26], the high accuracy data acquisition system [27,28], even the whole system device [29,30,31,32,33]. Commonly, the offered BIS instrumentation system is arranged in modular and work separately. It has weaknesses in compactness and synchronization of the hardware system. Besides that, most of the offered BIS instrumentation cannot perform automatically frequency scans. The measurement process is carried out manually starting from the lowest to the highest frequency, then the measurement results are plotted using MS-Excel or others data processing software by entering the recorded measuring data. These methods will require a long time, so it is inefficient to produce an impedance dispersion curve.
In this research, we propose a low-cost, rapid, and compact BIS instrumentation system with Bode and Nyquist plot in real-time. There are several new things we offer:
- The system contains three main modules in an integrated (compact) ones, so synchronization among modules can be maintained/controlled by PC, and it can work automatically.
- The system uses programmable AC current source, so that the value of the current to be injected into biological samples can be selected/regulated through software via PC.
- The data acquisition system is built based on gain phase detector (GPD-AD8302), so that the value of V, I, and phase difference can be identified rapidly.
- We developed computational software (in Delphi) to calculate the complex impedance values of the samples, and also software to draw Bode and Nyquist plots. We do not need another application program (e.g., MS-Excel) to do the calculations separately. Therefore, the time needed for computation and data analysis to be reduced very significantly.
2. Materials and Methods
A block diagram of BIS instrumentation system which is proposed in this research is given in Figure 1. It is built in several integrated modules, and can be grouping into three main units, i.e., AC current source, data acquisition, and software. The unit of AC current source is a stable current source with selectable frequency within a certain frequency range.

Figure 1.
Block diagram of the developed BIS instrumentation system.
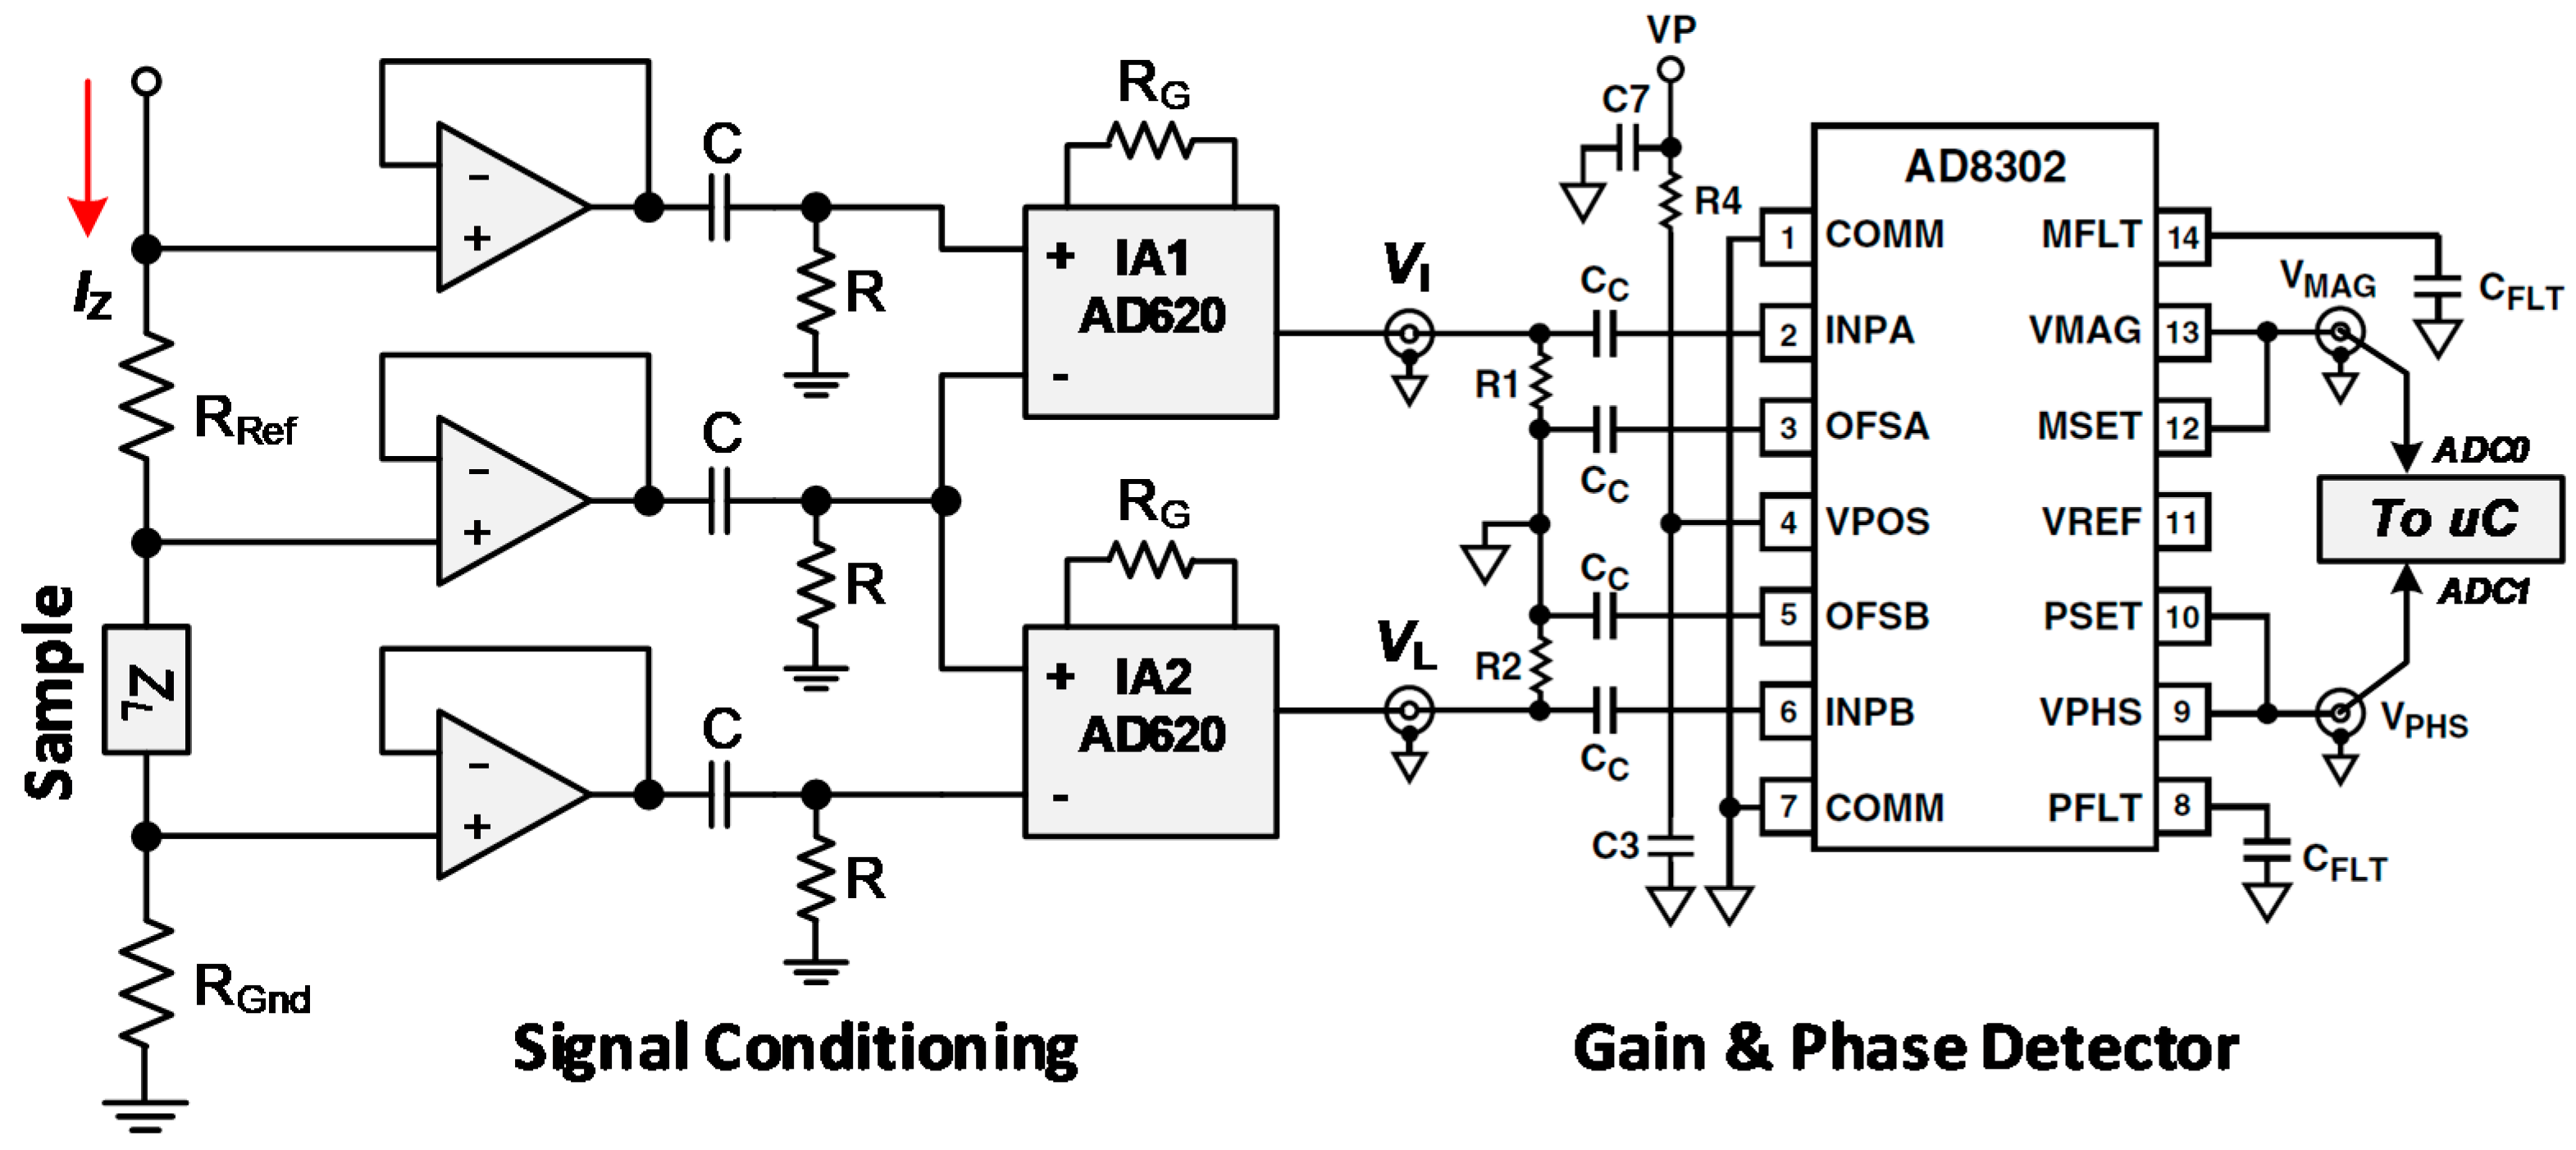
In the implementation, an AC current source with a certain frequency is injected into the sample through a reference resistor (R-Ref). Function of R-Ref is to guarantee that the current which is recorded by the data acquisition system is the actual current received by the sample. In this case, the actual current value is the voltage value read by IA1 divided by R-Ref, while the sample voltage arising due to injection current is read by IA2. Next, the outputs of IA1 and IA2 are forwarded to the gain phase detector module (GPD-AD8302). GPD performs an internal process to produce the gain in dB of (V/I) and the phase difference, the both in form of the equivalent voltages. These two signals are then converted into digital data by the ADC contained in the ATmega microcontroller, before being sent to the computer (PC). On the PC, the data is calculated to produce an impedance value, and plotted directly as single point on the Bode and Nyquist charts. This process is repeated for other frequencies until one full frequency cycle is completed.
Here, the software is developed and installed on the microcontrollers and PC, used for three purposes. The first is to control the working function of the hardware as a whole, specifically the selection of the current value and the desired working frequency range. The second is to calculate the complex impedance of the sample based on data from GPD, and the third is to present the complex impedance dispersion of the sample in the form of Bode and Nyquist plots in real time.
2.1. Unit of AC Current Source
The BIS instrumentation system requires a pure sine current signal with a selectable frequency and amplitude. For this purpose, the unit of AC current source is developed using two modules, i.e., the voltage generator and the voltage to current (V/I) converter. The voltage generator is serving to produce a sine voltage in the frequency range of 10 Hz to 10 MHz, while the V/I converter functions to change the voltage source into current source at the related frequency, with selectable current amplitude of the 1 μA, 10 μA, 100 μA, and 1 mA.
2.1.1. Voltage Generator
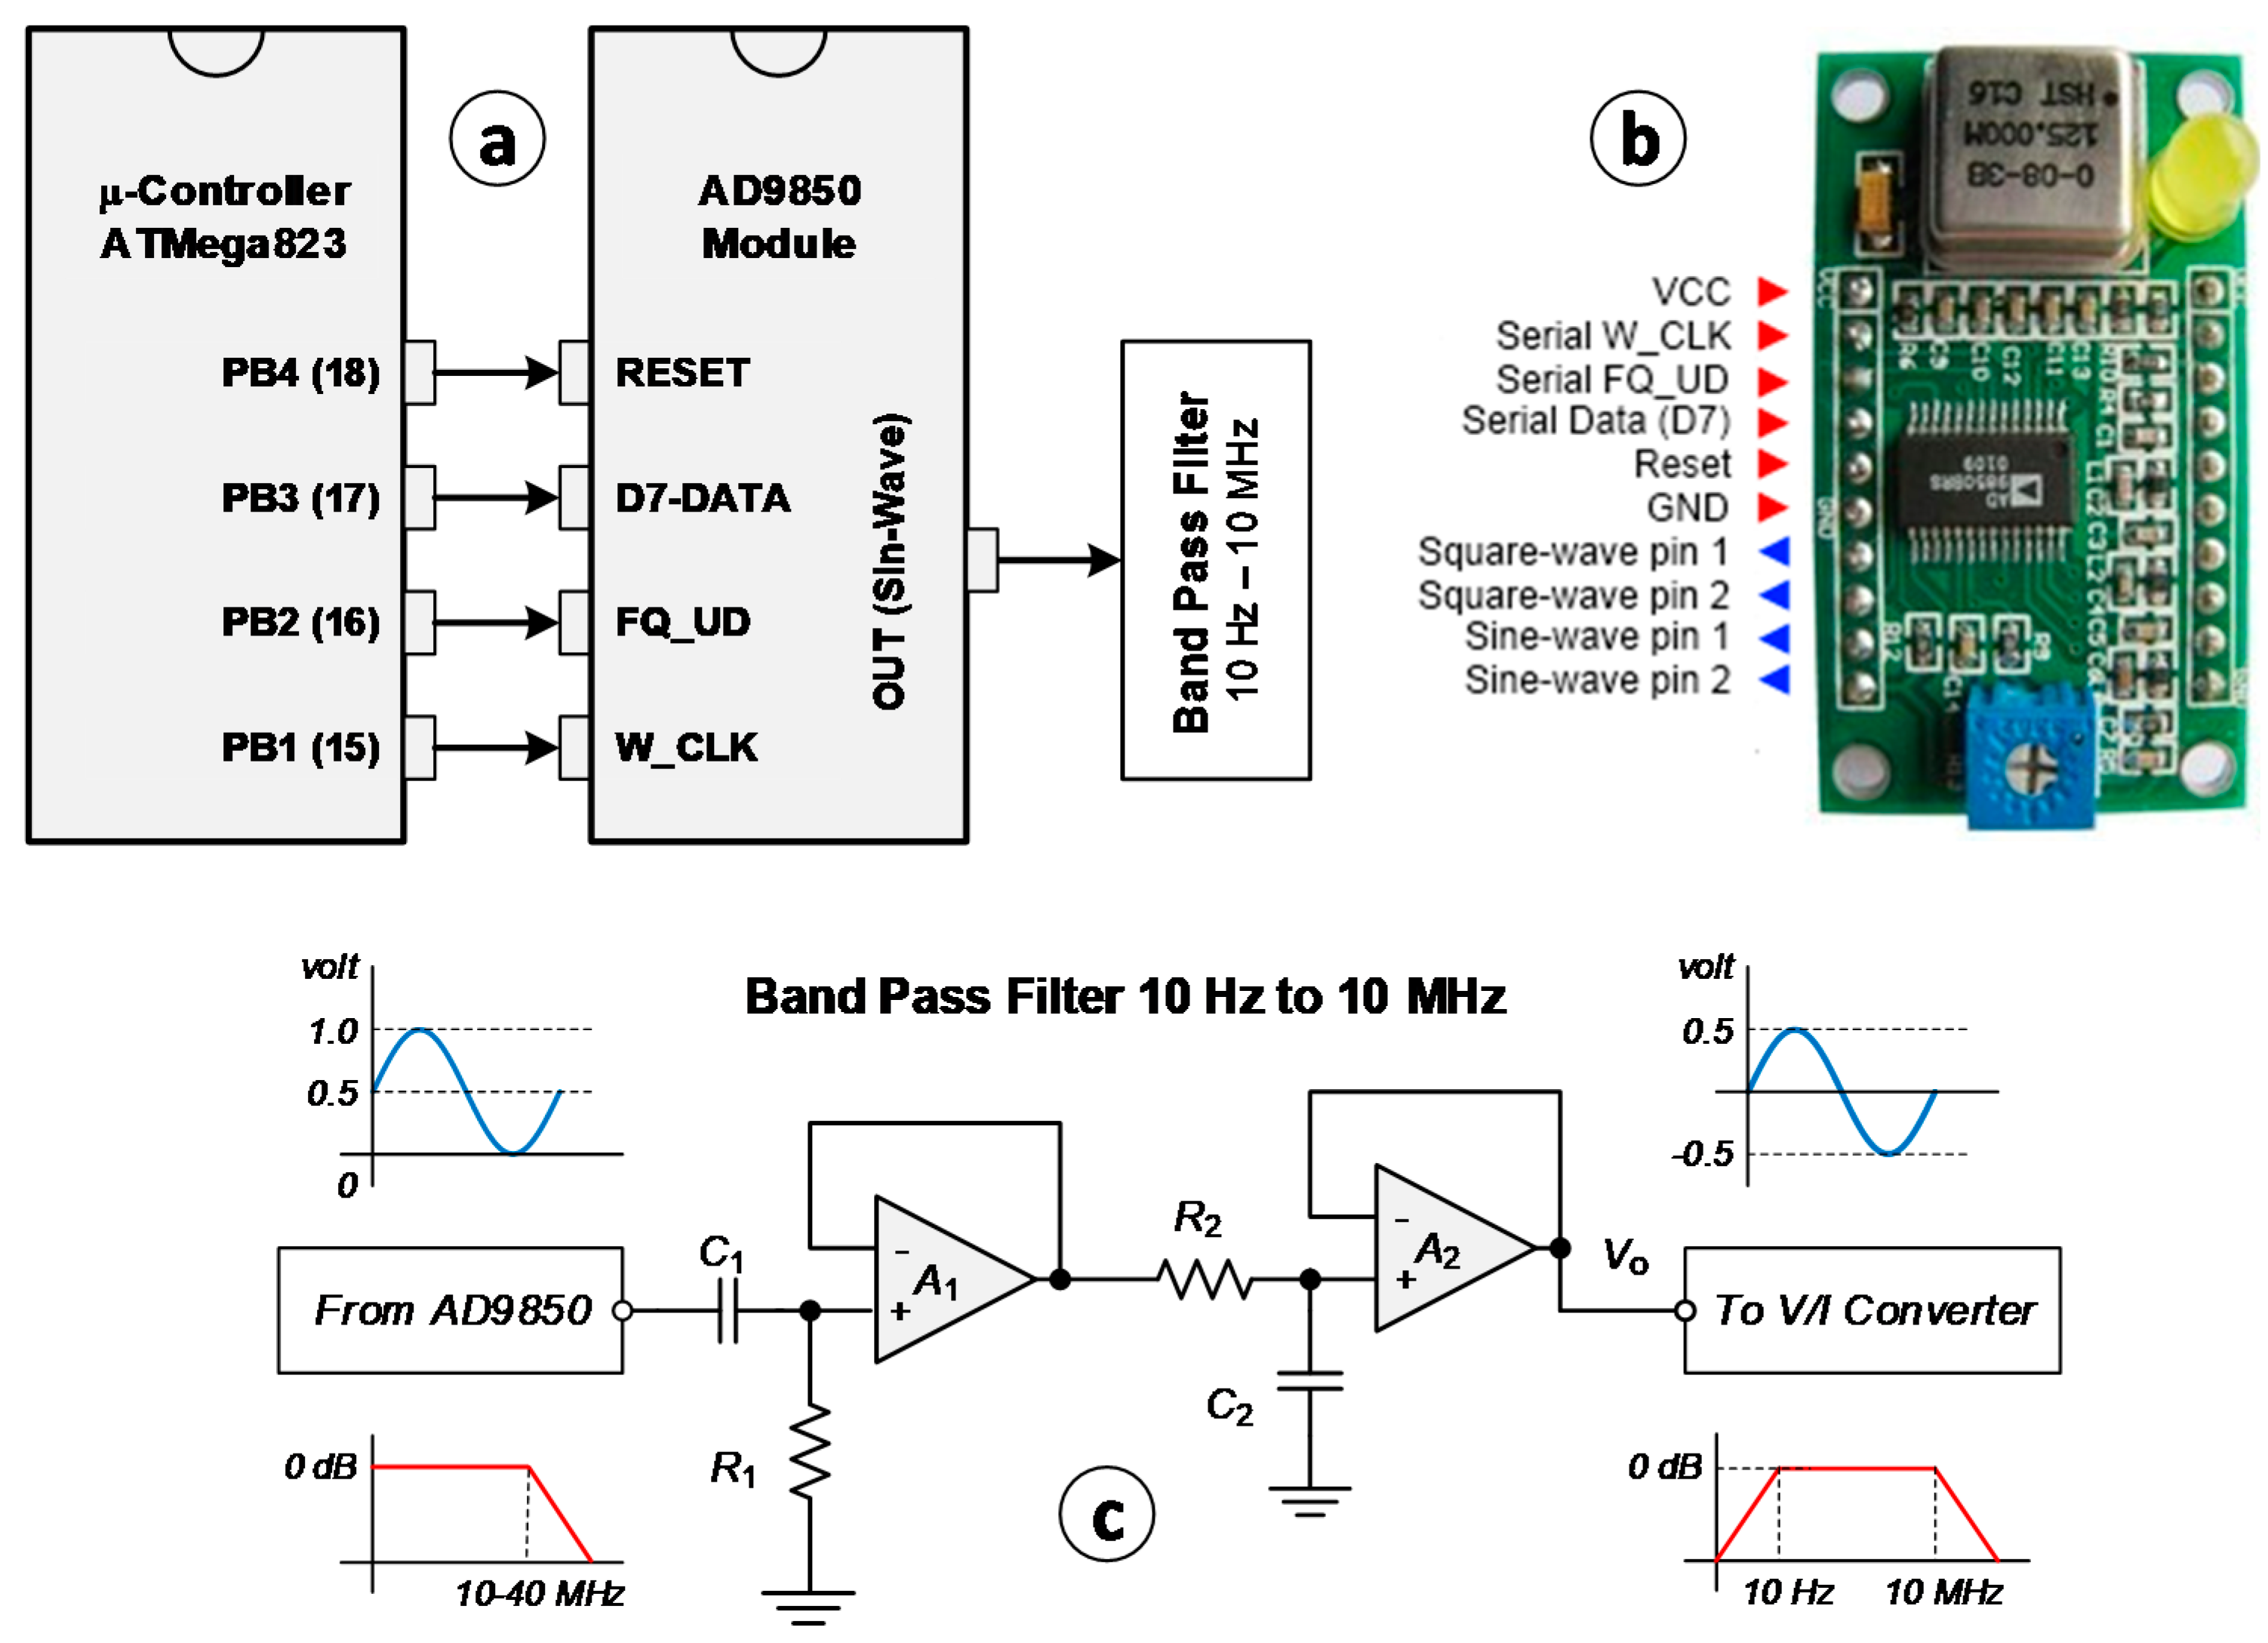
The AC voltage generator is built based on the AD9850 module, as shown in Figure 2b. The module is widely available in the commercial market with price around $12. The AD9850 is a highly integrated device that uses advanced DDS technology, digitally programmable frequency synthesizer, and clock generator function. It has capabilities to produce sine and square waves signals 1-volt peak to peak (Vpp) in amplitude and frequency range from DC to 40 MHz. The frequency tuning, control, and phase modulation words are loaded into the AD9850 via a parallel byte or serial loading format. The parallel load format consists of five iterative loads of an 8-bit control word, while serial loading is accomplished via a 40-bit serial data stream on a single pin [34].
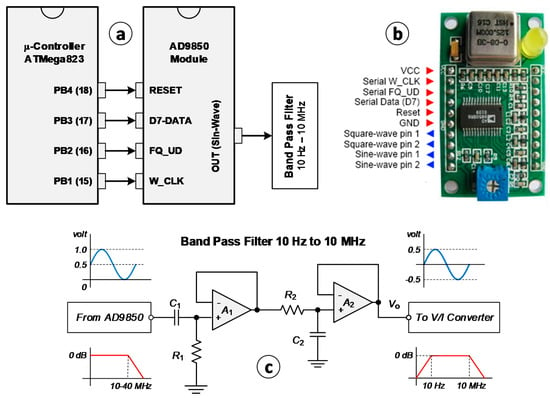
Figure 2.
AD9850-based voltage generator module with frequency range of 10 Hz to 10 MHz.
In this project, the AD9850 module is used to generate sine-wave voltage signals. The determining frequency value is controlled by software that installed on the microcontroller ATMega823 via serial loading format. Figure 2a shows pins connectivity between the AD9850 and the ATMega823. W_CLK is a clock signal for 40-bits serial data streaming, FQ_UD is frequency update signal for new data streaming, D7-Data is 5-bytes data streaming, and RESET is signal to reset the AD9850 to the original state. In here, simple op-amp circuit as shown in Figure 2c is perform a band pass filter (BPF), is used to conditioning the output of AD9850 in ‘pure’ sine wave signal within frequency range of 10 Hz to 10 MHz and amplitude of 0.5 volt.
2.1.2. Voltage to Current (V/I) Converter
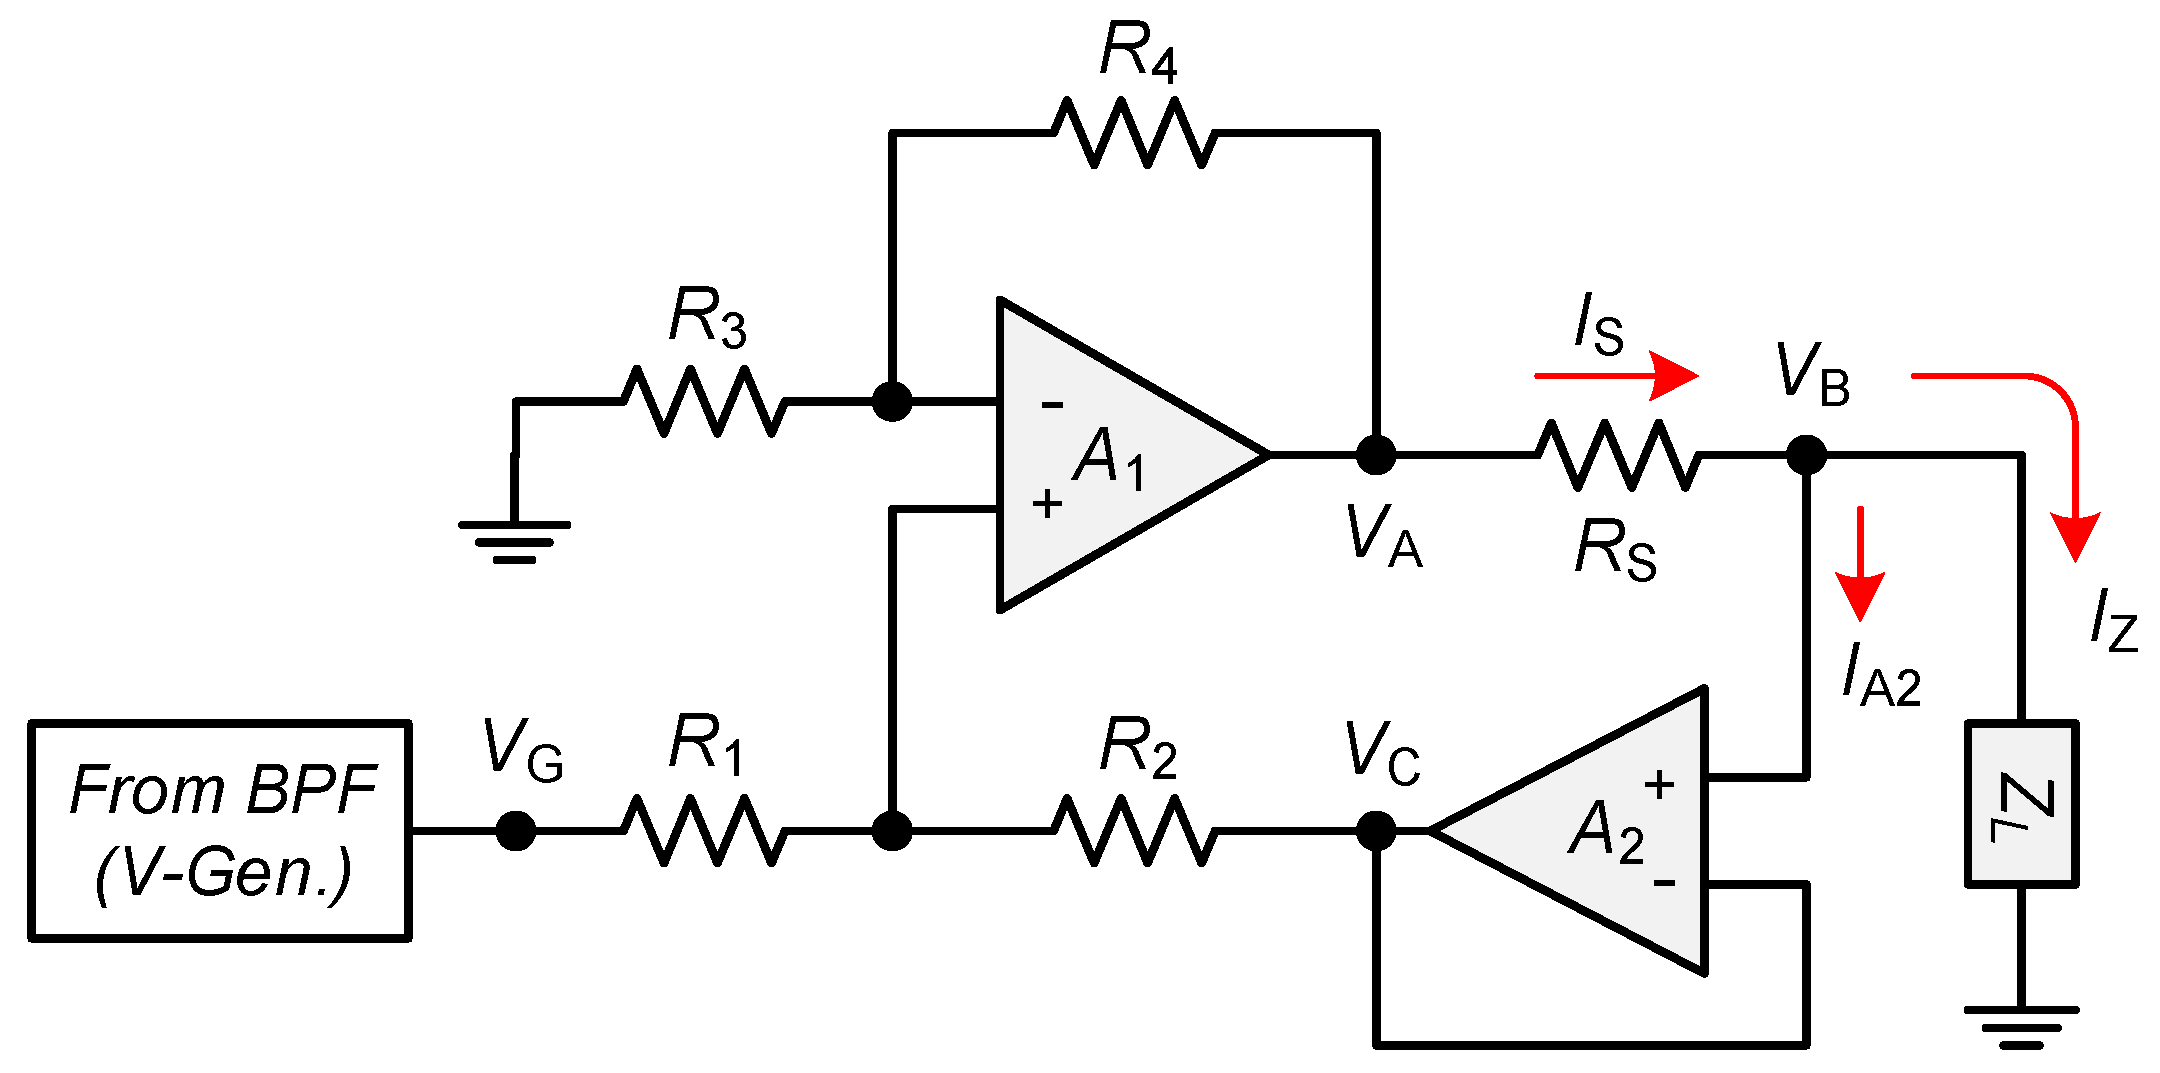
As explained above, in this project we use a current source (not a voltage source) to be injected into biological samples. Therefore, the voltage that has been generated by the voltage generator must be converted to an equivalent current. For this purpose, we use a voltage to current (V/I) converter. There are several types of V/I converter, one of the most popular is Howland current source (HCS). The HCS is a voltage controlled current source (VCCS) with loads connected to the ground. The HCS has advantages in the stability, grounded mode, and simple application method. In this project HCS with buffered feedback path is used, as given in Figure 3. The use of buffered feedback path can provide advantages in high impedance measurements.
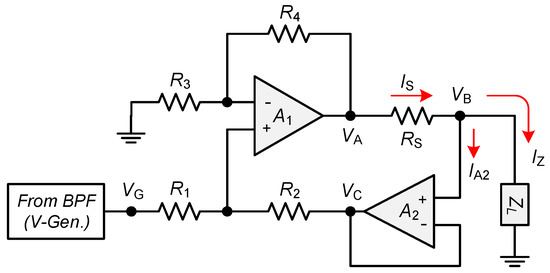
Figure 3.
Howland current source with buffered feedback.
Considering the op-amp role and Kirchhoff law, the output voltage at the point of the circuit in Figure 3 can be obtained
For , then
Current injected to the material load ZL is IZ. According to Kirchhoff’s Current Law (KCL),
IA2 is current entering the A2 op-amp, and for high input impedance op-amp, IA2 ≈ 0, so that
Based on Equation (7), and with VG set constant at 0.5 volts, then the current value is only determined by RS. By selecting RS of 500 kΩ, 50 kΩ, 5 kΩ, and 500 Ω, an IZ current value of 1 μA, 10 μA, 100 μA, and 1 mA will be obtained, respectively. In addition, in this research we use LF357 for op-amp A1 and LF351 for op-amp A2. The LF357 has GBW 20 MHz and input impedance in order TΩ, while the LF351 has GBW of 4 MHz and input impedance in order of TΩ. Both are low-cost JFET input op-amp. In addition, to provide current selector is used an analog multiplexer CD4051, and it is controlled by the microcontroller.
2.2. Unit of Data Acquisition System
Unit of the data acquisition system is tasked to read and record data of current, voltage and phase difference along measuring process. Figure 4 provides a technical illustration of how the data is recorded. RRef is reference resistor, use to ensure that the current measured by the data acquisition system is the actual current that is injected into the sample. The value of the actual current Iz is the voltage on the reference resistor divided by the value of the reference resistor, RRef.
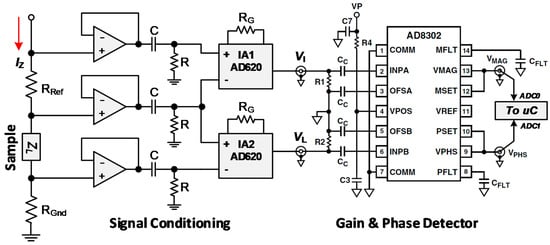
Figure 4.
Data acquisition system: signal conditioning (SC) and gain-phase detector (GPD).
There are two parts in data acquisition system device, i.e., signal conditioning circuit (SC) and gain phase detector (GPD). The SC part perform high impedance buffering, filtering, and amplifying, as required by the GPD. The buffer is an isolation circuit, it serves to ensure that the current and voltage signals are not affected by the circuit afterwards. Each buffer circuit is performed by LF353 op-amp. The RC circuit after buffer forms a high pass filter (HPF). Each HPF is set at 10 Hz cut-off frequency, is to eliminate dc-offset voltage that might arise. Finally, the AD620 instrumentation amplifier (IA) is used in two functions, first is to convert the differential signal to single ended, and second is to amplify the signals (G1 and G2), if needed. To provide voltage gain control through RG selection, is used an analog multiplexer CD4051, and it is controlled by the microcontroller. In addition, the AD620 is low-cost IA with working frequency up to 1 MHz. However, it should be noted that a greater gain will cause the maximum working frequency will also decrease.
Based on the explanation, then the complex impedance values of the measured sample can be calculated as
so that,
Furthermore, in the development of a BIS instrumentation system that can work quickly, the use of GPD devices such as AD8302 as part of a data acquisition system is the right choice. The AD8302 has a very good ability in terms of identifying the gain and phase difference between two signals, from low frequencies up to 2700 MHz [35]. Common configuration the use of AD8302 for gain and phase difference measurement, especially for low frequency operation is shown if Figure 4 above. In the figure, two CC capacitors connected to the OFSA and OFSB pins are the useful components to set high pass corner frequency (fCH) of the measured signals. According to the application note of the AD8302 at low frequency operation [36], formula to calculate fCH is given by
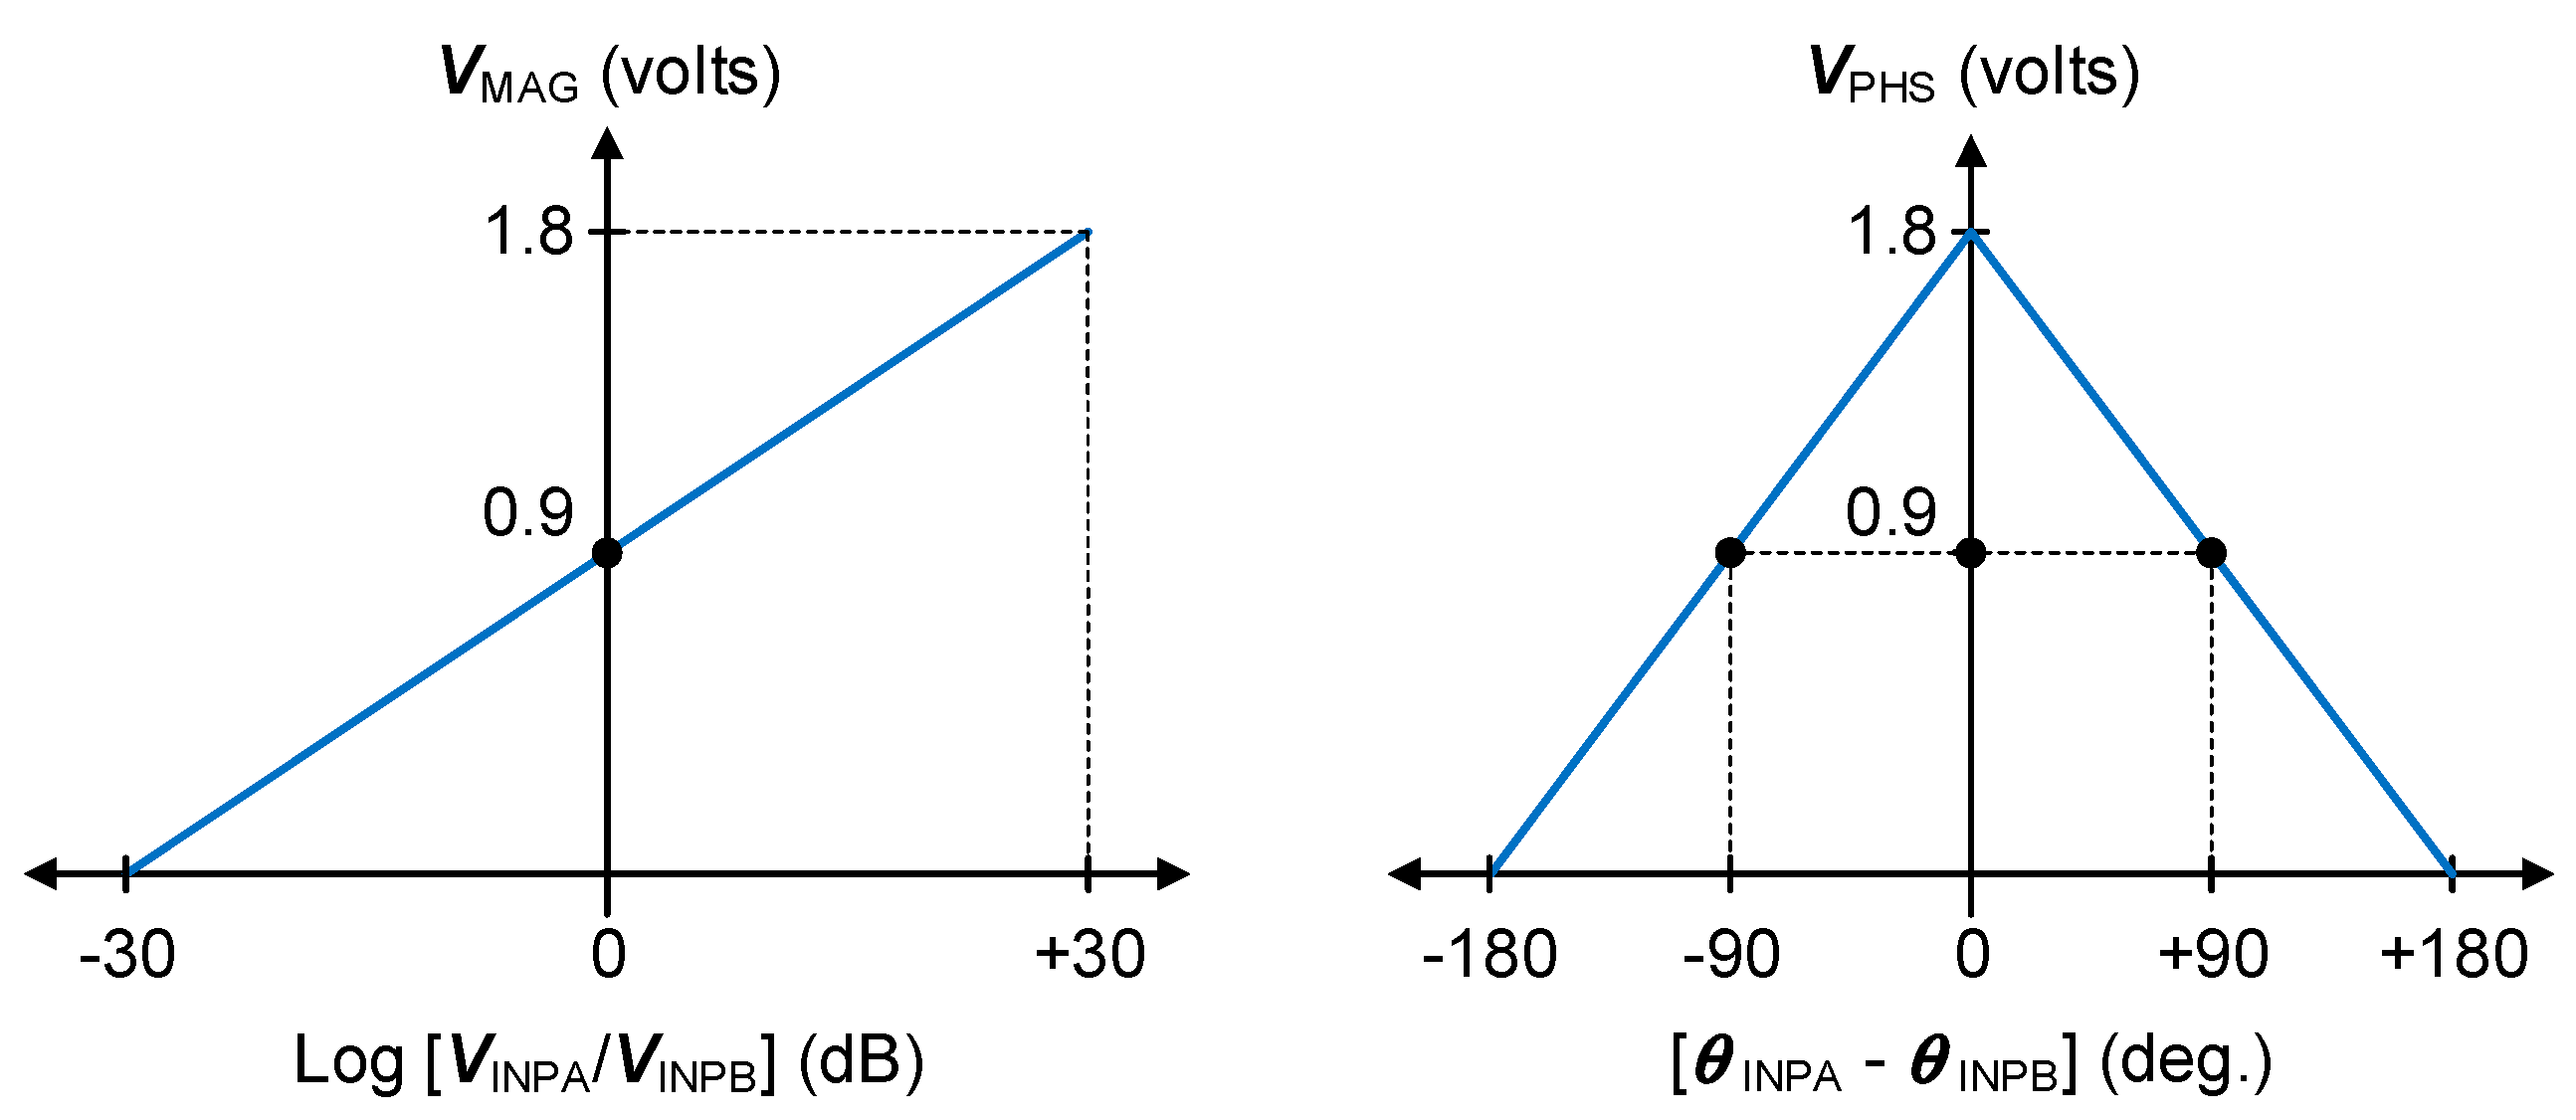
Working principle of the AD8302 is compares the two input voltage signals i.e., VINPA and VINPB, and generates two output voltage signals i.e., VMAG and VPHS. Where the VMAG is output voltage proportional to the decibel ratio of voltage signals applied to INPA and INPB, while the VPHS is output voltage proportional to the phase difference between INPA and INPB. Relationship between input signals (VINPA and VINPB) and output signals (VMAG and VPHS) is as shown in Figure 5. The AD8302 has magnitude measurement range from −30 dB to +30 dB with a sensitivity of 30 mV/dB, and phase measurement range from (−180 to 0) degrees with a sensitivity of 10 mV/degree or (0 to +180) degrees with a sensitivity of −10 mV/degree.
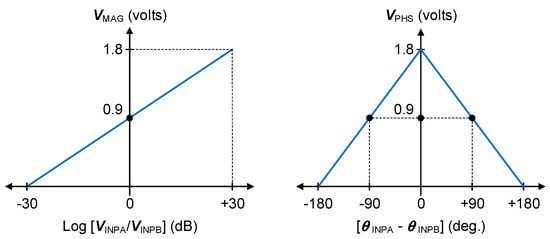
Figure 5.
Relationship between magnitude (dB) to the VMAG, and between phase difference (deg.) to the VPHS.
From Equations (13) and (14), the magnitude (dB) and phase angle (degree) can be written as,
Then, the real and imaginary parts of complex impedance can be written as,
2.3. Software
The software was developed in Delphi, and is used for two purposes. First is for controlling the hardware system, and second is for data analysis and display.
Software for controlling the hardware system is responsible to:
- Determine the value of the current used (1 μA, 10 μA, 100 μA, or 1 mA). This is related to the selection of the RS value that stated in Equation (7).
- Determine low frequency and high frequency limits, and the number of data samples. This is related to the DDS-AD9850 voltage generator programming.
- Determine the voltage gain value of the reference signal and sample signal. This is related to the selection of the RG value to produce G1 and G2 that stated in Equation (10).
Whereas, software for data analysis and display is responsible to:
- Calculation of values of the current, voltage, phase angle, and impedance (using Equations (15) and (16))
- Calculation of real and imaginary parts of impedance (using Equation (17))
- Plot the impedance value in the Bode (magnitude and phase as a function of frequency)
- Plot the impedance value in Nyquist (real part vs. imaginary parts)
3. Results and Discussion
3.1. Prototype of the BIS Instrumentation System
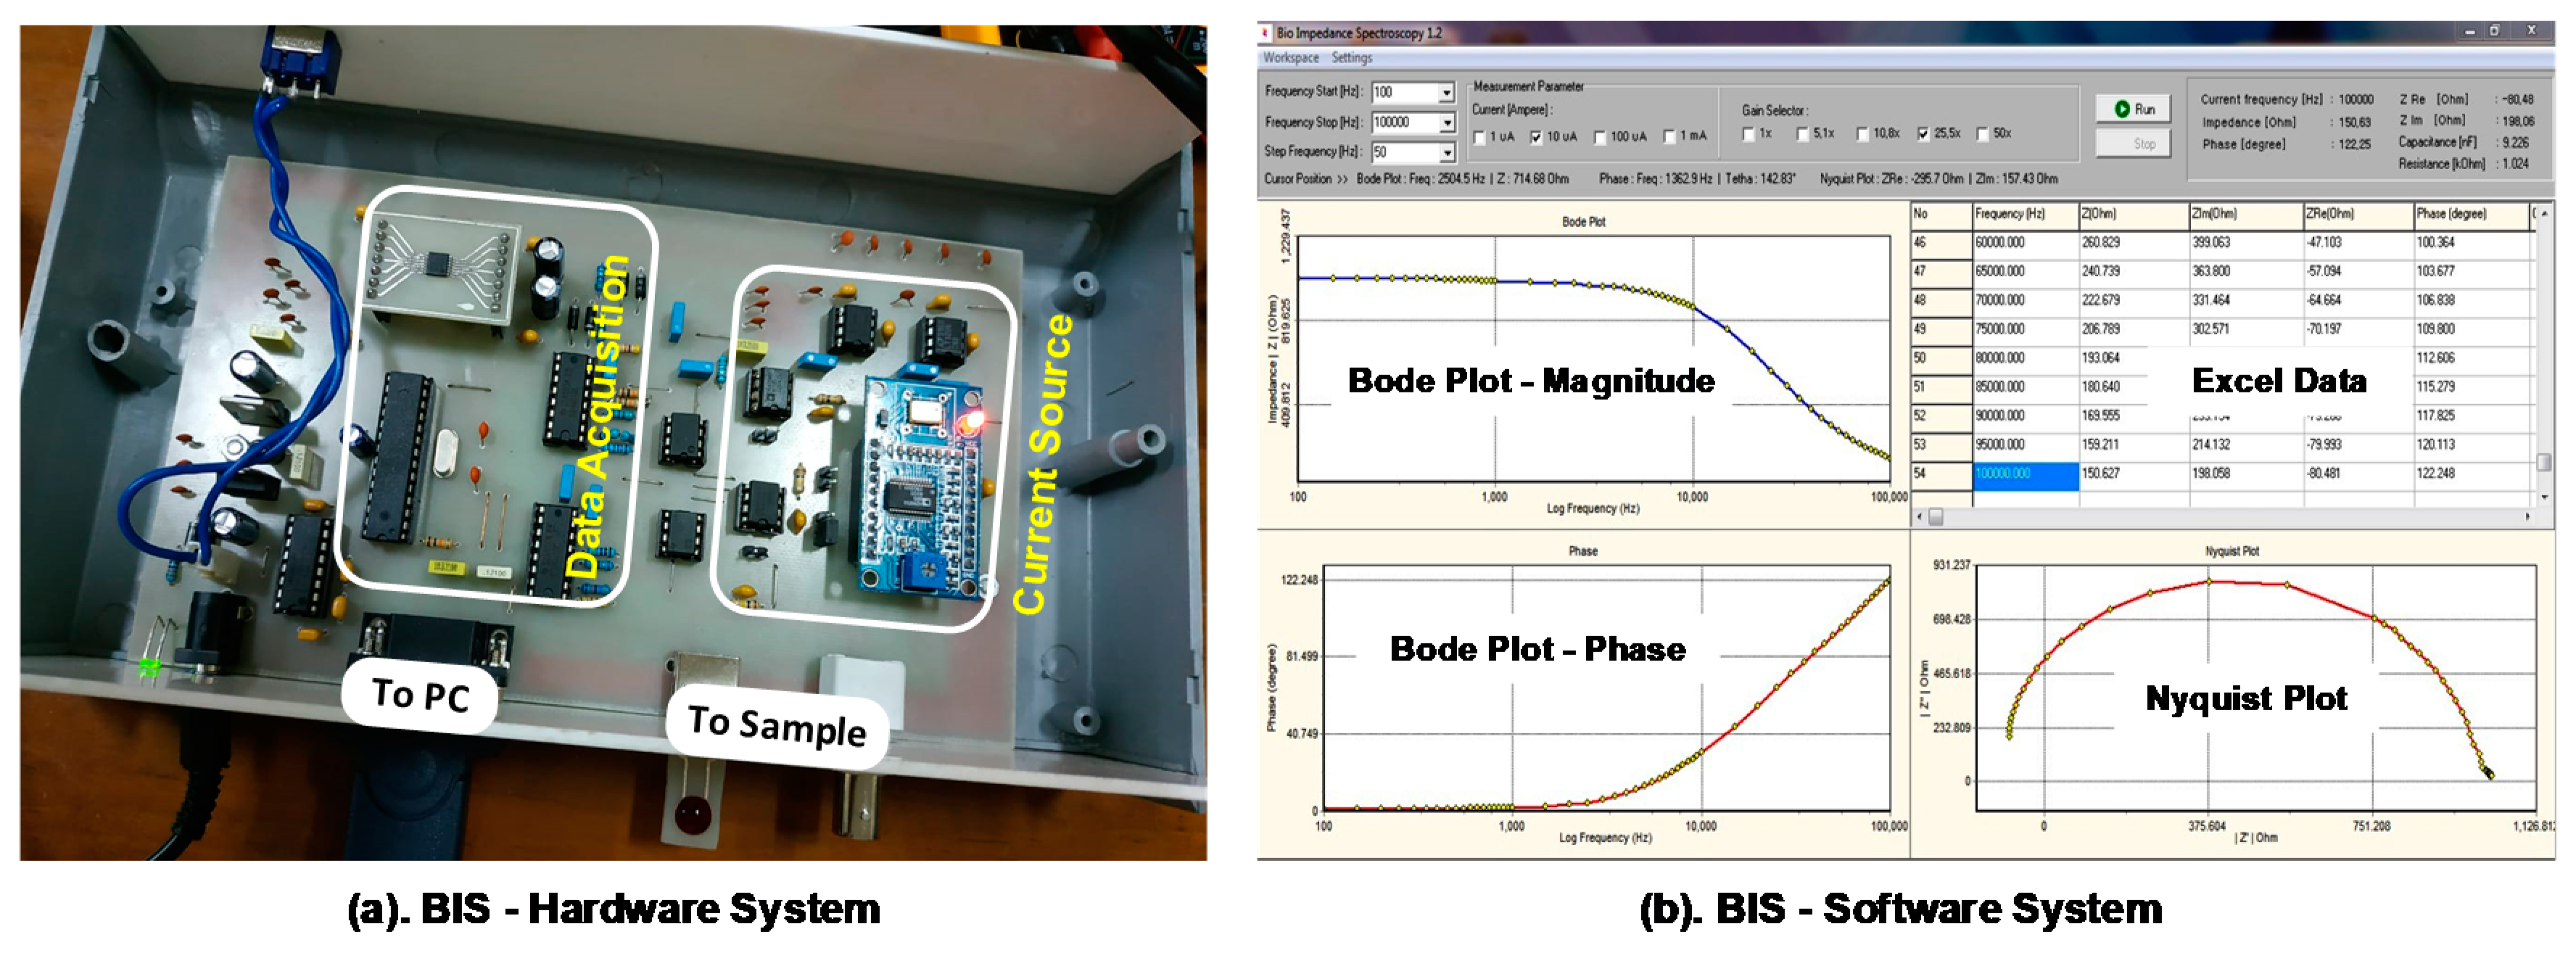
The prototype of the developed BIS instrumentation system is given in Figure 6, where Figure 6a is photo of the hardware system and Figure 6b is main display of the software system. The main unit of the hardware system is current source and data acquisition system. The hardware system is equipped with connectors for biological samples and a connector to the PC as the main control device and data processing and display unit. To inject the current from the BIS device into the biological sample, two types of connectors can be chosen—i.e., female USB and BNC. The female USB connector is used for interdigitated electrodes (IDT), while BNC connectors is used for parallel plates or needle electrodes. In the software section, it provides several pre-acquisition menus such as selecting low and high frequency limits as well as determining the frequency samples, selecting the current value, and selecting the voltage amplification value. At the time of data acquisition, the measurement results are displayed in the form of Bode plots (magnitude and phase-angle), Nyquist plots, and also in MS-Excel table data for further purposes. In addition, the software system also displays the results of calculating the resistance and capacitance values of the samples that are carried out automatically by the program.
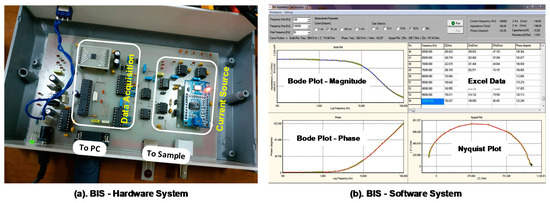
Figure 6.
Prototype of developed BIS instrumentation system: (a) hardware, and (b) software.
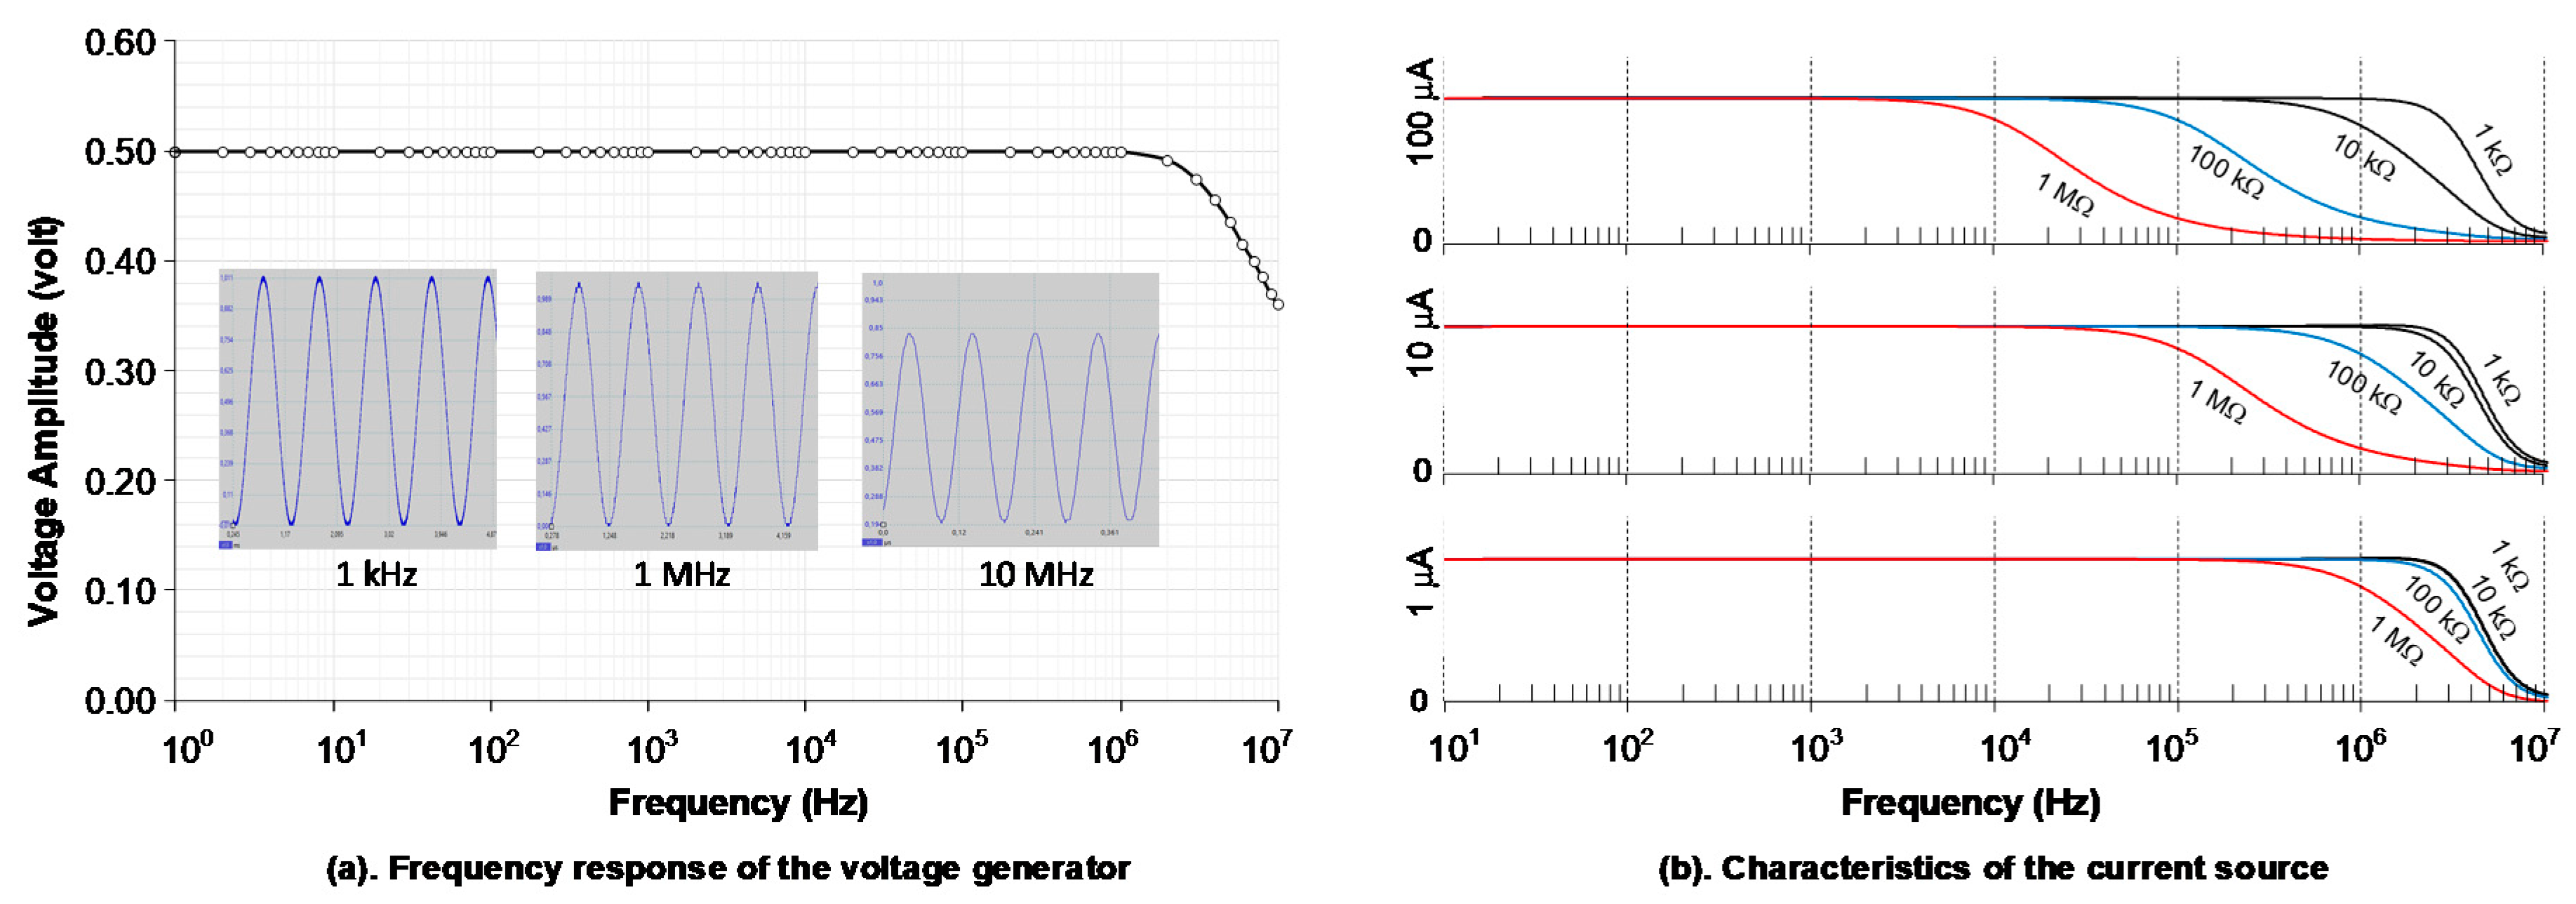
Furthermore, it is important to state the validation results on the BIS instrumentation system that has been made, specifically the performance of the current source and the data acquisition system. Figure 7a shows the characteristics of the voltage generator, that stated in Figure 2, from frequencies of 1 Hz to 10 MHz obtained from the test results. As we can see, the signal has a good and perfect sine wave shape at frequencies of 1 kHz, 1 MHz, and 10 MHz. At low frequencies up to 2 MHz, the signal has an almost constant amplitude of 0.5 volts. However, starting at 2 MHz, the signal amplitude starts to decrease with increasing frequency. So that the voltage generator module can work well in low frequencies up to 2 MHz.
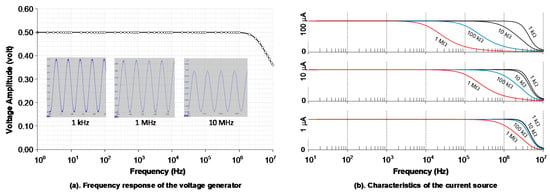
Figure 7.
Current-source characteristics: (a) frequency response of voltage generator, and (b) frequency response of several current values of V/I converter output due to related load.
In the design of a BIS instrumentation system, it is very important to measure the actual current value that is injected into the sample, which can change due to environment such as temperature. In this case, by using a reference resistor (RRef), the actual current value injected into the sample can always be monitored precisely. In terms of impedance measurement, voltage and current characteristics are also greatly influenced by the load connected to them. Figure 7b is characteristic of the current source due to impedance loads within frequency range of 10 Hz to 10 MHz, for current setting of 1 μA, 10 μA, and 100 μA. We can see, although the voltage source to be changed has a flat shape at frequencies up to 2 MHz, but the current will decrease at high frequencies, along with the greater load. In here, the choice of a smaller current will provide benefits in terms of high frequency operations. However, keep in mind that biological tissue commonly has a small impedance value, so the use of a small current will also produce very small voltage. This is where a voltage amplifier device is needed. In addition, with regard to the operating frequency, the BIS system has effective performance in the frequency operation of 100 Hz to 100 kHz. Although the frequency range of 10 Hz to 1 MHz still can be achieved, but it will provide relatively large error, especially in the lower and upper frequency borders.
Moreover, it is important to mention here how to make Bode and Nyquist plots in the BIS system that was developed. In here, Bode and Nyquist plots is carried out per single frequency, and repeated until full frequency cycle has been reached. The procedure for measuring impedance using the developed BIS system including the estimated length of time required is described as below.
- (a)
- The first step is preparing for pre-acquisition; such as determining the current value, the frequency limit, number of sampling frequencies, and voltage gain.
- (b)
- Initialization and generation of sine-voltage at one frequency by the AD9850. The time required, including providing a delay time so that the signal is stable is around 200 ms.
- (c)
- The microcontroller takes 50 pieces of VMAG and VPHS from AD8302 for single-frequency operation and directly sent to the PC. On the PC the data is averaged to get the best data. The time required is around 600 ms.
- (d)
- Calculation the value of ‘mag (dB)’ using Equation (15) and the value of ‘θ (degree)’ using Equation (16). Calculation the value of complex impedance magnitude, real part and imaginary part of complex impedance using Equation (17). Next, plotting the results on the Bode and Nyquist graphs provided. The time required is around 200 ms.
- (e)
- Return (looping) to point (b), until all frequencies stated in point (a) have been completed.
For example, in our experiments we used the frequency range from 100 Hz to 100 kHz, and the sample frequencies were: 100 Hz, 150 Hz, 200 Hz, …, 1 kHz, 1.5 kHz, 2 kHz, …, 10 kHz, 15 kHz, 20 kHz, … 100 kHz (there are 54 sample frequencies). The time needed to measure complex impedances at a single frequency is around 1000 ms (1 s). Thus, the time needed to get the experimental data measured in one full frequency cycle is 54 s (less than 1 min).
3.2. Application Examples
In order to verify the reliability of the developed BIS system, we carry out two kinds experiments with different samples. First experiment used a parallel RC circuit, and the second experiment used liquid solution—i.e., mixed water and milk with different concentration.
3.2.1. Parallel RC Circuit
A parallel RC circuit is the simplest equivalent electrical model of biological tissue. In this experiment, four RC circuit configurations were used, with the R value being fixed at 5.6 kΩ and the C values set different at values of 1 nF, 10 nF, 33 nF, and 47 nF. These values are those listed on the components body. Measurement by using Precision LCR meters ST2830, the following values are obtained R fix is 5.45 kΩ, and C are 0.93 nF, 9.41 nF, 34.15 nF, and 51.46 nF simultaneously.
In the experiment, measurements were made using a BNC connector, with both components soldered directly to the ends of the connector. We use 10 μA current value and several choices voltage amplification. Result of the experiment for each configuration is displayed at the Bode plot, Nyquist plot, and Excel’s data format in real-time. Cumulative results is given in Figure 8 as Bode plot, both in magnitude (ohm) and phase difference (degree). Based on the data in Figure 8, the calculation of component values performed by the program gets the values as shown in Table 1. The comparison of the ‘true values’ and measured values of components give maximum error of 1.5%.

Figure 8.
Bode plot of RC experiments: (a) impedance magnitude (ohm), and (b) phase (degree).

Table 1.
Measurement result and error calculation
3.2.2. Mixed Water and “Yakult” with Different Concentration
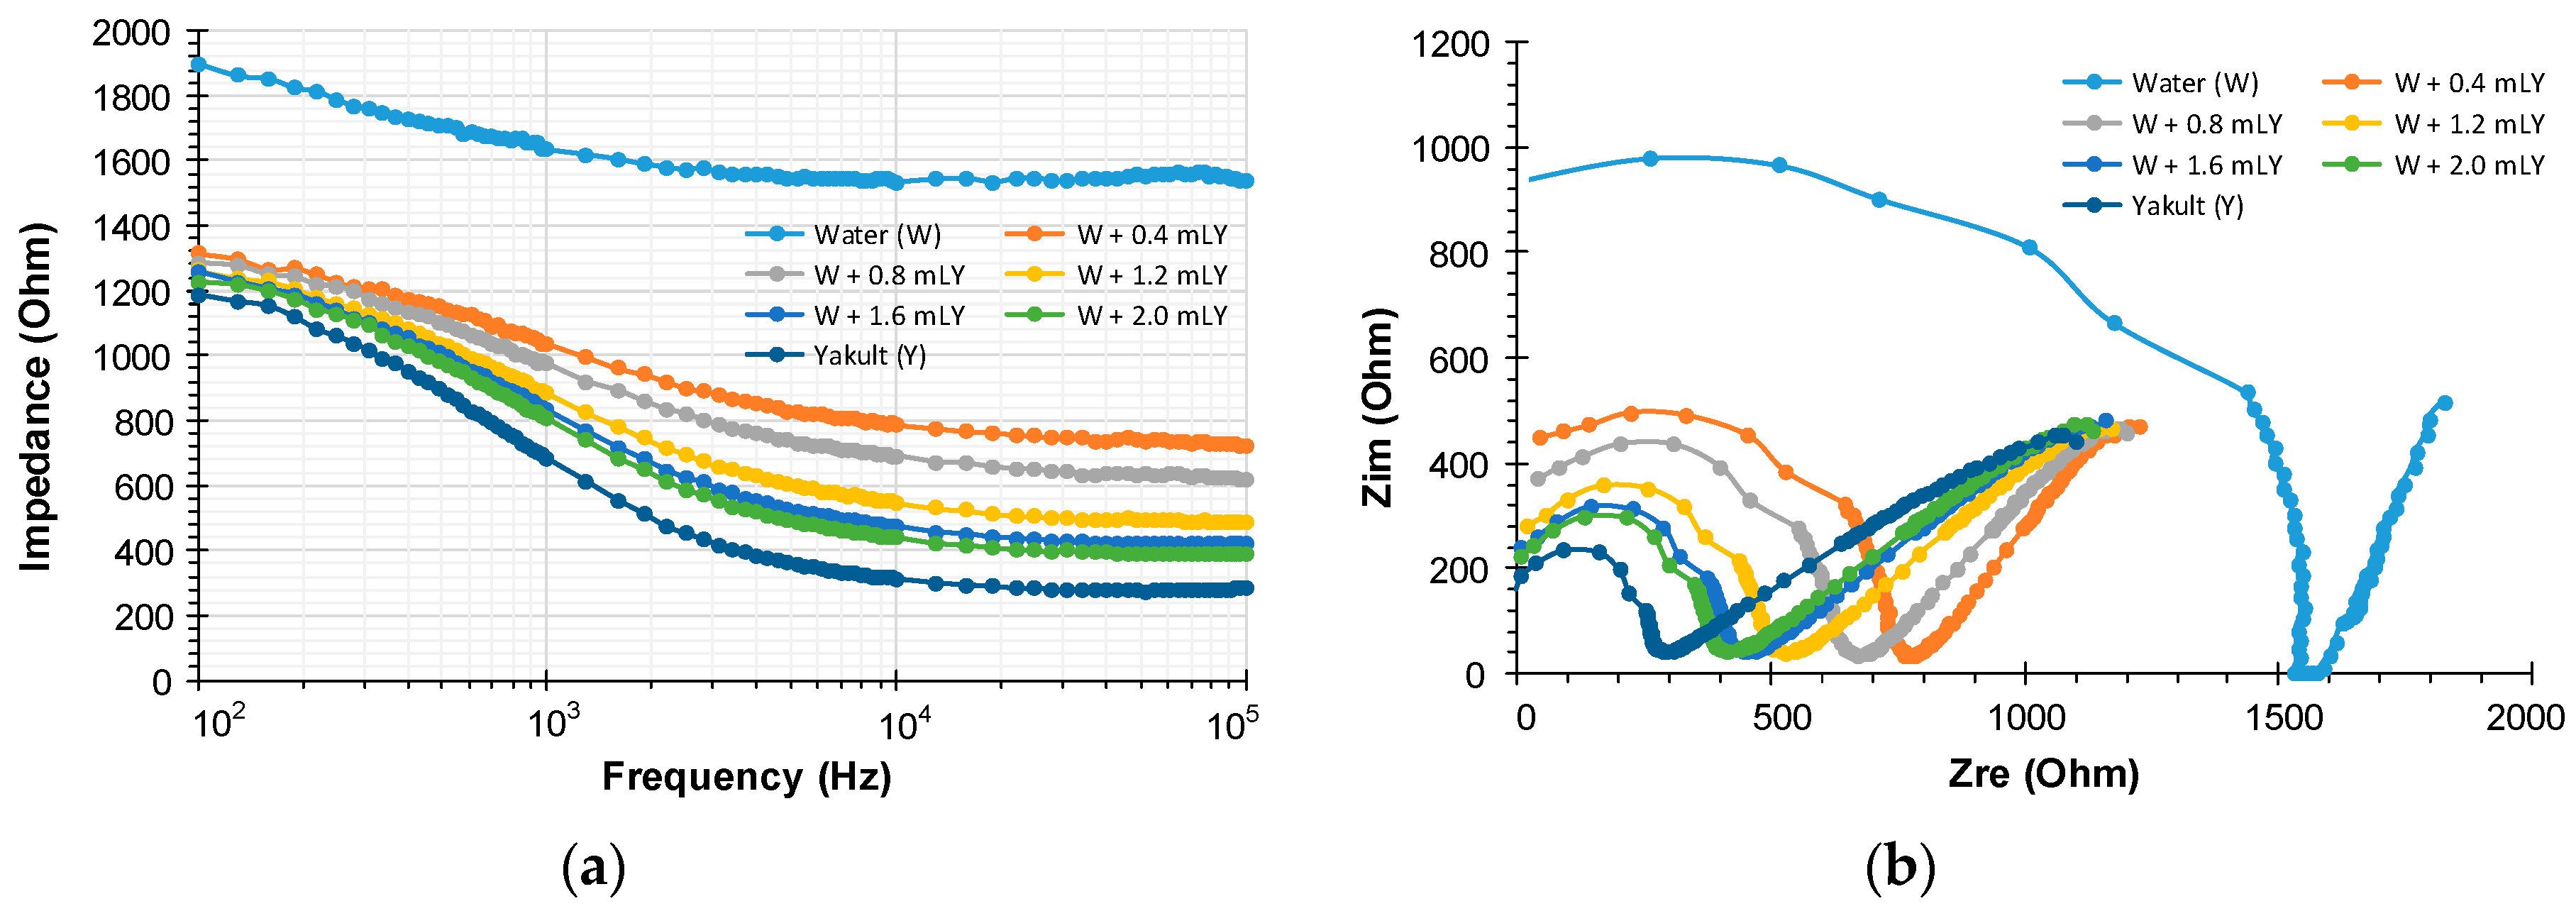
In this experiment we use interdegitated electrode (IDT). The IDT electrode is very suitable for the measurement of impedance of small amounts of liquid material. More about the use of IDT electrodes can be seen in several references, and not discussed in this paper. The liquid sample used in this experiment is a mixture of mineral water and milk (“Yakult”) in several types of concentrations. The experiment results are given in Figure 9.
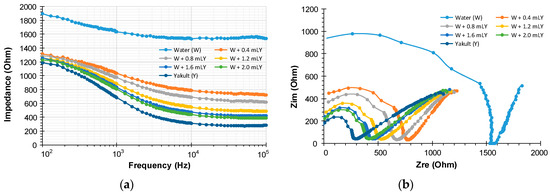
Figure 9.
Impedance values of Yakult solution: (a) in Bode plot, and (b) in Nyquist plot.
Figure 9a presents impedance values of samples in magnitude Bode plot, and Figure 9b is in Nyquist plot. It appears that the electrical impedance of mineral water without Yakult addition has the highest value, this is because water is a material with weak electrolyte properties so the impedance value is relatively high. The addition of Yakult material of 0.4 mL, 0.8 mL, 1.2 mL, 1.6 mL, and 2.0 mL to the water causes the electrical impedance of the mixture liquids to decrease. In here, the greater the volume of Yakult added to the water, the greater the decrease in impedance that occurs. This is because Yakult is an electrolyte solution, so the conductivity of the sample will increase, which means the total resistance or impedance will decrease. Furthermore, using the Nyquist plot given in Figure 9b, we can study the phenomenon of ion transport and bulk electrolyte resistance, which is very important in material characterization by using electrical impedance spectroscopy method.
4. Conclusions
In this research, a low-cost, concise, and fast bioelectrical impedance spectrometer (BIS) system has been successfully developed. This system works with current sources that can be selected through software, with values of 1 μA, 10 μA, 100 μA, and 1 mA. Working frequency that can be achieved is from 10 Hz to 1 MHz, and is optimal in the frequency range of 100 Hz to 100 kHz. This is related to the working ability of GPD-AD8302 at low frequencies, and also the limitations of op-amps in high frequency operations. The results of measurement of complex impedance dispersion of the measured material are displayed in real-time in the form of Bode and Nyquist plots. The use of automatic frequency scanning techniques, the AD8302 GPD device, and the calculation of complex impedance values carried out automatically by software, is the key to this equipment being able to work quickly. To measure the full cycle in a certain frequency range, including displaying the results in the Bode and Nyquist plots, it only takes no more than one minute. The developed BIS system has been tested to measure the complex impedance of an RC circuit, and is able to detect component values with a maximum error of 1.5%. It has also been used to measure the impedance distribution of a solution in different concentrations, and is able to distinguish its concentration very well.
Author Contributions
Conceptualization, D.R.S. and C.S.W.; Methodology, D.R.S., B.P., and U.P.J.; Software, B.P. and D.R.S.; Validation, D.R.S. and C.S.W.; Formal analysis, D.R.S.; Investigation, B.P. and D.R.S.; Resources, D.R.S., C.S.W., and U.P.J.; Writing, B.P. and D.R.S.; Funding acquisition, D.R.S. All authors have read and agreed to the published version of the manuscript.
Funding
Directorate of Research and Community Service, Directorate General of Strengthening for Research and Development, Ministry of Research, Technology and Higher Education, Republic of Indonesia, grant number (167/SP2H/LT/DRPM/2019).
Acknowledgments
Thanks to the Institute of Research and Community Services (LPPM), Brawijaya University, which has supported this research (330.20/N10.C10/PN/2019).
Conflicts of Interest
The authors declare no conflict of interest.
References
- Pérez, P.; Maldonado, A.; Yúfera, A.; Huertas, G.; Rueda, A.; Huertas, J.L. Towards Bio-impedance Based Labs: A Review. J. Electr. Eng. 2016, 4, 116–127. [Google Scholar] [CrossRef]
- Bera, T.K. Bioelectrical impedance methods for noninvasive health monitoring: A review. J. Med. Eng. 2014, 2014. [Google Scholar] [CrossRef] [PubMed]
- Naranjo-Hernández, D.; Reina-Tosina, J.; Min, M. Fundamentals, recent advances, and future challenges in bioimpedance devices for healthcare applications. J. Sens. 2019, 2019. [Google Scholar] [CrossRef]
- Ho, J.S.; Low, J.H.; Sim, L.N.; Webster, R.D.; Rice, S.A.; Fane, A.G.; Coster, H.G.L. In-situ monitoring of biofouling on reverse osmosis membranes: Detection and mechanistic study using electrical impedance spectroscopy. J. Membr. Sci. 2016, 518, 229–242. [Google Scholar] [CrossRef]
- Sarró, E.; Lecina, M.; Fontova, A.; Solà, C.; Gòdia, F.; Cairó, J.J.; Bragós, R. Electrical impedance spectroscopy measurements using a four-electrode configuration improve on-line monitoring of cell concentration in adherent animal cell cultures. Biosens. Bioelectron. 2012, 31, 257–263. [Google Scholar] [CrossRef] [PubMed]
- Xu, Y.; Xie, X.; Duan, Y.; Wang, L.; Cheng, Z.; Cheng, J. A review of impedance measurements of whole cells. Biosens. Bioelectron. 2016, 77, 824–836. [Google Scholar] [CrossRef] [PubMed]
- Mansor, M.A.; Takeuchi, M.; Nakajima, M.; Hasegawa, Y.; Ahmad, M.R. Electrical impedance spectroscopy for detection of cells in suspensions using microfluidic device with integrated microneedles. Appl. Sci. 2017, 7, 170. [Google Scholar] [CrossRef]
- Zhang, F.; Jin, T.; Hu, Q.; He, P. Distinguishing skin cancer cells and normal cells using electrical impedance spectroscopy. J. Electroanal. Chem. 2018, 823, 531–536. [Google Scholar] [CrossRef]
- Asami, K. Low-frequency dielectric dispersion of bacterial cell suspensions. Colloids Surf. B Biointerfaces 2014, 119, 1–5. [Google Scholar] [CrossRef]
- Pal, N.; Sharma, S.; Gupta, S. Sensitive and rapid detection of pathogenic bacteria in small volumes using impedance spectroscopy technique. Biosens. Bioelectron. 2016, 77, 270–276. [Google Scholar] [CrossRef]
- Jinyang, L.; Meiqing, L.; Hanping, M.; Wenjing, Z. Diagnosis of potassium nutrition level in Solanum lycopersicum based on electrical impedance. Biosyst. Eng. 2016, 147, 130–138. [Google Scholar] [CrossRef]
- El Khaled, D.; Castellano, N.N.; Gazquez, J.A.; García Salvador, R.M.; Manzano-Agugliaro, F. Cleaner quality control system using bioimpedance methods: A review for fruits and vegetables. J. Clean. Prod. 2017, 140, 1749–1762. [Google Scholar] [CrossRef]
- Soares, C.; Tenreiro Machado, J.A.; Lopes, A.M.; Vieira, E.; Delerue-Matos, C. Electrochemical impedance spectroscopy characterization of beverages. Food Chem. 2020, 302, 125345. [Google Scholar] [CrossRef] [PubMed]
- Chowdhury, A.; Singh, P.; Bera, T.K.; Ghoshal, D.; Chakraborty, B. Electrical impedance spectroscopic study of mandarin orange during ripening. J. Food Meas. Charact. 2017, 11, 1654–1664. [Google Scholar] [CrossRef]
- Grossi, M.; Lecce, G.D.; Toschi, T.G.; Riccò, B. Fast and accurate determination of olive oil acidity by electrochemical impedance spectroscopy. IEEE Sens. J. 2014, 14, 2947–2954. [Google Scholar] [CrossRef]
- Aitzaz, A.M.; Kim, J.; Kim, T.; Park, K.D.; Cho, S. Electrical characterization of pork tissue measured by a monopolar injection needle and discrete fourier transform based impedance measurement. Appl. Sci. 2019, 9, 4049. [Google Scholar] [CrossRef]
- Pradhan, R.; Mitra, A.; Das, S. Impedimetric characterization of human blood using three-electrode based ECIS devices. J. Electr. Bioimpedance 2012, 3, 12–19. [Google Scholar] [CrossRef]
- Addabbo, T.; Fort, A.; Mugnaini, M.; Parri, L.; Pinzi, M.; Vignoli, V.; Mvemba, P.K.; Becatti, M.; Barygina, V.; Taddei, N.; et al. On the Suitability of Low-Cost Compact Instrumentation for Blood Impedance Measurements. IEEE Trans. Instrum. Meas. 2019, 68, 2412–2424. [Google Scholar] [CrossRef]
- Bohli, N.; Chammem, H.; Meilhac, O.; Mora, L.; Abdelghani, A. Electrochemical Impedance Spectroscopy on Interdigitated Gold Microelectrodes for Glycosylated Human Serum Albumin Characterization. IEEE Trans. Nanobiosci. 2017, 16, 676–681. [Google Scholar] [CrossRef]
- Sanchez, B.; Vandersteen, G.; Martin, I.; Castillo, D.; Torrego, A.; Riu, P.J.; Schoukens, J.; Bragos, R. In vivo electrical bioimpedance characterization of human lung tissue during the bronchoscopy procedure. A feasibility study. Med. Eng. Phys. 2013, 35, 949–957. [Google Scholar] [CrossRef]
- Zarafshani, A.; Bach, T.; Chatwin, C.R.; Tang, S.; Xiang, L.; Zheng, B. Conditioning Electrical Impedance Mammography System. Meas. J. Int. Meas. Confed. 2018, 116, 38–48. [Google Scholar] [CrossRef]
- Salazar-Anguiano, J.; Chávez-López, M.G.; Zúñiga-García, V.; Camacho, J.; Elías-Viñas, D. Resistive Part of Impedance as a Possible Indicator of Hepatocellular Carcinoma. Arch. Med. Res. 2018, 49, 89–93. [Google Scholar] [CrossRef] [PubMed]
- Zink, M.D.; Weyer, S.; Pauly, K.; Napp, A.; Dreher, M.; Leonhardt, S.; Marx, N.; Schauerte, P.; Mischke, K. Feasibility of bioelectrical impedance spectroscopy measurement before and after thoracentesis. BioMed Res. Int. 2015, 2015. [Google Scholar] [CrossRef] [PubMed]
- Freeborn, T.; Fu, B. Fatigue-Induced Cole Electrical Impedance Model Changes of Biceps Tissue Bioimpedance. Fractal Fract. 2018, 2, 27. [Google Scholar] [CrossRef]
- Ben Hamed, K.; Zorrig, W.; Hamzaoui, A.H. Electrical impedance spectroscopy: A tool to investigate the responses of one halophyte to different growth and stress conditions. Comput. Electron. Agric. 2016, 123, 376–383. [Google Scholar] [CrossRef]
- Bertemes-Filho, P.; Felipe, A.; Vincence, V.C. High Accurate Howland Current Source: Output Constraints Analysis. Circuits Syst. 2013, 04, 451–458. [Google Scholar] [CrossRef]
- Chen, T.A.; Wu, W.J.; Wei, C.L.; Darling, R.B.; Liu, B. Da Novel 10-Bit Impedance-To-Digital Converter for Electrochemical Impedance Spectroscopy Measurements. IEEE Trans. Biomed. Circuits Syst. 2017, 11, 370–379. [Google Scholar] [CrossRef]
- Mohamadou, Y.; Momo, F.; Theophile, L.; Njike Kouekeu Landry, C.; Fabrice, T.; Emmanuel, S. Accuracy enhancement in low frequency gain and phase detector (AD8302) based bioimpedance spectroscopy system. Meas. J. Int. Meas. Confed. 2018, 123, 304–308. [Google Scholar] [CrossRef]
- Jiang, Z.; Yao, J.; Wang, L.; Wu, H.; Huang, J.; Zhao, T.; Takei, M. Development of a Portable Electrochemical Impedance Spectroscopy System for Bio-Detection. IEEE Sens. J. 2019, 19, 5979–5987. [Google Scholar] [CrossRef]
- Bouchaala, D.; Fendri, A. Handheld Bioimpedance Spectrometer for the Total Frequency Range of the E -Dispersion. Proc. Sens. 2013, 2013, 175–180. [Google Scholar] [CrossRef]
- Mylott, E.; Kutschera, E.; Widenhorn, R. Bioelectrical impedance analysis as a laboratory activity: At the interface of physics and the body. Am. J. Phys. 2014, 82, 521–528. [Google Scholar] [CrossRef]
- Grassini, S.; Corbellini, S.; Angelini, E.; Ferraris, F.; Parvis, M. Low-cost impedance spectroscopy system based on a logarithmic amplifier. IEEE Trans. Instrum. Meas. 2015, 64, 1110–1117. [Google Scholar] [CrossRef]
- Jiang, H.; Sun, A.; Venkatesh, A.G.; Hall, D.A. An audio jack-based electrochemical impedance spectroscopy sensor for point-of-care diagnostics. IEEE Sens. J. 2017, 17, 589–597. [Google Scholar] [CrossRef] [PubMed]
- Analog Devices. CMOS 125 MHz Complete DDS Synthesizer; AD9850 Datasheet. 2004. Available online: https://www.analog.com/media/en/technical-documentation/data-sheets/AD9850.pdf (accessed on 22 January 2020).
- Analog Devices. LF-2.7 GHz RF/IF Gain and Phase Detector; AD8302 Datasheet. 2018. Available online: https://www.analog.com/media/en/technical-documentation/data-sheets/ad8302.pdf (accessed on 22 January 2020).
- Pilotte, M. Operation of RF Detector Products at Low Frequency; AN-691 Application Note; Analog Devices: Norwood, MA, USA, 2005; Available online: https://www.analog.com/media/en/technical-documentation/application-notes/AN-691.pdf (accessed on 22 January 2020).
© 2020 by the authors. Licensee MDPI, Basel, Switzerland. This article is an open access article distributed under the terms and conditions of the Creative Commons Attribution (CC BY) license (http://creativecommons.org/licenses/by/4.0/).


