Correlation between Bone Turnover Markers and Bone Mineral Density in Patients Undergoing Long-Term Anti-Osteoporosis Treatment: A Systematic Review and Meta-Analysis


Abstract
Featured Application
Abstract
1. Introduction
2. Materials and Methods
2.1. Search Strategy
2.2. Eligibility and Exclusion Criteria
2.3. Data Abstraction
2.4. Quality Assessment and Potential Bias
2.5. Statistical Analysis
3. Results
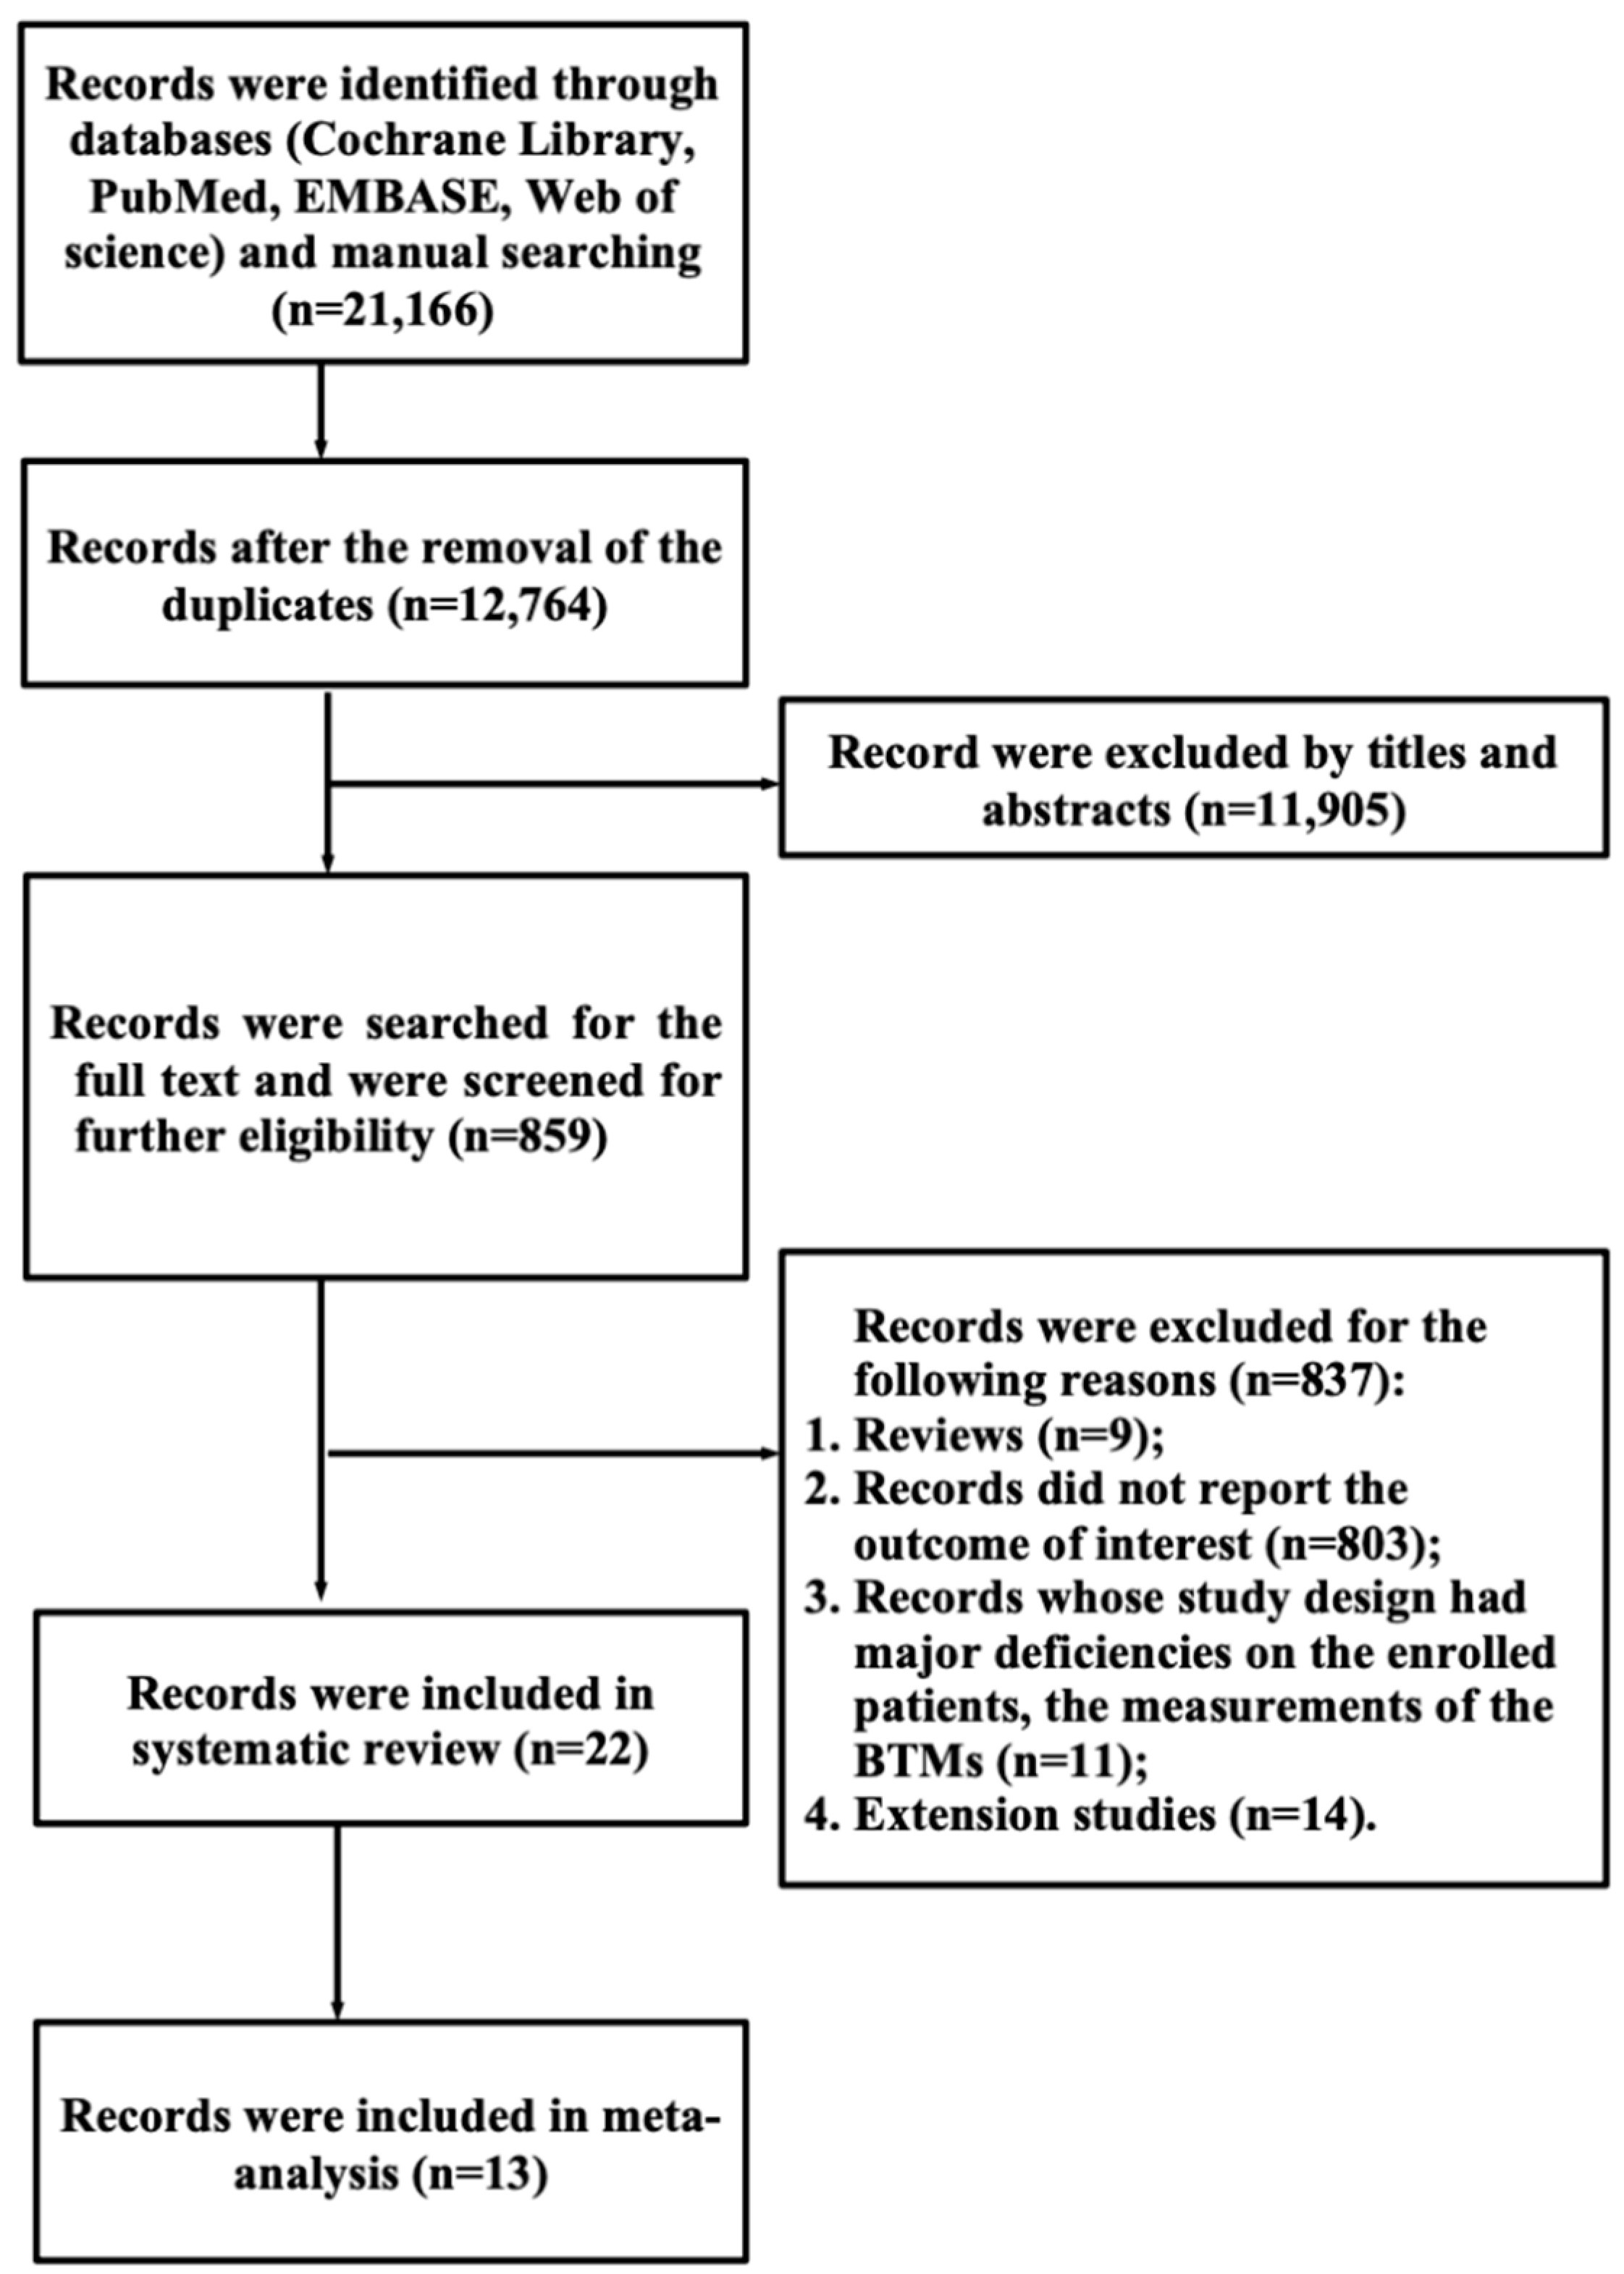
3.1. Search Results
3.2. Study Characteristics
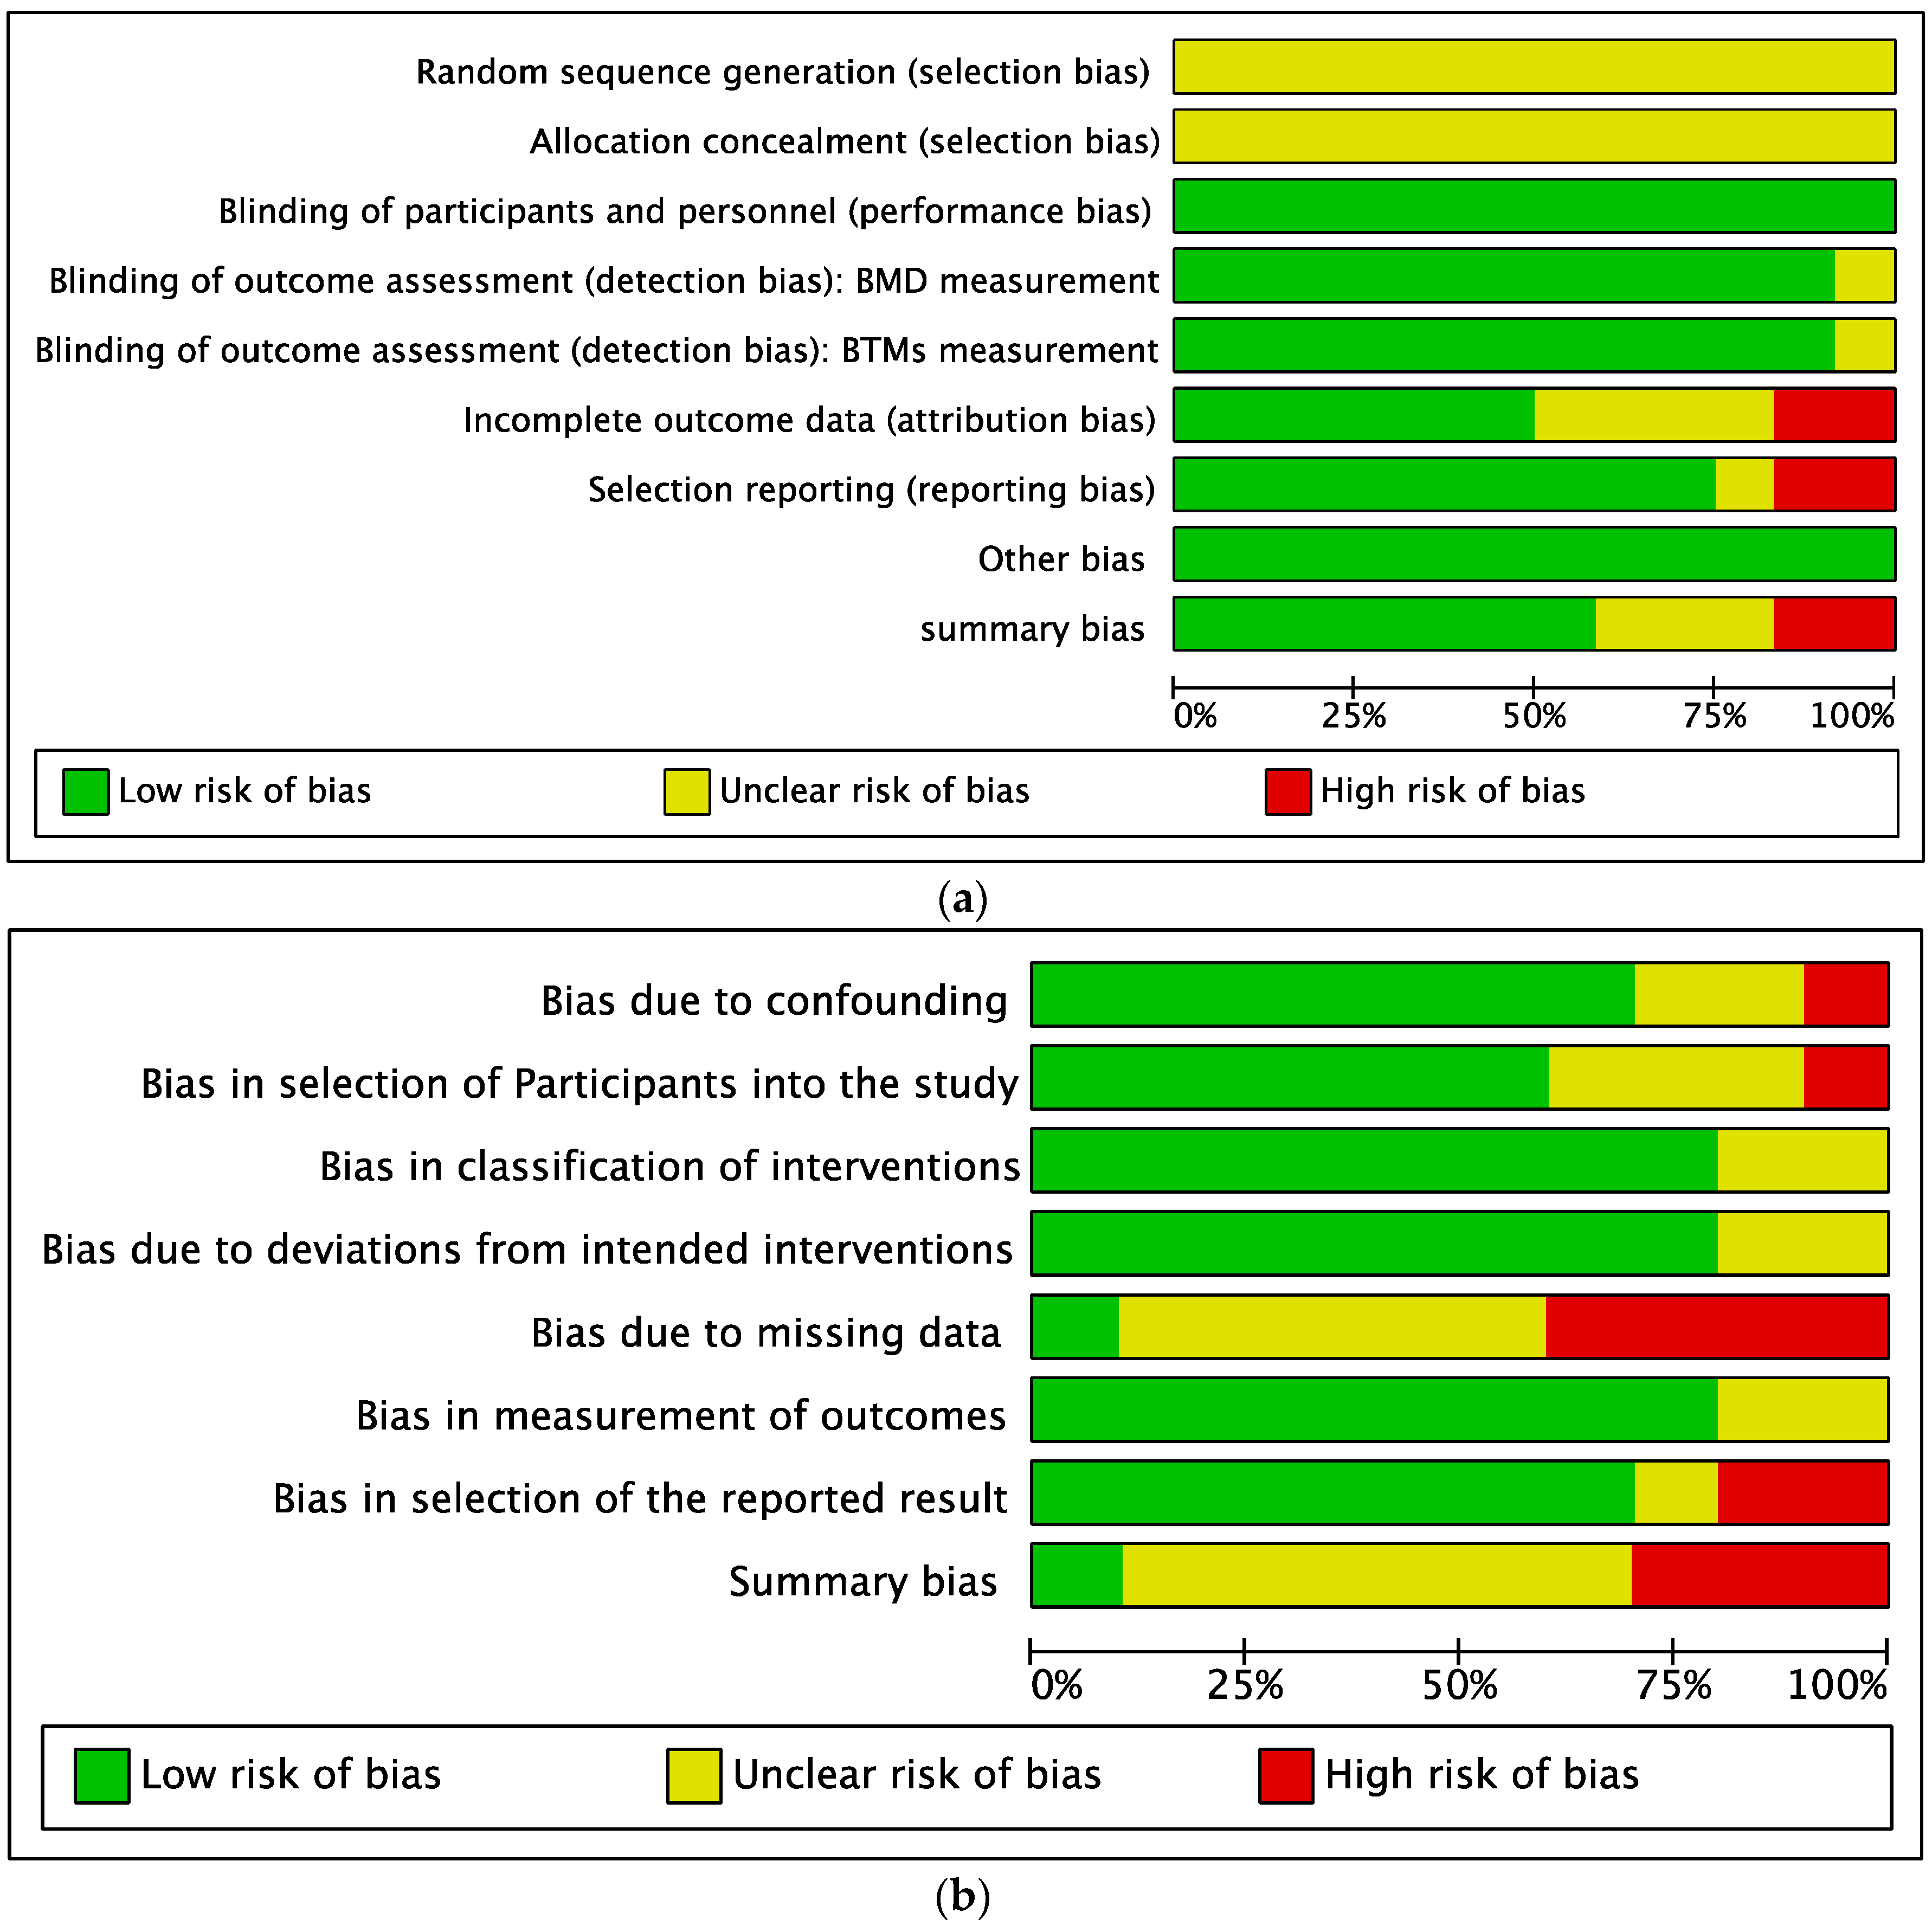
3.3. Quality Assessment of the Eligible Studies
3.4. Findings from the Systematic Review
3.4.1. Pretreatment BTMs and BMD Changes after Drug Intervention
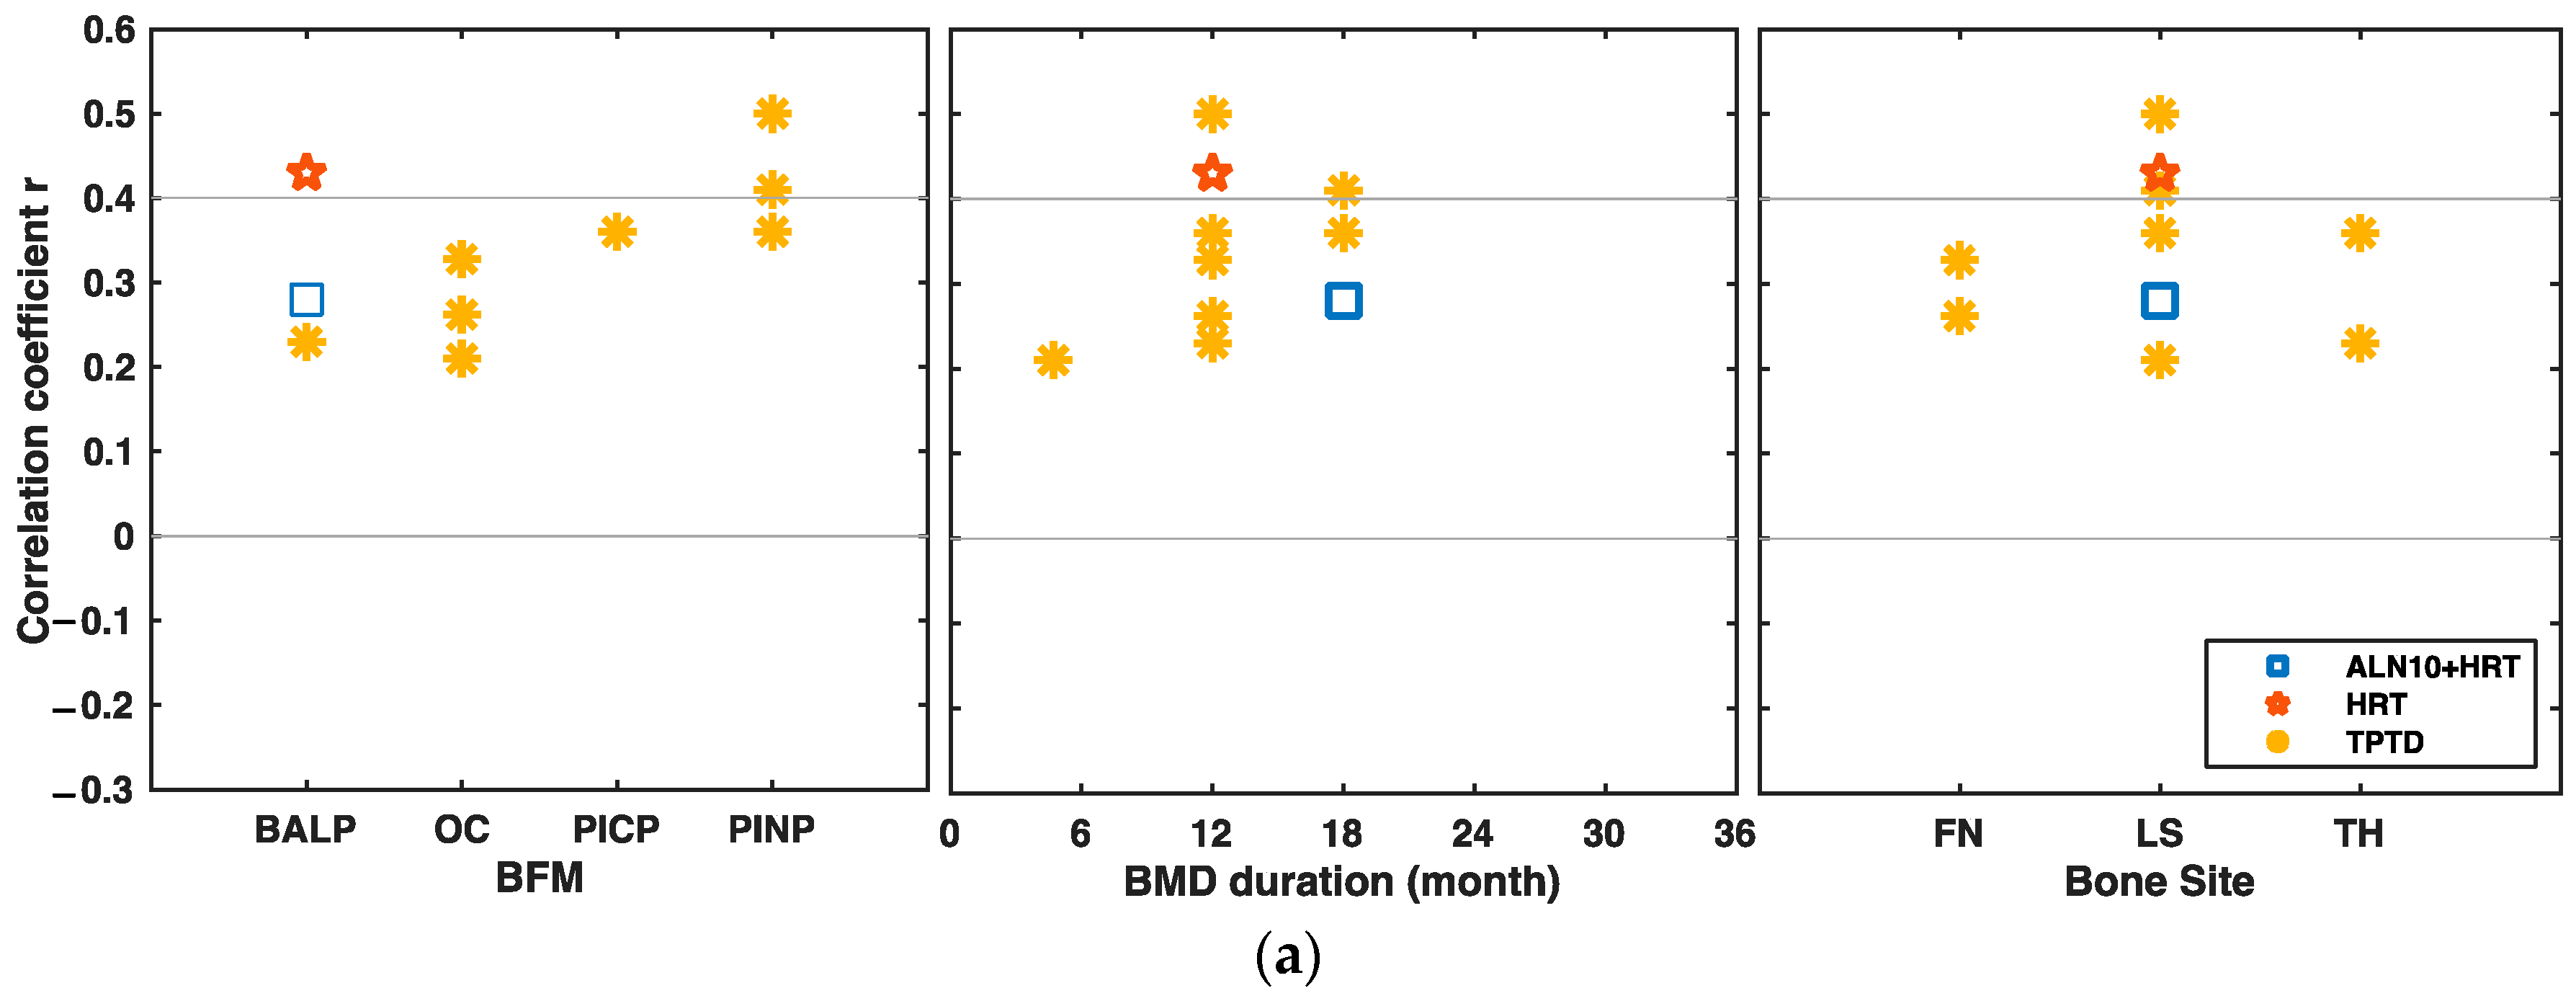
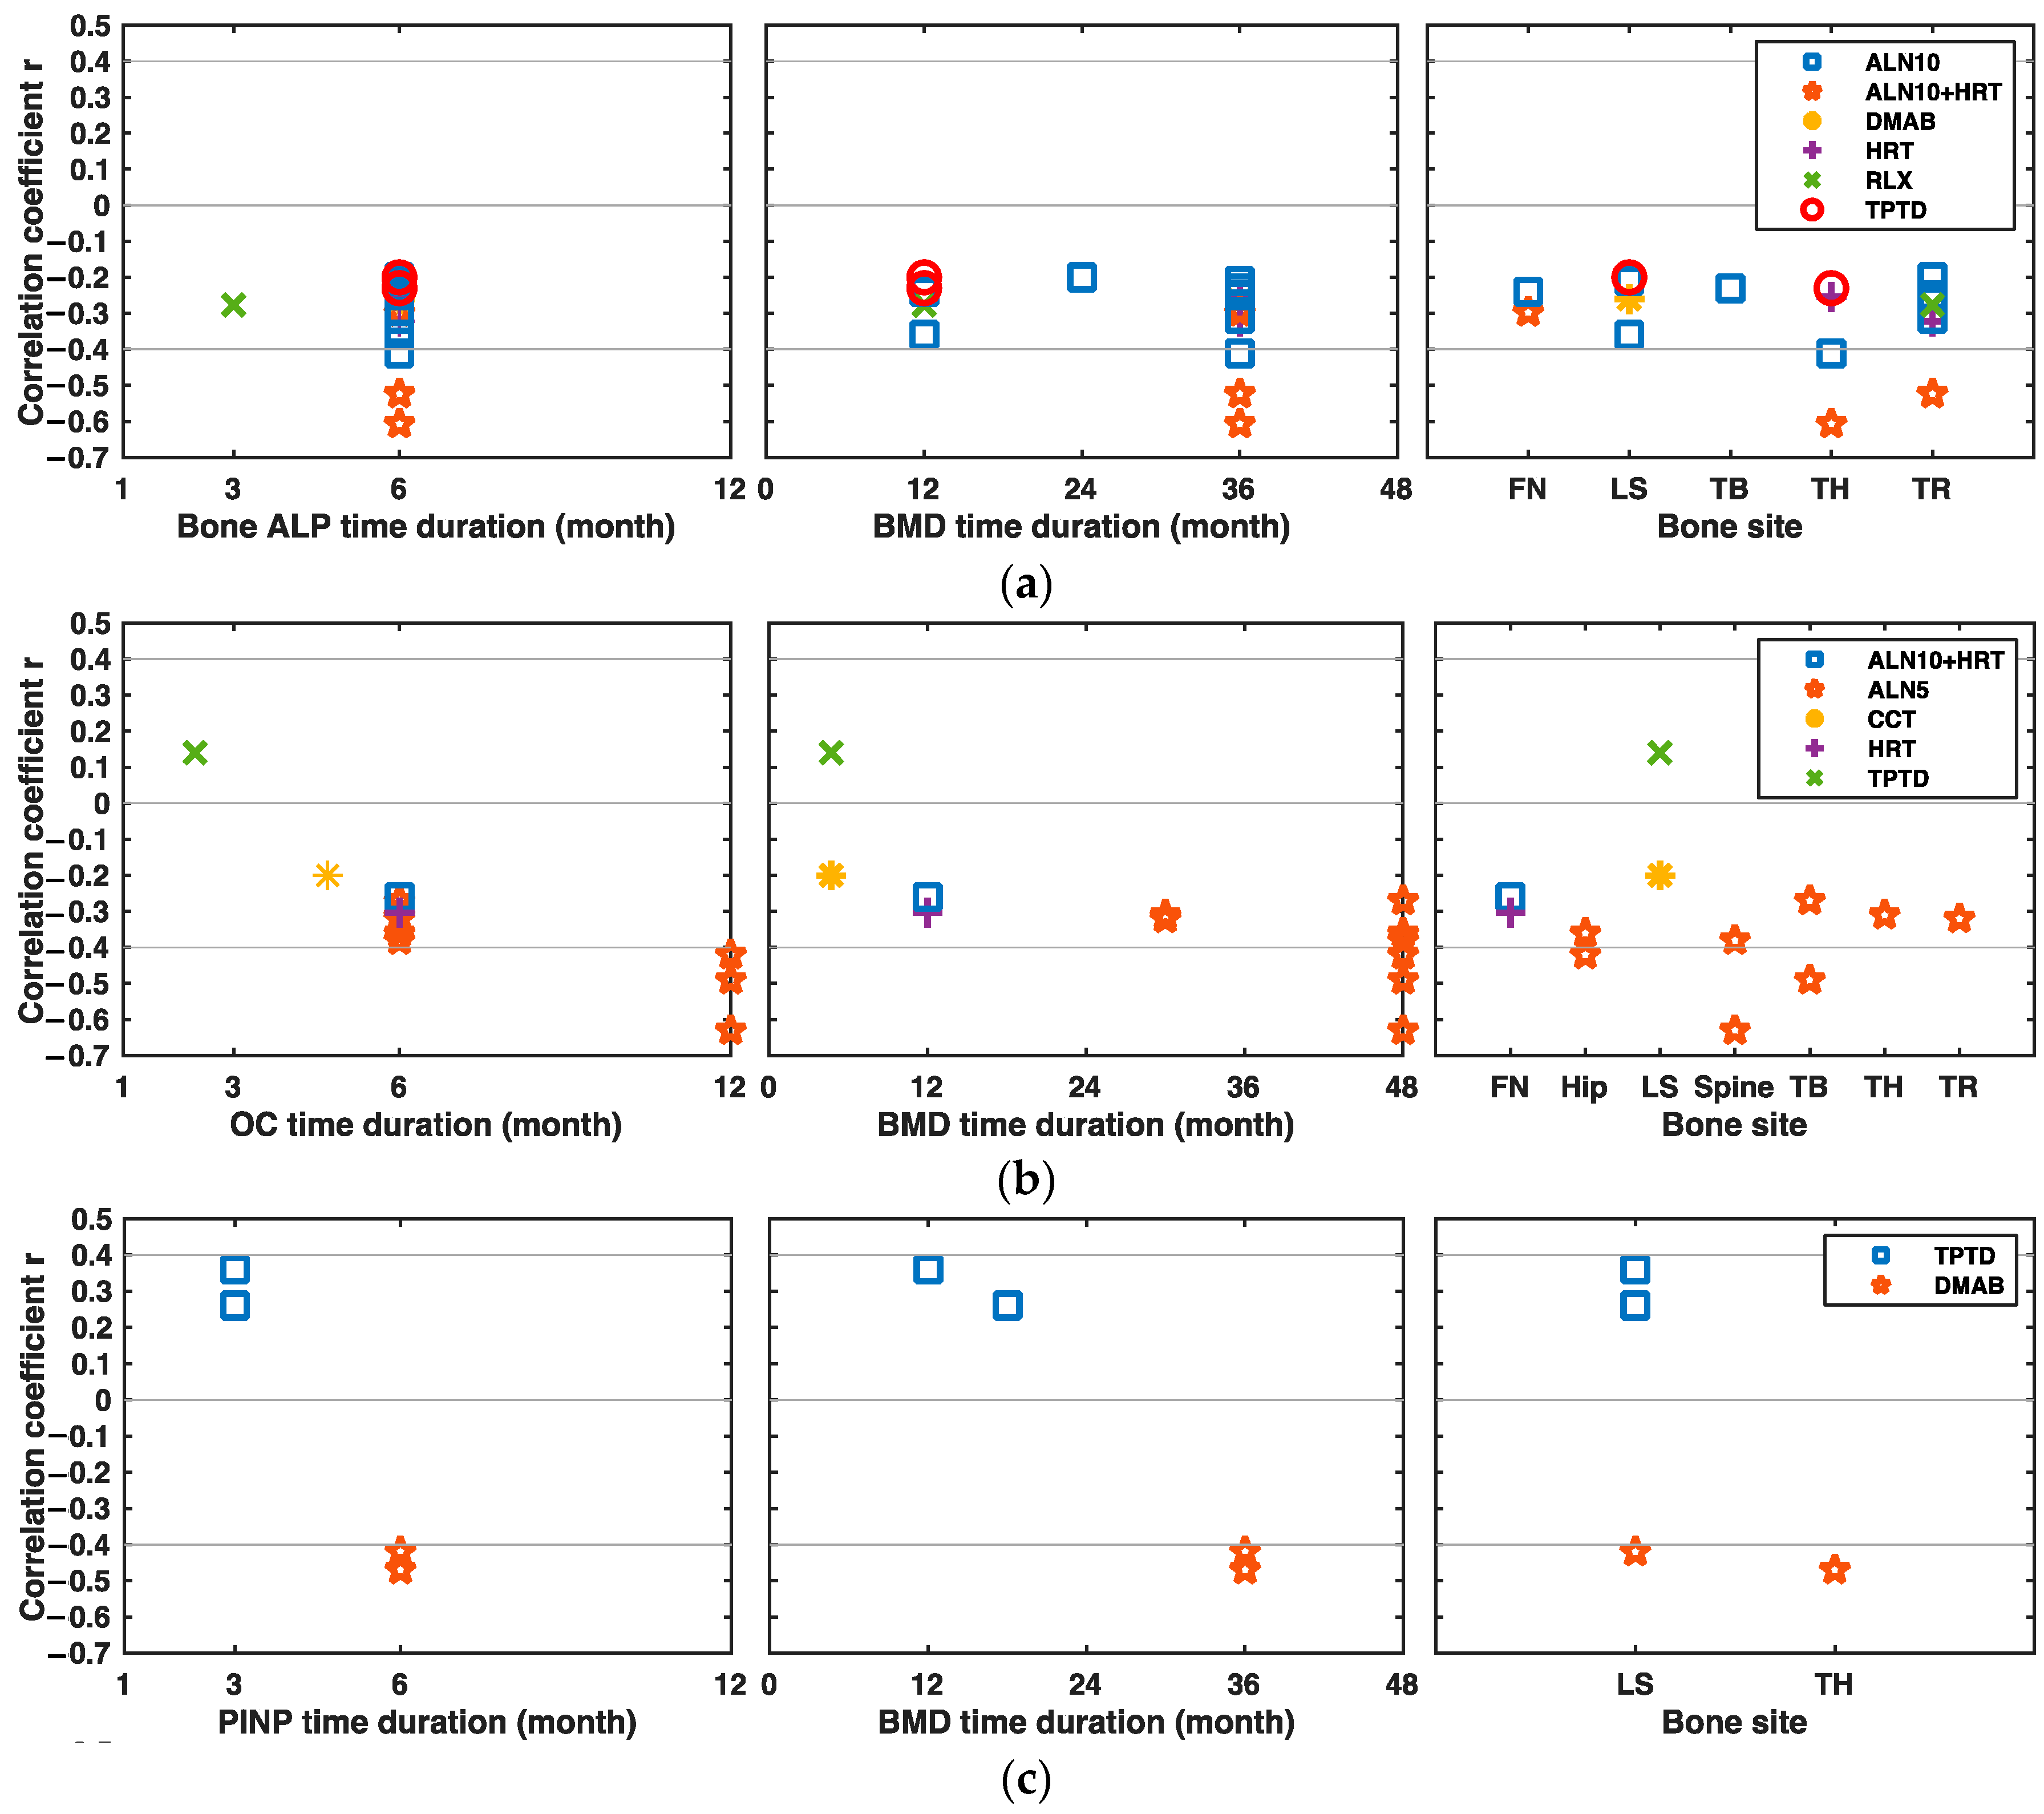
3.4.2. Changes in Markers of Bone Formation and Changes in BMD after Drug Intervention
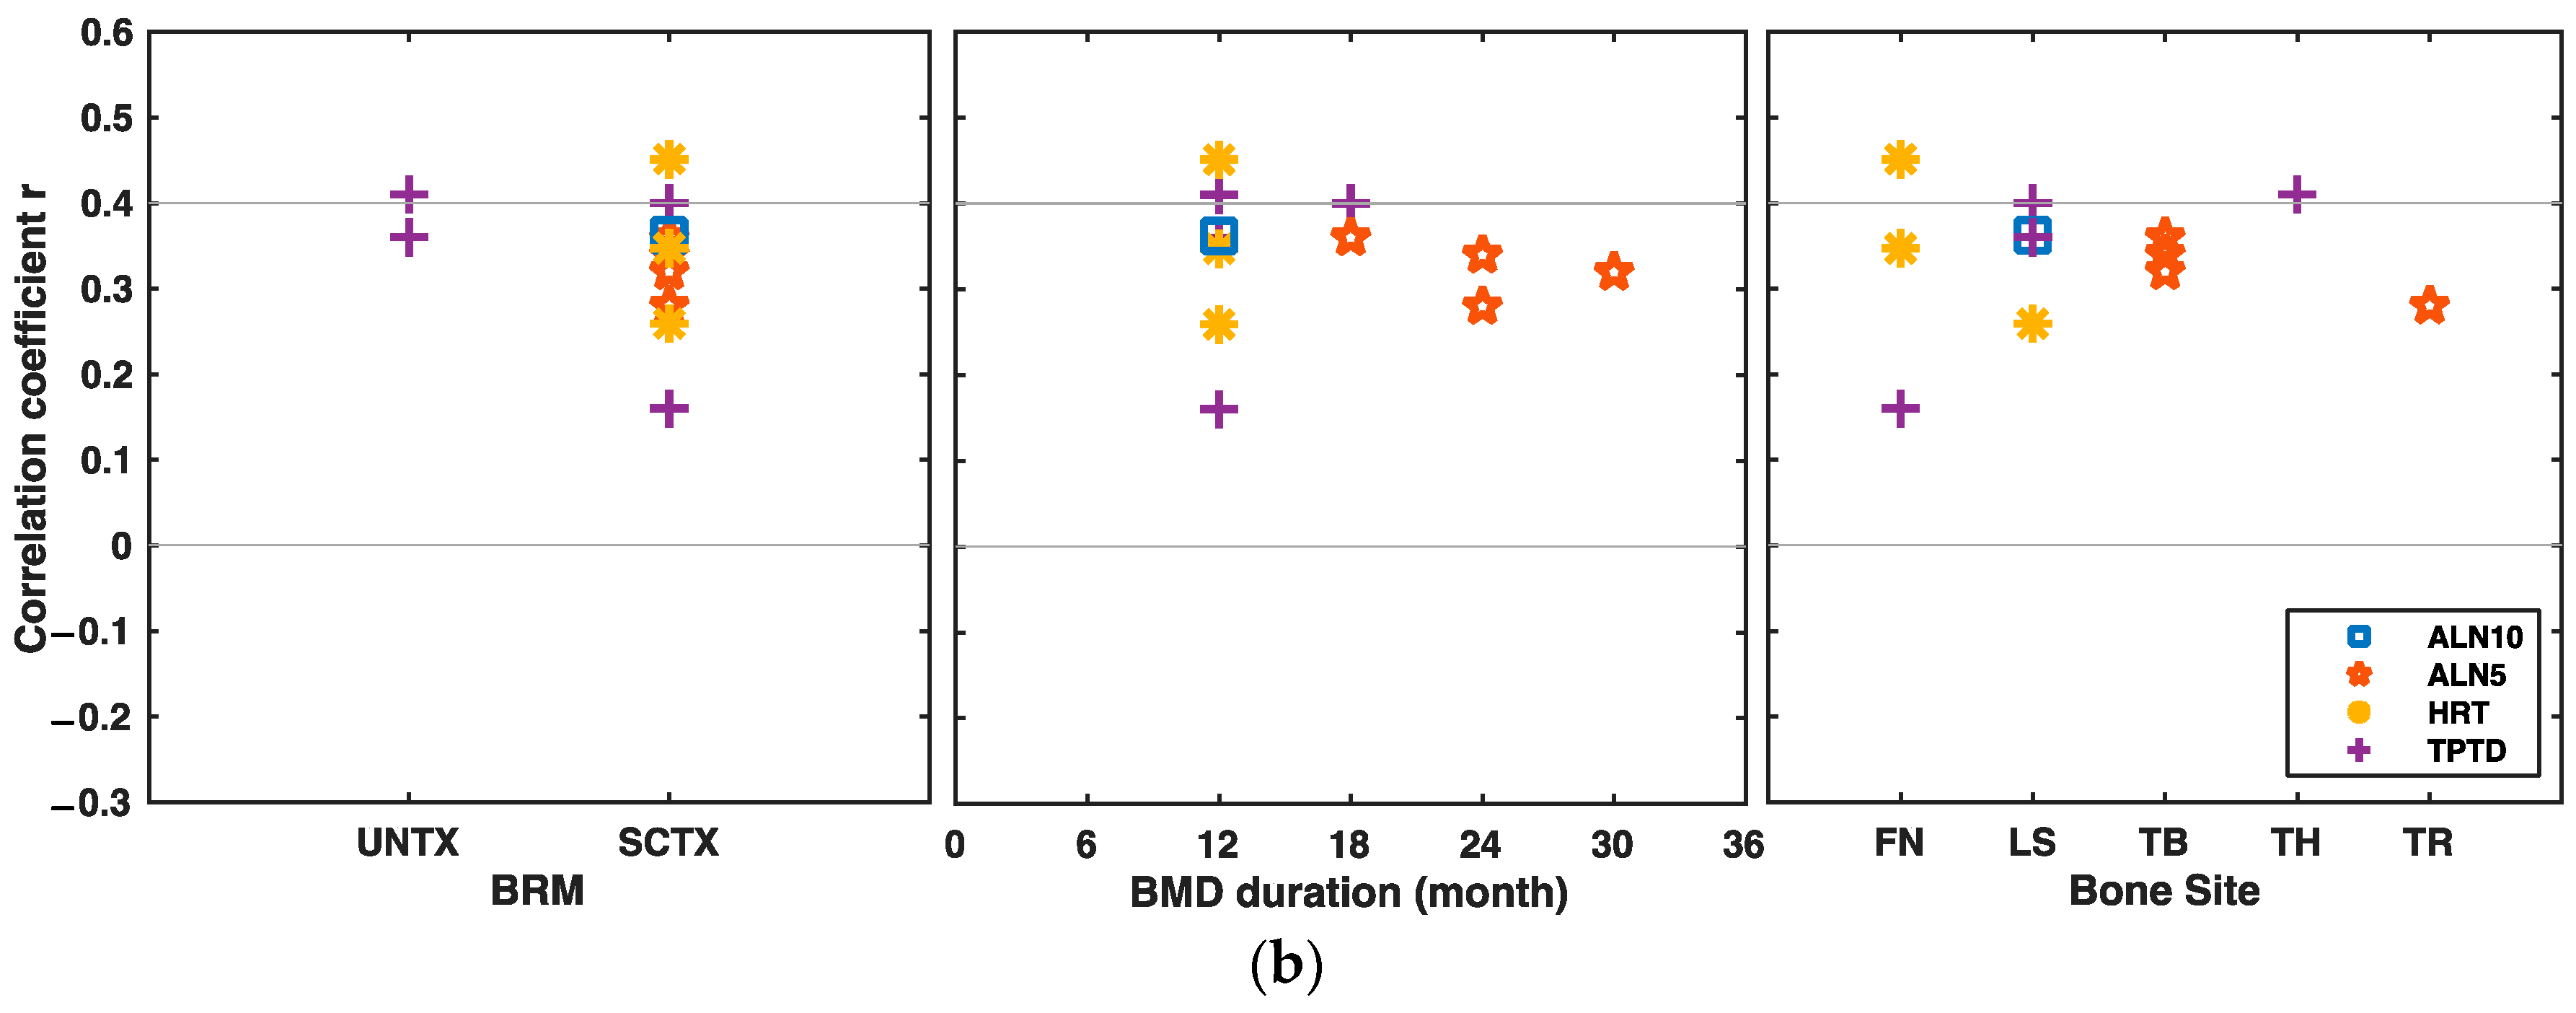
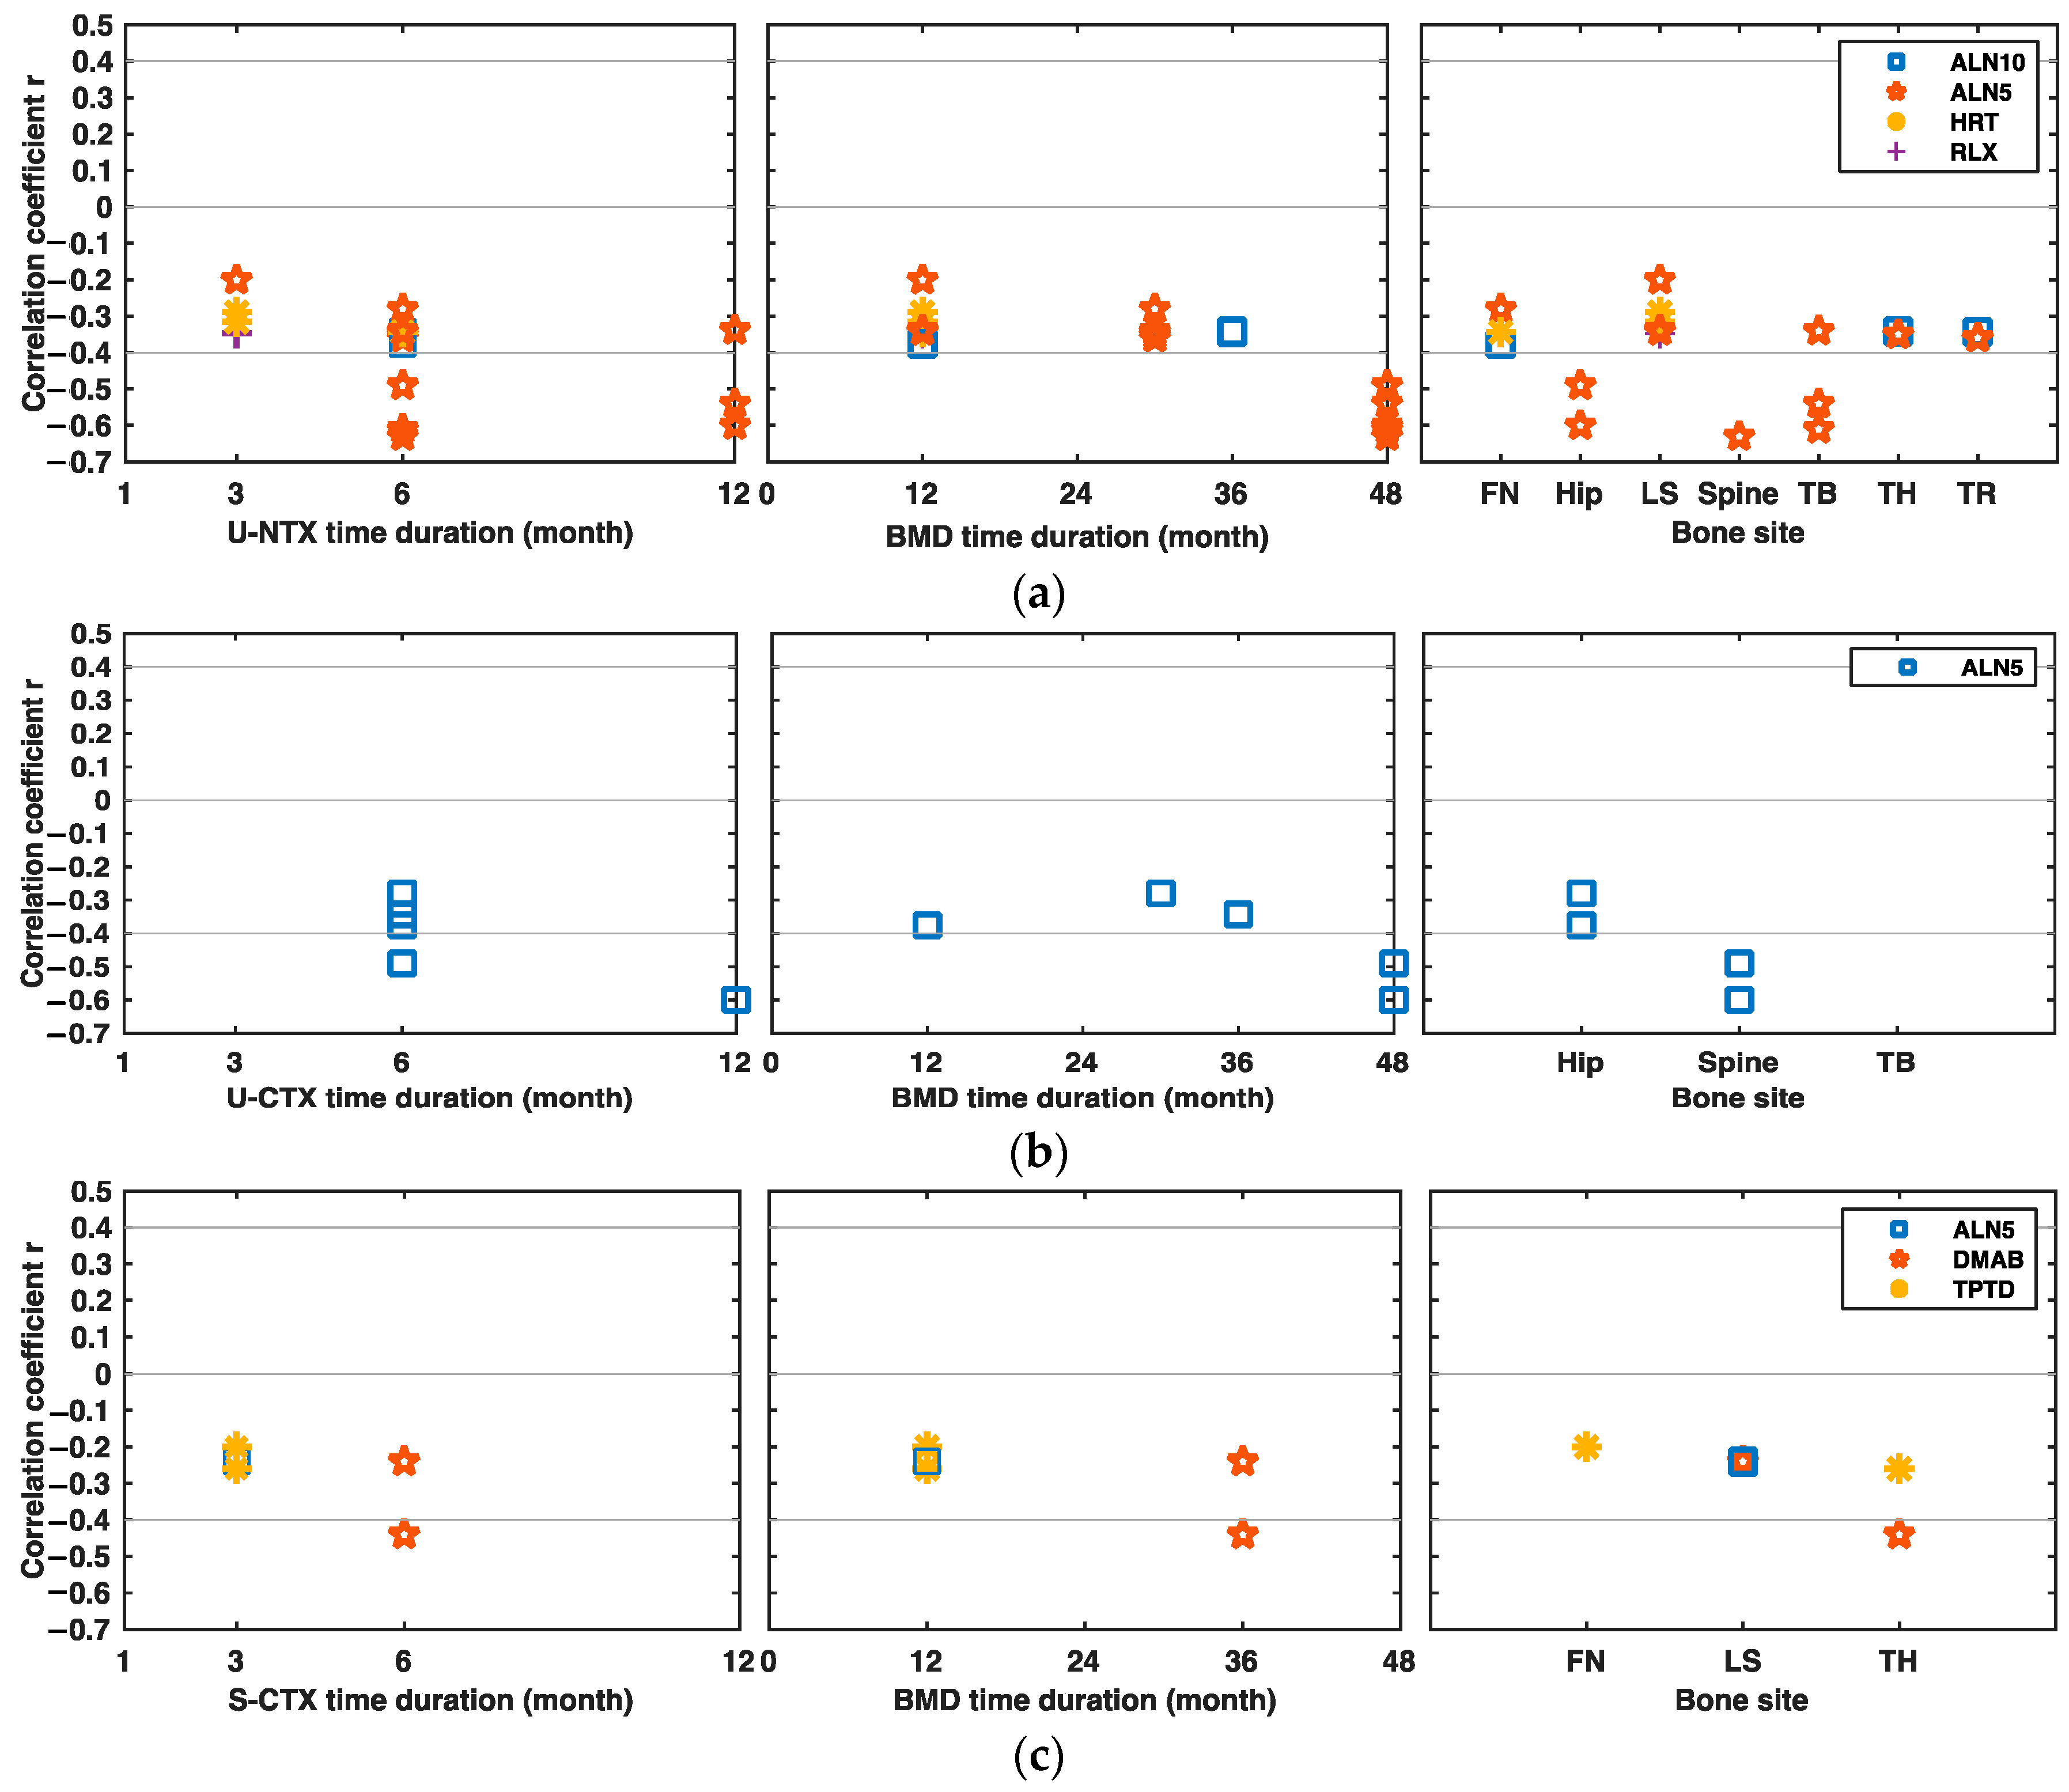
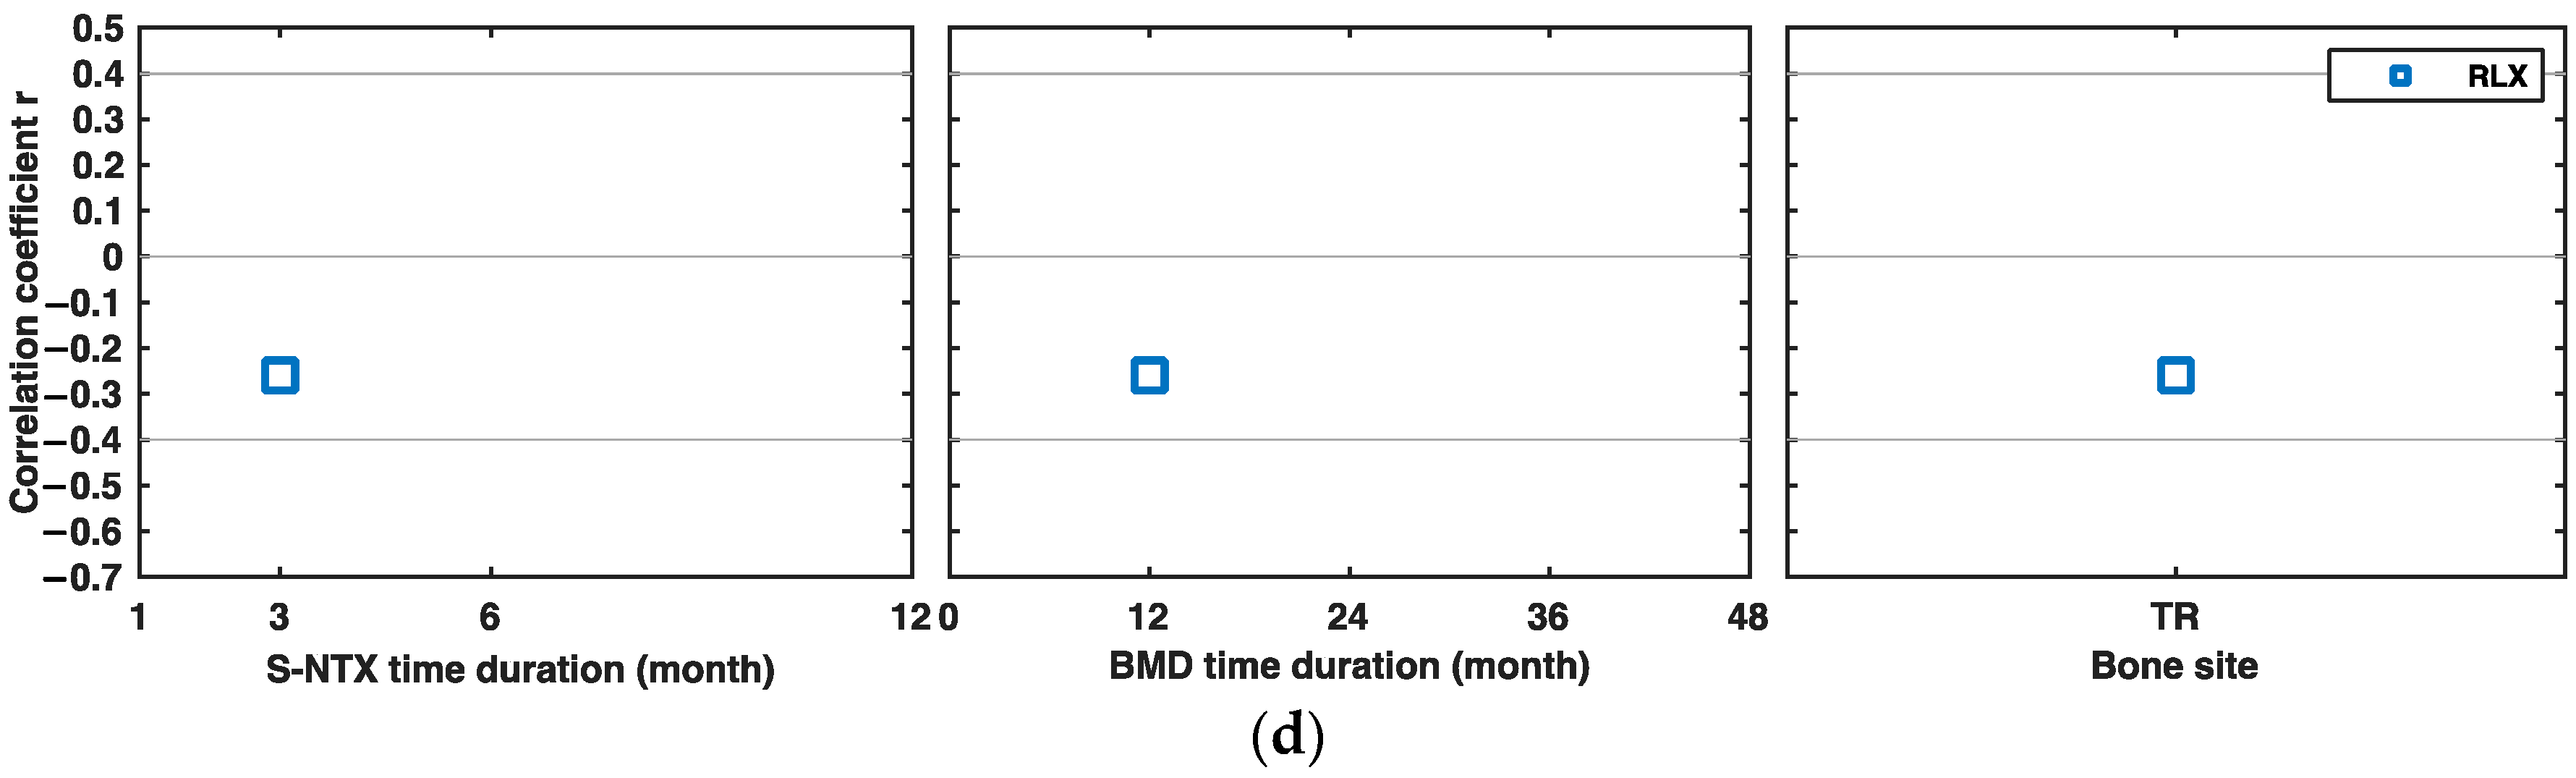
3.4.3. Changes in Markers of Bone Resorption and Changes in BMD after Drug Intervention
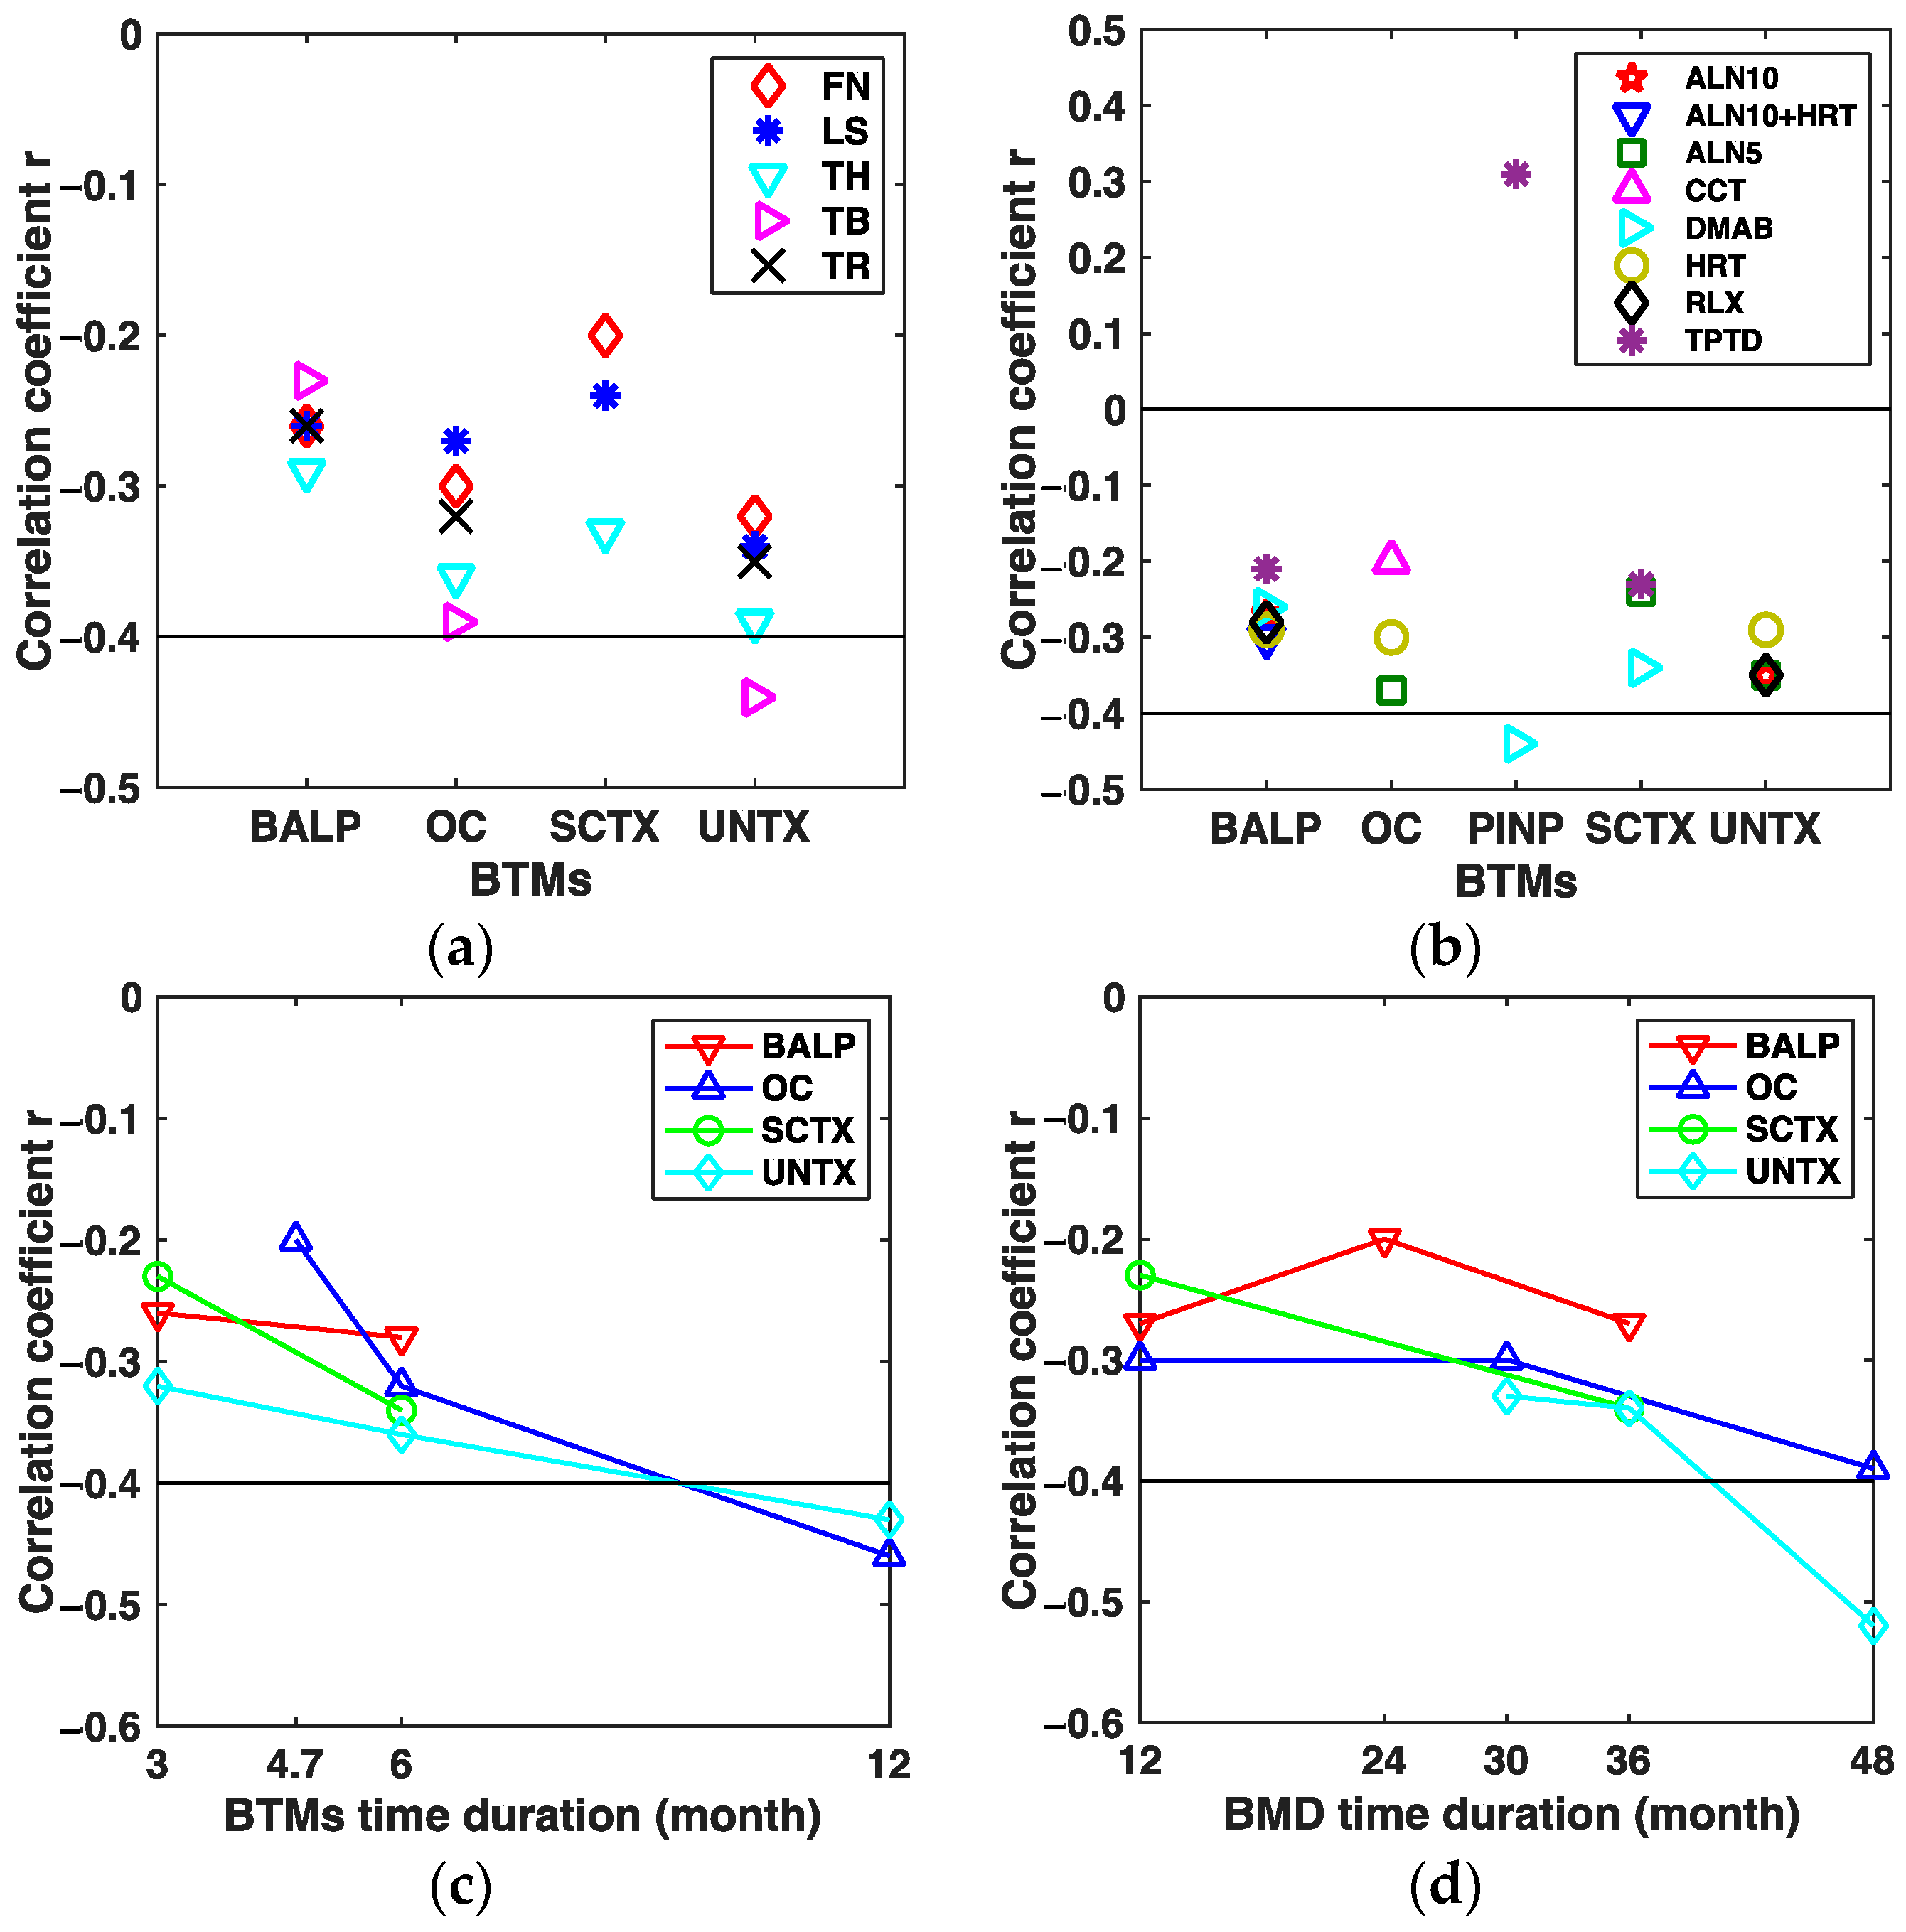
3.5. Findings from the Subgroup Analyses

| Study | Age | Sex | Sample Size | Ethnicity /Region | Disease | Study Design | Intervention | Duration (Years) | Supplementation | Reference |
|---|---|---|---|---|---|---|---|---|---|---|
| Tsujimoto 2011 | 70 (≥55) | F/M | 193/14 | Japanese | PMW | RCTs | 20 µg/d TPTD; PBO | 1 | All subjects received 610 mg calcium and 400 IU vitamin D supplementation daily | [12] |
| Kim 2005 | 56.4 ± 5.8 | F | 88 | Korean | PMO | Prospective study | 0.625 mg CEE + (2.5–10 mg)/d MPA | 1 | All subjects also received 500 mg/day of elemental calcium and 400 IU of vitamin D3. | [13] |
| Chen 2005 | 69.0 ± 6.9 | F | 1085 | multi-center | PMO | RCTs | 20 µg/d TPTP; PBO | 1.75 | Daily calcium (1000 mg) and vitamin D (400–1200 IU) supplementation. | [14] |
| Greenspan 2005 | 71 ± 4 | F | 93 | Boston | PMO | Double-blinded RCTs | 10 mg/d ALN; HRT; 10 mg/d ALN+HRT; PBO | 3 | All received daily multivitamin containing 400 IU per tablet so that their daily vitamin D intake was 400–800 IU | [15] |
| Ravn 2003 | 45–59 | F | 122 | Denmark, England, America, Poland | PMW | Single-blinded RCTs | 5 mg/d ALN; 2.5 mg/d ALN; PBO | 4 | NR | [16] |
| Eastell 2011 | 69.0 ± 6.9 | F | 96 | International | PMO | RCTs | 60 mg/(6 months) Denosumab; PBO | 3 | Daily calcium intake >1000 mg, patient with 12–20 ng/mL, take vitamin D >800 IU/d, others vitamin D intake >400 IU/d | [17] |
| Okabe 2004 | 57.2 ± 5.9 | F | 22 | Japanese | PMO | Prospective study | 1 mg/d estradiol +50 µg/d norethisterone | 1 | NR | [18] |
| Majima 2008 | 71.2 ± 9.1 | F | 73 | Japanese | PMO | Prospective study | 60 mg/d RLX | 1 | NR | [19] |
| Nenonen 2005 | 50–56 | F | 75 | Finland | PMO | Double-blinded RCTs | 5 mg/d ALN; 10 mg/d ALN; PBO | 1 | All subjects took 630 mg calcium carbonate and 400 IU vitamin D daily | [20] |
| Greenspan 1998 | 69.7 ± 4.4 | F | 60 | America | PMW | Double-blinded RCTs | 5 mg/d ALN + 10 mg/d ALN; PBO | 2.5 | Ca + vitamin D | [21] |
| Garnero 1999 | 64.0 ± 7 | F | 307 | France | PMO | Double-blinded RCTs | 10 mg/d ALN; PBO | 2 | 500 mg/d Ca tablet | [22] |
| Watts 2001 | 45–84 | F | 134 | Caucasian | PMO | Multicenter, RCTs | 10 mg/d ALN; PBO | ≥1 | 500 mg/d calcium carbonate tablet | [23] |
| Drake 2003 | 31–87 | M | 120 | Caucasian (97%) | OP | Double-blinded RCTs | 10 mg/d ALN; PBO; | 2 | 500 mg/day elemental calcium, and vitamin D (dose not report) | [24] |
| Eastell 2003 | 69 ± 7 | F | 358 | European, Australian, north American | PMO | Double-blinded RCTs | 5 mg/d RIS; PBO | 3 | All subjects received 1000 mg/day elemental calcium, and up to 500 IU vitamin D if baseline levels were low | [25] |
| Iwamoto 2005 | 71.9 ± 7.5 | F | 105 | Japanese | PMO | Prospective study | 5 mg/d ALN | 1 | All the subjects were instructed to take at least 800 mg calcium daily through intake of calcium-rich foods. | [26] |
| Lu 2017 | 69.0 ± 7.1 | F | 109/11 | Chinese | OP | Open label RCTs | 200 IU/d CCT; 20 µg/d TPTD; PBO | 0.47 | 500–650 mg/day elemental calcium and 200 to 400 IU/day vitamin D supplementation | [27] |
| Iikuni 2012 | 69.7 ± 9.1 | F | 2784 | Japanese | PMO | Prospective study | 60 mg/d RLX | 3 | NR | [28] |
| Takada 2012 | 67.0 ± 5.0 | F | 45 | Japanese | PMO | Prospective study | 60 mg/d RLX | 3 | NR | [29] |
| Delmas 2000 | 53.1 ± 3.5 | F | 569 | Denmark | PMO | RCTs | HRT (17ß-estradiol); PBO | 2 | All women with calcium intake lower than 1 g/d take 500 mg/d calcium supplementation | [30] |
| Riis 1995 | 51.0± 2.2 | F | 119 | Denmark | PMW | Double-masked RCTs | HRT; PBO | 2 | NR | [31] |
| Chen 1996 | 52.3 ± 0.7 | F | 36 | Japanese | PMO/Openia | Prospective study | 0.625 mg CEE + 2.5 mg/d MPA | 1 | NR | [32] |
| Zhan 1999 | 55.9 ± 8.4 | F | 48 | Japanese | PMO | Prospective study | 0.625 mg CEE + 2.5 mg/d progesteron; 1α-vD; PBO | 3 | Subjects in group HRT and PBO took 2–3 g calcium, while 1α-D3 group took 1 g/d | [33] |
4. Discussion
5. Conclusions
Supplementary Materials
Author Contributions
Funding
Acknowledgments
Conflicts of Interest
References
- Looker, A.C.; Wahner, H.W.; Dunn, W.L.; Calvo, M.S.; Harris, T.B.; Heyse, S.P.; Johnston, C.C., Jr.; Lindsay, R. Updated Data on Proximal Femur Bone Mineral Levels of US Adults. Osteoporos. Int. 1998, 8, 468–490. [Google Scholar] [CrossRef]
- Black, D.M.; Rosen, C.J. Clinical Practice. Postmenopausal Osteoporosis. N. Engl. J. Med. 2016, 374, 254–262. [Google Scholar] [CrossRef] [PubMed]
- Faulkner, K.G. Bone matters: Are density increases necessary to reduce fracture risk? J. Bone Miner. Res. 2000, 15, 183–187. [Google Scholar] [CrossRef] [PubMed]
- Vasikaran, S.D. Utility of biochemical markers of bone turnover and bone mineral density in management of osteoporosis. Crit. Rev. Clin. Lab. Sci. 2008, 45, 221–258. [Google Scholar] [CrossRef] [PubMed]
- Delmas, P.D.; Eastell, R.; Garnero, P.; Seibel, M.J.; Stepan, J.; Committee of Scientific Advisors of the International Osteoporosis Foundation. The Use of Biochemical Markers of Bone Turnover in Osteoporosis. Osteoporos. Int. 2000, 11, S2–S17. [Google Scholar] [CrossRef] [PubMed]
- Vilaca, T.; Gossiel, F.; Eastell, R. Bone Turnover Markers: Use in Fracture Prediction. J. Clin. Densitom. 2017, 20, 346–352. [Google Scholar] [CrossRef]
- Moher, D.; Shamseer, L.; Clarke, M.; Ghersi, D.; Liberati, A.; Petticrew, M.; Shekelle, P.; Stewart, L.A. Preferred reporting items for systematic review and meta-analysis protocols (PRISMA-P) 2015 statement. Syst. Rev. 2015, 4, 1. [Google Scholar] [CrossRef]
- Higgins, J.P.T.; Altman, D.G.; Gøtzsche, P.C.; Jüni, P.; Moher, D.; Oxman, A.D.; Savović, J.; Schulz, K.F.; Weeks, L.; Sterne, J.A.C. The Cochrane Collaboration’s tool for assessing risk of bias in randomised trials. BMJ 2011, 343, d5928. [Google Scholar] [CrossRef]
- Sterne, J.A.C.; Hernán, M.A.; Reeves, B.C.; Savović, J.; Berkman, N.D.; Viswanathan, M.; Henry, D.; Altman, D.G.; Ansari, M.T.; Boutron, I.; et al. ROBINS-I: A tool for assessing risk of bias in non-randomised studies of interventions. BMJ 2016, 355, i4919. [Google Scholar] [CrossRef]
- Borenstein, M.; Hedges, L.V.; Higgins, J.P.T.; Rothstein, H.R. Introduction to Meta-Analysis; John Wiley & Sons: Chichester, UK, 2009; pp. 41–43. [Google Scholar]
- Higgins, J.P.T.; Thompson, S.G.; Deeks, J.J.; Altman, D.G. Measuring inconsistency in meta-analyses. BMJ 2003, 327, 557–560. [Google Scholar] [CrossRef]
- Tsujimoto, M.; Chen, P.; Miyauchi, A.; Sowa, H.; Krege, J. PINP as an aid for monitoring patients treated with teriparatide. Bone 2011, 48, 798–803. [Google Scholar] [CrossRef] [PubMed]
- Kim, S.W.; Park, D.J.; Park, K.S.; Kim, S.Y.; Cho, B.Y.; Lee, H.K.; Shin, C.S. Early changes in biochemical markers of bone turnover predict bone mineral density response to antiresorptive therapy in Korean postmenopausal women with osteoporosis. Endocr. J. 2005, 52, 667–674. [Google Scholar] [CrossRef] [PubMed]
- Chen, P.; Satterwhite, J.; Licata, A.; Lewiecki, E.; Sipos, A.; Misurski, D.; Wagman, R. Early changes in biochemical markers of bone formation predict BMD response to teriparatide in postmenopausal women with osteoporosis. J. Bone Miner. Res. 2005, 20, 962–970. [Google Scholar] [CrossRef] [PubMed]
- Greenspan, S.; Resnick, N.; Parker, R. Early changes in biochemical markers of bone turnover are associated with long-term changes in bone mineral density in elderly women on alendronate, hormone replacement therapy, or combination therapy: A three-year, double-blind, placebo-controlled, randomized clinical trial. J. Clin. Endocrinol. Metab. 2005, 90, 2762–2767. [Google Scholar] [PubMed]
- Ravn, P.; Thompson, D.E.; Ross, P.D.; Christiansen, C. Biochemical markers for prediction of 4-year response in bone mass during bisphosphonate treatment for prevention of postmenopausal osteoporosis. Bone 2003, 33, 150–158. [Google Scholar] [CrossRef]
- Eastell, R.; Christiansen, C.; Grauer, A.; Kutilek, S.; Libanati, C.; McClung, M.; Reid, I.; Resch, H.; Siris, E.; Uebelhart, D.; et al. Effects of denosumab on bone turnover markers in postmenopausal osteoporosis. J. Bone Miner. Res. 2011, 26, 530–537. [Google Scholar] [CrossRef] [PubMed]
- Okabe, R.; Inaba, M.; Nakatsuka, K.; Miki, T.; Naka, H.; Moriguchi, A.; Nishizawa, Y. Significance of serum CrossLaps as a predictor of changes in bone mineral density during estrogen replacement therapy; comparison with serum carboxyterminal telopeptide of type I collagen and urinary deoxypyridinoline. J. Bone Miner. Metab. 2004, 22, 127–131. [Google Scholar] [CrossRef]
- Majima, T.; Shimatsu, A.; Satoh, N.; Komatsu, Y.; Fukao, A.; Ninomiya, K.; Matsumura, T.; Nakao, K. Three-month changes in bone turnover markers and bone mineral density response to raloxifene in Japanese postmenopausal women with osteoporosis. J. Bone Miner. Metab. 2008, 26, 178–184. [Google Scholar] [CrossRef]
- Nenonen, A.; Cheng, S.; Ivaska, K.K.; Alatalo, S.L.; Lehtimäki, T.; Schmidt-Gayk, H.; Uusi-Rasi, K.; Heinonen, A.; Kannus, P.; Sievänen, H.; et al. Serum TRACP 5b is a useful marker for monitoring alendronate treatment: Comparison with other markers of bone turnover. J. Bone Miner. Res. 2005, 20, 1804–1812. [Google Scholar] [CrossRef]
- Greenspan, S.; Parker, R.; Ferguson, L.; Rosen, H.; Maitland-Ramsey, L.; Karpf, D. Early changes in biochemical markers of bone turnover predict the long-term response to alendronate therapy in representative elderly women: A randomized clinical trial. J. Bone Miner. Res. 1998, 13, 1431–1438. [Google Scholar] [CrossRef]
- Garnero, P.; Darte, C.; Delmas, P. A msodel to monitor the efficacy of alendronate treatment in women with osteoporosis using a biochemical marker of bone turnover. Bone 1999, 24, 603–609. [Google Scholar] [CrossRef]
- Watts, N.; Jenkins, D.; Visor, J.; Casal, D.; Geusens, P. Comparison of bone and total alkaline phosphatase and bone mineral density in postmenopausal osteoporotic women treated with alendronate. Osteoporos. Int. 2001, 12, 279–288. [Google Scholar] [CrossRef] [PubMed]
- Drake, W.M.; Kendler, D.L.; Rosen, C.J.; Orwoll, E.S. An investigation of the predictors of bone mineral density and response to therapy with alendronate in osteoporotic men. J. Clin. Endocrinol. Metab. 2003, 88, 5759–5765. [Google Scholar] [CrossRef]
- Eastell, R.; Barton, I.; Hannon, R.; Chines, A.; Garnero, P.; Delmas, P. Relationship of early changes in bone resorption to the reduction in fracture risk with risedronate. J. Bone Miner. Res. 2003, 18, 1051–1056. [Google Scholar] [CrossRef] [PubMed]
- Iwamoto, J.; Takeda, T.; Sato, Y.; Uzawa, M. Early changes in urinary cross-linked N-terminal telopeptides of type I collagen level correlate with 1-year response of lumbar bone mineral density to alendronate in postmenopausal Japanese women with osteoporosis. J. Bone Miner. Metab. 2005, 23, 238–242. [Google Scholar] [CrossRef] [PubMed]
- Lu, C.; Chen, Y.; Zhang, B.; Chen, Y.; Bai, F.; Chen, D. Response to teriparatide in Chinese patients with established osteoporosis: Osteocalcin and lumbar spine bone-mineral density changes from teriparatide Phase III study. Clin. Interv. Aging 2017, 12, 1717–1723. [Google Scholar] [CrossRef] [PubMed]
- Iikuni, N.; Hamaya, E.; Nihojima, S.; Yokoyama, S.; Goto, W.; Taketsuna, M.; Miyauchi, A.; Sowa, H. Safety and effectiveness profile of raloxifene in long-term, prospective, postmarketing surveillance. J. Bone Miner. Metab. 2012, 30, 674–682. [Google Scholar] [CrossRef]
- Takada, J.; Iba, K.; Yoshizaki, T.; Yamashita, T. Correlation between a bone resorption marker and structural geometry of the proximal femur in osteoporotic women treated with raloxifene. J. Orthop. Surg. (Hong Kong) 2012, 20, 209–213. [Google Scholar] [CrossRef]
- Delmas, P.D.; Hardy, P.; Garnero, P.; Dain, M. Monitoring individual response to hormone replacement therapy with bone markers. Bone 2000, 26, 553–560. [Google Scholar] [CrossRef]
- Riis, B.; Overgaard, K.; Christiansen, C. Biochemical markers of bone turnover to monitor the bone response to postmenopausal hormone replacement therapy. Osteoporos. Int. 1995, 5, 276–280. [Google Scholar] [CrossRef]
- Chen, J.T.; Hosoda, K.; Hasumi, K.; Ogata, E.; Shiraki, M. Serum N-terminal osteocalcin is a good indicator for estimating responders to hormone replacement therapy in postmenopausal women. J. Bone Miner. Res. 1996, 11, 1784–1792. [Google Scholar] [CrossRef] [PubMed]
- Zhan, Z.W.; Yamamoto, I.; Morita, R.; Miura, H. Urinary pyridinoline and deoxypyridinoline as bone metabolic markers in predicting therapeutic effects of estrogen and alfacalcidol in women with osteoporosis. J. Bone Miner. Metab. 1999, 17, 113–118. [Google Scholar] [CrossRef] [PubMed]
- Funck-Brentano, T.; Biver, E.; Chopin, F.; Bouvard, B.; Coiffier, G.; Souberbielle, J.-C.; Garnero, P.; Roux, C. Clinical Utility of Serum Bone Turnover Markers in Postmenopausal Osteoporosis Therapy Monitoring: A Systematic Review. Semin. Arthritis Rheum. 2011, 41, 157–169. [Google Scholar] [CrossRef] [PubMed]
- Biver, E.; Chopin, F.; Coiffier, G.; Brentano, T.F.; Bouvard, B.; Garnero, P.; Cortet, B. Bone turnover markers for osteoporotic status assessment? A systematic review of their diagnosis value at baseline in osteoporosis. Jt. Bone Spine 2012, 79, 20–25. [Google Scholar] [CrossRef] [PubMed]
- Lian, J.B.; Gundberg, C.M. Osteocalcin. Biochemical considerations and clinical applications. Clin. Orthop. Relat. Res. 1988, 226, 267–291. [Google Scholar]
- Linkhart, S.G.; Linkhart, T.A.; Taylor, A.K.; Wergedal, J.E.; Bettica, P.; Baylink, D.J. Synthetic peptide-based immunoassay for amino-terminal propeptide of type I procollagen: Application for evaluation of bone formation. Clin. Chem. 1993, 39, 2254. [Google Scholar] [CrossRef]
- Hanson, D.A.; Weis, M.A.E.; Bollen, A.-M.; Maslan, S.L.; Singer, F.R.; Eyre, D.R. A specific immunoassay for monitoring human bone resorption: Quantitation of type I collagen cross-linked N-telopeptides in urine. J. Bone Miner. Res. 1992, 7, 1251–1258. [Google Scholar] [CrossRef]


© 2020 by the authors. Licensee MDPI, Basel, Switzerland. This article is an open access article distributed under the terms and conditions of the Creative Commons Attribution (CC BY) license (http://creativecommons.org/licenses/by/4.0/).
Share and Cite
Hong, L.; Liu, D.; Wu, F.; Wang, M.; Cen, Y.; Ma, L. Correlation between Bone Turnover Markers and Bone Mineral Density in Patients Undergoing Long-Term Anti-Osteoporosis Treatment: A Systematic Review and Meta-Analysis. Appl. Sci. 2020, 10, 832. https://doi.org/10.3390/app10030832
Hong L, Liu D, Wu F, Wang M, Cen Y, Ma L. Correlation between Bone Turnover Markers and Bone Mineral Density in Patients Undergoing Long-Term Anti-Osteoporosis Treatment: A Systematic Review and Meta-Analysis. Applied Sciences. 2020; 10(3):832. https://doi.org/10.3390/app10030832
Chicago/Turabian StyleHong, Lingyun, Dan Liu, Feng Wu, Meiqi Wang, Yu Cen, and Lan Ma. 2020. "Correlation between Bone Turnover Markers and Bone Mineral Density in Patients Undergoing Long-Term Anti-Osteoporosis Treatment: A Systematic Review and Meta-Analysis" Applied Sciences 10, no. 3: 832. https://doi.org/10.3390/app10030832
APA StyleHong, L., Liu, D., Wu, F., Wang, M., Cen, Y., & Ma, L. (2020). Correlation between Bone Turnover Markers and Bone Mineral Density in Patients Undergoing Long-Term Anti-Osteoporosis Treatment: A Systematic Review and Meta-Analysis. Applied Sciences, 10(3), 832. https://doi.org/10.3390/app10030832