Letter

Post-Processing Method for Image Reconstruction Enhancement in Integrating-Bucket-Based Full-Field Optical Coherence Tomography

School of Electrical Engineering and Computer Science, Gwangju Institute of Science and Technology, 123, Cheomdangwagi-Ro, Buk-Gu, Gwangju 61005, Korea
*
Author to whom correspondence should be addressed.
These two authors contributed equally.
Appl. Sci. 2020, 10(3), 830; https://doi.org/10.3390/app10030830
Submission received: 17 December 2019 / Revised: 20 January 2020 / Accepted: 21 January 2020 / Published: 24 January 2020
(This article belongs to the Special Issue Optical Devices and Systems for Biomedical Applications)

Abstract

:
An integrating-bucket method is widely used as a reconstruction tool for full-field optical coherence tomography (FF-OCT). However, it requires high-precision adjustments of the phase modulation parameters. If the parameters are not optimal, the reconstructed tomogram will incur severe artifacts. We propose a post-processing method for removing or reducing such artifacts by utilizing a correction factor extracted from a pre-reconstructed tomogram. FF-OCT imaging created using a coin verifies the effectiveness of the method not only for a single en face image but also for an entire 3-D image. It is expected that the proposed method will expand the application of FF-OCT from biomedical imaging to semiconductor wafers or display panel inspections.

1. Introduction

Full-field optical coherence tomography (FF-OCT) is composed of a Michelson interferometer with a full-field illumination. In general, an FF-OCT system has a high axial resolution, owing to the use of a broadband illumination source, and a high lateral resolution, through the application of a high numerical aperture lens [1]. The system can be used to obtain an en face tomographic image from a two-dimensional detector array without any transverse scanning [2], and has been applied to various biomedical fields including ex vivo diagnosis of brain tumors [3], in vivo imaging of human skin [4], and even in vitro cellular-level imaging of rat eyes [5]. Its fields of application are also expanding into semiconductor wafers and display panel inspections [6,7].
To acquire en face images using an FF-OCT system, a reconstruction process is essential, and numerous reconstruction methods have been proposed. An en face image was reconstructed from a two-dimensional interferogram using a Hilbert transform [8]. However, with this scheme, the reconstruction is generally insufficient, owing to the finite spatial size of the interferogram [9]. With phase-shifting interferometry (PSI), an en face tomographic image was reconstructed using several phase-modulated interferograms taken at a particular depth [10,11]. The phase of the reference arm of the system was modulated using a piezoelectric transducer in stop-and-go mode. However, it takes a long time to modulate the phase using this mode. To obtain a fast interferogram acquisition speed with the PSI, the integrating-bucket method was applied [12,13]. The optical path length of the reference arm was sinusoidally modulated, and the four interferograms were captured, after accumulating the interference signal during each quarter cycle of the modulation. Although the integrating-bucket method is theoretically fast and accurate, adjusting the parameters for the phase modulation is not easy. In many cases, artifacts remain in the reconstructed en face image even after labor-intensive hardware adjustments [13]. In this study, we therefore propose a post-processing method that is expected to be able to remove or reduce artifacts and enhance the FF-OCT tomogram obtained through the integrating-bucket method. From a pre-reconstructed en face tomogram, the proposed method extracts a correction factor that can numerically adjust the phase modulation parameters of the system. The theoretical idea behind this proposal is described and its results are experimentally confirmed through the imaging of a Philippine one peso coin.

2. Materials and Methods

2.1. Problem of Integrating-Bucket Method for PSI

With the integrating-bucket method, four raw interferograms, called buckets, are generally used to reconstruct one en face image at a given depth. Each bucket is captured after accumulating the interference signal during each quarter cycle of a single-phase modulation period [12], as
E k = D + 4 T ( k 1 ) T / 4 k T / 4 A cos [ Φ + B sin ( ω t + θ ) ] d t , k = 1 ,   2 ,   3 ,   4 ,
where A and Φ are the amplitude and phase of the interferogram that we want to retrieve; B and θ are the amplitude and initial phase of the modulation; T and ω are the period and angular frequency of the phase modulation; D is the DC component of the bucket signal. An intensive mathematical manipulation using a Jacobi–Anger expansion [12] makes Equation (1) a linear sum of the cosine and sine functions of the phase Φ, as follows
E k = D + A ( f k cos Φ + g k sin Φ ) .
The two coefficients fk and gk of the k-th bucket signal Ek are given as functions of the modulation parameters B and θ, and can be represented as a series of Bessel functions of the first kind [12]. They have the following useful characteristics
f 1 = f 3 ,   f 2 = f 4 ,   g 1 = g 3 ,   g 2 = g 4 .
During one complete period of the phase modulation, four integrations of Equation (1) are applied, which give the four bucket signals E1, E2, E3, and E4. From their linear combinations, using the relationships of Equation (3), we can obtain the following two intermediate signals
I cos E 1 E 2 + E 3 E 4 = 2 A ( f 1 f 2 ) cos Φ ,
I sin E 1 E 2 E 3 + E 4 = 2 A ( g 1 g 2 ) sin Φ .
By defining two constants as
F 2 ( f 1 f 2 ) ,
G 2 ( g 1 g 2 ) ,
we can simplify the two intermediate signals of Equations (4) and (5) as follows
I cos = A F cos Φ ,
I sin = A G sin Φ .
As is well-known, the two constants, F and G, are equal to each other when the modulation parameters, B and θ, have specific optimum values [12]. With these optimum parameters, the amplitude A of the interferogram can be easily retrieved by conducting simple trigonometric manipulations with the intermediate signals of Equations (8) and (9), as follows
I cos 2 + I sin 2 = A F = A G .
It says that the amplitude A is obtained without being affected by the phase Φ. However, if the modulation parameters are not properly adjusted, F and G will differ to each other and the image reconstruction will be defective. In other words, there will be some residual interference fringes. It depends on the phase Φ, even after the en face image reconstruction
I cos 2 + I sin 2 = A F 2 + ( G 2 F 2 ) sin 2 Φ .
In a previous study, a filtering in the Fourier domain was applied to remove the interference fringes [14]. However, with this method, the separation of the frequency components caused by the artifacts is difficult to achieve, and data loss occurs. Thus, we propose a simple post-processing method that can remove or reduce the residual fringes without suffering data loss.

2.2. Post-Processing for Artifact Removal

The key idea of the proposed post-processing method is finding the correction factor Γ, namely, the ratio between the two constants, as
Γ F / G ,
from an already-reconstructed image. The optimal hardware adjustment gives a value of F equal to G, and thus Γ becomes unity in an ideal case. Otherwise, Γ is not unity, in which case we can equalize the two constants in Equations (8) and (9) by simply multiplying Γ into Equation (9), which allows us to reconstruct a better en face tomogram.
Despite the short coherence length of the light source used in an FF-OCT system, when the sample plane has some up-and-down variations within the coherence length, the image taken at a certain depth includes interference fringes, due to the varying phase Φ. If the phase variation of the sinusoidal functions, like those in Equations (8) and (9), is random, the ensemble averages of their squares become one-half. With this idea, Γ can be obtained by comparing the averages of the squares of the two intermediate signals, as follows
Γ 2 = E a r e a [ I cos 2 ] / E a r e a [ I sin 2 ] ,
where Earea[X] is defined as the area average of signal X. The constants F and G can then be adjusted numerically with the obtained Γ, which allows us to achieve an image reconstruction, without residual fringes in the following manner:
I cos 2 + Γ 2 I sin 2 = A F = A Γ G .
However, it is necessary to check whether the phase variation is random enough within the area of interest, or select the area providing the random phase variations.

2.3. FF-OCT System Configuration

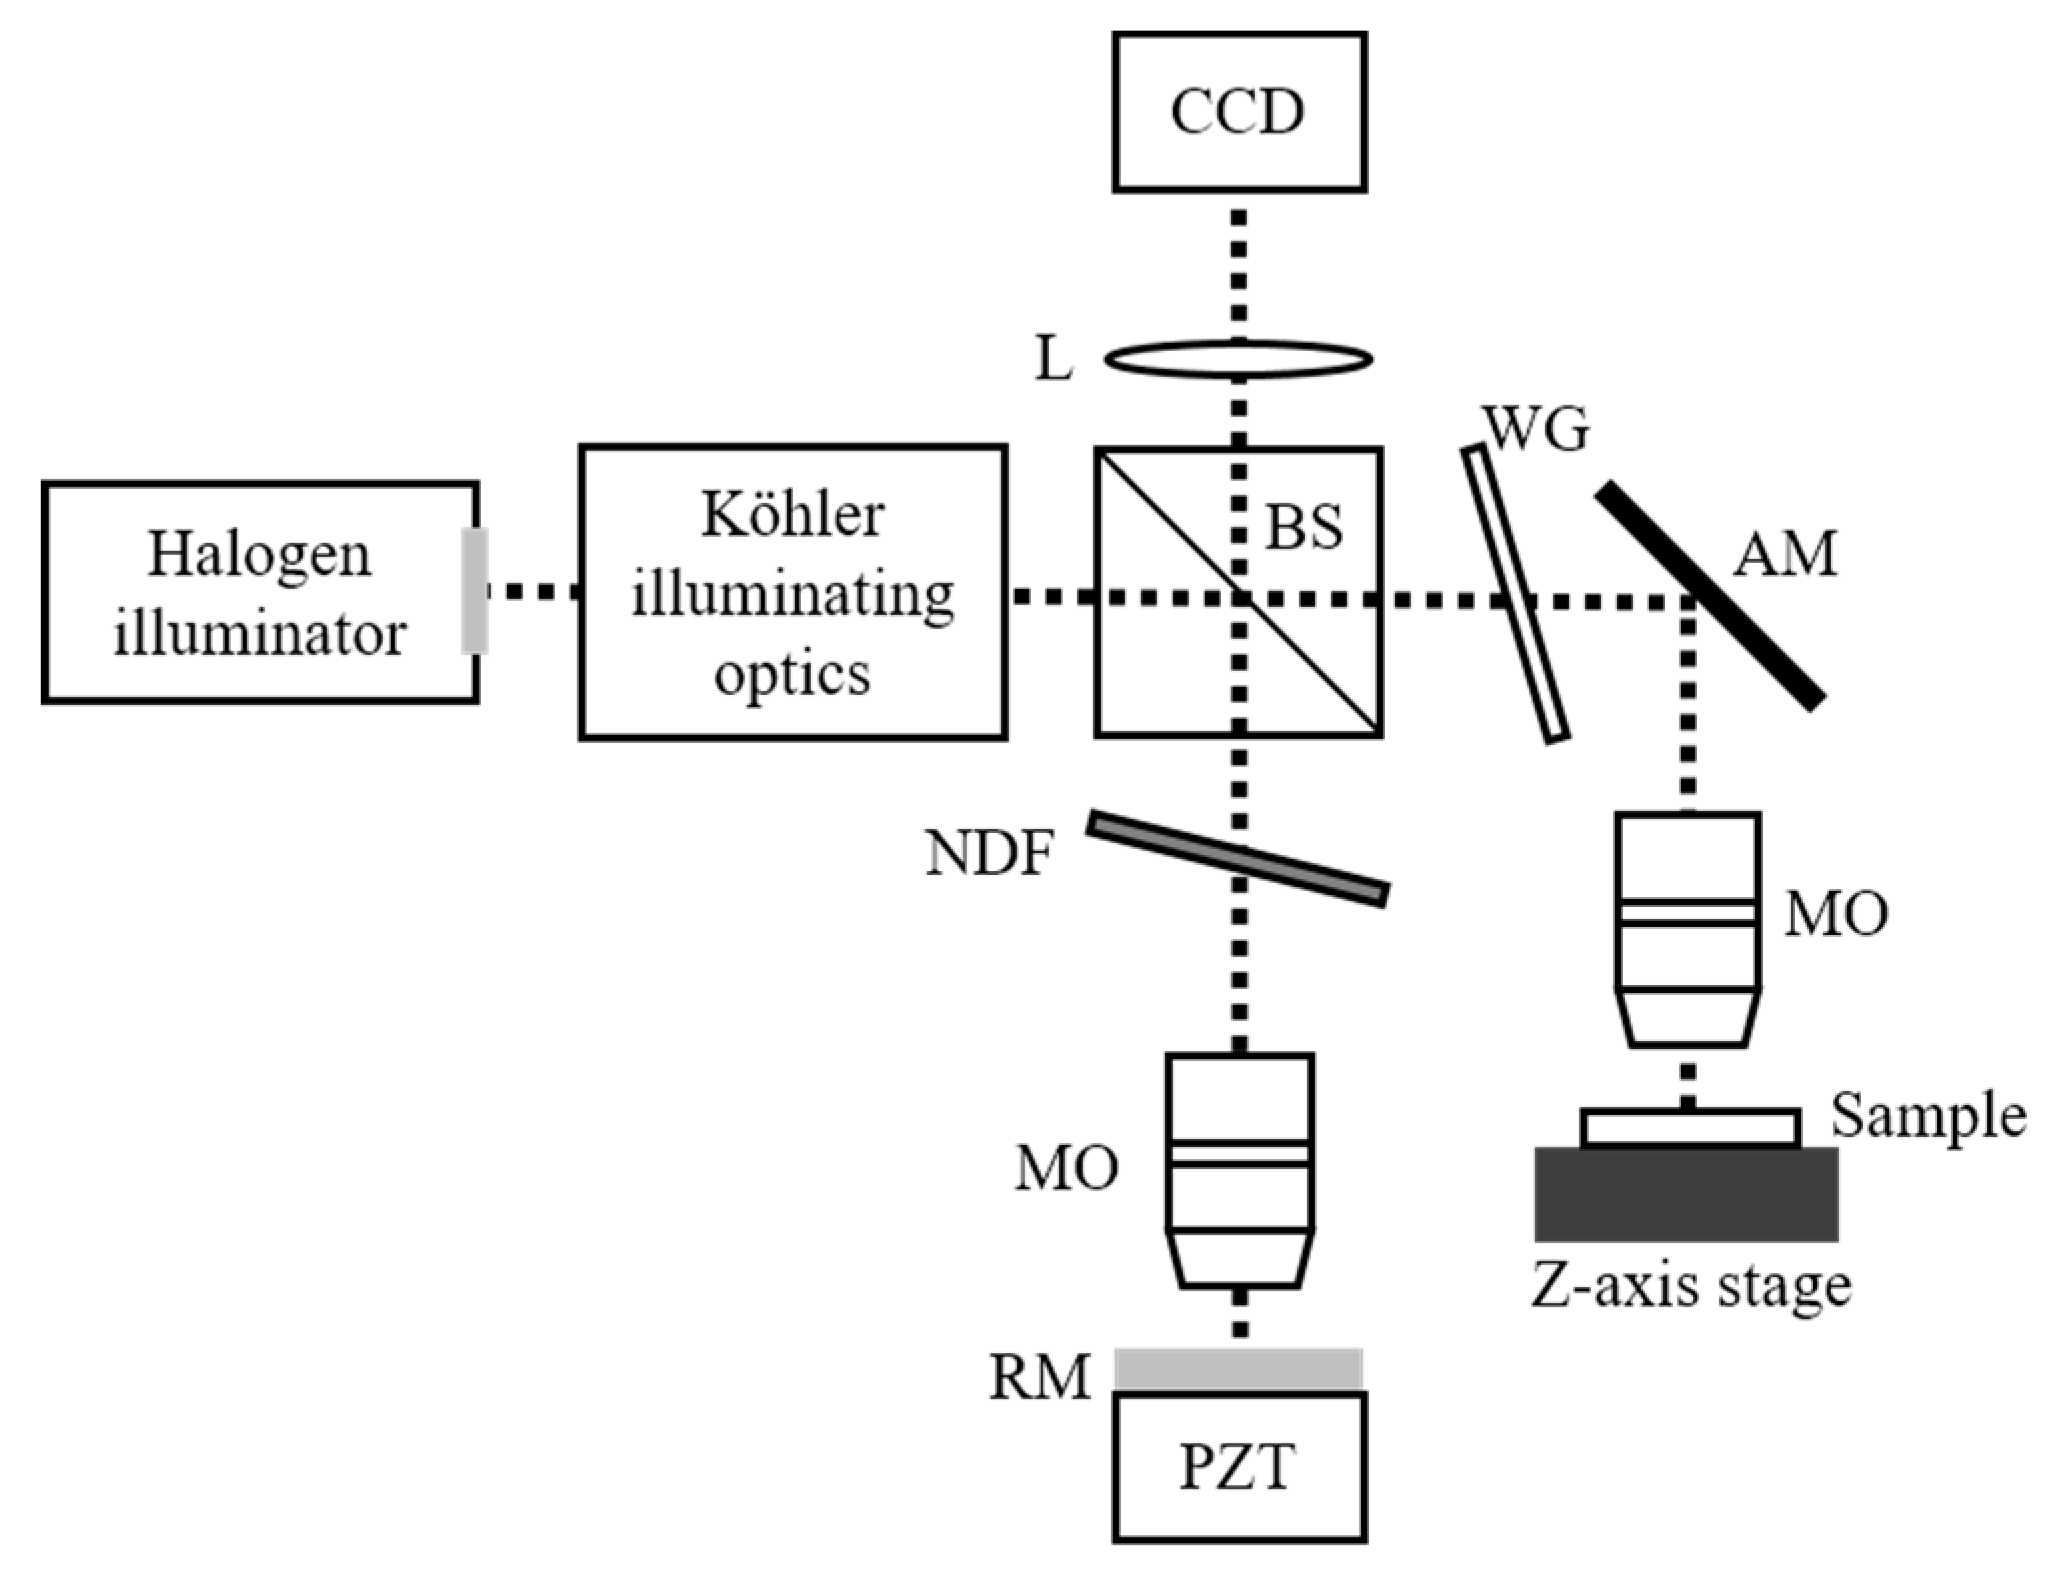
For the experiments, as shown in Figure 1, a halogen lamp (KI-100W, Korea Instech, Daegu, Korea), which had a center wavelength of 650 nm and a spectral bandwidth of 150 nm, was used as a broadband light source. Köhler illuminating optics were utilized to illuminate a sample with a spatially uniform light. The beam was divided by a beam splitter (BS), directed to the reference and sample arm, and then focused using a pair of microscope objective lenses (UMPLFL N 10XW, 0.3 NA, Olympus, MO, Tokyo, Japan) placed on both arms. To match the interferometric visibility, a neutral density filter (NDF) was applied in the reference arm and, to match the optical path length changed by the NDF, a window glass (WG) was used in the sample arm. A series of interferograms were captured using a charge-coupled device (CCD-1020, VDS, CCD, Osnabrück, Germany). In addition, the position of the reference mirror (RM) was sinusoidally modulated with a piezoelectric transducer (P-841, PI, PZT, Karlsruhe, Germany). The CCD was operated at an acquisition frequency of 20 Hz and the PZT was driven at 5 Hz. The depth scan—to obtain a series of en face images along the depth direction of a sample—was conducted with 1 μm steps using a high-precision linear motorized stage. The axial and lateral resolutions of the FF-OCT system were 1.5 and 2.7 μm, respectively. To verify the proposed post-processing method, the smallest two letters of a Philippine one peso coin were imaged. A series of en face images of the coin were reconstructed for a 50 μm depth with 1 μm steps.

3. Results

Figure 2a–d show a set of four raw interferograms acquired during one complete period of the phase modulation, corresponding to E1, E2, E3, and E4 of Equation (1), respectively. Each image has a pixel resolution of 512 × 512. The optical path length of the RM was adjusted to the bottom of the coin surface. Owing to the short coherence length of the source, we can see the interference fringes only at the bottom of the coin surface, or out of the letter regions. However, as was previously mentioned, owing to the finite coherence length, the phase of the fringe varies across the bottom surface. A closer look verifies that the phases of the four interferograms are slightly different to each other. It should be noted again that the four interferograms were captured at four different phases of the PZT modulation. It was confirmed that the surfaces of the letters were located at a height of 20–25 μm above the bottom surface.
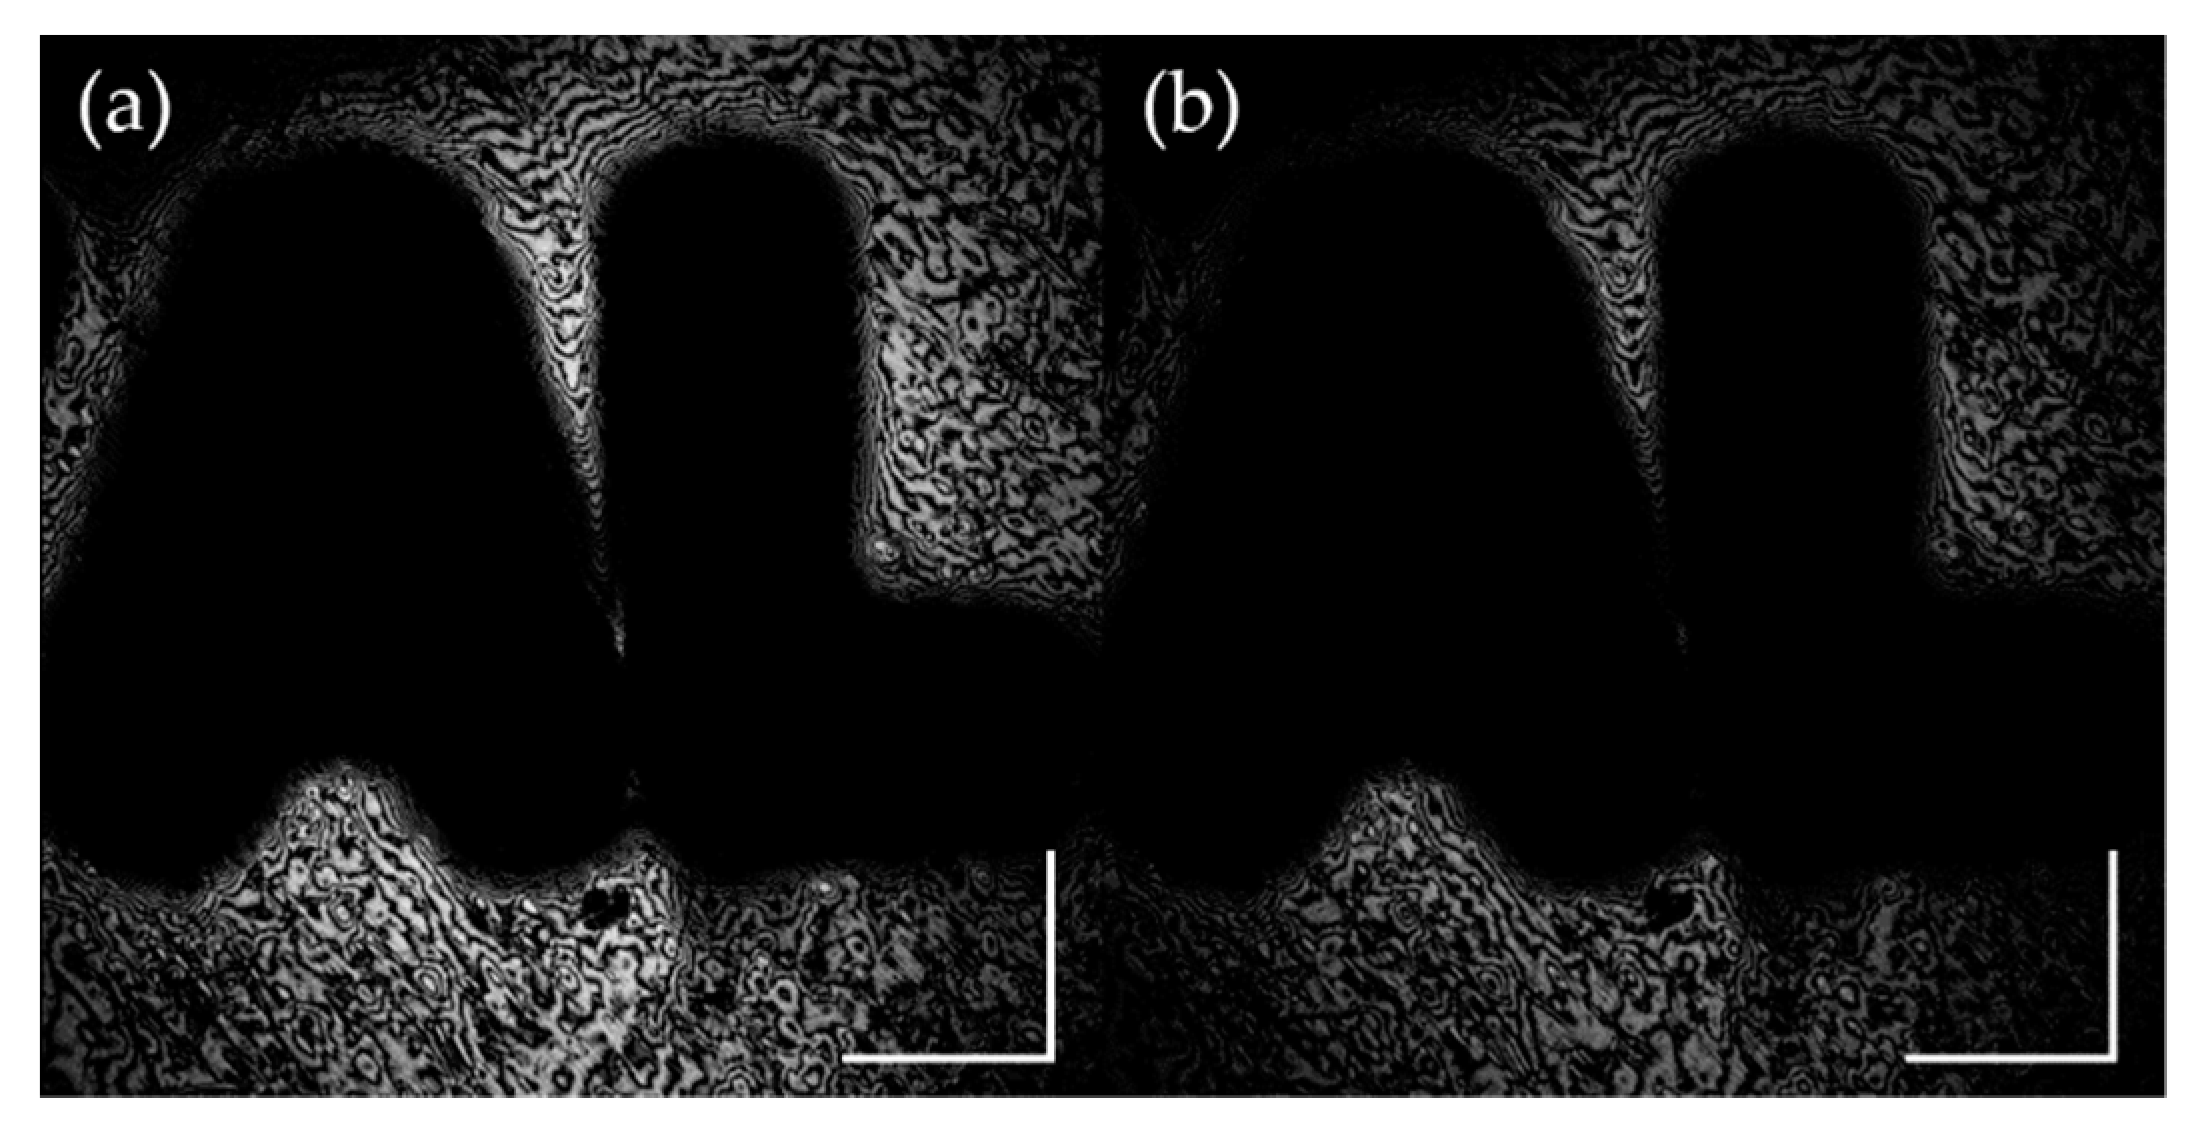
From the four raw images of Figure 2, the squares of two intermediate images of Equations (8) and (9) were calculated, the results of which are shown in Figure 3. In these figures, we can see that there are numerous interference fringes at the bottom surface. One important aspect is that the image in Figure 3a is much brighter than that in Figure 3b. This indicates that the two constants, F and G, are not the same. From these observations, we can see that the phase modulation parameters, B and θ, were not properly applied in the hardware-based adjustments. The letter regions of the coin are dark in both images, which means that the surfaces of the letter are located out of the coherence length of the light source.
To estimate the ratio between F and G in Equation (12), an area average of each intermediate image was conducted according to Equation (13) with a varying window size. The size of the average window was changed from a size of 1 × 1 to 512 × 512. In other words, we calculated a series of 512 different Γs to test their convergence with the size of the area-average window. The result is shown in Figure 4. Interestingly, the Γ varied severely with the window size at the beginning, but it then converged to a value of 1.51 from a pixel resolution of 320 × 320. From this result, the constant G was corrected. With the corrected G and the original F values, the intermediate images of Figure 3 were re-calculated and re-depicted in Figure 5. We can see that, with the Γ factor correction, the brightness levels in Figure 5a,b become similar to each other.
At least in principle, the two intermediate images given by Equations (8) and (9) are 90° out of phase. Thus, after equalizing the constants F and G, by taking the sum of the two images of Figure 5, we can finally reconstruct the corrected en face image using Equation (14). In Figure 6, an image reconstructed using the correction is compared with that using a conventional approach. We can see that the image from the conventional approach, shown in Figure 6a, has severe residual interference fringes even after the image reconstruction. However, in the corrected image, shown in Figure 6b, the residual fringes are removed almost completely, indicating that the proposed method is highly effective in the enhancement of a pre-reconstructed FF-OCT en face image.
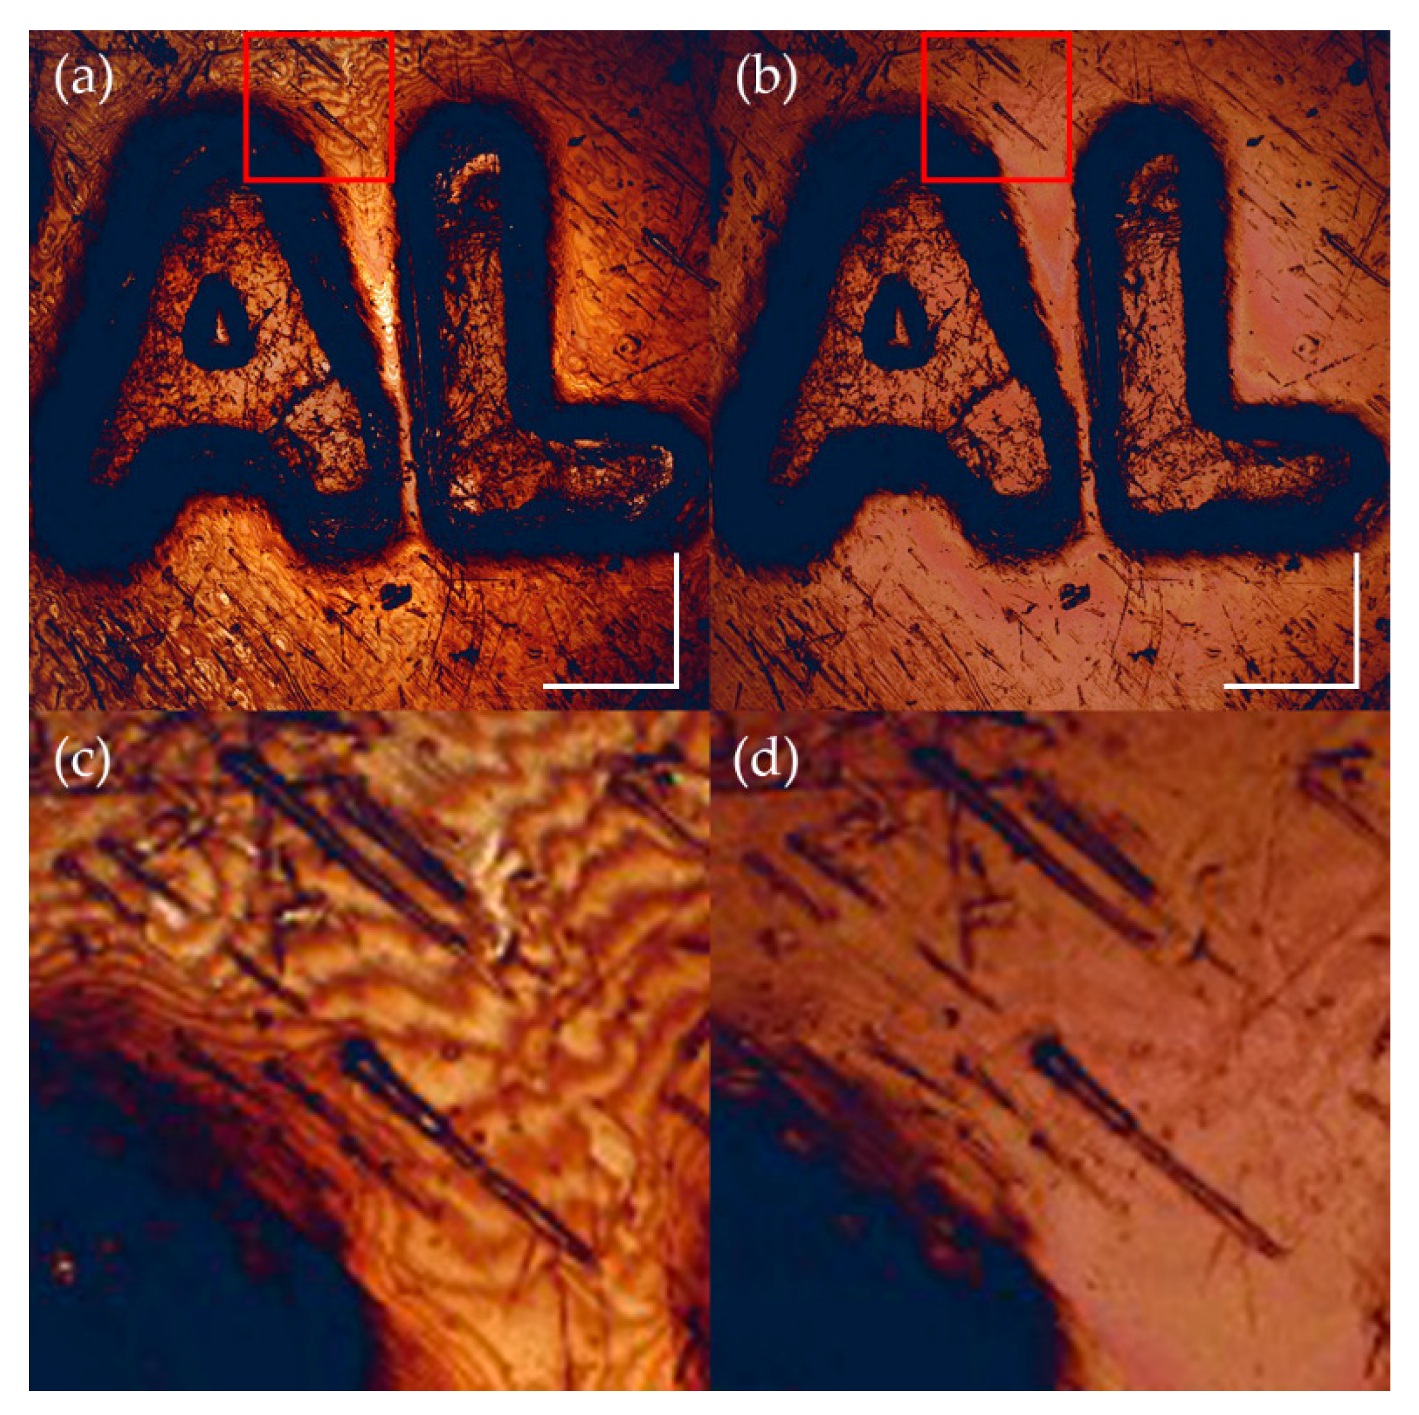
To confirm the usefulness of the proposed method for a post-modulation parameter adjustment, the method was applied not only to a single en face image but also to a three-dimensional (3-D) volume image, composed with a stack of 50 en face images taken at different depths. With the same Philippine coin, a series of interferograms, such as those shown in Figure 2, were first captured at over a 50 μm depth with 1 μm steps, and the corresponding en face images were reconstructed using the conventional method. From a single en face image of the 3-D image, showing the bottom of the coin surface, the correction factor Γ was calculated. Because we had already tested the convergence of Γ in Figure 4, we used the converged value of Γ, i.e., 1.51. Every en face image of the original 3-D volume image was corrected using the same correction factor Γ and the corrected 3-D image was compared with the original image shown in Figure 7.
Figure 7a shows the 3-D FF-OCT image (top view) of the coin, reconstructed without applying the proposed post-processing method. As the motivation for our research, we can see some residual fringes, particularly at the red box in Figure 7a. These residual fringes removed almost completely with the proposed method as shown in Figure 7b. We can clarify this enhancement with the images in Figure 7c,d, which are enlarged images of the red boxes in Figure 7a,b, respectively. It is interesting to note that some scratches on the bottom surface of the coin, which were difficult to distinguish due to the residual fringes, became sharply visible after the correction.

4. Conclusions

An en face tomogram, already reconstructed by using an FF-OCT system, based on the integrating-bucket scheme, was successfully corrected using software-based post-processing. The image reconstruction of the FF-OCT system suffers from artifacts, generally in the form of residual interference fringes, when the phase modulation parameters are not under the prescribed optimal conditions. The artifacts can be removed or reduced by introducing the correction factor Γ, which can be extracted from an already-reconstructed image. The correction factor was extracted from the area average of two intermediate images of the integrating-bucket scheme. Using the FF-OCT image of a Philippine one peso coin, a series of the correction factor Γs were calculated while varying the average window size. The factor varied rapidly at the beginning with the window size, then converged to 1.51. It was observed that the residual interference fringes were almost completely removed, with the correction achieved by using the proposed method. Applying the Γ value extracted from only one sheet of a 3-D image, we could remove the residual fringes on all other sheets, composing the entire 3-D image, covering a depth of 50 μm with 1 μm steps.
As a result, we can say that, compared with a conventional method, the post-processing achieved by the proposed method provides more distinguishable morphological features of the sample surface, by effectively removing or reducing the number of residual interference fringes. It is expected that the proposed method will help to expand the applications of FF-OCT from biomedical imaging to semiconductor wafers or panel inspections.
Author Contributions

Mathematical formulation, J.L.; Experiments and image processing, T.Y.; Writing and reviewing the paper, J.L., T.Y., and B.H.L.; Project administration, B.H.L. All authors have read and agreed to the published version of the manuscript.

Funding

This work was supported by the National Research Foundation of Korea(NRF) grant funded by the Korea government(MSIT) (No. NRF-2019R1F1A1061859).

Acknowledgments

This study was partly supported by the Semiconductor Industry Collaborative Project between GIST (Gwangju Institute of Science and Technology) and SK Siltron Co., Ltd.

Conflicts of Interest

The authors declare no conflict of interest.

References

  1. Dubois, A.; Grieve, K.; Moneron, G.; Lecaque, R.; Vabre, L.; Boccara, C. Ultrahigh-resolution full-field optical coherence tomography. Appl. Opt. 2004, 43, 2874–2883. [Google Scholar] [CrossRef] [PubMed]
  2. Dubois, A.; Vabre, L.; Boccara, C.; Beaurepaire, E. High-resolution full-field optical coherence tomography with a Linnik microscope. Appl. Opt. 2002, 41, 805–812. [Google Scholar] [CrossRef] [PubMed]
  3. Assayag, O.; Grieve, K.; Devaux, B.; Harms, F.; Pallud, J.; Chretien, F.; Boccara, C.; Varlet, P. Imaging of non-tumorous and tumorous human brain tissues with full-field optical coherence tomography. NeuroImage Clin. 2013, 2, 549–557. [Google Scholar] [CrossRef] [PubMed] [Green Version]
  4. Ogien, J.; Dubois, A. A compact high-speed full-field optical coherence microscope for high-resolution in vivo skin imaging. J. Biophotonics 2019, 12, e201800208. [Google Scholar] [CrossRef] [PubMed]
  5. Dubois, A.; Moneron, G.; Grieve, K.; Boccara, C. Three-dimensional cellular-level imaging using full-field optical coherence tomography. Phys. Med. Biol. 2004, 49, 1227–1234. [Google Scholar] [CrossRef] [PubMed]
  6. Choi, W.J.; Jung, S.; Shin, J.G.; Yang, D.; Lee, B.H. Characterization of wet pad surface in chemical mechanical polishing (CMP) process with full-field optical coherence tomography (FF-OCT). Opt. Express 2011, 19, 13343–13350. [Google Scholar] [CrossRef] [PubMed]
  7. Choi, W.J.; Min, G.H.; Lee, B.H.; Eom, J.H.; Kim, J.W. Counterfeit detection using characterization of safety feature on banknote with full-field optical coherence tomography. J. Opt. Soc. Korea 2010, 14, 316–320. [Google Scholar] [CrossRef]
  8. Na, J.; Choi, W.J.; Choi, E.S.; Ryu, S.Y.; Lee, B.H. Image restoration method based on Hilbert transform for full-field optical coherence tomography. Appl. Opt. 2008, 47, 459–466. [Google Scholar] [CrossRef] [PubMed]
  9. Meissner, M. Accuracy Issues of Discrete Hilbert Transform in Identification of Instantaneous Parameters of Vibration Signals. Acta Phys. Pol. A 2012, 121, 164–167. [Google Scholar] [CrossRef]
  10. Stoilov, G.; Dragostinov, T. Phase-stepping interferometry: Five-frame algorithm with an arbitrary step. Opt. Lasers Eng. 1997, 28, 61–69. [Google Scholar] [CrossRef]
  11. Lai, G.; Yatagai, T. Generalized phase-shifting interferometry. J. Opt. Soc. Am. A 1991, 8, 822–827. [Google Scholar] [CrossRef]
  12. Sasaki, O.; Okazaki, H.; Sakai, M. Sinusoidal phase modulating interferometer using the integrating-bucket method. Appl. Opt. 1987, 26, 1089–1093. [Google Scholar] [CrossRef] [PubMed]
  13. Dubois, A. Phase-map measurements by interferometry with sinusoidal phase modulation and four integrating buckets. J. Opt. Soc. Am. A 2001, 18, 1972–1979. [Google Scholar] [CrossRef] [PubMed]
  14. Mazlin, V.; Xiao, P.; Dalimier, E.; Grieve, K.; Irsch, K.; Sahel, J.-A.; Fink, M.; Boccara, A.C. In vivo high resolution human corneal imaging using full-field optical coherence tomography. Biomed. Opt. Express 2018, 9, 557–568. [Google Scholar] [CrossRef] [PubMed]
Figure 1. The schematic of the full-field optical coherence tomography (FF-OCT) system. BS, beam splitter; L, lens; CCD, charge coupled device; NDF, neutral density filter; RM, reference mirror; PZT, piezoelectric transducer; WG, window glass; AM, angled mirror; MO, microscope objective lens.
Applsci 10 00830 g001
Figure 2. A set of four interferograms of a Philippine one peso coin, acquired at a depth during one complete period of phase modulation. The images (ad) correspond to E1, E2, E3, and E4 of Equation (1), respectively. Two letters, A and L, are identified with the red arrow in (f), an enlarged image of the photograph (e). The imaging plane is the bottom of the coin surface. White scale bars: 200 μm.
Applsci 10 00830 g002
Figure 3. The intermediate images, (a,b), calculated by taking squares of Equations (8) and (9). There are interference fringes at the bottom surface and the letter regions are dark. Furthermore, the difference in brightness between the two images is severe. White scale bars: 200 μm.
Applsci 10 00830 g003
Figure 4. The correction factor Γ, extracted from the intermediate images of Figure 3, calculated using Equation (13), by taking the area averages with a different window size. The result varies rapidly at the beginning, but smoothly converges to 1.51 as the window size increases.
Applsci 10 00830 g004
Figure 5. The intermediate images of Figure 3, but re-calculated with the correction factor of Γ = 1.51. The brightness levels of the re-calculated images in (a,b) become similar to each other after the correction. White scale bars: 200 μm.
Applsci 10 00830 g005
Figure 6. The FF-OCT en face images, reconstructed without (a) and with (b) the proposed post-processing method. With a closer look, we can see residual fringes in (a), especially between the letters A and L. The residual fringes in (a) were almost removed in (b). White scale bars: 200 μm.
Applsci 10 00830 g006
Figure 7. A three-dimensional FF-OCT image (top view) of the Philippine coin, reconstructed using a conventional method (a) and corrected with the proposed post-processing method (b). The enlarged images (c,d), corresponding to the red boxes in (a,b), respectively, show that the residual fringes are well-removed with the proposed method. White scale bars: 200 μm.
Applsci 10 00830 g007