Article

Monitoring and Analysis of Dynamic Characteristics of Super High-rise Buildings using GB-RAR: A Case Study of the WGC under Construction, China

1
College of Geomatics and Geoinformation, Guilin University of Technology, Guilin 541004, China
2
Key Laboratory of Geospace Environment and Geodesy, Ministry of Education, Wuhan University, Wuhan 430079, China
3
School of Geodesy and Geomatics, Wuhan University, Wuhan 430079, China
4
China Railway Siyuan Survey and Design Group Co., LTD, Wuhan 430063, China
5
Guangxi Institute of Natural Resources Survey and Monitoring, Nanning 530023, China
*
Author to whom correspondence should be addressed.
Appl. Sci. 2020, 10(3), 808; https://doi.org/10.3390/app10030808
Submission received: 30 November 2019 / Revised: 15 January 2020 / Accepted: 21 January 2020 / Published: 23 January 2020
(This article belongs to the Special Issue Novel Approaches for Structural Health Monitoring)

Abstract

:
Accurate dynamic characteristics of super high-rise buildings serve as a guide in their construction and operation. Ground-based real aperture radar (GB-RAR) techniques have been applied in monitoring and analyzing the dynamic characteristics of different buildings, but only few studies have utilized them to derive the dynamic characteristics of super high-rise buildings, especially those higher than 400 m and under construction. In this study, we proposed a set of technical methods for monitoring and analyzing the dynamic characteristics of super high-rise buildings based on GB-RAR and wavelet analysis. A case study was conducted on the monitoring and analysis of the dynamic characteristics of the Wuhan Greenland Center (WGC) under construction (5–7 July 2017) with a 636 m design height. Displacement time series was accurately derived through GB-RAR and wavelet analysis, and the accuracy reached the submillimeter level. The maximum horizontal displacement amplitudes at the top of the building in the north–south and east–west directions were 18.84 and 15.94 mm, respectively. The roof displacement trajectory of the WGC was clearly identified. A certain negative correlation between the temperature and displacement changes at the roof of the building was identified. Study results demonstrate that the proposed method is effective for the dynamic monitoring and analysis of super high-rise buildings with noninvasive and nondestructive characteristics.

1. Introduction

The population and public infrastructures in large cities have intensively increased with limited land resources in recent years. Numerous super high-rise buildings have been built in large cities, and some of them exceeding 400 m in height have been constructed as new landmarks to improve the land resource utilization rate and demonstrate the prosperity and development of a city. At the end of 2017, China had 14 out of the top 20 completed super high-rise buildings in the world, in which all of them are more than 420 m in height. Super high-rise buildings will produce sway motions under the influences of sunlight, wind load, construction vibration, temperature, and other factors [1,2,3]. The structure of a super high-rise building will be destroyed when its horizontal displacement exceeds a certain limit value. The dynamic characteristics of a building directly affect the construction measurements that require a stable reference. Therefore, the dynamic characteristics of buildings should be accurately obtained and the performance of structures should be appropriately monitored and diagnosed for the safe construction and healthy operation of super high-rise buildings.
The main methods used to monitor and analyze the dynamic behavior of super high-rise buildings include total station [4], accelerometer sensor [5,6,7], digital vertical meter [8], and Global Navigation Satellite System (GNSS) technology [9,10,11,12,13]. Among the above methods, the total station method needs to install a prism on some feature points of the building, and the data sampling frequency of automatic tracking total station is low, making it difficult to achieve high-frequency data acquisition. The accelerometer sensor method obtains the vibration acceleration of a building by mounting a sensor and acquires the displacement changes by processing the acceleration data from the accelerometer [14,15]. Mounting of accelerometers are typically time-consuming tasks associated with the test. Furthermore, the installation of sensors for some special buildings (such as super tall towers) can be difficult, and accelerometers cannot directly provide accurate structural displacement responses. The digital vertical meter method uses the reserved holes in the floors of super high-rise buildings as the installation channel of the digital vertical meter system to obtain the diurnal oscillation law of the tower body. However, the vertical line is easily affected by the construction factors, wind load, and tower crane operation during the dynamic monitoring period. The total station, accelerometer sensor, and digital vertical meter methods cannot efficiently realize automatic real-time continuous dynamic monitoring of super high-rise buildings. With the improvement of GNSS satellite timing accuracy and the development of the corresponding data processing software, GNSS technology can realize high-frequency data acquisition in the dynamic monitoring of super high-rise buildings. GNSS has all-weather and all-day characteristics, making it widely used in automatic real-time continuous dynamic monitoring of super high-rise buildings, such as La Costanera Tower [4], Canton Tower [7,16], and Tianjin 117 Tower [17]. However, tower crane operation will seriously block the GNSS signal, the steel structure on the roof can cause serious multipath errors, and the vibration and wind load during construction will exert huge noise influence on the GNSS signal for super high-rise buildings under construction. On this basis, a large noise component is found in the GNSS-based deformation signals, making it difficult to accurately extract the high-precision dynamic characteristics of super high-rise buildings. Although the aforementioned methods are accurate and reliable, they only evaluate construction safety by retrieving and analyzing the dynamic characteristics of several feature points on the structure. Thus, effective monitoring and analysis of the overall structural characteristics are difficult. These methods are limited when they are used to monitor high-risk structures because physical contact is required with the monitored structures.
Interferometric Synthetic Aperture Radar (InSAR) has been gradually used in building deformation monitoring because of its noncontact, high monitoring accuracy (centimeter-to-millimeter level), and high spatial resolution. Kui et al. [18] adopted InSAR to monitor the deformation of Bohai Building in Tianjin, China using TerraSAR-X images. The InSAR-derived deformation was verified by leveling at an accuracy at the millimeter level. Wu et al. [19] used a Persistent Scatterer InSAR (PSInSAR) to measure the deformation of urban high-rise buildings and analyzed the temporal–spatial characteristics of building deformation combined with a Google Earth 3D model. InSAR can overcome the drawbacks of conventional monitoring methods (i.e., invasiveness, high cost, and low spatial resolution) and can retrieve the overall structural characteristics. However, this technique cannot be used for dynamic deformation monitoring of structures with high accuracy [20,21] because of the limitations related to its satellite platform (e.g., low revisiting time, geometrical distortion, and atmospheric delay) [22,23]. Ground-based interferometric radar technique has been proposed [24,25,26] to overcome the shortcomings of satellite-based InSAR. This technique can achieve real-time acquisition rates of 200 Hz and can perform high-resolution structural monitoring that reaches less than 1 m [27,28,29]. Additionally, Pieraccini et al. [30] proposed a high-speed CW step-frequency coherent radar that is portable and can be rapidly installed and operated. Ground-based interferometric radar can simultaneously obtain the responses over numerous points, and the radar sensor can be installed by selecting the most favorable orientation for the monitored structure on the basis of monitoring requirement [31]. The significant superiorities of ground-based interferometric radar are related to high-accuracy measurements, limited influence of atmospheric delay on measurement performance, and noninvasive monitoring [32]. This technique has been extensively used in building safety monitoring and analysis since its proposal. Luzi et al. [33] monitored the vibration of buildings (e.g., the Collserola Tower of Barcelona and multistory high-rise residential buildings) using a ground-based real aperture radar (GB-RAR) interferometer. Their results showed that the deformations ranging from micrometers to centimeters can be derived using GB-RAR under good monitoring conditions. Atzeni et al. [34] adopted GB-RAR to acquire the modal shapes of the Leaning Tower of Pisa vibrations and identify its resonance frequency under the effect of natural excitation. Gentile [35] used a ground-based microwave interferometer to measure the dynamic response of the cables of two different cable-stayed bridges, and the results were validated by a piezoelectric accelerometer, demonstrating a good consistency.
Montuori et al. [36] combined GB-RAR, ground-based synthetic aperture radar (GB-SAR), and satellite-based InSAR. The proposed method enabled the estimation of the dynamic characteristics of buildings and deformation monitoring over the surrounding areas at different spatial and temporal scales. Castagnetti et al. [37] discussed the performance of GB-RAR on the structural monitoring of ancient masonry towers. This technique was tested on the Saint Prospero bell tower in Northern Italy, and the results showed a high consistency with an accelerometer-based acquisition system. Previous studies have focused on many different types of buildings, but few studies have concentrated on super high-rise buildings, especially those more than 400 m in height. Therefore, this study proposed a method based on GB-RAR for the monitoring and analysis of dynamic characteristics of super high-rise buildings.
In this study, we used the Wuhan Greenland Center (WGC) which is under construction with a 636 m designed height as the research object. First, GB-RAR was utilized to derive the dynamic deformation information of the WGC from the north–south and east–west directions. Wavelet analysis was used to eliminate the noise in dynamic deformation signals and the accurate dynamic characteristics of the building, such as horizontal displacement, oscillation amplitude, and displacement trajectory, were extracted. Finally, the correlation between the building displacement and temperature was discussed and analyzed. A set of technical methods for monitoring and analyzing the dynamic characteristics of super high-rise buildings using GB-RAR was studied and established.

2. Methodology

The radar monitoring data from the north–south and east–west directions of the WGC were processed using the time series InSAR analysis to derive the dynamic time series (e.g., displacement and oscillation amplitude) of the building. First, the reference time of data processing was selected. Subsequently, the radar data collected during the dynamic monitoring period were processed through differential interference based on the reference time and the deformation changes between the corresponding time intervals were calculated. Finally, the deformation time series of target points of the building was acquired based on the deformation changes obtained in the previous step. Other parameters of dynamic characteristics of the building were obtained. The main data processing and analysis steps are described as follows.

2.1. Reference Time Selection

The start time of radar data acquisition was selected as the reference time for data processing. Assuming that the deformation of the building at this time was zero, the deformation calculated based on the radar data at other times were all related to the reference time.

2.2. Window Processing

The radar data acquired by the IBIS-S system (i.e., the ground-based interferometric radar) were the frequency domain sampling data of the radar signal echo. The frequency domain data must be transformed into the spatial domain through discrete inverse Fourier transform, that is, focusing to extract the deformation information of each resolution range [38]. Since many steel frame structures are found around the monitored building. The echo signal of these resolution units is generally strong, and their side lobes can interfere with the signal of adjacent resolution units, which may distort their deformation signals. Therefore, the Hann window function was applied to process the radar signal before focusing the radar monitoring data in the range direction to eliminate the sidelobe effect.

2.3. Differential Interferometric Processing

GB-RAR is a zero-baseline observation compared with satellite-based SAR. Thus, flat-earth and topographic phases have no influence on the interferometric phase model. Therefore, the differential interferometric phase model obtained by comparing the phase information difference of the target points acquired at different times can be expressed as follows [39]:
ϕ d i f f = 4 π d d e f o λ + ϕ a t m + ϕ n o i s e ,
where ϕ d i f f denotes the interferometric phase, ϕ a t m represents the phase generated by the atmospheric disturbance between the radar and the target, and ϕ n o i s e is the random noise phase. Given that high-frequency (20 Hz) dynamic monitoring was adopted in the monitoring of the WGC, the phase produced by the atmospheric effect is basically negligible after differential interferometric processing. After removing the noise phase, the interferometric phase was unwrapped in one dimension. The monitoring point of deformation d d e f o in the line-of-sight (LOS) direction can be obtained using Equation (1). The deformation time series of the target points in the range direction can be derived based on the monitoring time span.

2.4. Gross Error Detection

Considering that the WGC is in the construction state during the monitoring period, the actual monitoring environment is complex, and the radar signal is simultaneously affected by various factors, such as construction vibration, wind load, temperature, and sunlight. Gross errors may be found in the deformation time series obtained based on the radar signal. Therefore, the gross error in the deformation time series of the monitoring target point should be detected. The deformation corresponding to this moment is removed when the gross error is detected in the deformation time series. The deformation at this moment is interpolated based on the deformation data before and after this moment. Gross error detection was performed on the deformation time series until no gross error was found in the time series.

2.5. Wavelet Analysis Denoising

After gross error detection, the deformation time series of the target point may still have a certain amount of noise. To reduce the influence of noise and improve the signal-to-noise ratio, a wavelet threshold denoising method was used to process the deformation time series of the target point. During the processing, the wavelet function “sym4” was selected, the deformation time series was decomposed into seven layers by wavelet multi-scale analysis, the threshold value was estimated by Heuresure criterion, and the threshold value was quantified by soft threshold method [40,41,42]. On this basis, denoising analysis of the deformation time series of the target point was carried out.

3. Experiment Description

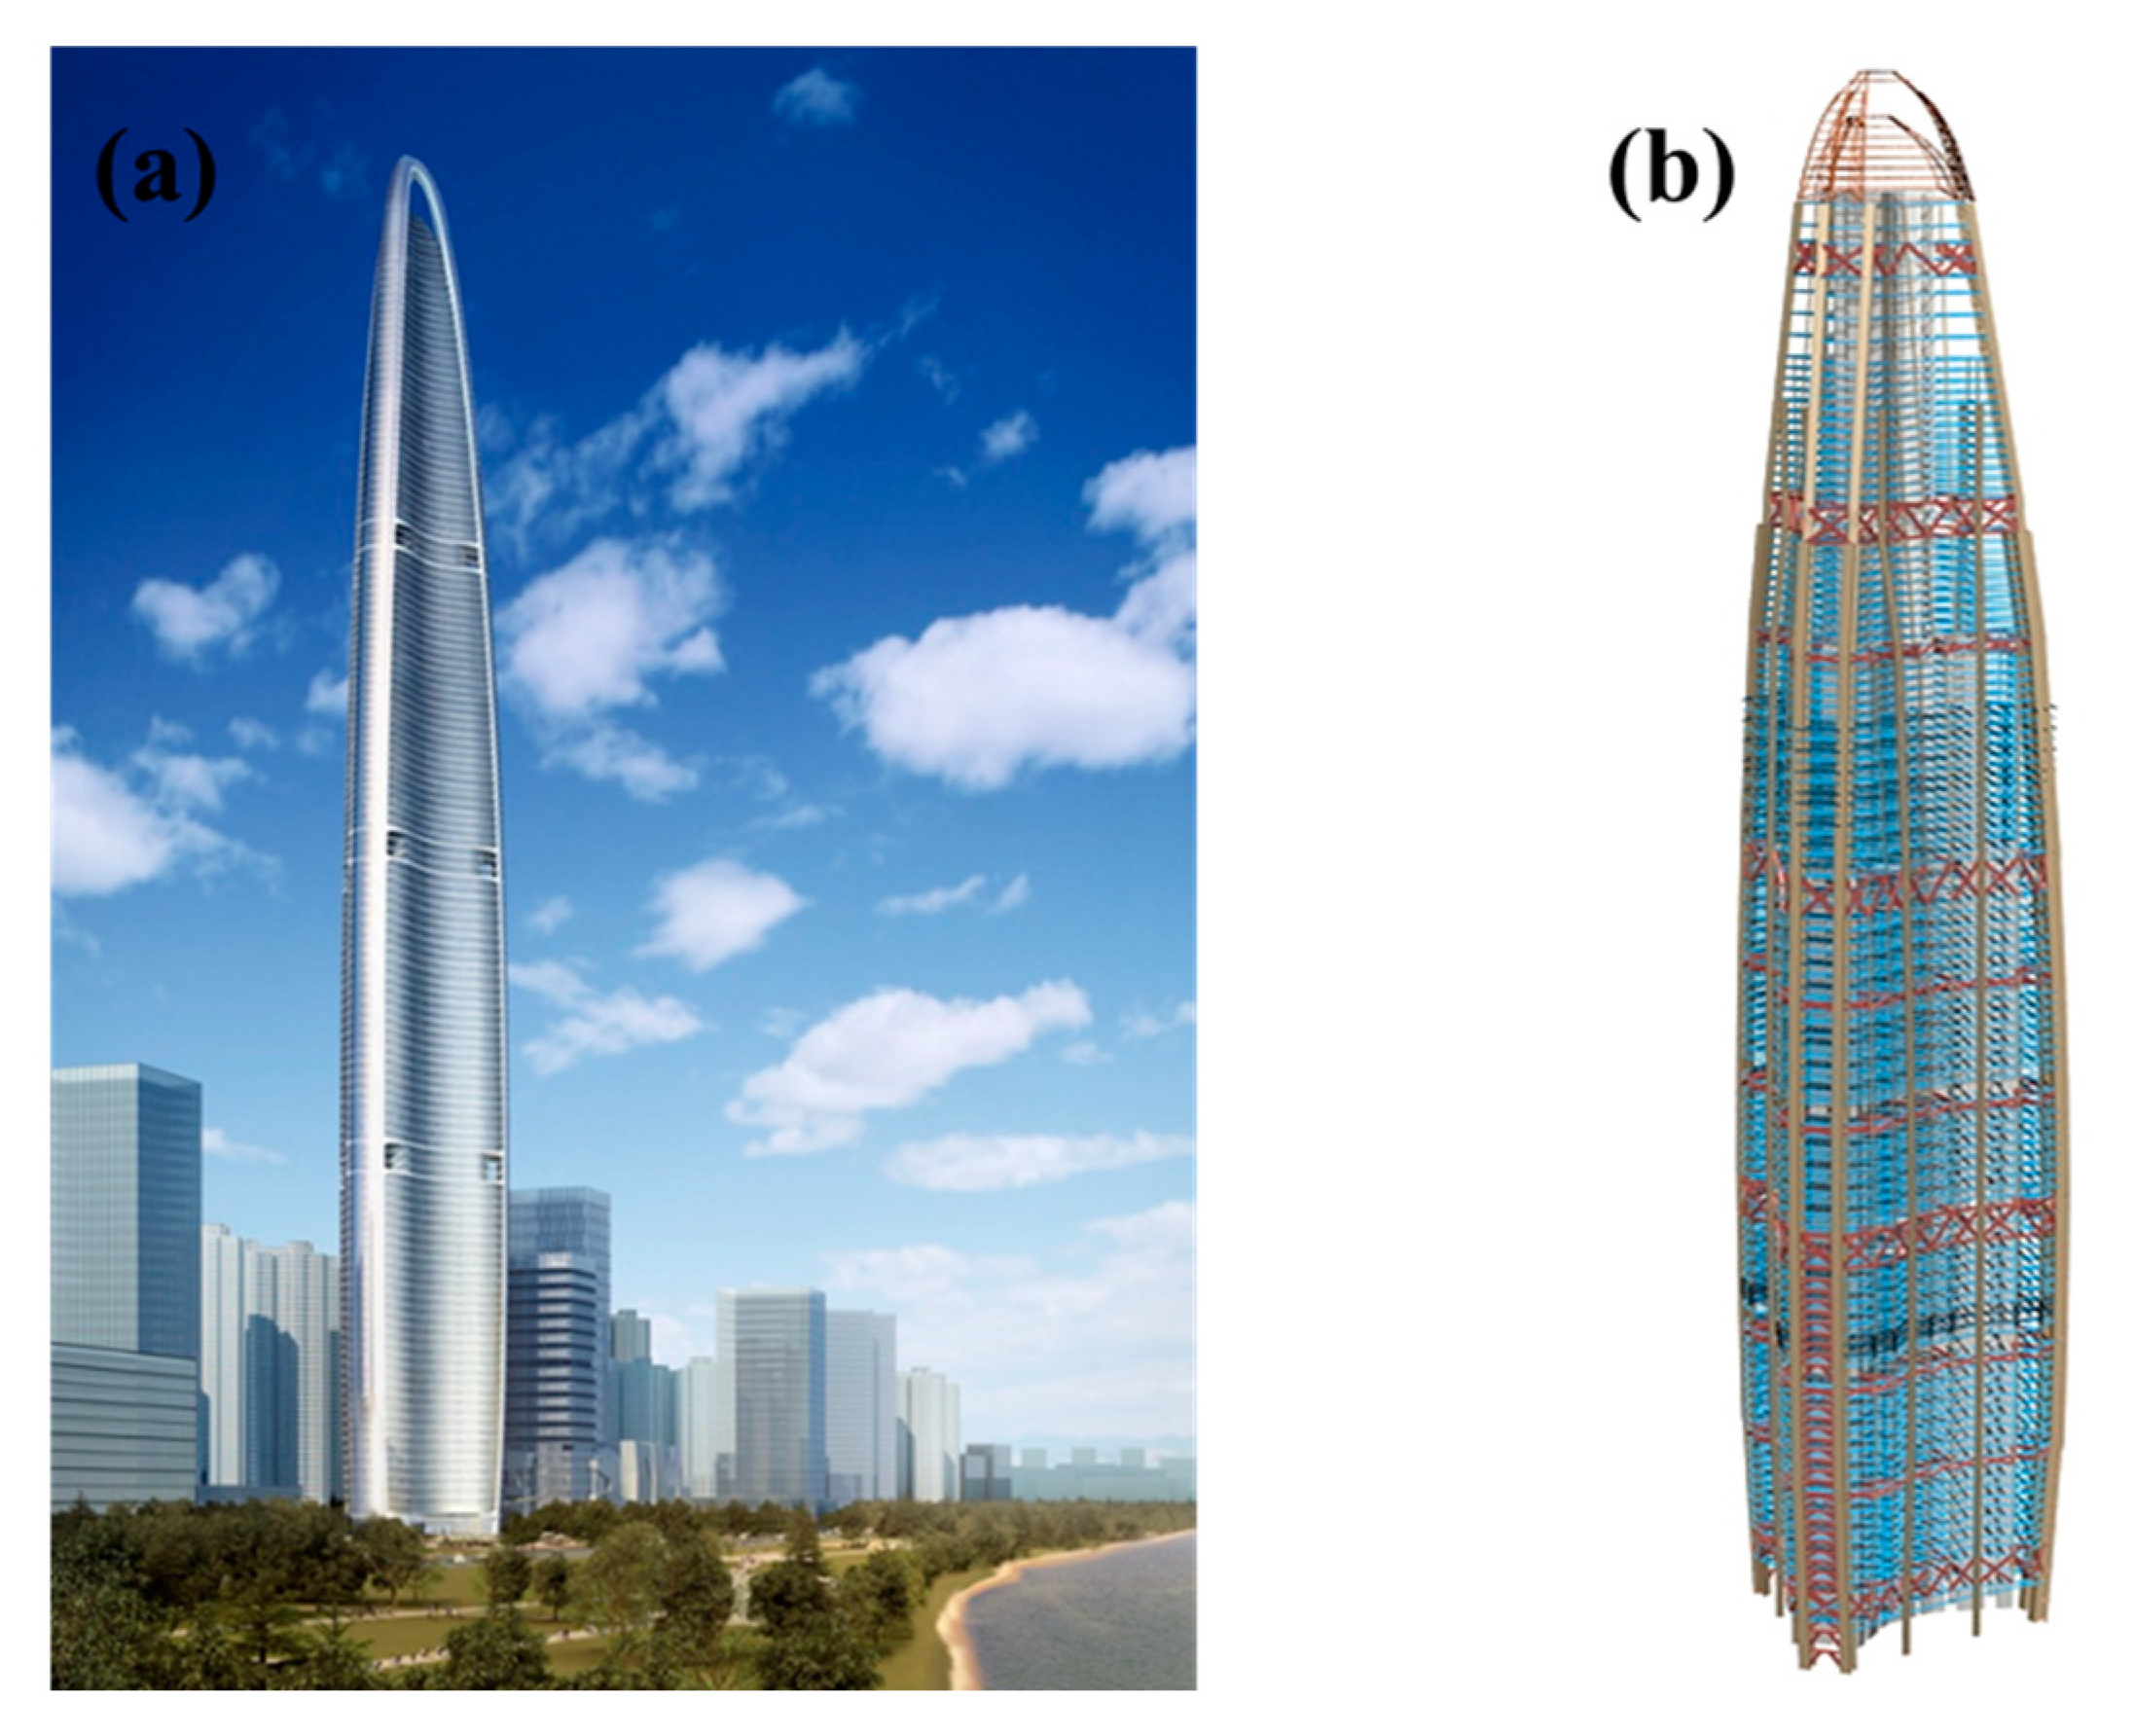
3.1. Monitored Object

The monitored object is the WGC in Wuhan, China, which is a super high-rise main building on plot A01 of the Wuhan Greenland International Financial City (Figure 1a). The building is located in the core area of the Wuchang Bin Jiang Business District, which is approximately 250 m away from the Yangtze River flood dyke. The main building of the WGC has five basement floors, with a building area of 70,171 m2. The building has 125 floors above ground, with a building height of 636 m and building area of 302,399 m2, and the average building area of each floor is 2419 m2. The total steel consumption of the building is approximately 80,000 tons.
The structural system of the WGC is a “steel frame concrete core tube” structural system, with a concrete core tube inside and steel frames on the outside and on top (Figure 1b). The main tower has four sets of wind grooves from top to bottom. Wind can pass through the hall to reduce the harm of strong wind to the building. The steel structure of the main tower is composed of 12 mega stiffening columns in the outer frame, 18 outer frame gravity columns, reinforced concrete core tubes with shear wall steel ribs, floor steel beams, 10 ring trusses, 4 outrigger trusses, and a 60 m high tower crown and canopy. The partial floor adopts profiled steel plate and cast-in-place concrete composite floor, and the pressed steel plate adopts galvanized steel plate with color coating. The total height of the concrete core tube is 552 m, the core tube is adducted twice at the 72nd and 88th floors, and the floor area is reduced accordingly. During the construction of the WGC, the construction progress of the external steel structure lags behind that of the concrete core tube. The concrete core tube is constructed in the top formwork, which adopts a steel platform structure climbing system to facilitate the construction and measurement of the workers.

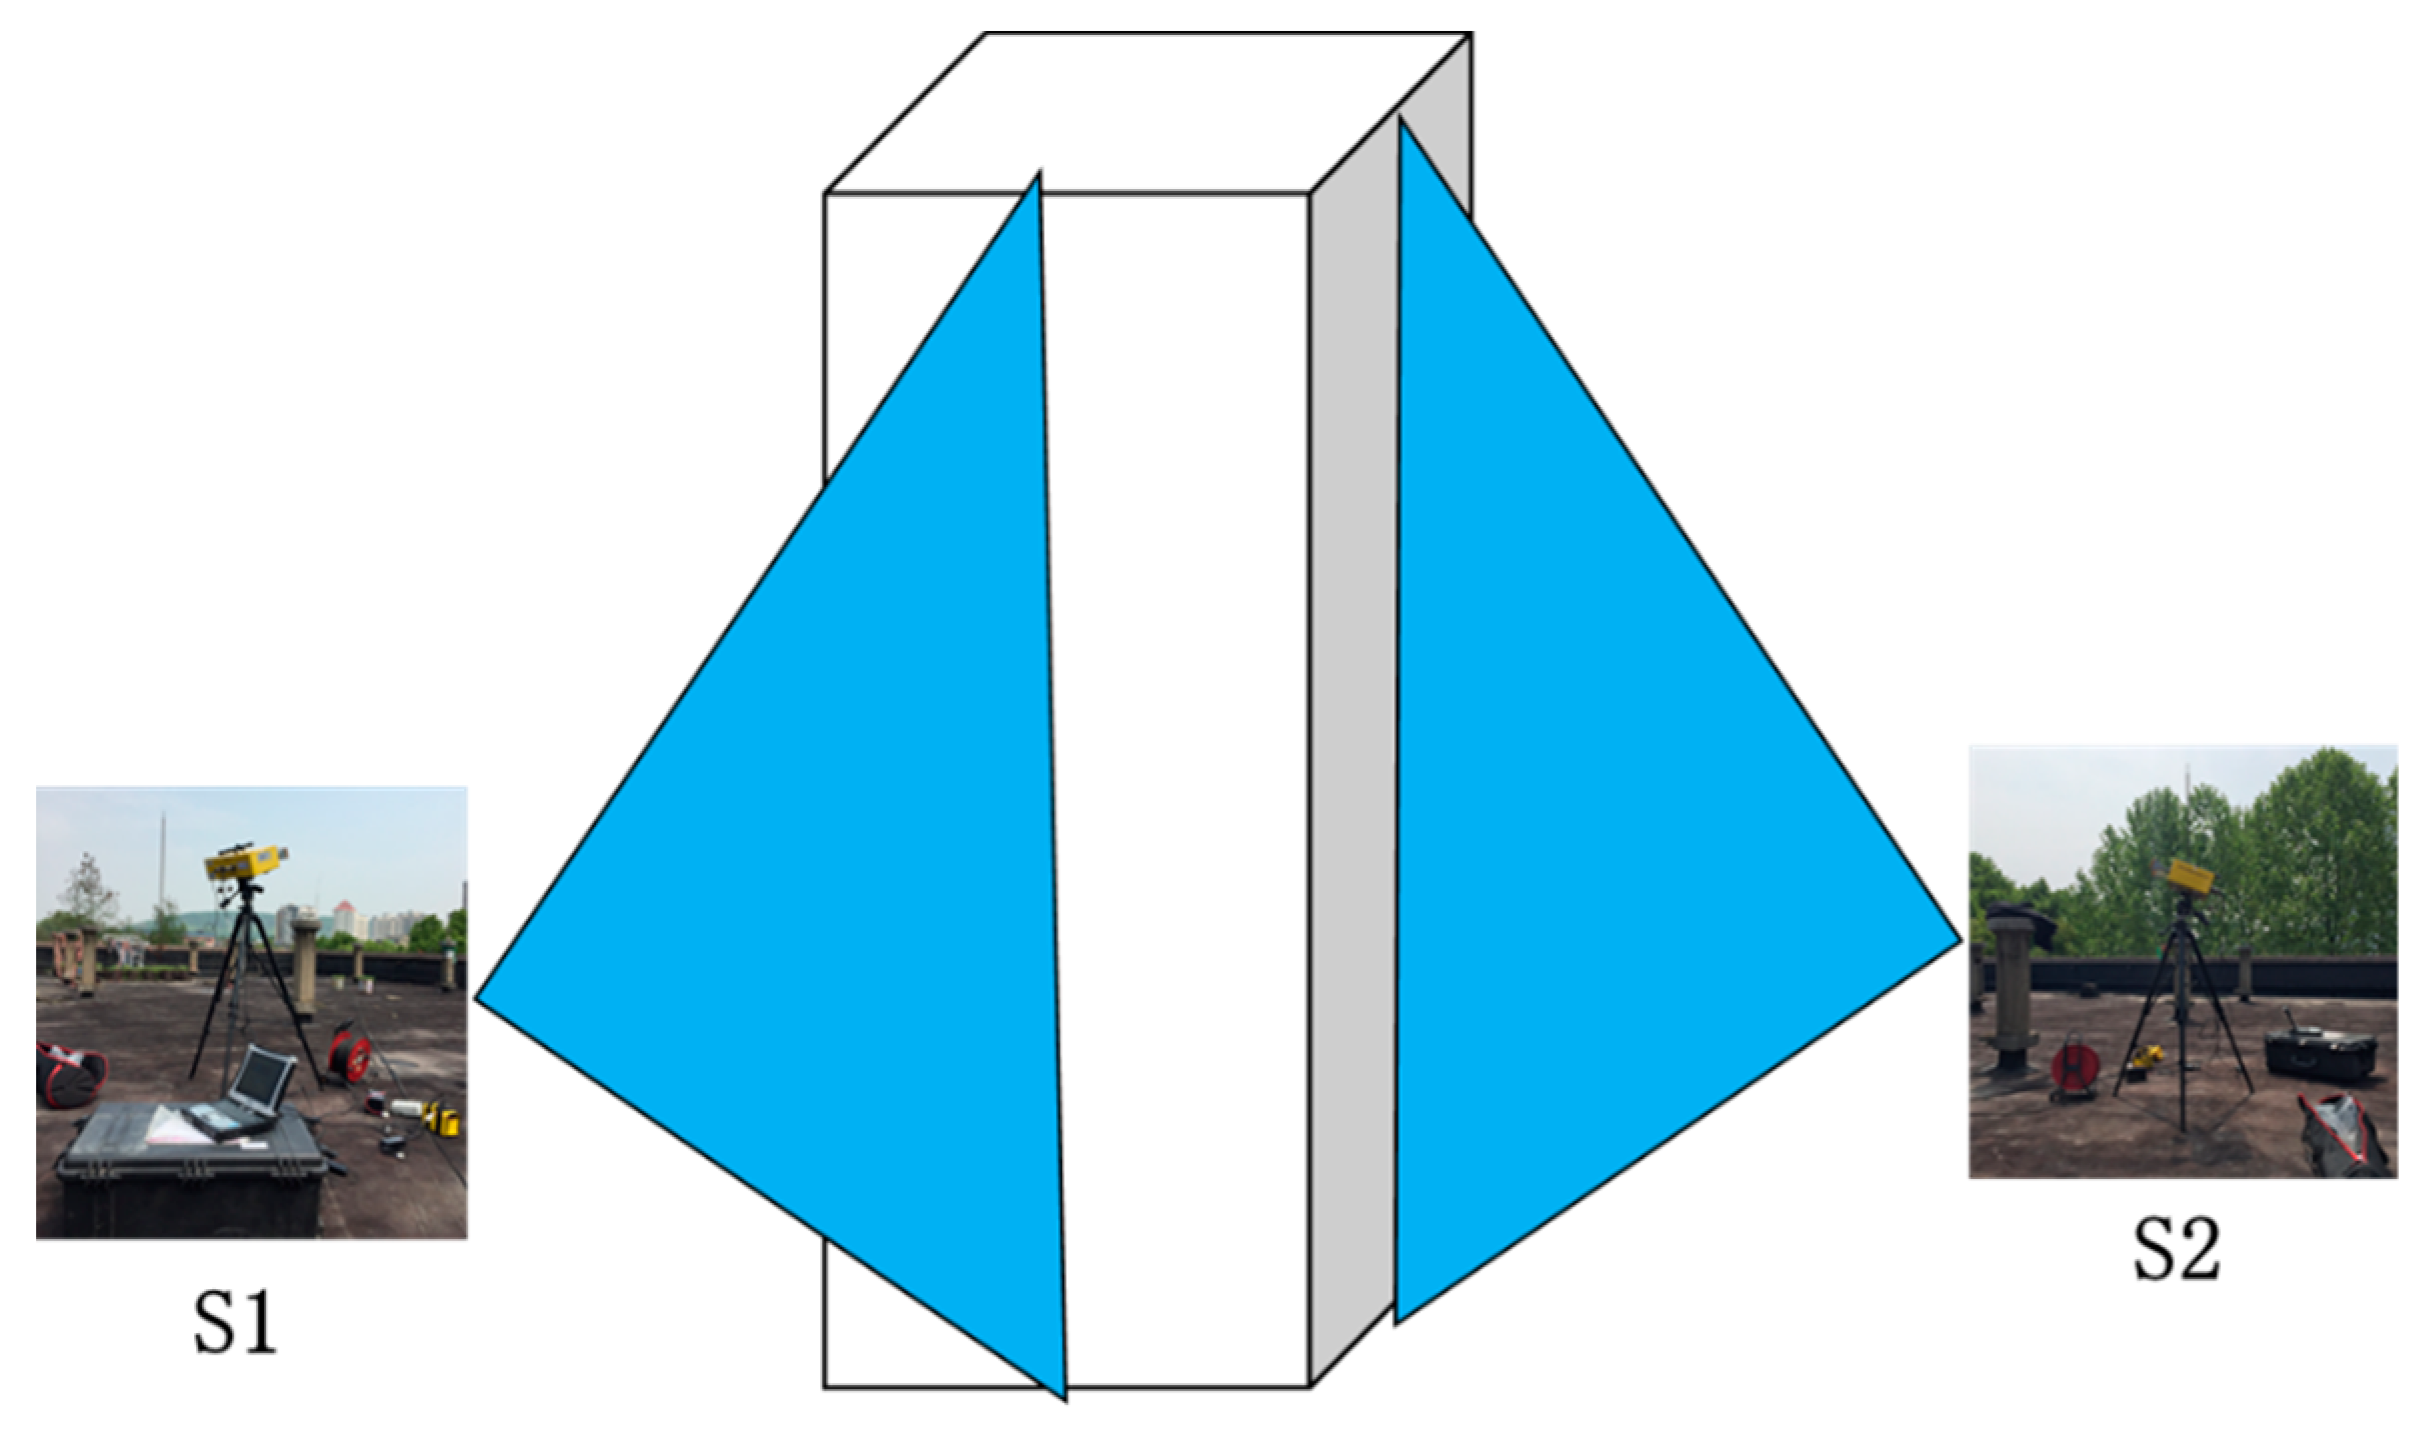
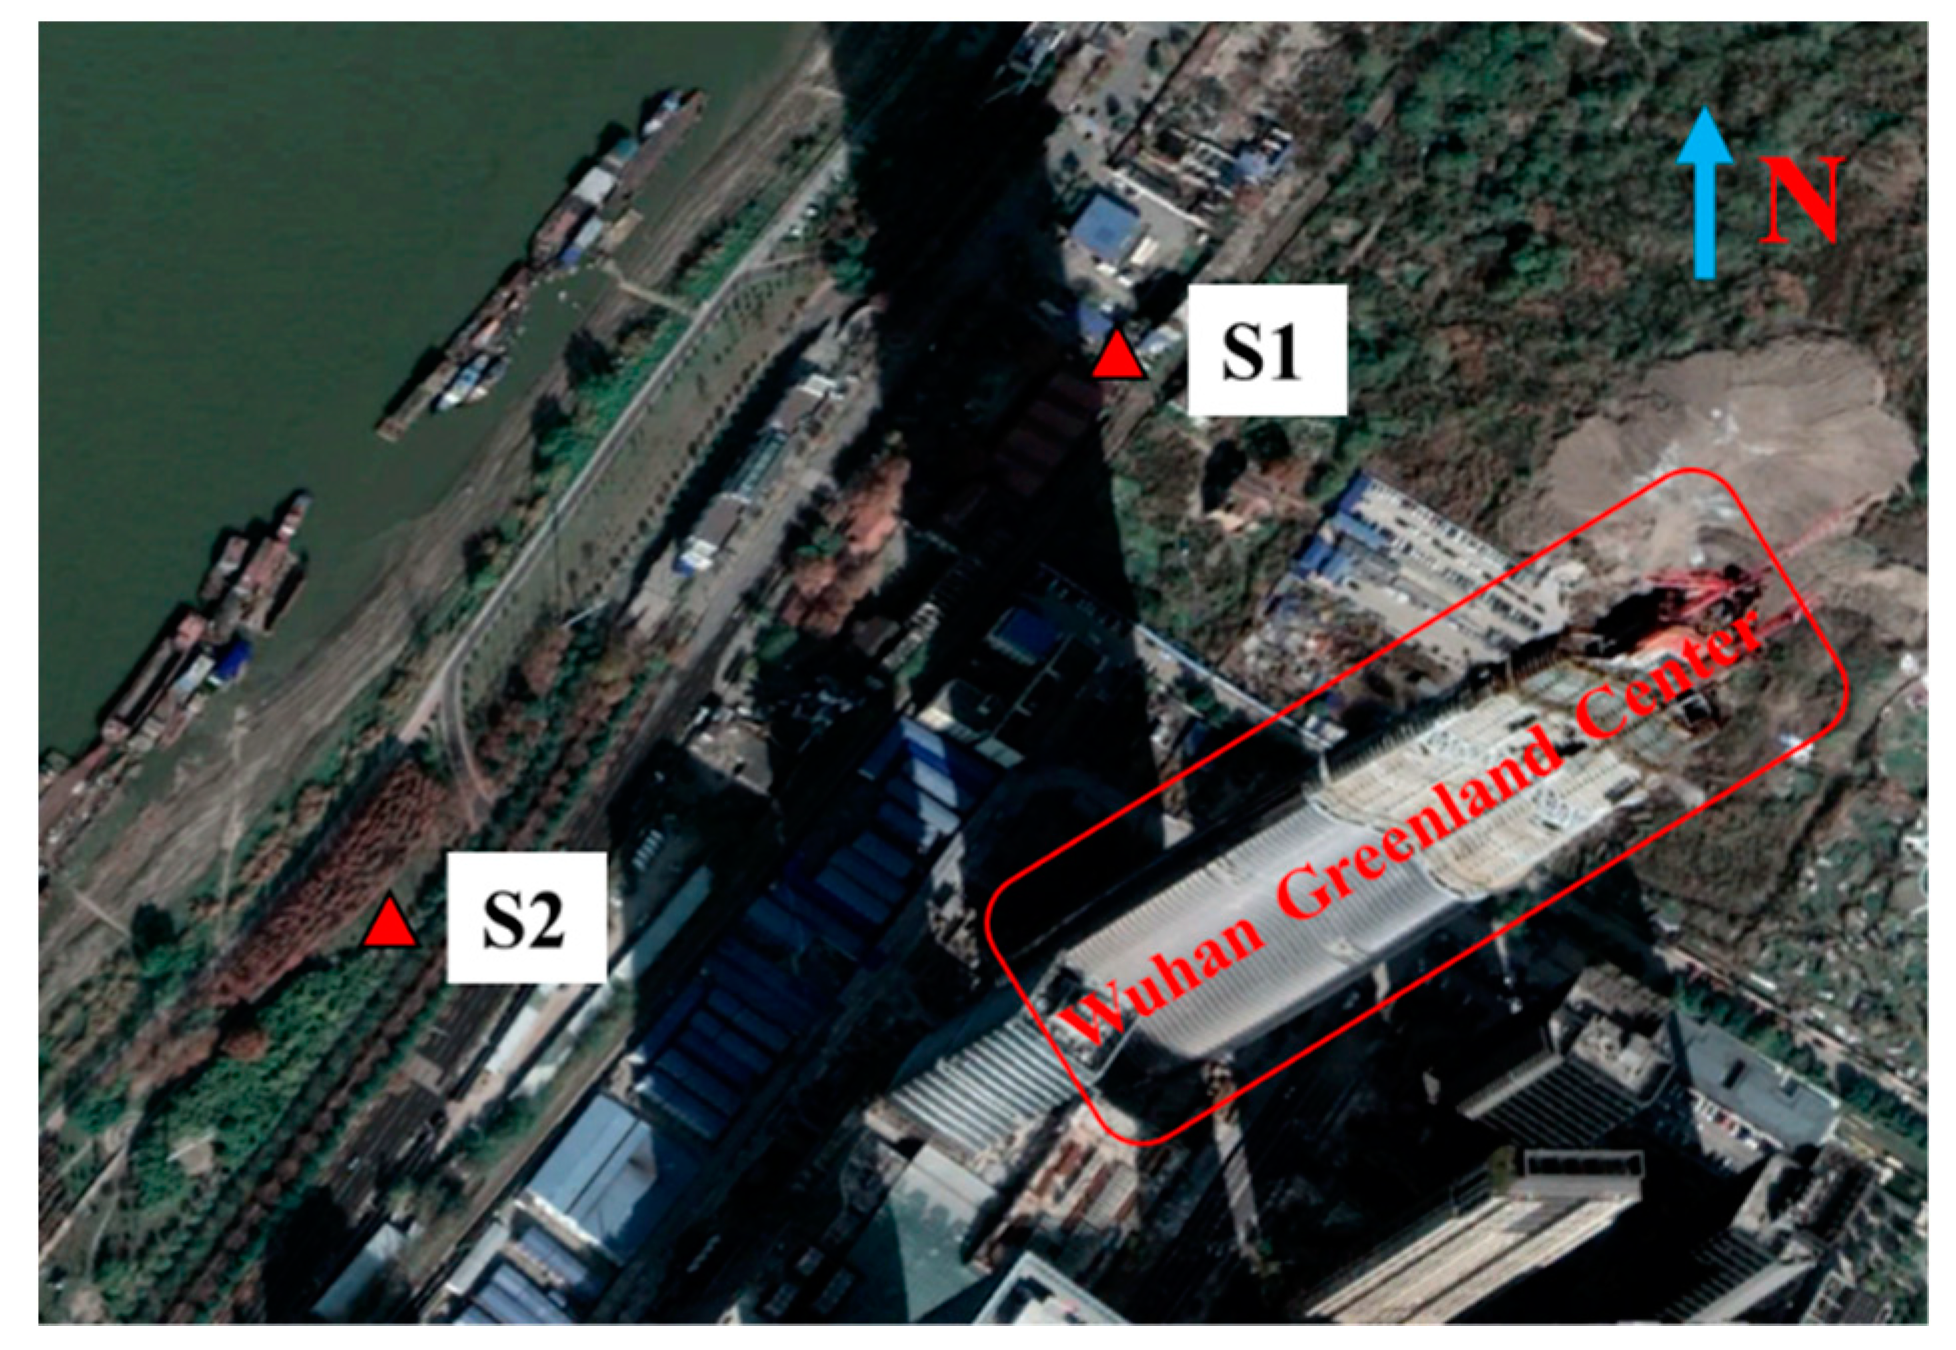
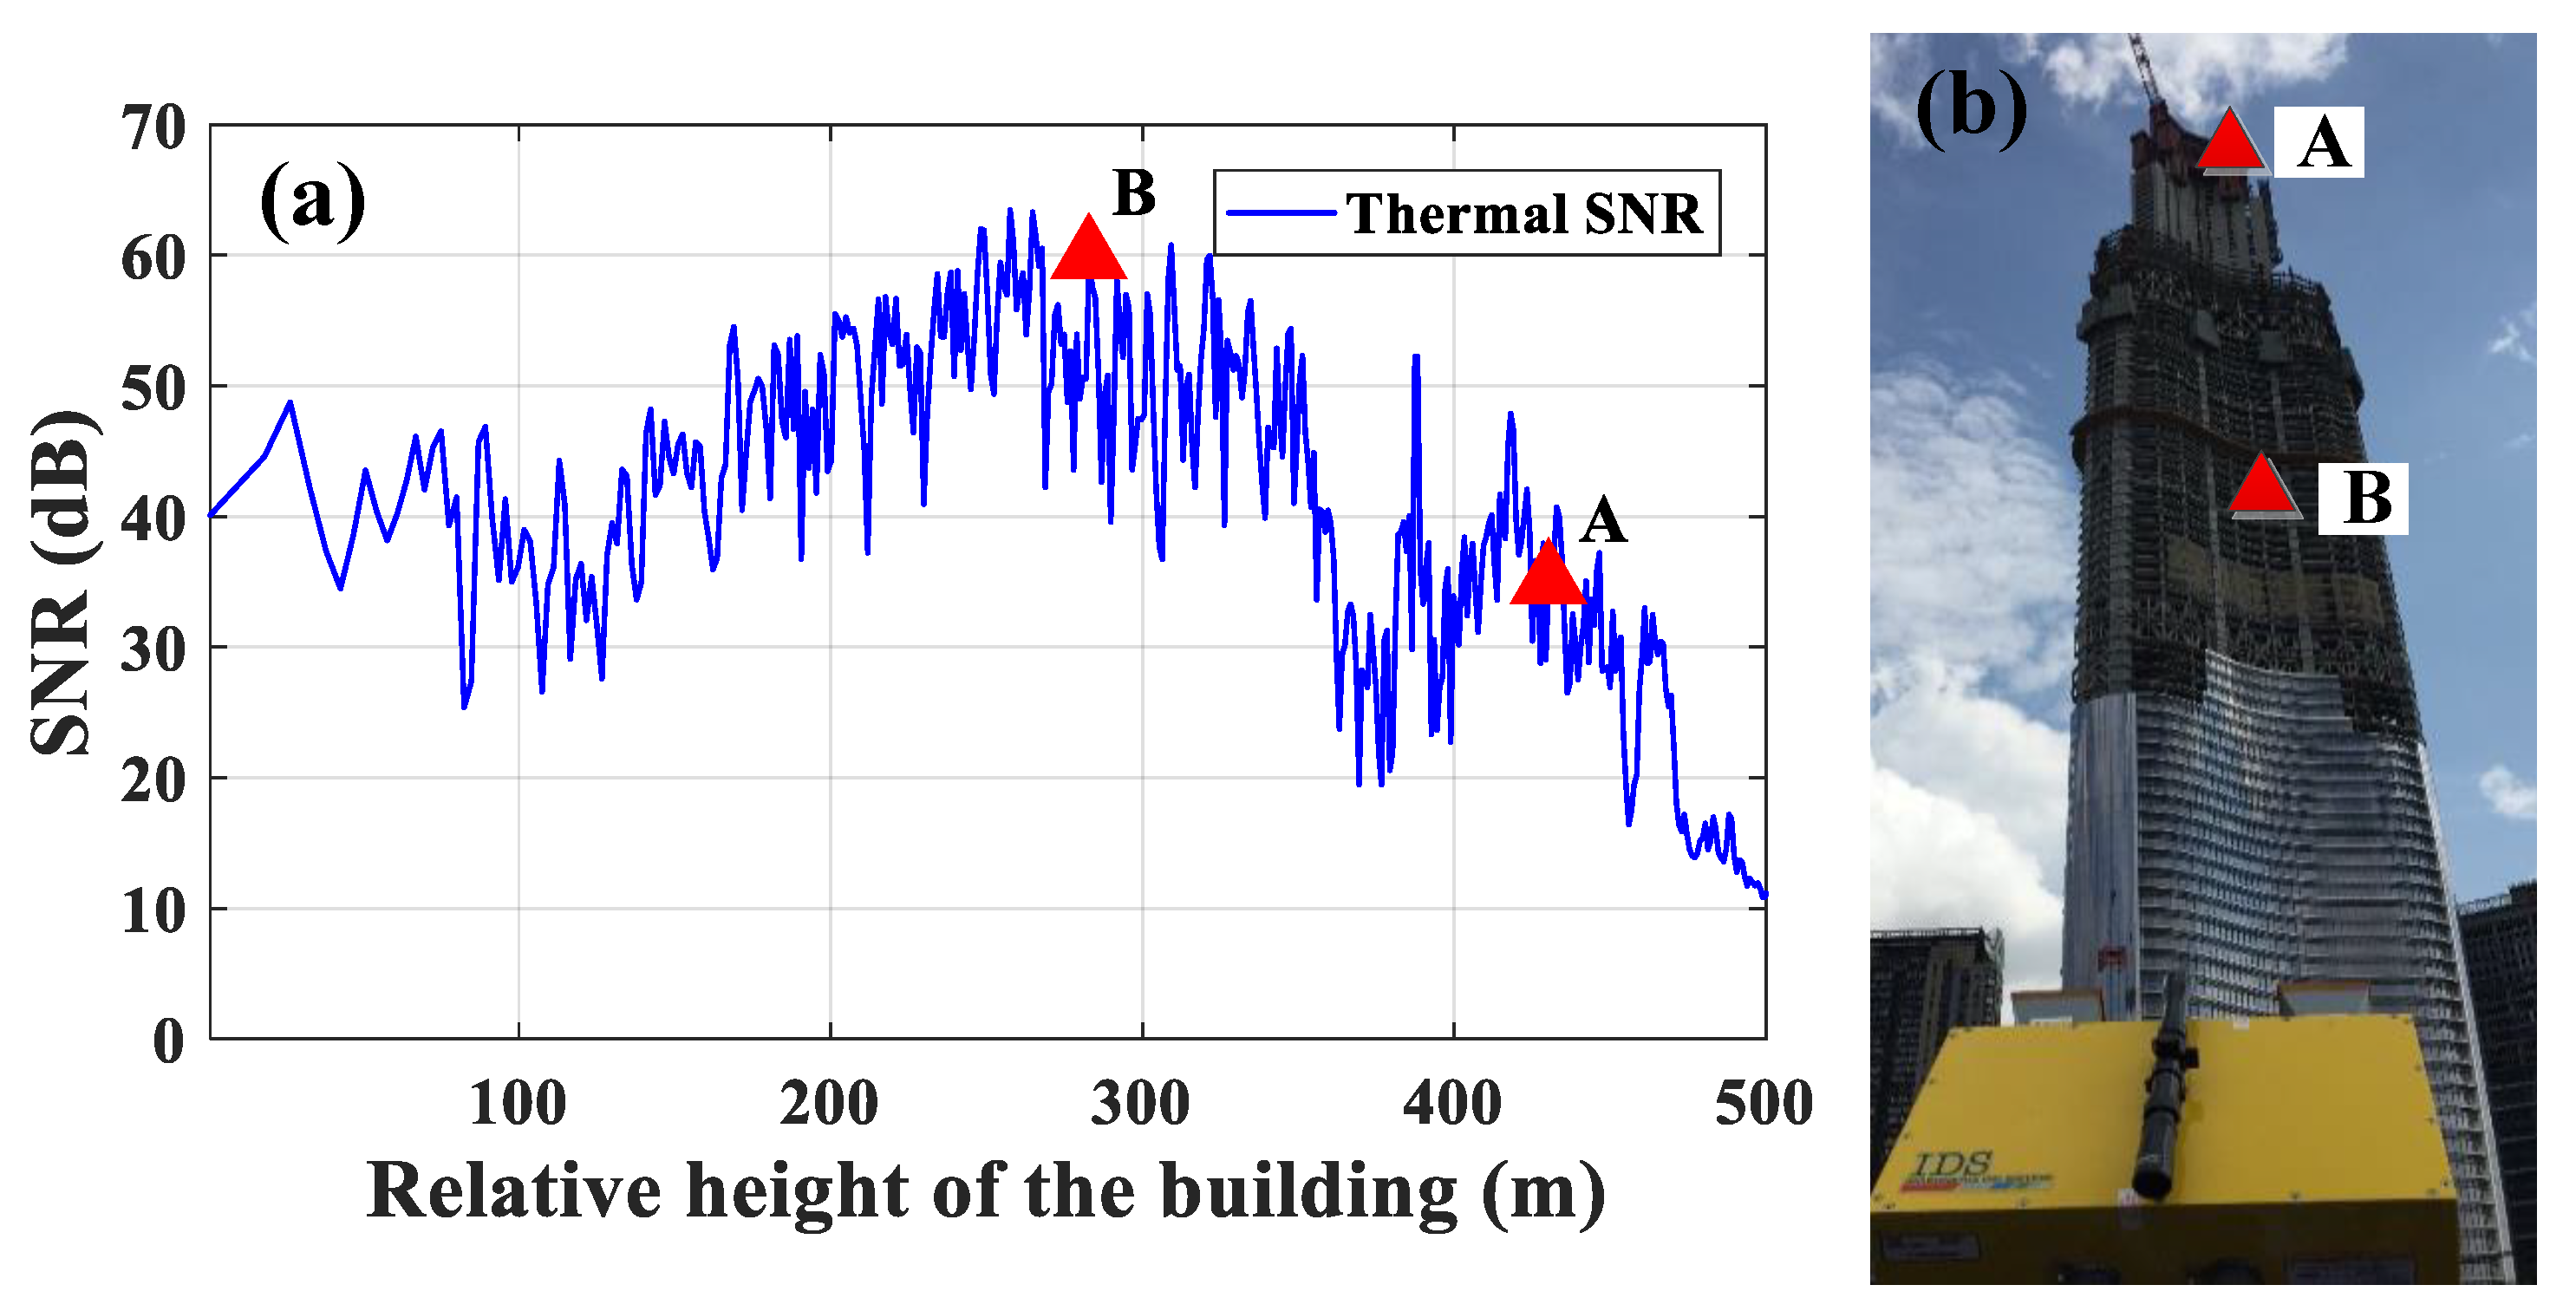
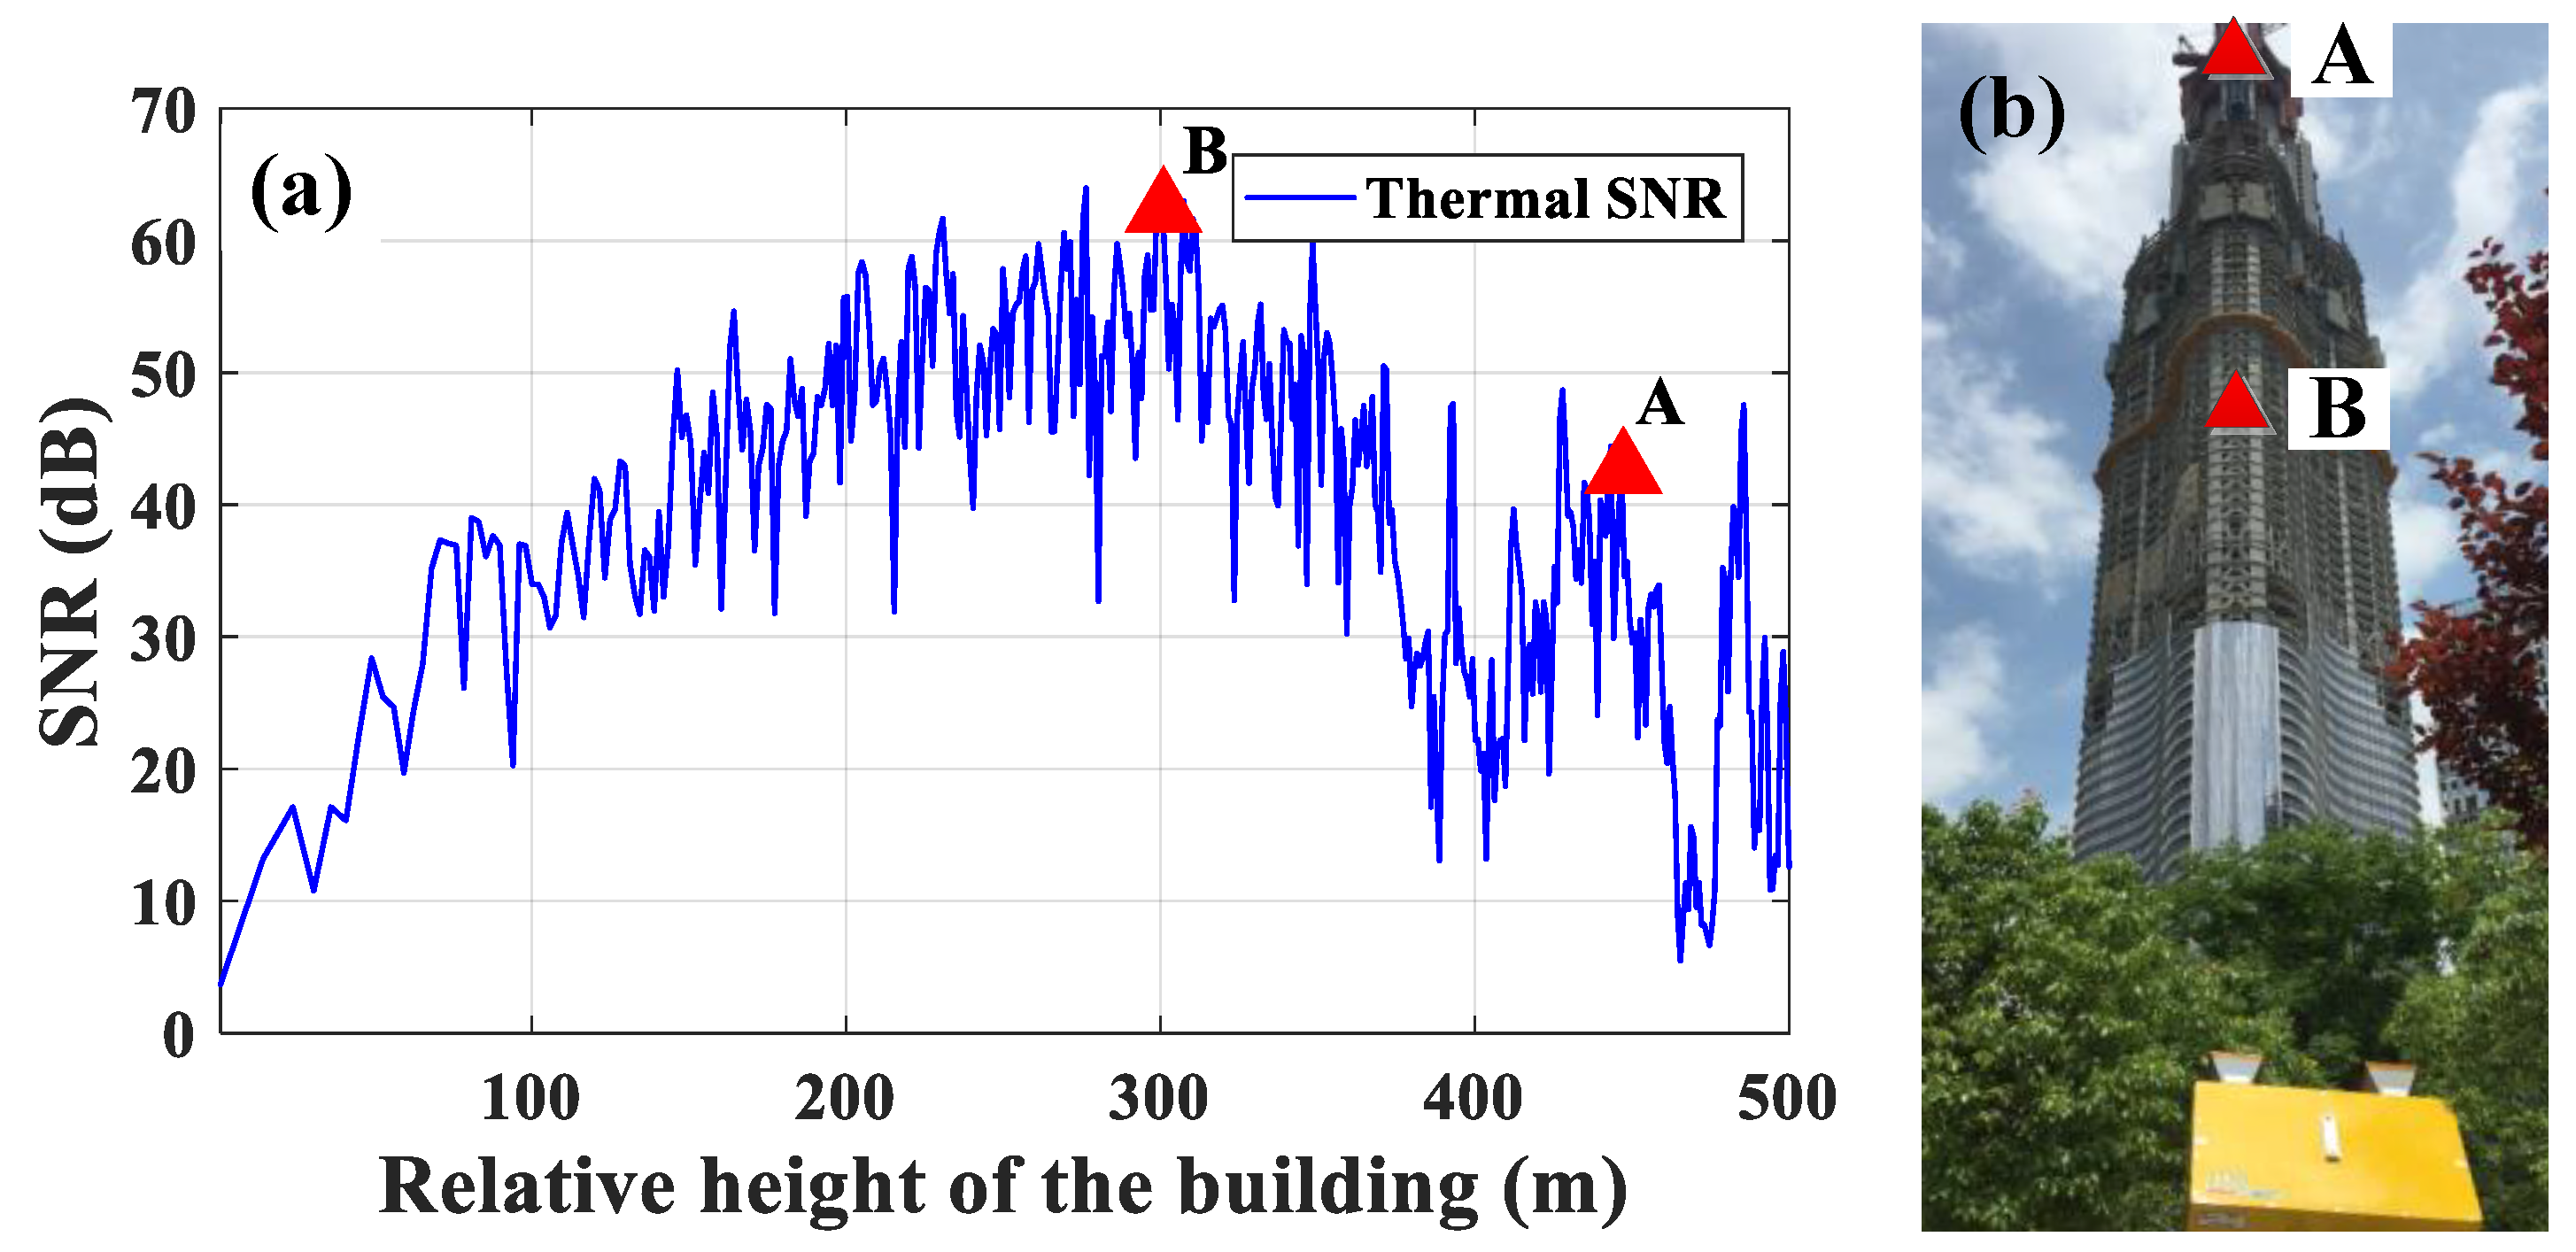
3.2. Monitoring Scheme Design

The WGC under construction underwent dynamic deformation because of solar radiation, construction vibration, wind load, temperature, and other factors. Traditional monitoring methods (e.g., GNSS, total station, and sensors) need to be in contact with the building, and the monitoring points are difficult to arrange when monitoring the dynamic characteristics of the building. The large tower crane on top of the building during construction caused serious effects (such as signal blocking and multipath effect) on GNSS measurement, making it difficult to effectively obtain the dynamic characteristics of the building using GNSS. Satellite-based SAR cannot obtain the high-accuracy horizontal displacement dynamic information of the building because of the influences of the revisit period, imaging angle, and monitoring distance. GB-RAR can set reasonable monitoring base points based on the monitoring requirements, adjust the most favorable radar imaging angle to achieve the noncontact high-accuracy continuous deformation monitoring of the building, and can simultaneously monitor multiple target points in the radar field of view. Therefore, the IBIS-S system was adopted to conduct high-accuracy continuous monitoring of the WGC under construction, and the dynamic characteristics of the building were extracted and analyzed based on the acquired radar signal data.
In this study, two IBIS-S systems were simultaneously used to conduct high-accuracy continuous deformation monitoring of the WGC. Working base points S1 and S2 were established in the north–south and east–west directions of the building, and IBIS-S systems were installed in S1 and S2, as shown in Figure 2. The IBIS-S systems were used to conduct radar scanning of the WGC along the north–south and east–west directions for acquiring high spatial–temporal resolution radar images of the building and continuously obtain multiscene radar images. The displacement changes of the building along the monitoring direction can be obtained through interferometry, and the precise oscillation amplitude of the building can be calculated based on the GB-RAR-derived displacement. Radar monitoring adopted the high-frequency data acquisition mode (sampling frequency was 20 Hz). The horizontal displacement variation of the building and the displacement trajectory of the roof were computed through straightforward geometric projections based on the radar incidence angle, because the IBIS-S systems can only obtain the deformation of the radar LOS direction.

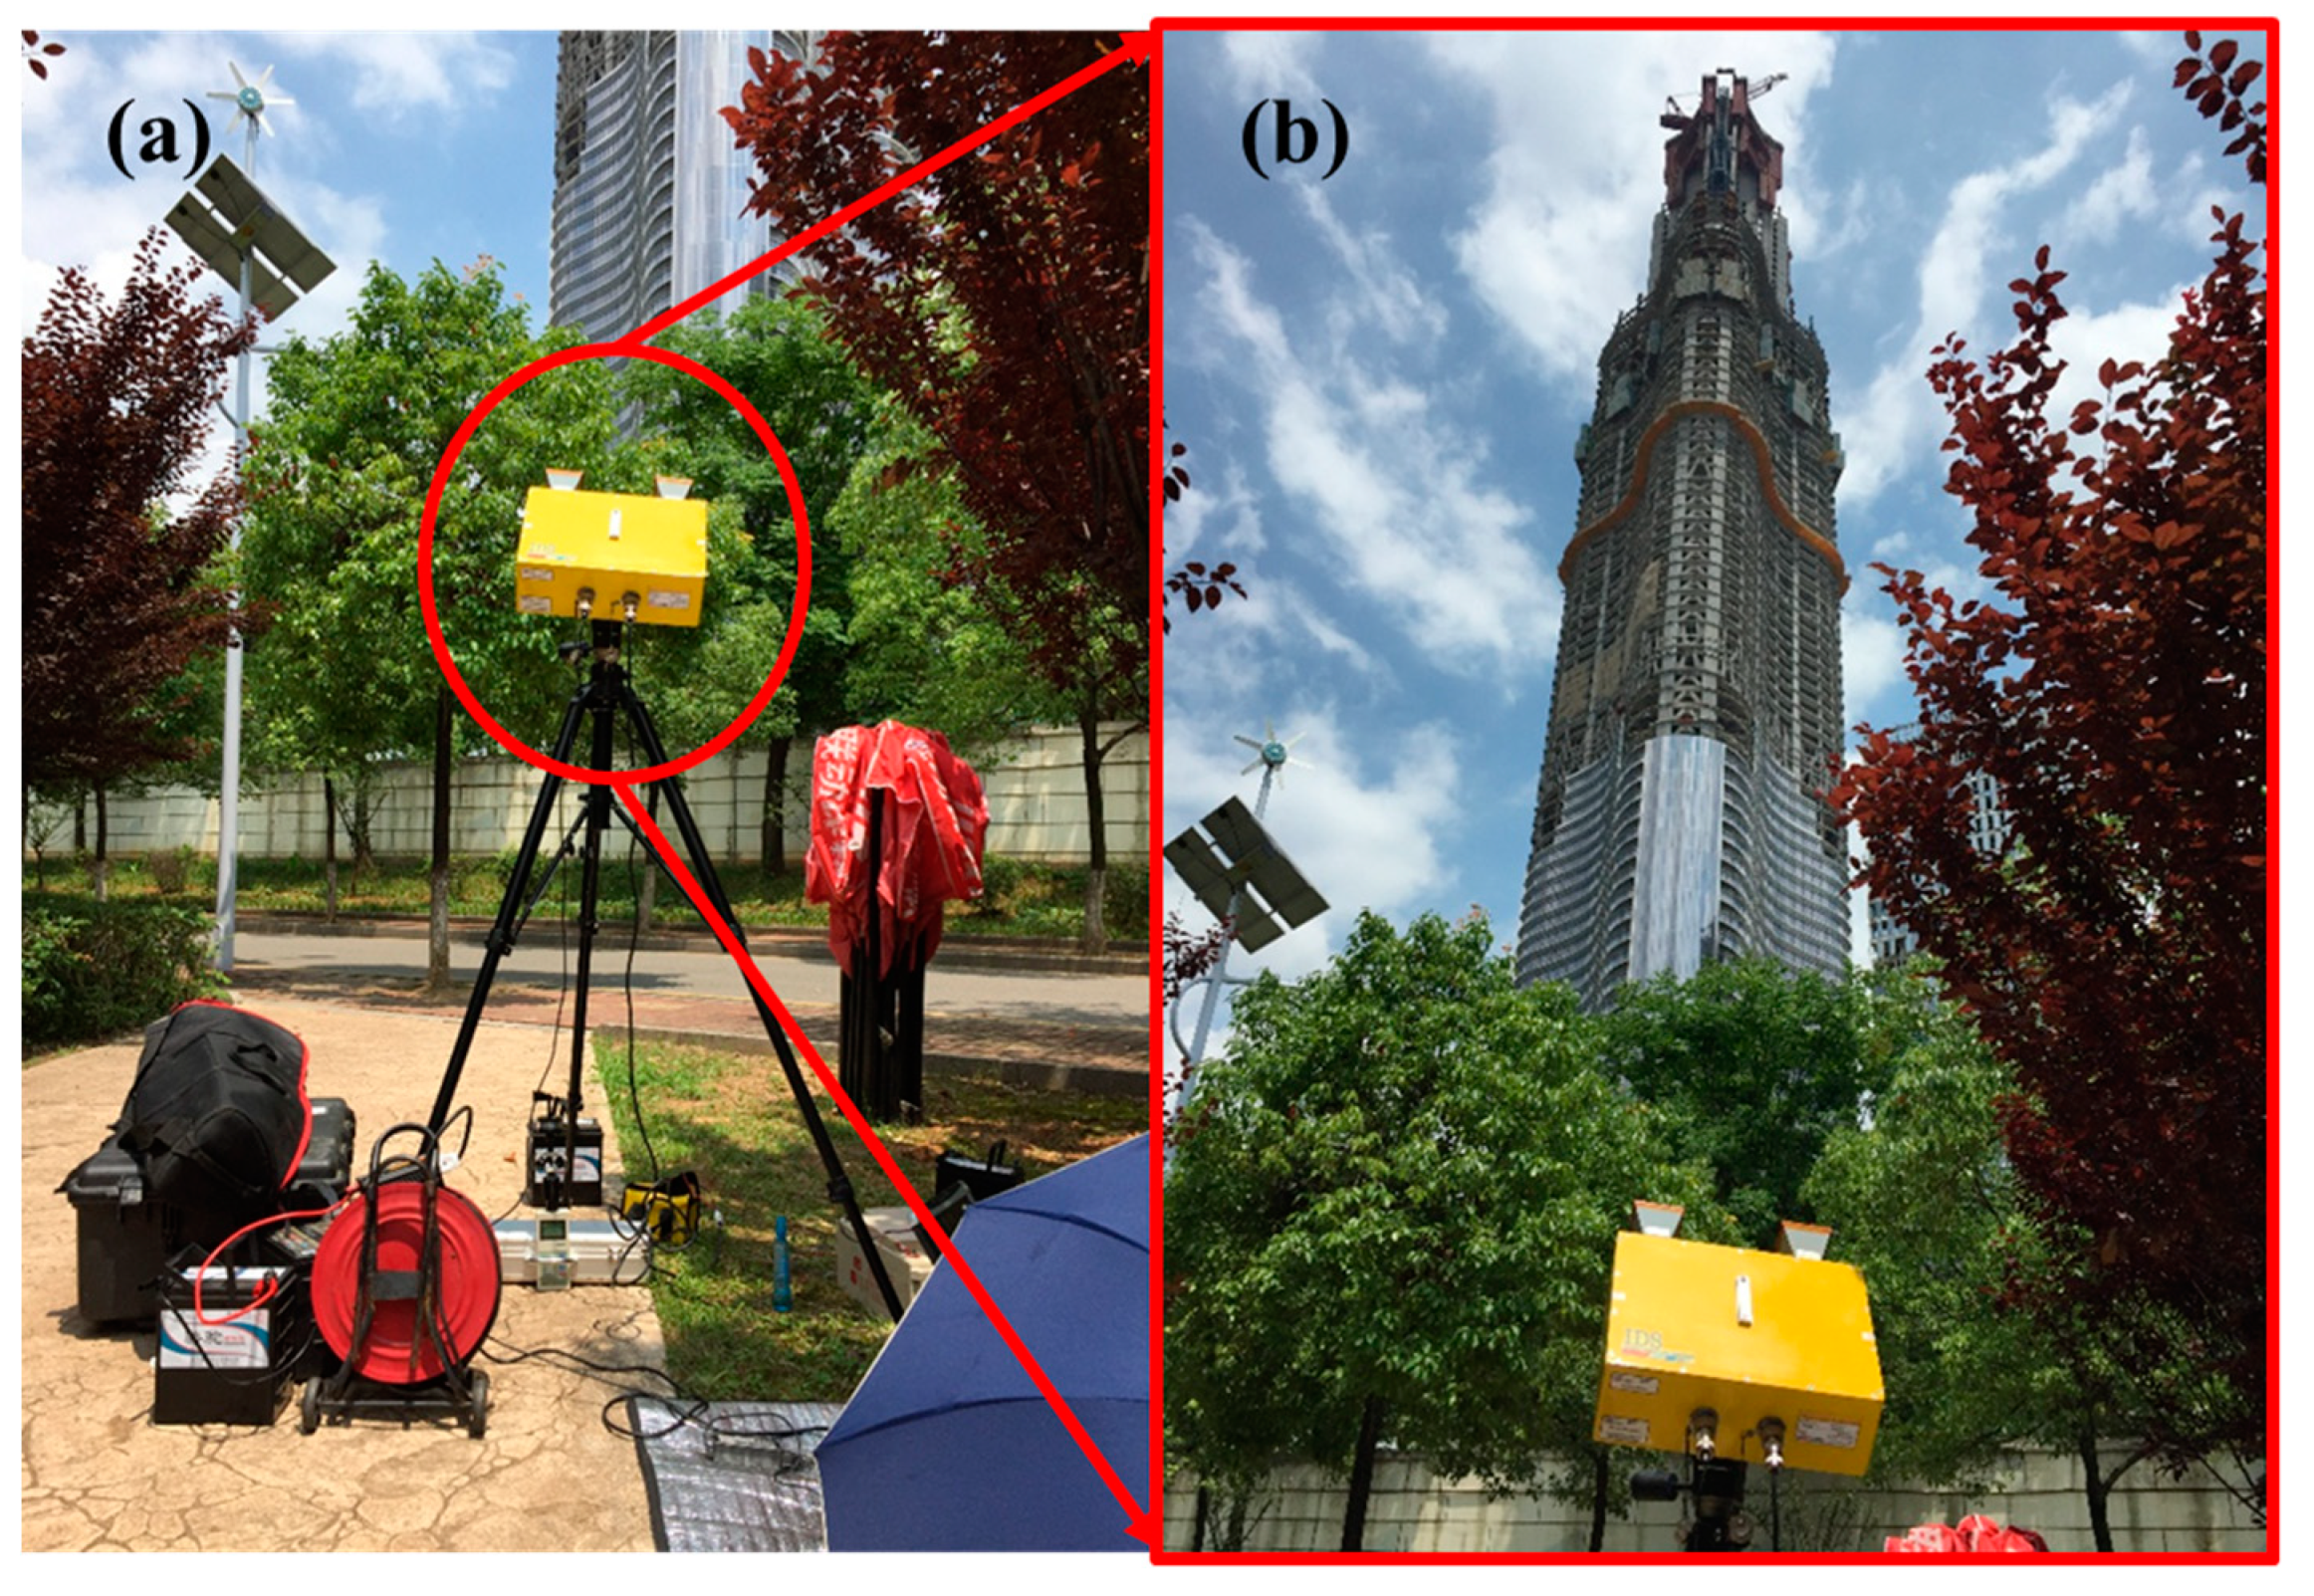
3.3. Measurement Campaign

We used GPS positioning to determine the field positions of working base points S1 and S2 in the two monitoring directions on the basis of field investigation, the intervisibility condition between radar and the monitored object, and the main monitoring building of the WGC within the main lobe of radar scanning. Working base points S1 and S2 were located in the north and west directions of the building, respectively, as shown in Figure 3.
We installed the IBIS-S-1 system on working base point S1, and the distance between the radar installation location and the WGC was 246 m. S1 was located at the roof of a two-story building of a farmer, as shown in Figure 4. The IBIS-S-2 system was rigidly fixed on working base point S2, which was located in the Wuchang River Beach Park with a distance of 241 m from the monitored building, as shown in Figure 5.
Continuous dynamic monitoring of the WGC was conducted from 12:21 on 5 July 2017 to 12:14 on 7 July 2017, with a total duration of approximately 48 h. The times of starting and ending of the monitoring of the two IBIS-S systems are the same. Continuous and uninterrupted measurement was adopted for both IBIS-S systems. The two IBIS-S systems were configured to monitor the building up to a distance of 800 m with a sampling frequency of 20 Hz. The two systems used the same resolution (0.75 m) in range during the monitoring period. The configuration parameters of the two IBIS-S systems are the same, and the main configuration parameters of the measurement campaign are listed in Table 1. A weather station was fixed on the roof of the building (as shown in Figure 4b) to monitor the dynamic changes of meteorological parameters (such as temperature, atmospheric humidity, etc.) on the roof during the dynamic monitoring. The data collection time of the weather station ranged from 12:40 on 5 July 2017 to 09:40 on 7 July 2017, with a data sampling interval of 10 min.

4. Results and Discussion

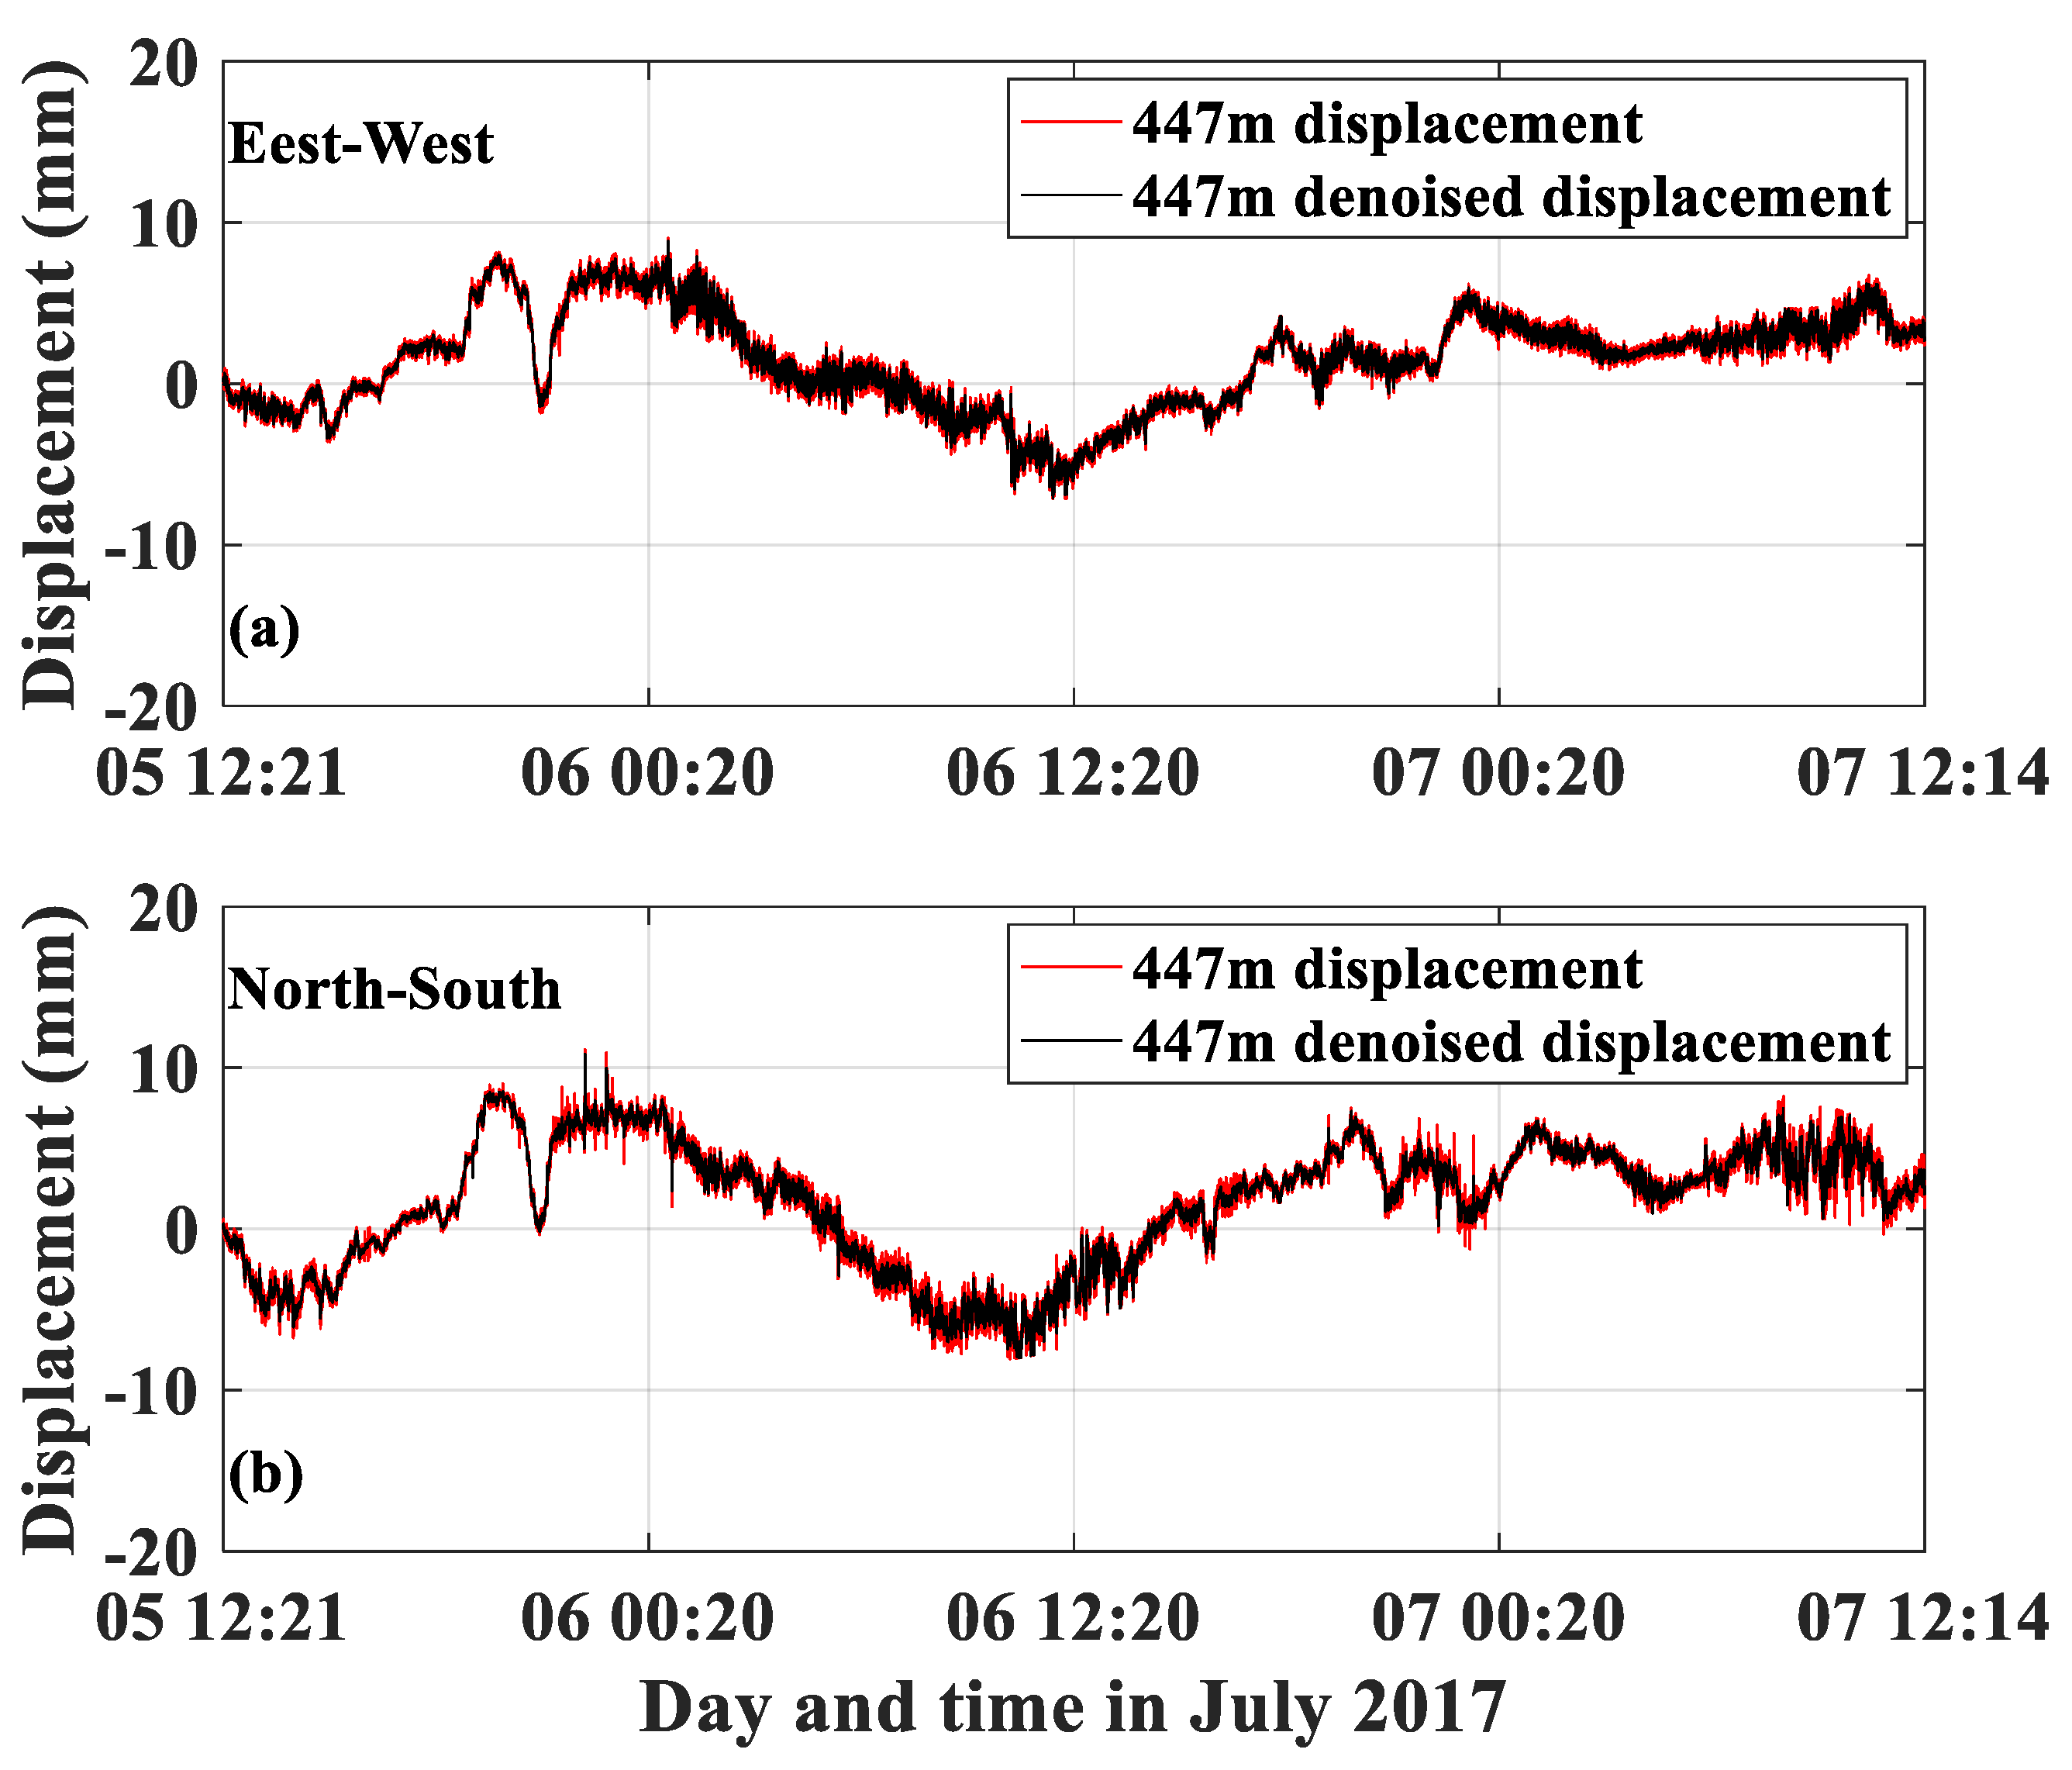
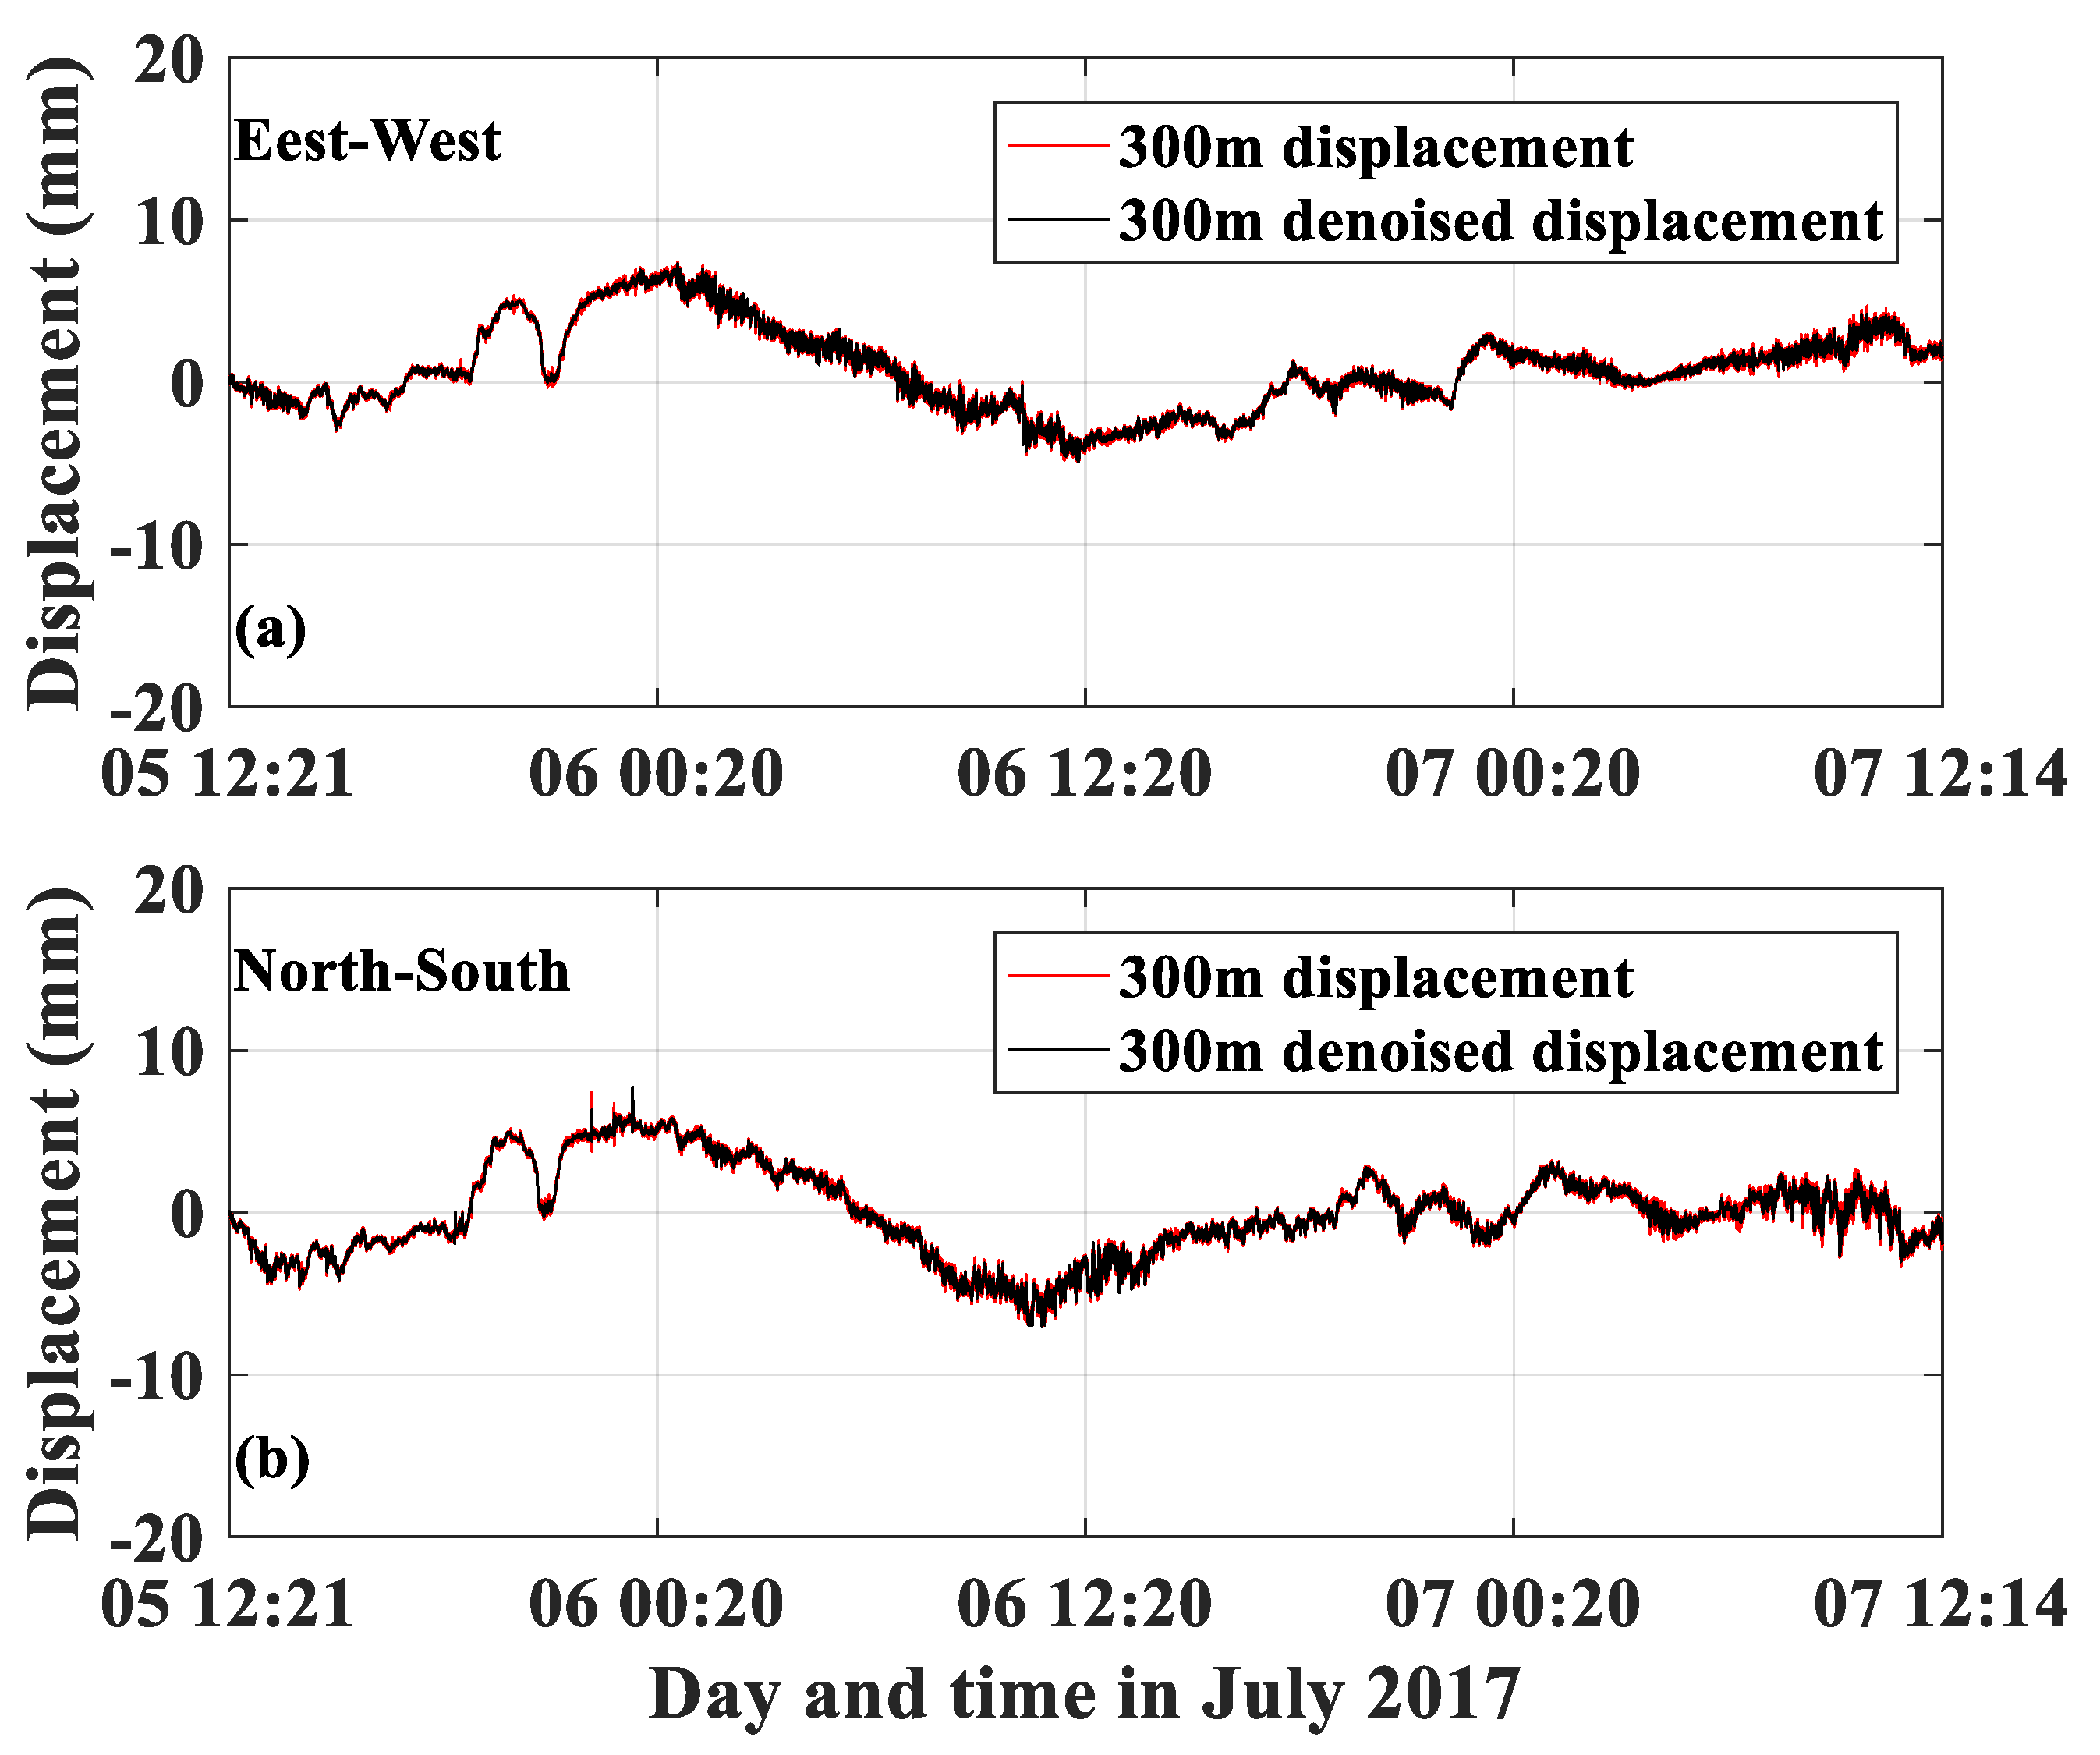
4.1. Horizontal Displacement and Amplitude Extraction Analysis

The power profiles obtained from working base points S1 and S2 are shown in Figure 6 and Figure 7, respectively. Many peaks are visible in Figure 6 and Figure 7. These peaks correspond to the positions of the monitored points characterized with good electromagnetic reflectivity. To analyze the displacement of the WGC, we selected the monitored points with good electromagnetic reflectivity located on the roof of building (i.e., the location of point A) and the middle position of the main structure of the building (i.e., the location of point B) to analyze its horizontal displacement during the monitoring period. Point A in the two figures is located on the roof of the WGC. The height of the roof relative to working base point S2 was 447 m, whereas Point B was 300 m high from the building relative to working base point S2 when we used GB-RAR to monitor the building. The heights of points A and B in the analysis are relative to working base point S2. As shown in Figure 6 and Figure 7, the thermal signal-to-noise ratio (SNR) of the radar signal is basically greater than 30 dB within the range of 100 m to 447 m relative to the height of the building. The thermal SNRs of points A and B in the north–south monitoring direction are 37.4 and 60.8 dB, respectively, and the thermal SNRs of points A and B in the east–west monitoring direction are 39.0 and 62.2 dB, respectively. The above analysis demonstrates that the data collected by the radars at S1 and S2 are of good quality.
We selected and analyzed some feature points of the WGC to analyze its horizontal displacement during monitoring. The feature points were distributed at points A and B of the building. The LOS displacement time series of feature points was extracted using the method described in Section 2, and the horizontal displacement time series of feature points was calculated through geometric projection based on the geometric relationship between the feature points and the radar position. Figure 8 shows the horizontal displacement time series in the north–south and east–west directions at the top of the WGC during the monitoring period, and the red and black curves represent the original and denoised horizontal displacement time series, respectively. The negative values in Figure 8a indicate that the building is moving westward, whereas the positive values indicate that the building is moving eastward. As shown in Figure 8b, the negative values indicate that the building is moving northward, whereas the positive value denotes that the building is moving southward. As shown in Figure 8b, the maximum negative horizontal displacement of the roof in the north–south direction is 7.99 mm, and the maximum positive horizontal displacement is 10.85 mm. Therefore, the maximum displacement amplitude of the roof of the WGC in the north–south direction during the monitoring period is 18.84 mm. For the east–west direction, the maximum negative and positive horizontal displacements of the roof are 7.10 and 8.84 mm, respectively, and the maximum east–west direction displacement amplitude of the roof is 15.94 mm. The displacement monitoring accuracies in the north–south and east–west directions at the top of the building are 0.15 and 0.17 mm, respectively.
Figure 9 shows the horizontal displacement time series in the north–south and east–west directions at the building height of 300 m during the monitoring period. The maximum negative and positive horizontal displacements in the north–south direction at the building height of 300 m are 6.99 and 7.74 mm, respectively, and the maximum horizontal displacement amplitude is 14.73 mm. For the east–west direction, the maximum negative and positive horizontal displacements are 4.94 and 7.30 mm respectively, and the maximum horizontal displacement amplitude reaches 12.24 mm. At the building height of 300 m, the monitoring accuracies of displacement in the north–south and east–west directions are 0.09 and 0.10 mm, respectively. The maximum horizontal displacement amplitudes at the building height of 300 m in the north–south and east–west directions are 4.11 and 3.70 mm less than that compared with the roof of the building, respectively.
The comparative analysis of Figure 6 and Figure 7 shows that the displacement change of the building is relatively large before 7 July 2017, whereas the subsequent displacement steadily changes. The original displacement curve obtained based on radar data immensely fluctuated and was accompanied by many burr points. After denoising the original displacement curve through wavelet analysis [41,42], the burr phenomenon in the original displacement curve was basically eliminated, and the displacement curve became smooth, as shown in Figure 8 and Figure 9 (black line). However, the displacement curve after denoising still exhibited a certain fluctuation, and the displacement curve at the building height of 447 m was more obvious than that at the building height of 300 m. This phenomenon may be attributed to the serious effect of noise caused by construction vibration, instrument system error, external environment, and other factors on the radar signal during the monitoring period. Although most of the noises were removed through wavelet analysis, a slight vibration still existed in the building itself when it swung because of the influences of construction vibration and other factors. Therefore, the displacement curve after wavelet denoising still had a small fluctuation, and this part of fluctuation may be caused by the slight vibration of the building itself when it swung.
GB-RAR can realize high-accuracy continuous dynamic monitoring of super high-rise buildings, and the monitoring accuracy can reach submillimeter level. However, the monitoring accuracy gradually decreased with the increase in floors.

4.2. Roof Displacement Trajectory Analysis

To investigate the roof motion of the WGC, the displacement trajectory of the roof during the monitoring period is presented in this section on the basis of the horizontal displacement time series of the roof in the north–south and east–west directions obtained in the previous section, and the results are shown in Figure 10. As shown in Figure 10, the color bar on the right represents the time change, the negative value on the vertical axis denotes the westward movement, and the negative value on the horizontal axis indicates the northward movement. As illustrated in Figure 10, during the monitoring period, the general direction of roof movement was first toward the northwest for approximately 3 h, then moved toward the southeast to the maximum value, and subsequently moved along the northwest to the maximum value, and finally moved along the southeast to approximate the initial position (approximately a few millimeters deviation with respect to the initial position). The oscillation magnitude of the roof is basically less than 20 mm. To analyze the oscillation rule of the roof for a whole day, Figure 11 shows the displacement trajectory of the roof from 00:00 to 24:00 on 6 July 2017. Figure 11 intuitively reflects the diurnal oscillation rule of the roof, and the displacement trajectory is accompanied by slight fluctuation when it moves with time, which may be caused by the combined influences of construction vibration, wind load, and other factors.

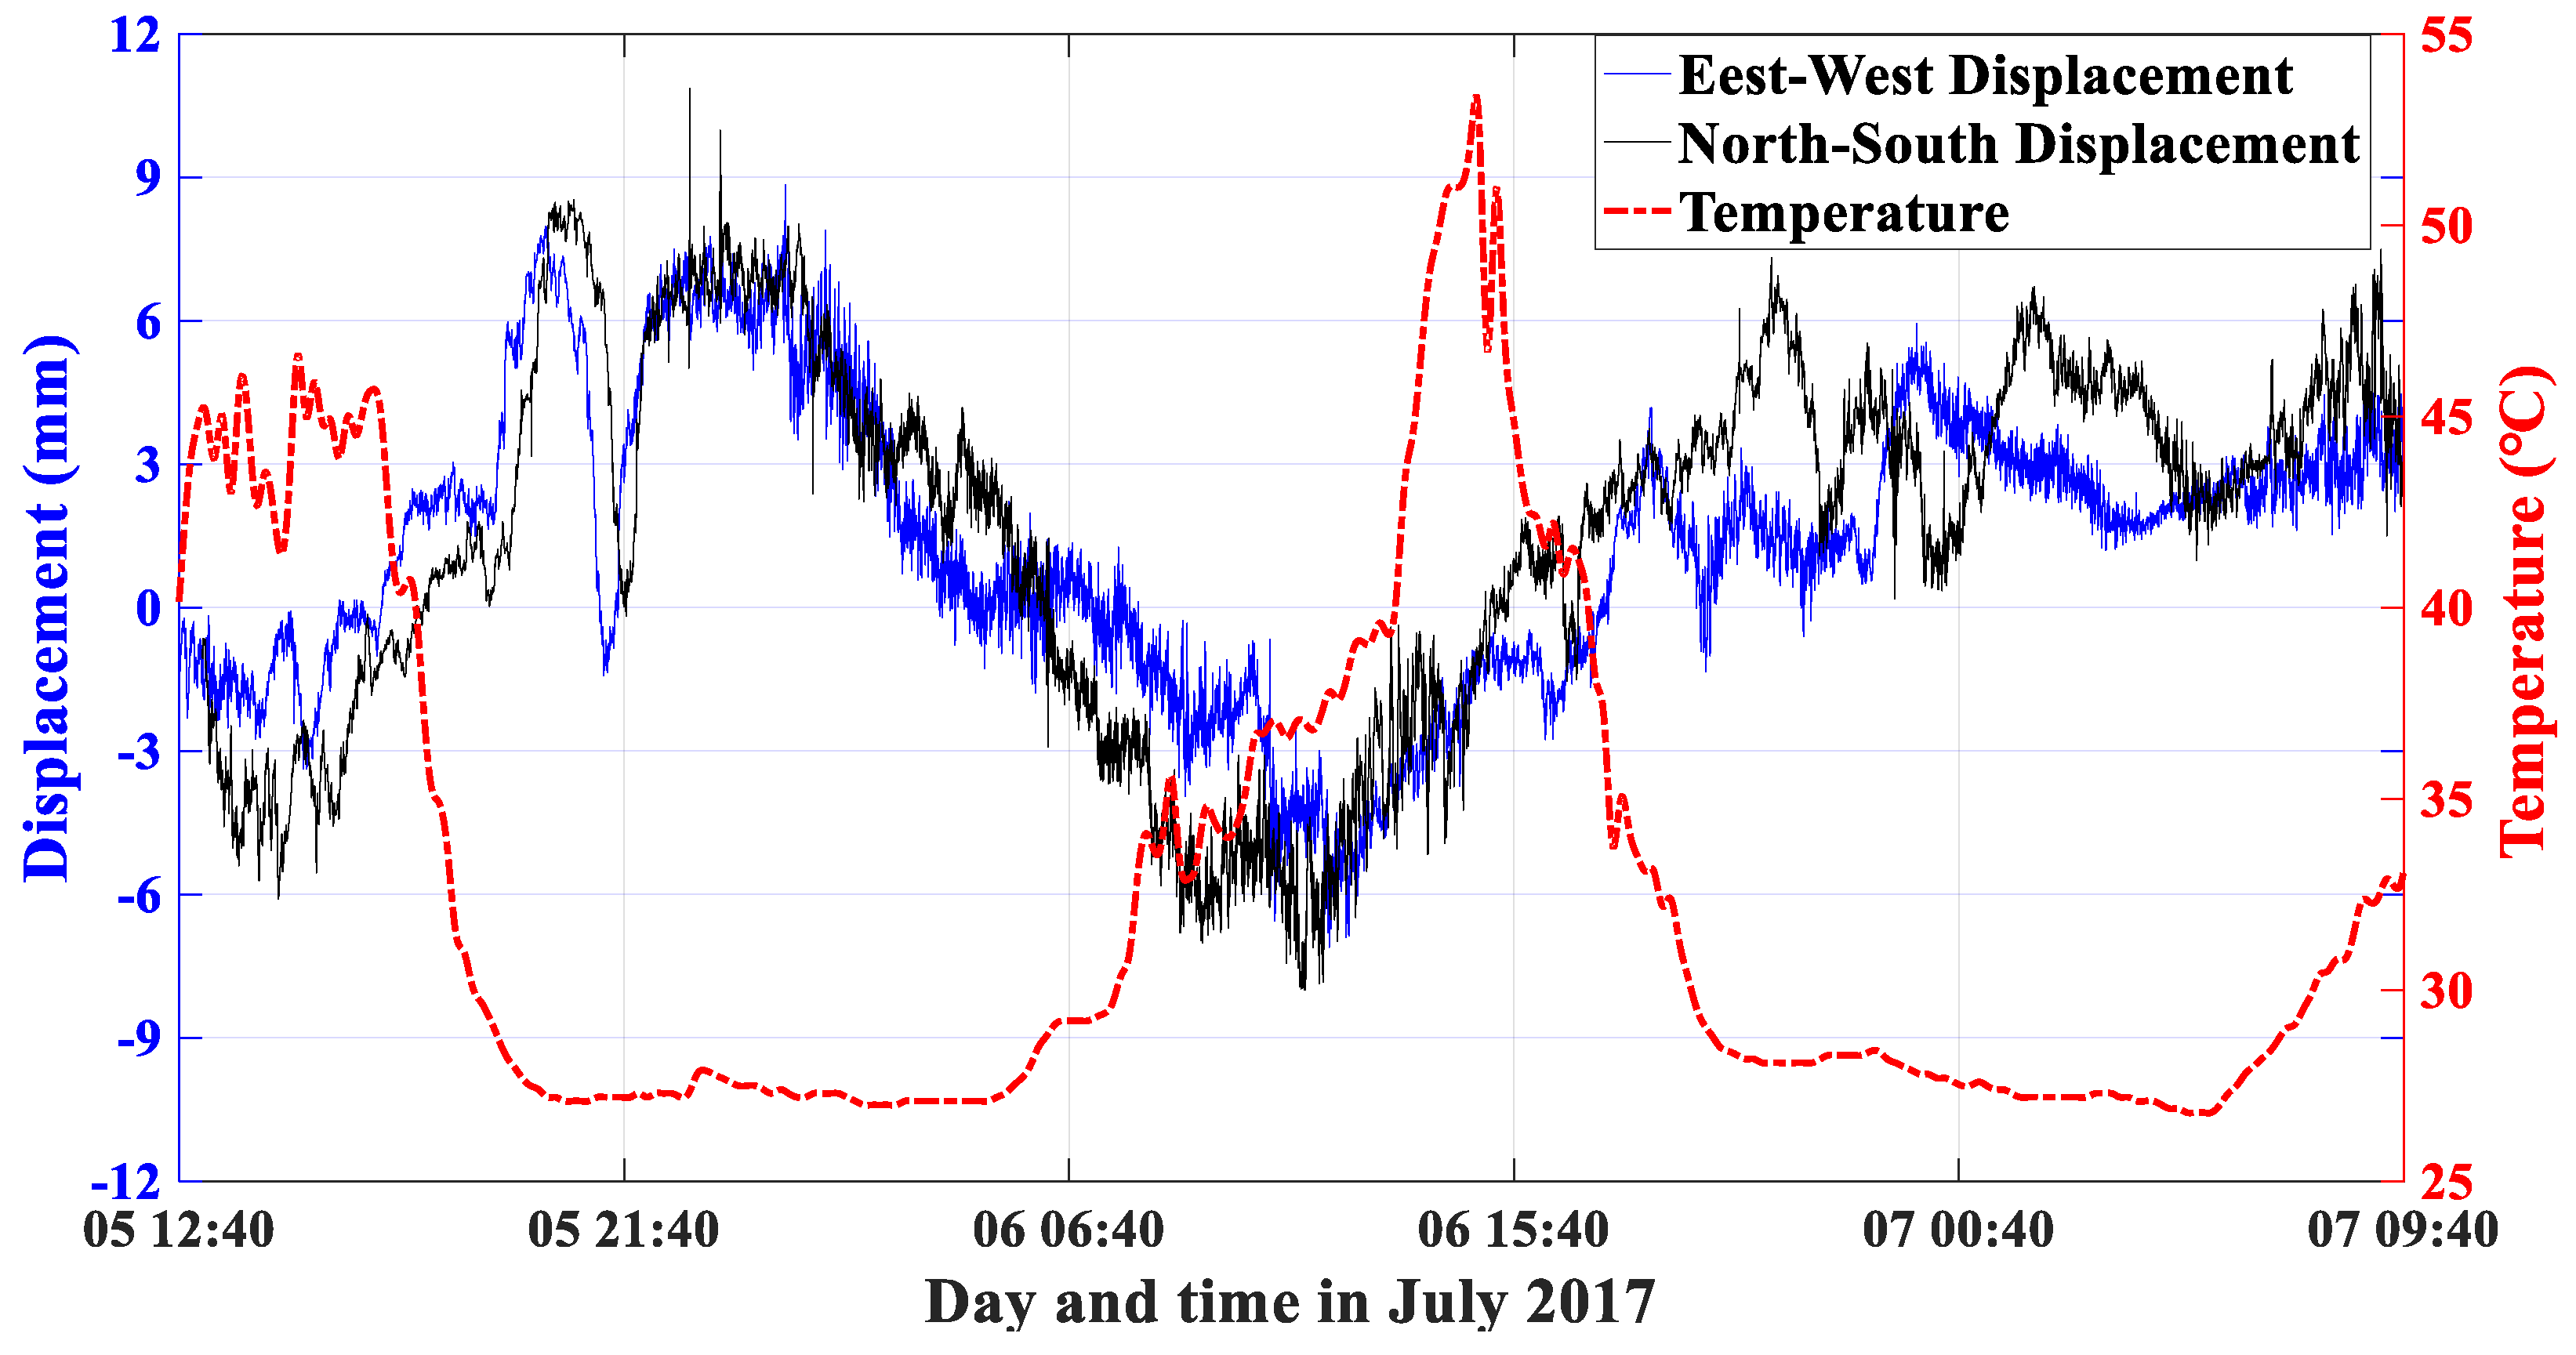
4.3. Correlation between Roof Displacement and Temperature Changes

The roof displacement time series in the north–south and east–west directions and the roof temperature changes observed by the weather station were selected to compare and analyze their time series changes for determining the correlation between the displacement and temperature changes at the roof of the WGC. Given that the temperature data were collected from 12:40 on 5 July 2017 to 09:40 on 7 July 2017, the overlapping period data of the displacement time series derived by GB-RAR and temperature data were selected for comparative analysis. Figure 12 shows the comparison results between the temperature and displacement changes in the north–south and east–west directions during the study period.
As illustrated in Figure 12, the temperature ranged from 26.8 °C to 53.4 °C during the study period, and the temperature difference reached 26.6 °C. The temperature was relatively stable from 21:00 to 6:00 at night and reached the maximum value of the day around 15:00 every afternoon. The maximum displacement amplitudes of the roof monitored using GB-RAR were 18.84 and 15.94 mm in the north–south and east–west directions, respectively. We conducted correlation analysis to analyze the time series between displacement and temperature changes for determining their correlation. The correlation coefficient between the displacement changes in the north–south direction and the temperature changes is −0.56, and that between the displacement changes in the east–west direction and the temperature changes is −0.65. A certain negative correlation is found between the temperature and displacement changes in the two directions, and the correlation between the displacement changes in the east–west direction and the temperature changes is strong. Additionally, the correlation coefficient between the displacement changes in the north–south and east–west directions is 0.84, indicating the displacement changes between the north–south and east–west directions show a relatively strong correlation.
Although the temperature changes have a certain influence on the displacement changes at the top of the super high-rise building, the construction vibration of the large tower crane on the top of the building, wind load, and other factors also have a great influence on the displacement changes at the top of the building because the WGC is under the construction stage. The displacement changes at the top of the building are caused by the joint action of temperature, construction vibration, wind load, and other factors. Therefore, a certain correlation is found between the temperature and displacement changes.

5. Conclusions

In this study, we utilized the GB-RAR to monitor and analyze the dynamic characteristics of the WGC under construction. We proposed and investigated a set of technical methods for monitoring and analyzing the dynamic characteristics of super high-rise buildings using GB-RAR. The GB-RAR was used to monitor the dynamic displacement information of the building in the north–south and east–west directions. The accurate dynamic characteristic information of the building, such as horizontal displacement, oscillation amplitude, and displacement trajectory, was extracted through wavelet analysis. The main conclusions are summarized as follows:
(1)
During the monitoring of the WGC, the GB-RAR effectively extracted the dynamic characteristics (e.g., horizontal displacement and oscillation amplitude) of the building. The maximum horizontal displacement amplitudes at the top of the building in the north–south and east–west directions were 18.84 and 15.94 mm respectively, and the corresponding accuracies were 0.15 and 0.17 mm, respectively, suggesting that the accuracy of GB-RAR monitoring was high. However, the monitoring accuracy gradually decreased with the increase in floors. The roof displacement trajectory of the WGC was clearly identified. The displacement trajectory was accompanied by slight fluctuation, which may be caused by the combined influences of construction vibration, wind load, and other factors. The results demonstrate that the GB-RAR is effective for dynamic monitoring of super high-rise buildings.
(2)
A certain negative correlation was identified between the temperature and displacement changes in the north–south and east–west directions at the roof of the building, and the correlation between the displacement changes in the east–west direction and the temperature changes was strong.

Author Contributions

L.Z. and J.G. conceived and designed the experiments. L.Z., C.W., J.M. and F.Y. carried out the data acquisition. L.Z. and X.W. performed data processing and analyses, and L.Z. contributed to the manuscript of the paper. J.G. and D.Z. discussed and analyzed the experimental results. All authors have read and approved the published version of the manuscript.

Funding

This work was supported by the Guangxi Science and Technology Plan Project (Grant No. GUIKE AD19110107); the Key Laboratory of Geospace Environment and Geodesy, Ministry of Education, Wuhan University (Grant No. 18-01-01); the Natural Science Foundation of Guangxi (Grant No. 2018GXNSFBA050006); the Wuhan Science and Technology Plan Project (Grant No. 2019010702011314); the National Natural Science Foundation of China (Grant No. 41604019); and the Foundation of Guilin University of Technology (Grant No. GUTQDJJ2018036).

Acknowledgments

We would like to thank the administrative staff of the Wuchang River Beach Park and the owner of the two-story building for providing the IBIS-S system installation sites and power supply.

Conflicts of Interest

The authors declare no conflict of interest.

References

  1. Chen, Q.J.; Yuan, W.Z.; Li, Y.C.; Cao, L.Y. Dynamic response characteristics of super high-rise buildings subjected to long-period ground motions. J. Cent. S. Univ. 2013, 20, 1341–1353. [Google Scholar] [CrossRef]
  2. Adachi, F.; Fujita, K.; Tsuji, M.; Takewaki, I. Importance of interstory velocity on optimal along-height allocation of viscous oil dampers in super high-rise buildings. Eng. Struct. 2013, 56, 489–500. [Google Scholar] [CrossRef] [Green Version]
  3. Li, Q.S.; He, Y.C.; He, Y.H.; Zhou, K.; Han, X.L. Monitoring wind effects of a landfall typhoon on a 600 m high skyscraper. Struct. Infrastruct. Eng. 2019, 15, 54–71. [Google Scholar] [CrossRef]
  4. Silva, I.D.; Ibañez, W.; Poleszuk, G. Experience of Using Total Station and GNSS Technologies for Tall Building Construction Monitoring. In Proceedings of the International Congress and Exhibition "Sustainable Civil Infrastructures: Innovative Infrastructure Geotechnology, Sharm El Sheikh, Egypt, 15–19 July 2017. [Google Scholar]
  5. Xu, J.; Jo, H. Development of High-Sensitivity and Low-Cost Electroluminescent Strain Sensor for Structural Health Monitoring. IEEE Sens. J. 2016, 16, 1962–1968. [Google Scholar] [CrossRef]
  6. Li, Q.S.; Xiao, Y.Q.; Wong, C.K. Full-scale monitoring of typhoon effects on super tall buildings. J. Fluids Struct. 2005, 20, 697–717. [Google Scholar] [CrossRef]
  7. Xia, Y.; Zhang, P.; Ni, Y.Q.; Zhu, H.P. Deformation monitoring of a super-tall structure using real-time strain data. Eng. Struct. 2014, 67, 29–38. [Google Scholar] [CrossRef] [Green Version]
  8. Wang, T.Y.; Xu, Y.M. Research on Dynamic Characteristic Monitoring Methods for Super High-rise Building. Bull. Surv. Map. 2017, 4, 89–92. [Google Scholar]
  9. Zhang, X.; Zhang, Y.Y.; Li, B.F.; Qiu, G.X. GNSS-Based Verticality Monitoring of Super-Tall Buildings. Appl. Sci. 2018, 8, 991. [Google Scholar] [CrossRef] [Green Version]
  10. Li, Q.S.; Zhi, L.H.; Yi, J.; To, A.; Xie, J.M. Monitoring of typhoon effects on a super-tall building in Hong Kong. Struct. Control Health 2014, 21, 926–949. [Google Scholar] [CrossRef]
  11. Li, Q.S.; Yi, J. Monitoring of dynamic behaviour of super-tall buildings during typhoons. Struct. Infrastruct. Eng. 2016, 12, 289–311. [Google Scholar] [CrossRef]
  12. Hwang, J.; Yun, H.; Park, S.K.; Lee, D.; Hong, S. Optimal Methods of RTK-GPS/Accelerometer Integration to Monitor the Displacement of Structures. Sensors 2012, 12, 1014–1034. [Google Scholar] [CrossRef] [PubMed] [Green Version]
  13. Casciati, F.; Fuggini, C. Monitoring a steel building using GPS sensors. Smart Struct. Syst. 2011, 7, 349–363. [Google Scholar] [CrossRef]
  14. Gentile, C.; Bernardini, G. An interferometric radar for non-contact measurement of deflections on civil engineering structures: Laboratory and full-scale tests. Struct. Infrastruct. Eng. 2010, 6, 521–534. [Google Scholar] [CrossRef]
  15. Santana, J.; Hoven, R.V.D.; Liempd, C.V.; Colin, M.; Saillen, N.; Zonta, D.; Trapani, D.; Torfs, T.; Hoof, C.V. A 3-axis accelerometer and strain sensor system for building integrity monitoring. Sens. Actuators A Phys. 2012, 188, 141–147. [Google Scholar] [CrossRef]
  16. Guo, Y.L.; Kareem, A.; Ni, Y.Q.; Liao, W.Y. Performance evaluation of Canton Tower under winds based on full-scale data. J. Wind Eng. Ind. Aerodyn. 2012, 104, 116–128. [Google Scholar] [CrossRef]
  17. Xiong, C.; Niu, Y. Investigation of the Dynamic Behavior of a Super High-rise Structure using RTK-GNSS Technique. KSCE J. Civ. Eng. 2019, 23, 654–665. [Google Scholar] [CrossRef]
  18. Yang, K.; Yan, L.; Huang, G.; Chen, C.; Wu, Z.P. Monitoring Building Deformation with InSAR: Experiments and Validation. Sensors 2016, 16, 2182. [Google Scholar] [CrossRef]
  19. Wu, W.Q.; Cui, H.T.; Hu, J.; Yao, L.N. Detection and 3D Visualization of Deformations for High-Rise Buildings in Shenzhen, China from High-Resolution TerraSAR-X Datase. Appl. Sci. 2019, 9, 3818. [Google Scholar] [CrossRef] [Green Version]
  20. Bardi, F.; Raspini, F.; Ciampalini, A.; Kristensen, L.; Rouyet, L.; Lauknes, T.R.; Frauenfelder, R.; Casagli, N. Space Borne and Ground Based InSAR Data Integration: The Åknes Test Site. Remote Sens. 2016, 8, 237. [Google Scholar] [CrossRef] [Green Version]
  21. Bardi, F.; Frodella, W.; Ciampalini, A.; Bianchini, S.; Ventisette, C.D. Integration between ground based and satellite SAR data in landslide mapping: The San Fratello case study. Geomorphology 2014, 223, 45–60. [Google Scholar] [CrossRef]
  22. Guo, J.M.; Zhou, L.; Yao, C.L.; Hu, J.Y. Surface Subsidence Analysis by Multi-Temporal InSAR and GRACE: A Case Study in Beijing. Sensors 2016, 16, 1495. [Google Scholar] [CrossRef] [PubMed] [Green Version]
  23. Ji, L.; Zhang, Y.; Wang, Q.; Wan, Y.; Li, J. Detecting land uplift associated with enhanced oil recovery using InSAR in the Karamay oil field, Xinjiang, China. Int. J. Remote Sens. 2016, 37, 1527–1540. [Google Scholar] [CrossRef]
  24. Farrar, C.R.; Darling, T.W.; Migliori, A.; Baker, W.E. Microwave interferometer for non-contact vibration measurements on large structures. Mech. Syst. Signal Process. 1999, 13, 241–253. [Google Scholar] [CrossRef] [Green Version]
  25. Tapete, D.; Casagli, N.; Luzi, G.; Fanti, R.; Gigli, G.; Leva, D. Integrating radar and laser-based remote sensing techniques for monitoring structural deformation of archaeological monuments. J. Archaeol. Sci. 2013, 40, 176–189. [Google Scholar] [CrossRef] [Green Version]
  26. Monserrat, O.; Crosetto, M.; Luzi, G. A review of ground-based SAR interferometry for deformation measurement. ISPRS J. Photogramm. 2014, 93, 40–48. [Google Scholar] [CrossRef] [Green Version]
  27. Marchisio, M.; Piroddi, L.; Ranieri, G.; Sergio, V.C.; Paolo, F. Comparison of natural and artificial forcing to study the dynamic behaviour of bell towers in low wind context by means of ground-based radar interferometry: The case of the Leaning Tower in Pisa. J. Geophys. Eng. 2014, 11, 5004–5013. [Google Scholar] [CrossRef]
  28. Roy, A.K.; Gangal, S.A.; Bhattacharya, C. Calibration of High Resolution Synthetic Aperture Radar SAR Image Features by Ground Based Experiments. IETE J. Res. 2017, 63, 381–391. [Google Scholar] [CrossRef]
  29. Pieraccini, M.; Miccinesi, L.; Rojhani, N. A GBSAR Operating in Monostatic and Bistatic Modalities for Retrieving the Displacement Vector. IEEE Geosci. Remote Sens. 2017, 14, 1494–1498. [Google Scholar] [CrossRef]
  30. Pieraccini, M.; Fratini, M.; Parrini, F.; Macaluso, G.; Atzeni, C. High speed CW step frequency coherent radar for dynamic monitoring of civil engineering structures. Electron. Lett. 2004, 14, 907–908. [Google Scholar] [CrossRef]
  31. Zhou, L.; Guo, J.M.; Hu, J.Y.; Ma, J.; Wei, F.H.; Xue, X.Y. Subsidence analysis of ELH Bridge through ground-based interferometric radar during the crossing of a subway shield tunnel underneath the bridge. Int. J. Remote Sens. 2018, 39, 1911–1928. [Google Scholar] [CrossRef]
  32. Stabile, T.A.; Perrone, A.; Gallipoli, M.R.; Ditommaso, R.; Ponzo, F.C. Dynamic Survey of the Musmeci Bridge by Joint Application of Ground-Based Microwave Radar Interferometry and Ambient Noise Standard Spectral Ratio Techniques. IEEE Geosci. Remote Sens. 2013, 10, 870–874. [Google Scholar] [CrossRef]
  33. Luzi, G.; Monserrat, O.; Crosetto, M. The Potential of Coherent Radar to Support the Monitoring of the Health State of Buildings. Res. Nondestruct. Eval. 2012, 23, 125–145. [Google Scholar] [CrossRef]
  34. Atzeni, C.; Bicci, A.; Dei, D.; Fratini, M.; Pieraccini, M. Remote Survey of the Leaning Tower of Pisa by Interferometric Sensing. IEEE Geosci. Remote Sens. 2010, 7, 185–189. [Google Scholar] [CrossRef]
  35. Gentile, C. Application of microwave remote sensing to dynamic testing of stay-cables. Remote Sens. 2010, 2, 36–51. [Google Scholar] [CrossRef] [Green Version]
  36. Montuori, A.; Luzi, G.; Bignami, C.; Gaudiosi, I.; Stramondo, S.; Crosetto, M.; Buongiorno, M.F. The Interferometric Use of Radar Sensors for the Urban Monitoring of Structural Vibrations and Surface Displacements. IEEE J. Sel. Top. Appl. Earth Obs. Remote Sens. 2016, 9, 3761–3776. [Google Scholar] [CrossRef]
  37. Castagnetti, C.; Bassoli, E.; Vincenzi, L.; Mancini, F. Dynamic Assessment of Masonry Towers Based on Terrestrial Radar Interferometer and Accelerometers. Sensors 2019, 19, 1319. [Google Scholar] [CrossRef] [Green Version]
  38. Coppi, F.; Gentile, C.; Ricci, P. A Software Tool for Processing the Displacement Time Series Extracted from Raw Radar Data. AIP Conf. Proc. 2010, 1, 190–201. [Google Scholar]
  39. Iglesias, R.; Fabregas, X.; Aguasca, A.; Mallorqui, J.J.; Carlos, L.M.; Gili, J.A.; Corominas, J. Atmospheric Phase Screen Compensation in Ground-Based SAR with a Multiple-Regression Model over Mountainous Regions. IEEE Geosci. Remote Sens. 2014, 52, 2436–2449. [Google Scholar] [CrossRef]
  40. Shimizu, N.; Mizuta, Y.; Kondo, H. A new GPS real-time monitoring system for deformation measurements and its application. In Proceedings of the 8th FIG International Symposium on Deformation Measurements, Hong Kong, 25–28 June 1996. [Google Scholar]
  41. Li, J.; Chen, C.; Zheng, C.; Liu, S.; Tang, Z. Extraction of physical parameters from photo acoustic spectroscopy using wavelet transform. J. Appl. Phys. 2011, 6, 063110–063116. [Google Scholar] [CrossRef]
  42. Sang, Y.F. A review on the applications of wavelet transform in hydrology time series analysis. Atmos. Res. 2013, 122, 8–15. [Google Scholar] [CrossRef]
Figure 1. Wuhan Greenland Center (WGC): (a) architectural rendering; (b) architectural structure drawing.
Applsci 10 00808 g001
Figure 2. Schematic of ground-based real aperture radar (GB-RAR) working base points.
Applsci 10 00808 g002
Figure 3. Distribution map of the two IBIS-S system installation locations (S1 and S2). The red triangle denotes the location of the IBIS-S system, and the monitored object (i.e., the WGC) is outlined by a red rectangle.
Applsci 10 00808 g003
Figure 4. Location of the IBIS-S-1 system in the north–south direction. (a) View of the IBIS-S-1 interferometric radar on S1 (located in a farmhouse roof). (b) Weather station installed on the roof of the monitored building. (c) Ground view of the WGC from the location of the IBIS-S-1 interferometric radar.
Applsci 10 00808 g004
Figure 5. Location of the IBIS-S-2 system in the east–west direction. (a) View of the IBIS-S-2 interferometric radar on S2 (located in the Wuchang River Beach Park). (b) Ground view of the WGC from the location of the IBIS-S-2 interferometric radar.
Applsci 10 00808 g005
Figure 6. (a) Power profile of the WGC obtained from working base point S1 and selection of monitoring points. The red triangle denotes the monitoring point. The relative height of the building in the left figure is relative to working base point S1. Point A in the right figure is at the top of the building, with a height of 447 m relative to working base point S2. Point B is 300 m high relative to working base point S2. (b) Ground view of the WGC from the location of the IBIS-S-1 system.
Applsci 10 00808 g006
Figure 7. (a) Power profile of the WGC obtained from working base point S1 and selection of monitoring points. The red triangle denotes the monitoring point. The relative height of the building in the left figure is relative to working base point S1. Point A in the right figure is at the top of the building, with a height of 447 m relative to working base point S2. Point B is 300 m high relative to working base point S2. (b) Ground view of the WGC from the location of the IBIS-S-2 system.
Applsci 10 00808 g007
Figure 8. IBIS-S-derived horizontal displacement time series in east–west (a) and north–south (b) directions at 447 m height of the WGC. The red line denotes the displacement time series without denoising, and the black line represents the displacement time series after denoising.
Applsci 10 00808 g008
Figure 9. IBIS-S-derived horizontal displacement time series in east–west (a) and north–south (b) directions at 300 m height of the WGC. The red line indicates the displacement time series without denoising, and the black line denotes the displacement time series after denoising.
Applsci 10 00808 g009
Figure 10. Displacement trajectory of the roof (from 5 July 2017 to 7 July 2017).
Applsci 10 00808 g010
Figure 11. Displacement trajectory of the roof (from 00:00 to 24:00 on 6 July 2017).
Applsci 10 00808 g011
Figure 12. Displacement time series in east–west (blue line) and north–south (black line) directions versus temperature changes (red dotted line) at the roof of the WGC.
Applsci 10 00808 g012
Table 1. Configuration of IBIS-S systems for the measurement campaign.
ParameterValue
Vertical tilt50°
Antenna typeType3 (Azimuth 17°, Vertical 15°)
Maximum range800 m
Resolution in range0.75 m
Sampling20 Hz
Start time12:21 5 July 2017
End time12:14 7 July 2017

