1. Introduction
In the world today, data acquisition systems (DASs) serve as a link between electrical and meteorological environments. The system is broadly applied in the research laboratory for measuring and analysing scientific and engineering experiments, for PV plant assessment in different areas in institutions and industries. Obviously, electrical and meteorological parameters such as current and voltage signals, solar irradiance, ambient temperature, relative humidity, wind speed and directions are well compatible with DAS. The influence of these parameters is very essential in analysing the power performances in harsh remote areas [
1]. Undoubtedly, DAS are normally integrated into off-grid or grid-connected PV systems, with the sense of measuring, recording as well as displaying data in the absence of operator or computer mediations. The system is designed to receive multiple input parameters with the help of parts made in the signal conditioning unit and can record data simultaneously from the diversity of various sensors and on PV systems. In variable weather conditions, DAS can readjust the signals and parameters, so as to suit the new environments [
2]. Various components make up the DAS such as data acquisition software, signal processors, sensors, computers, communication link, database and so on [
3]. Each of these components should function together to constitute a DAS [
3].
Typically, a lot of DAS designs have been established in the literature [
4,
5,
6]. Their architectures are based on either simulation or experimental methods. The majority of the simulation presented several ways for assessing the reliability of the solar PV system particularly to the project strategy and the economic perspectives [
7,
8]. Nevertheless, the viewpoint in estimating the accuracy of energy is pretty low with the simulation devices as compared to the experimental observations owing to the limited input parameters designated for it [
9]. Therefore, the only available choice would be experimental studies. A prototype DAS for an off-grid PV power plant was proposed by [
10], the system consists of a personal computer, simulator for PV modules and battery storage. The prototype was used to collect data to find out the execution of the power plant. The operation of PV modules under outdoor weather conditions was also a concern for [
11]. To this effect, they designed a low-cost current-voltage (I-V) data acquisition system that was used to characterise seven modules subjected to outdoor weather. They argued that results obtained from their study could be adopted in interrogating and comparing PV ratings under realistic operating conditions. Based on their findings, Voc decreases with an increase in ambient temperature whereas photo-generated current and generated power increases linearly with irradiance. In another development, a simple enclosed system centered on DAS was reported in [
12] while a web integrated DAS was discussed in [
13].
However, for DAS to be continuously in action, PV power plants should be at the forefront. Thus, the components that accompany the operation of PV power plants include the charge controller (charge regulator or regulator), inverter and battery. The function of a charge controller is to protect the battery without impinging unnecessarily on system efficiency [
14]. The charge controller controls the rate at which the batteries are charged (high voltage disconnection) and discharged (low voltage disconnection). Charge controllers are classified into maximum power point tracking (MPPT) and Pulse-Width Modulation (PWM) with respect to operation. The MPPT charge controller, which is commonly used for large-scale power plants, operates with an algorithm based on the exploitation of voltage and current variation due to instantaneous power pulsations [
15]. PWM charge controller suitable for domestic PV power production takes into consideration that PV modules do not always give the power output due to weather variation. Hence, the PWM charge controller automatically matches the PV voltage with the battery voltage [
16]. As the PV and battery produce DC power, an inverter is required to integrate generated power into the national grid or to power appliance and lighting in a house. An inverter is, therefore, a device that converts generated or supplied DC power from the PV or battery into AC power. PV inverters usually have one or two conversion stages. In a single inverter DC to AC, stage one conversion is commonly used, while stage two is DC to DC conversion. The battery bank provides storage for the generated power during the day for consumption in the absence of the sun (night and overcast sky days). That is the size of the battery is subjective by the capacity of the PV module as well as load. However, the system component balance of a commercial PV power plant (grid-tied) does not require a battery bank, as the converted AC power is fed directly to the national grid [
17].
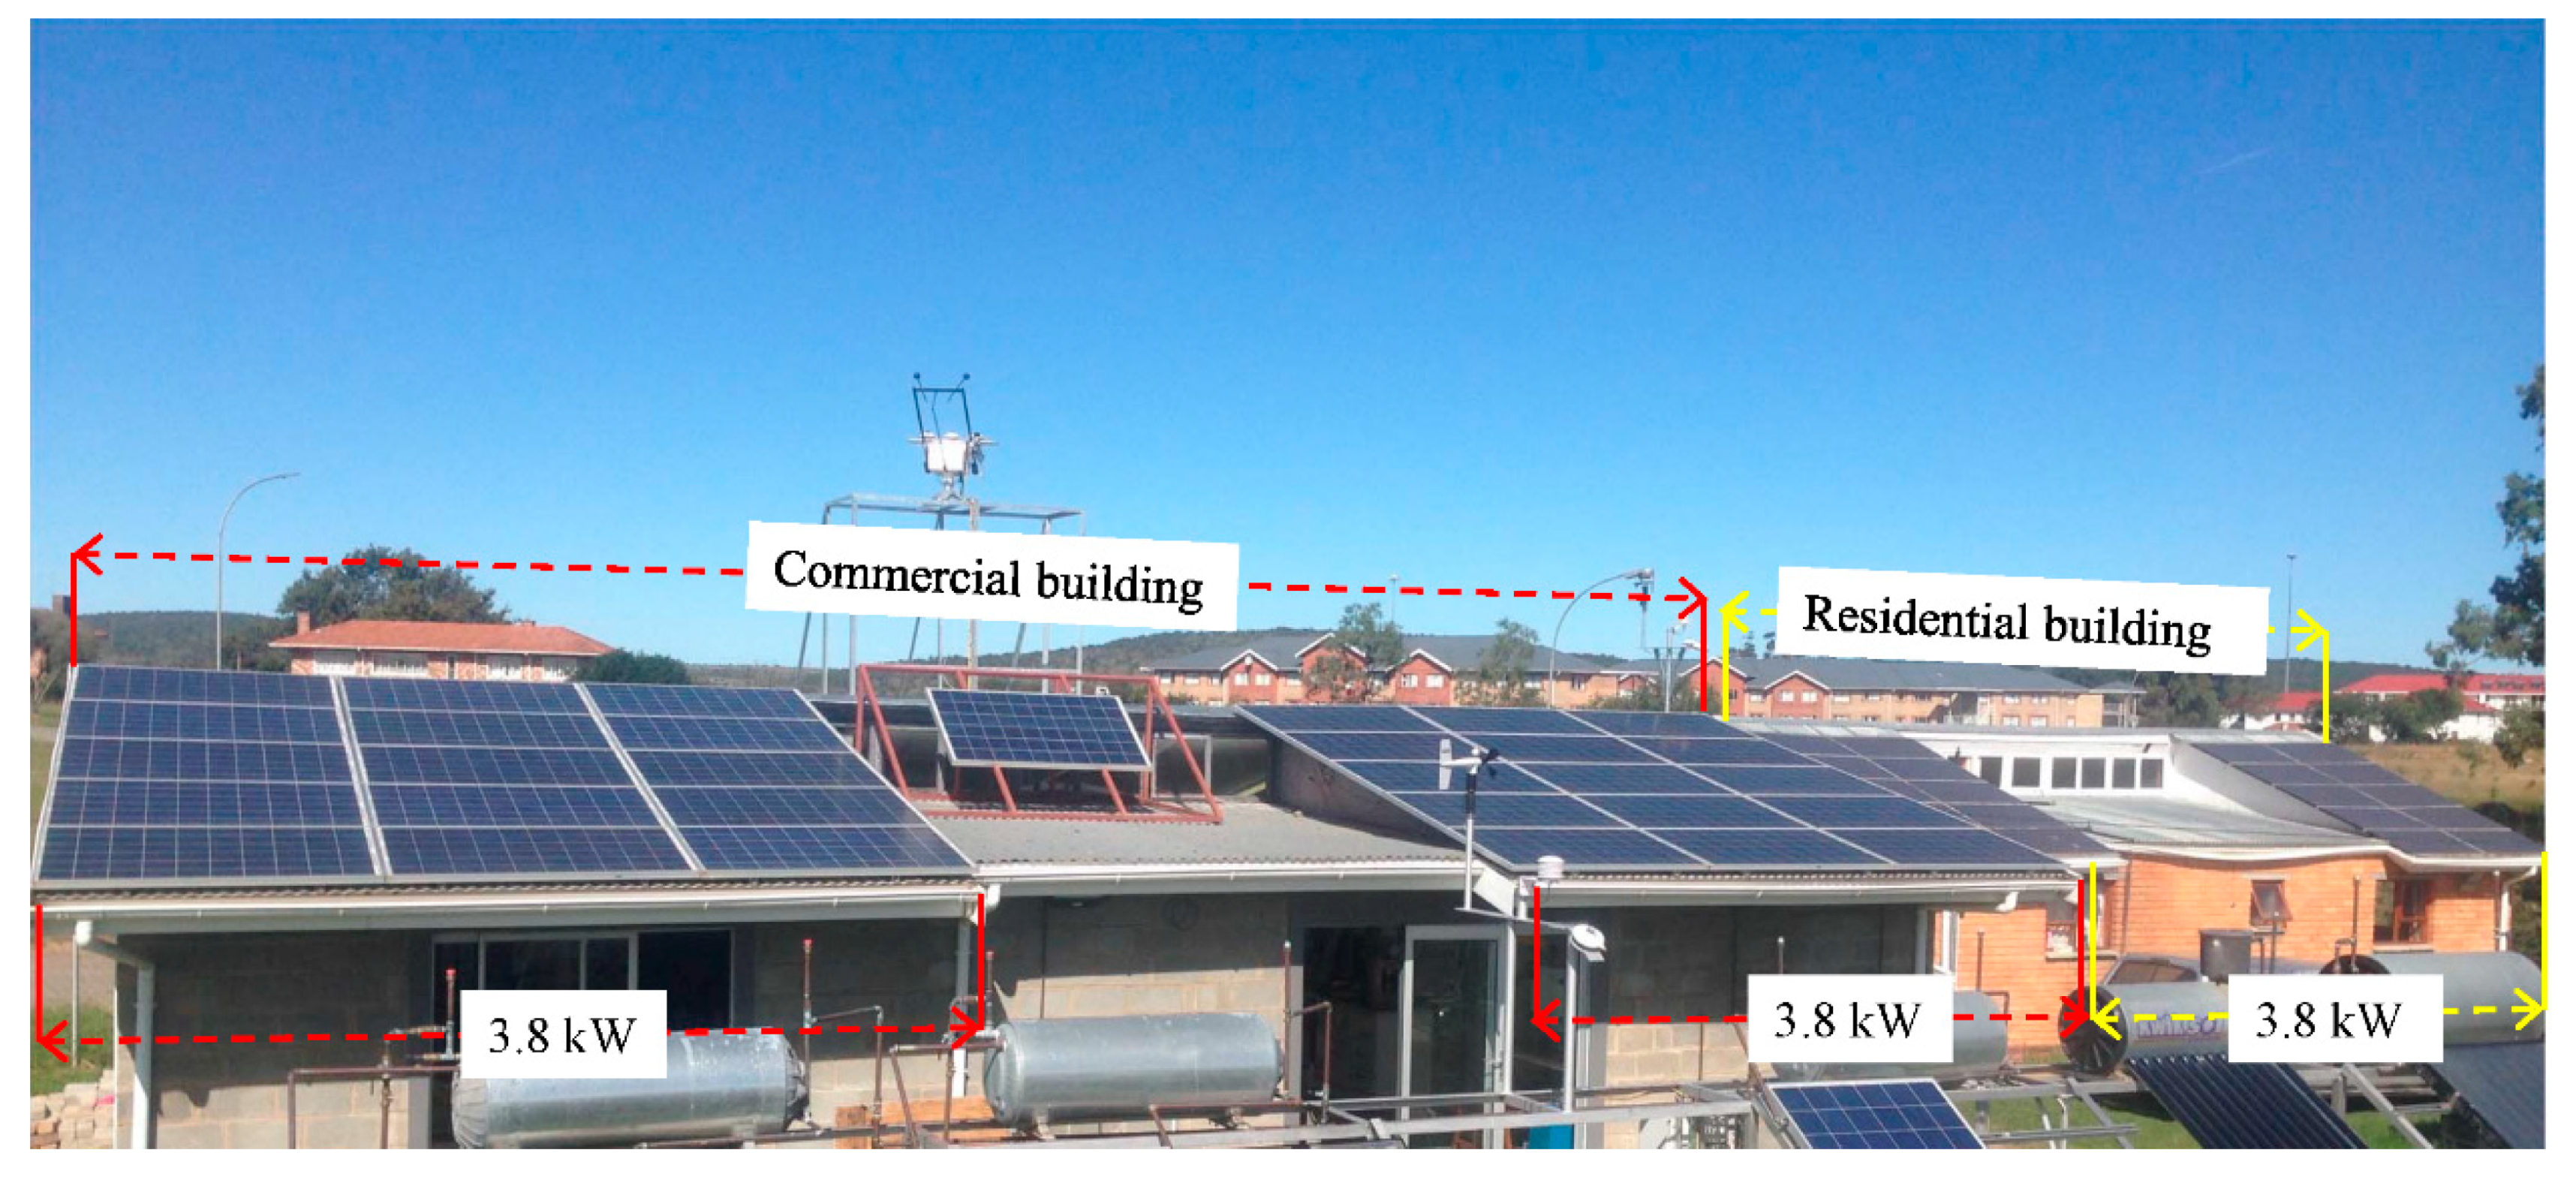
In view of this, and in line with the national imperative of the South African government, a 11.4 kW PV-based microgrid was designed and installed at the SolarWatt Park. The microgrid which is used to power a commercial and residential building is a pilot study of large- and small-scale PV power plants operation in Alice. However, this study is focused on various components of the microgrid with emphasis on the design and installation of electrical and meteorological DAS.
This paper is organised in the following ways:
Section 2 highlights the site and microgrid descriptions while
Section 3 discusses material and methods.
Section 4 presents the results and discussion and a summary of the conclusion is presented in
Section 5.
3. Materials and Methods
3.1. Design and Development of DAS
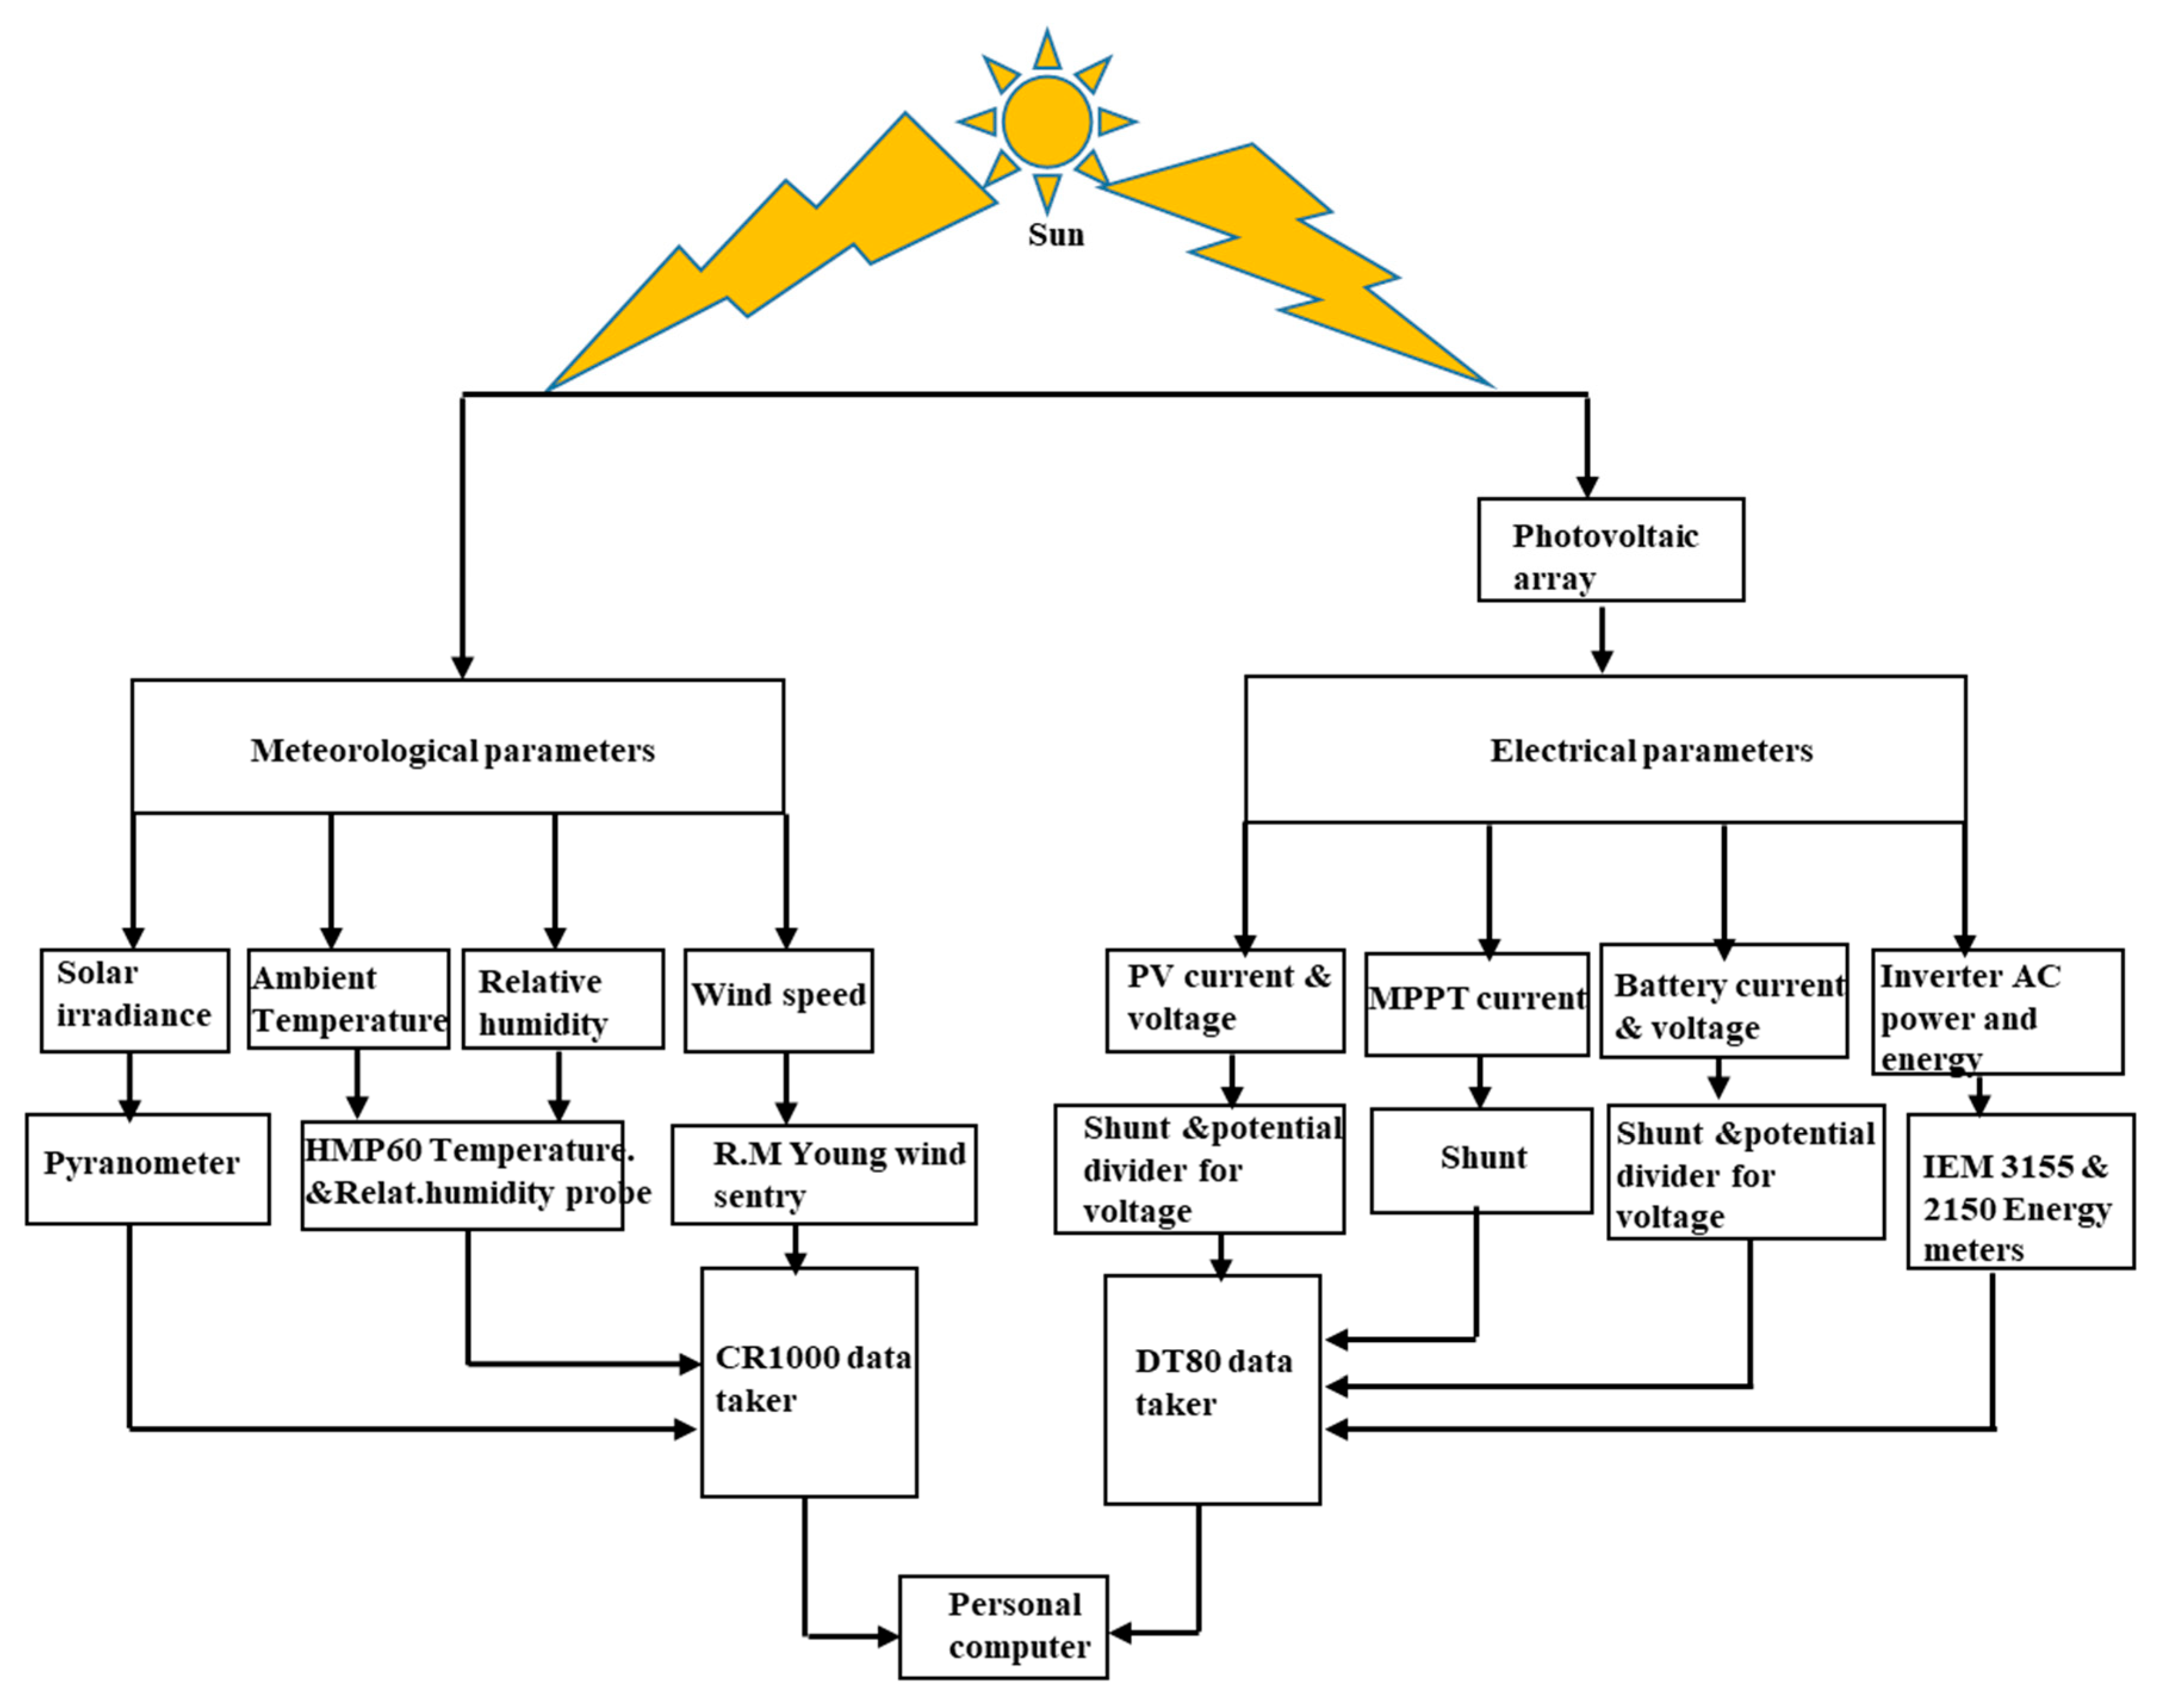
The sun generates solar energy that is used by the PV array. The photovoltaic system incorporates solar array, meteorological and electrical parameters with different techniques for data transmissions. The CR1000 consists of sets of sensors for measuring and logging in meteorological parameters such as solar irradiance, ambient temperature, relative humidity and wind speed while DT80 consists of different sets of devices used to measure electrical parameters like current and voltage of PV, MPPT, battery and inverter. Temperatures between 17 to 45 °C with relative humidity conditions within a range from 15 to 90% (non-condensing) and solar irradiance of up to 1250 W/m
2 were recorded in the system. Besides, the designed DAS was exposed to dust and high wind speed in the range of 2.1 to 2.5 m/s. A refrigeration system and a stove of up to 2 kW were used to draw power from the PV array and battery system.
Figure 4 shows the block diagram of DAS measuring indoor and outdoor parameters.
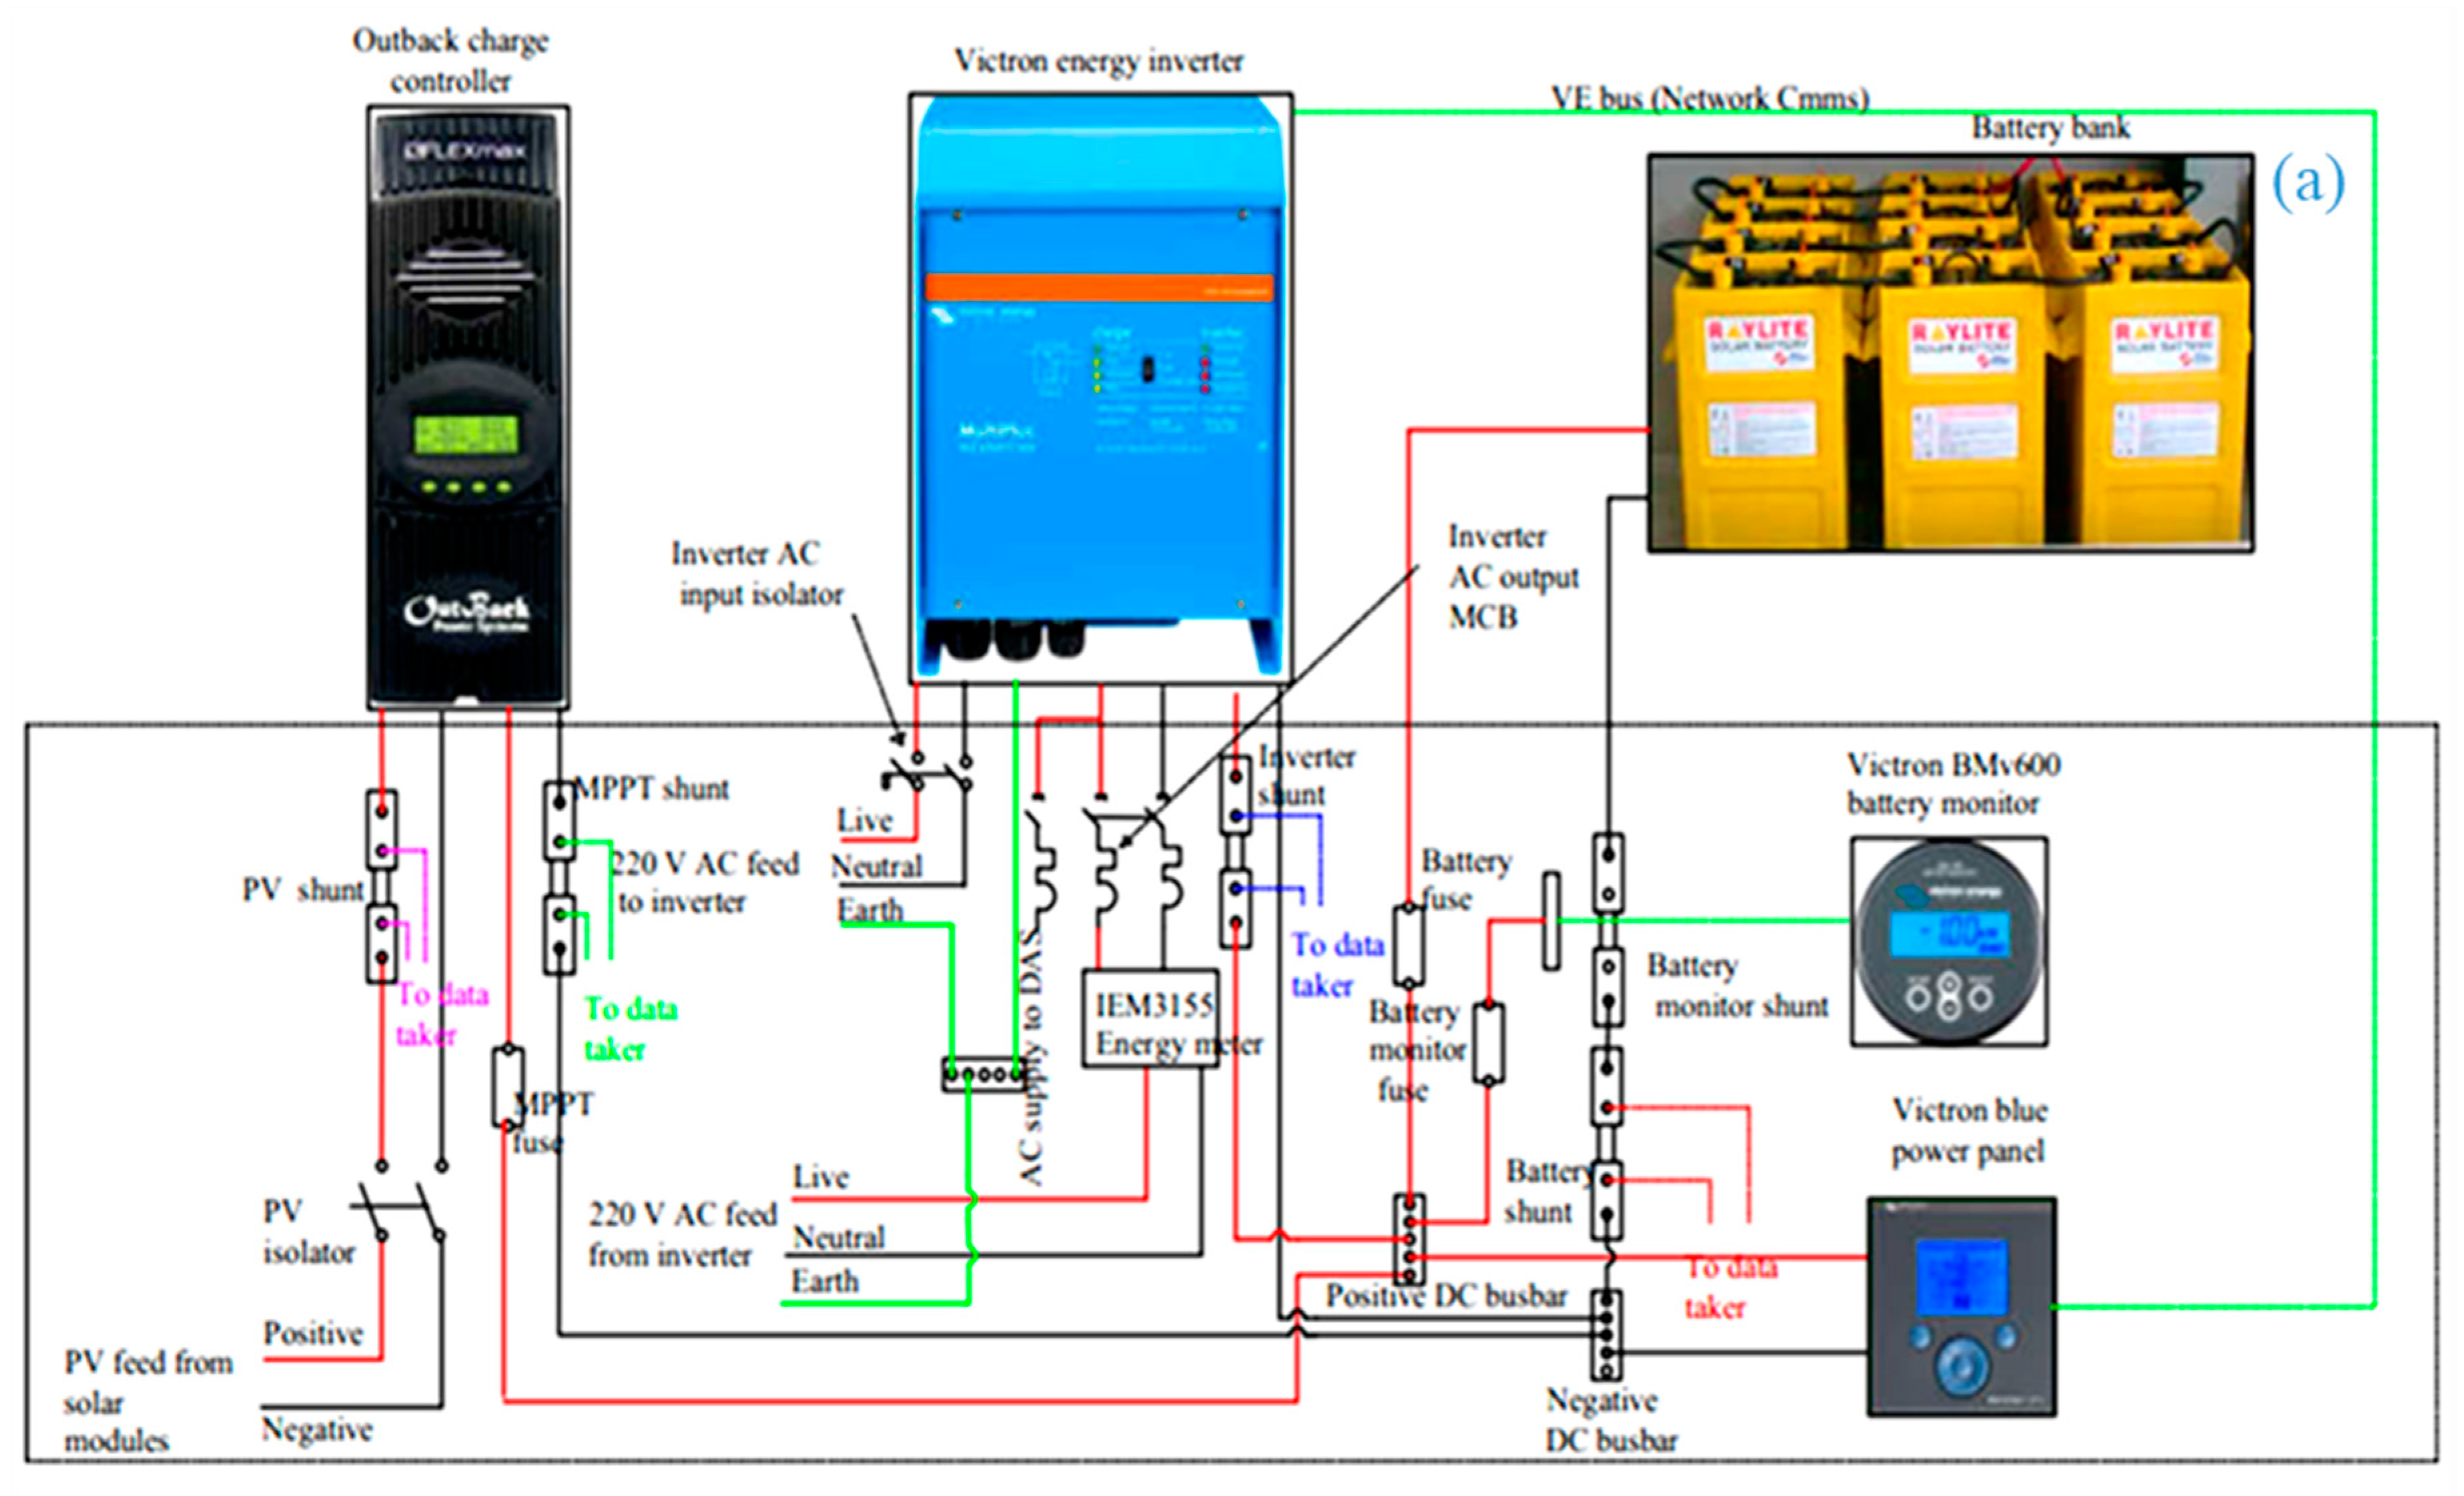
Shunt resistors are aligned, each at the output of the PV array and MPPT while the input in each is connected to the battery bank and the inverter to measure the current flowing into and out of the respective components. The DC power output from the batteries is fed directly into the inverter for conversion into AC power at a frequency of 50 Hz and voltage of 230 V. The output current, voltage and power from the inverter are measured using the IEM 2150 energy meters. However, the two loggers (CR1000 and DT80) automatically record each reading taken from the respective sensor which is at that point stored in the internal memory of the corresponding loggers and can henceforth retrieve periodically through Wi-Fi to the personal computer for analysis.
3.2. Development of Meteorological DAS
The meteorological data acquisition is carried out to offer additional data to PV array and also assists to address the desires of the PV power plant for long-standing, high accuracy, well preserved and standard systems in variable weather conditions. The measuring parameters are pyranometer for solar radiation, relative humidity probe for both ambient temperature and relative humidity as well as wind monitor for wind speed. These devices are all mounted at the roof-top of the commercial building at SolarWatt park, to experimentally measure metrological parameters at different positions of the sun.
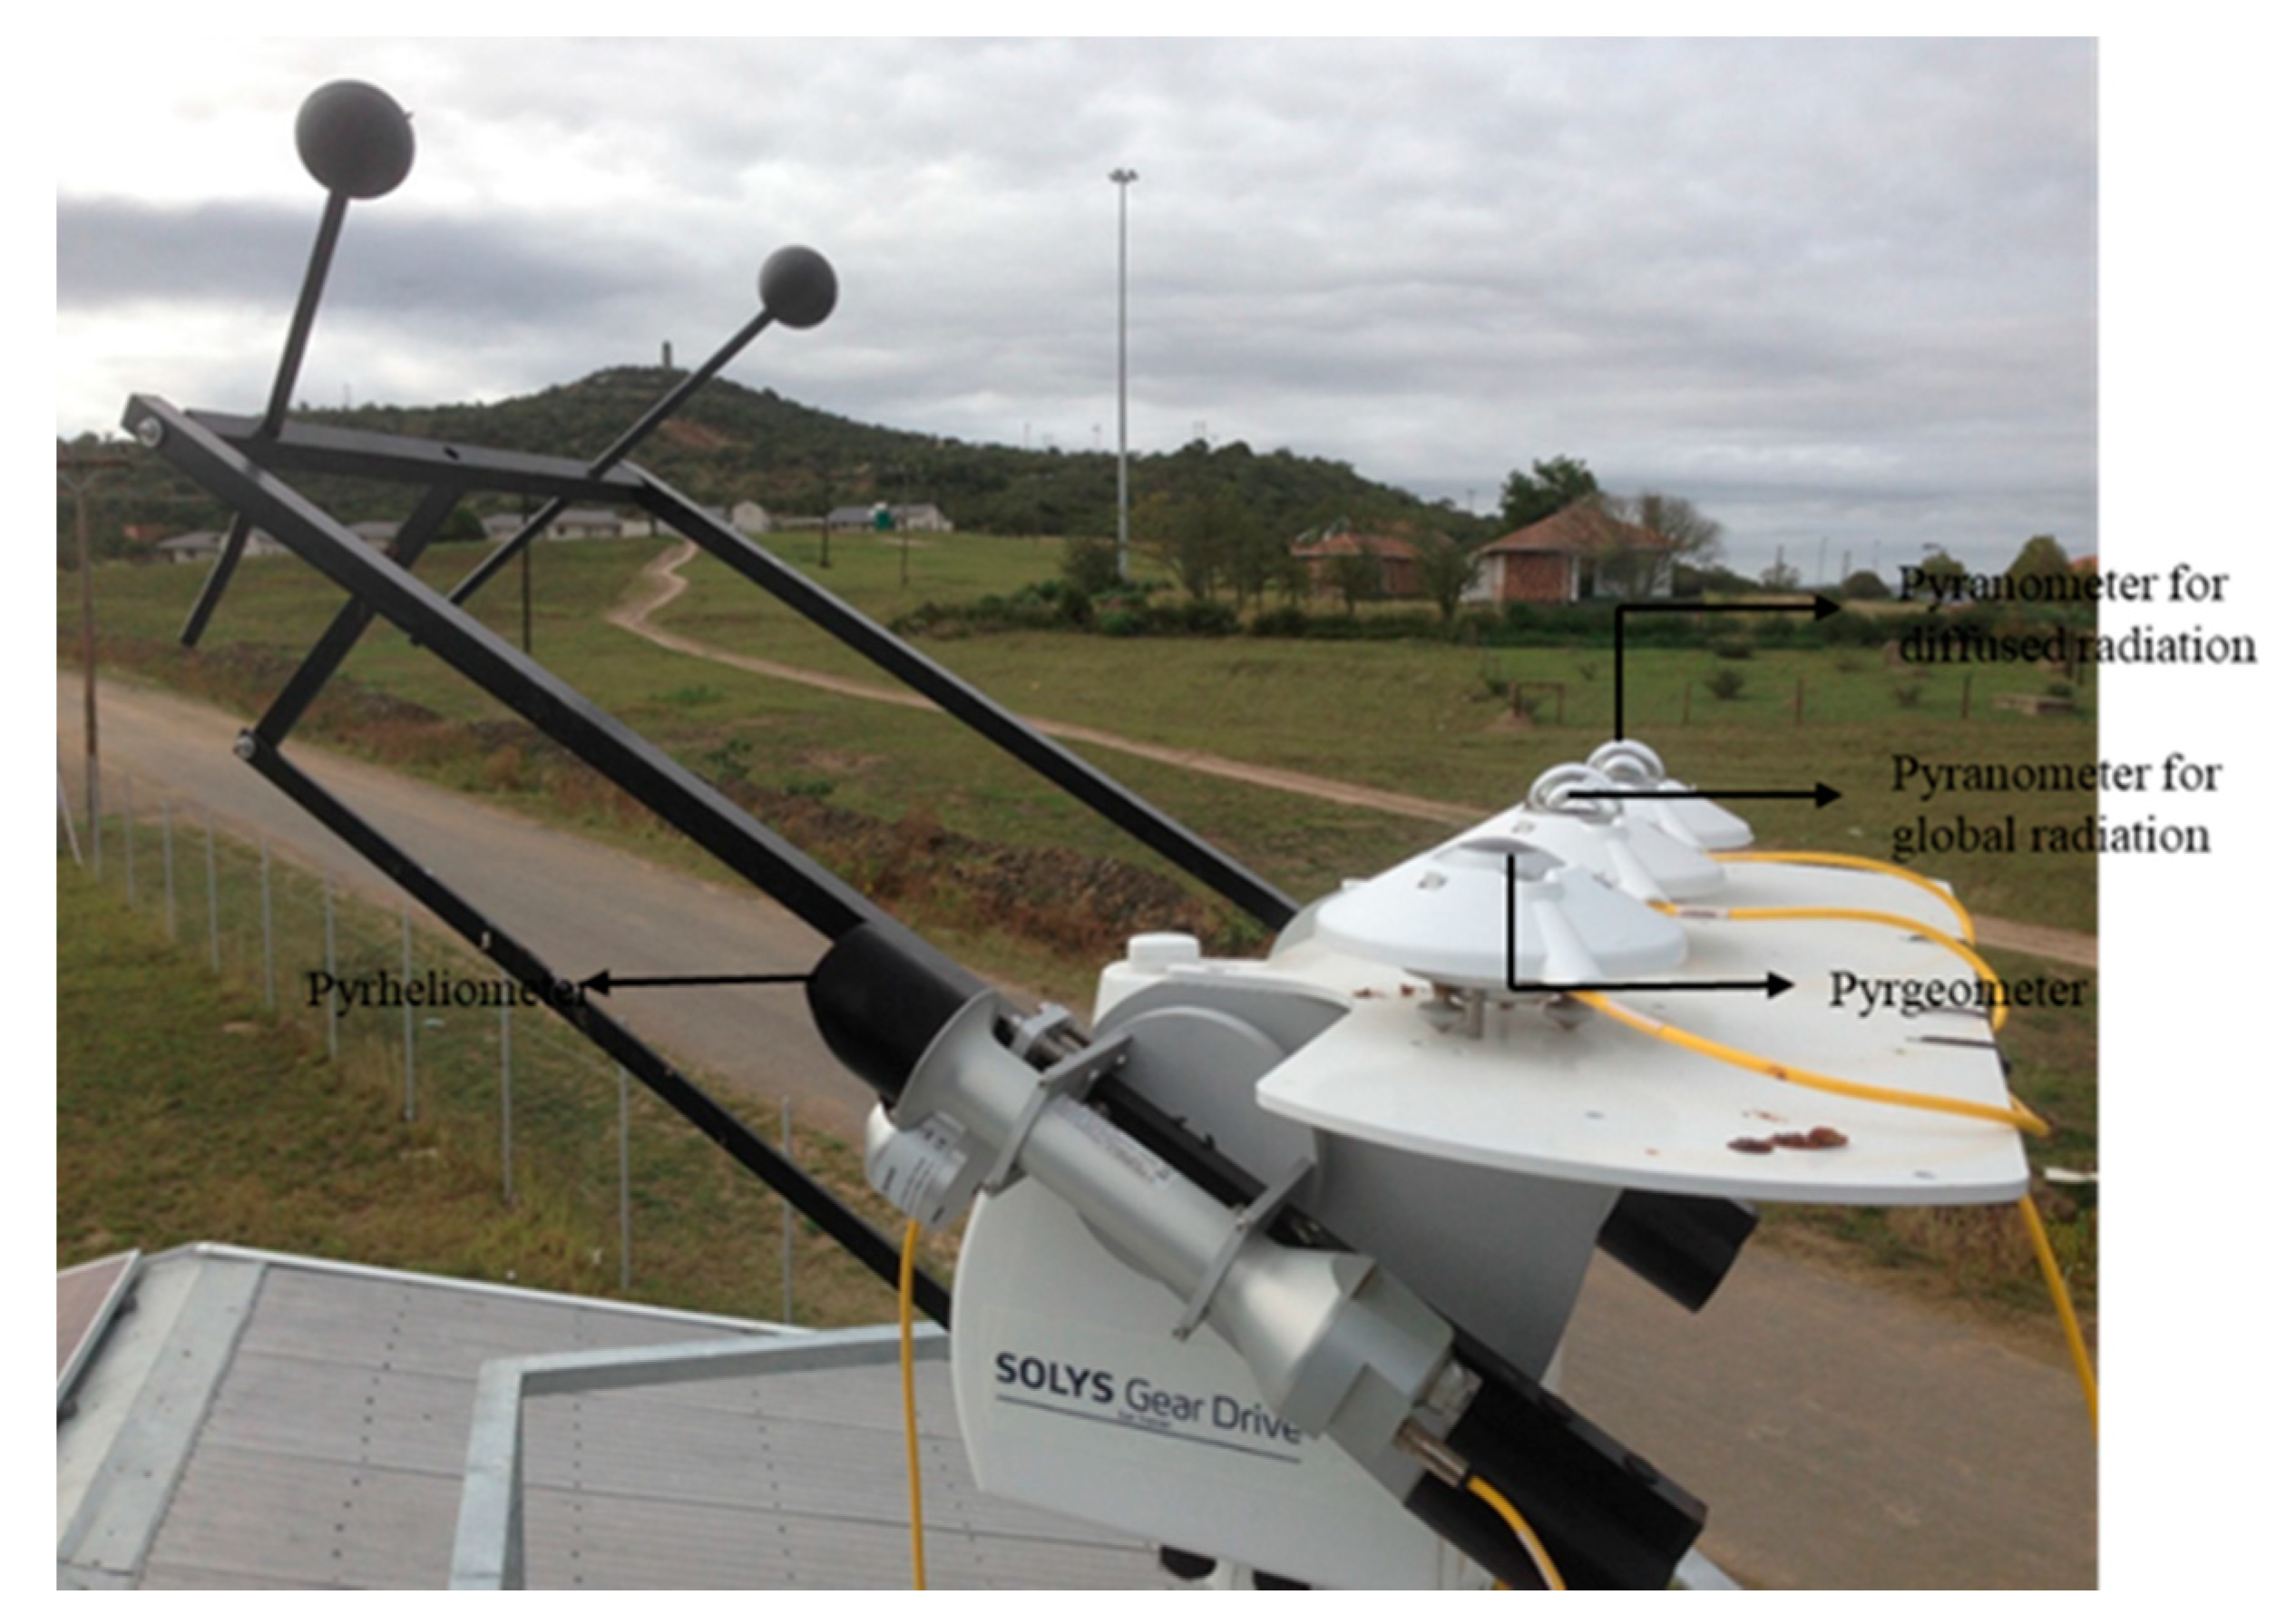
The solar radiation measurements comprise a SOLYS 2 sun tracker, which contains two pyranometers, Pyrheliometer and pyrgeometer. The sun tracker is a fitted device capable of measuring global, direct and diffuse components of the sun as well as other meteorological parameters. It is an automatic two-axis instrument used for both vertical and horizontal solar radiation with a team of measuring devices such as the time, date, longitude, latitude and altitude of this location to calculate and track the position of the sun at all the time. Hence, the image of the sun tracker is presented in
Figure 5.
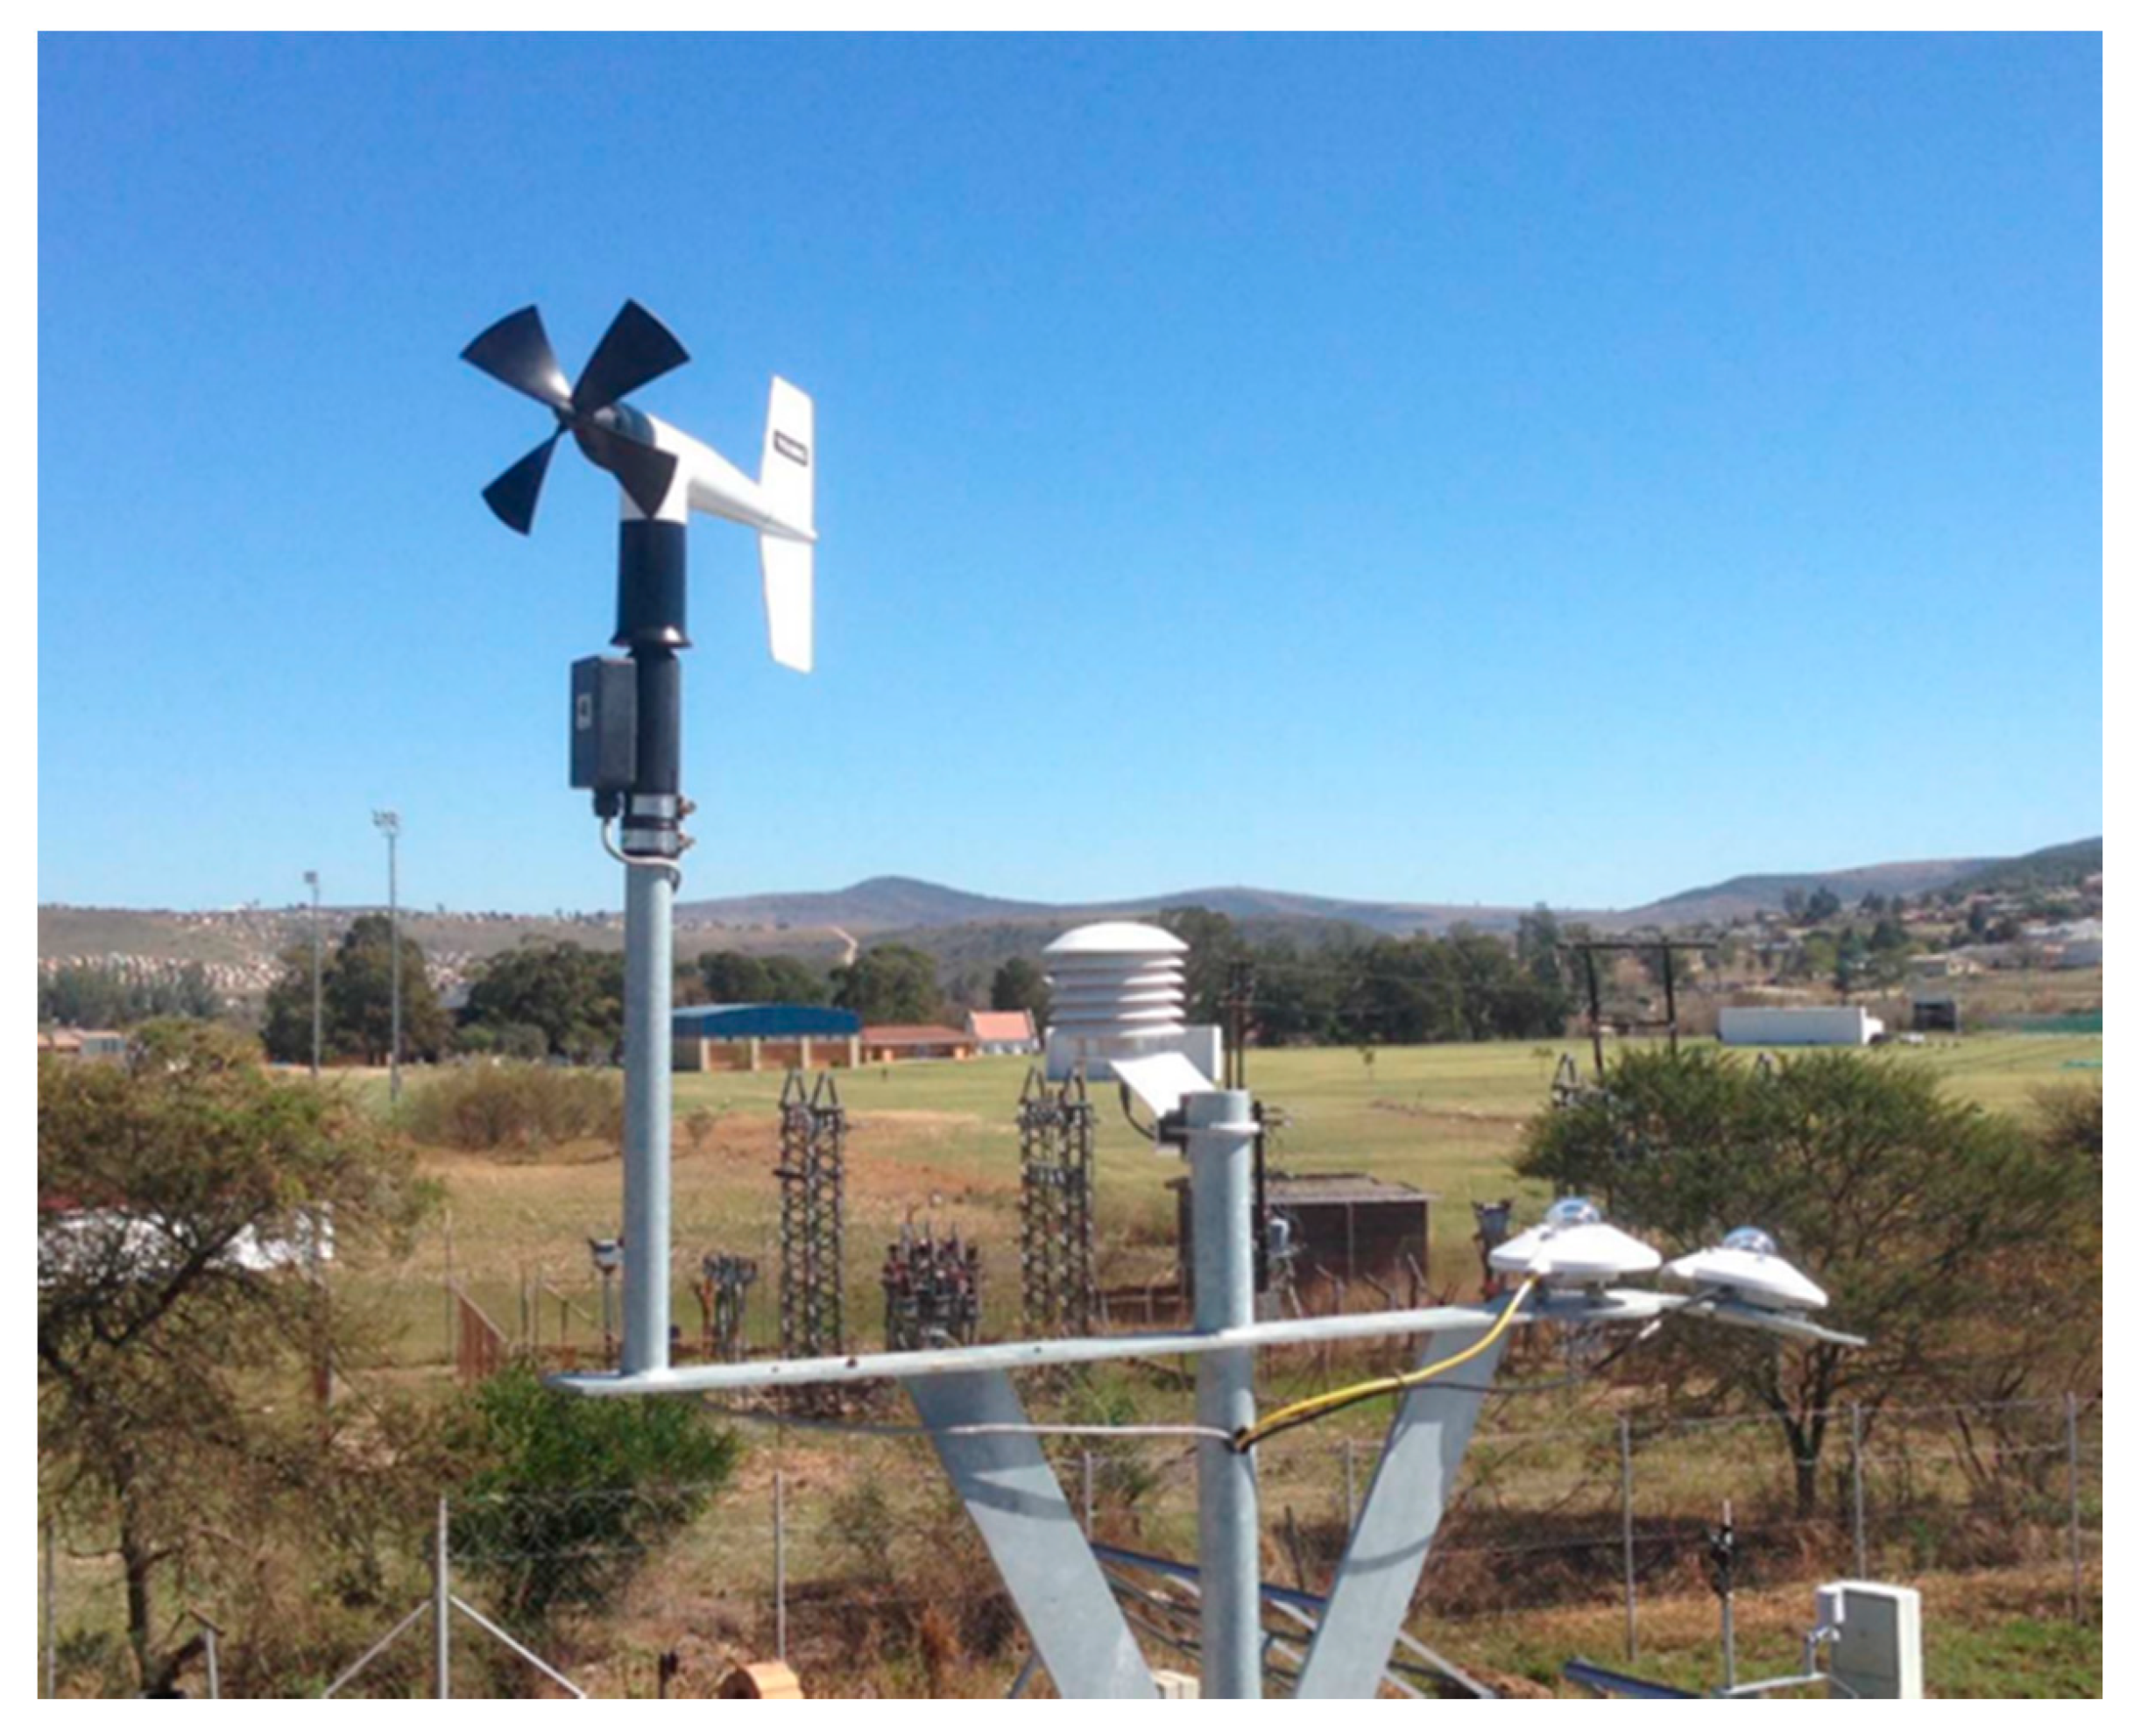
However, as shown in
Figure 6, Kipp & Zonen CMP 11 pyranometers were used to monitor the global horizontal irradiance (GHI) and global irradiance on a tilted surface. The tilted pyranometer (extreme right) is on the same slope (12°) as the roof of the commercial building, thus, measuring the same amount of solar radiation subjected to the PV array. CMP 11 pyranometer is made up of a 32-junction thermopile as a sensing element. The thermopile involves thermocouple junction with sets that were in series connection.
The measurement (hot) junction of one of the thermocouple absorbs thermal radiation, increasing its temperature. The difference between the measurement and a fixed temperature reference (cold) junction produces a voltage directly proportional to the differential temperature created due to the thermoelectric effect [
22]. The sensitivity of the CMP 11 used in this study is 8 µV/m
−2 with a spectral range of 285 to 2800 nm. Its response time is less than 1.7 s (63%) and 5 s (95%) [
23]. The weather station was elevated by 1 m above the roof, providing unobstructed solar radiation for the radiometers. The weather station was also strategically located such that it does not cast a shadow on the PV array.
Furthermore, the 6-plate natural aspirated radiation shield in the middle of the weather station, house the temperature and relative humidity probe. The white painted radiation shield allows it to reflect solar radiation, whereas, allows the natural free flow of air through the louvers. This mechanism keeps the probe close as possible to the ambient air temperature (eliminating solar effect) and water vapour [
24]. The HMP60 temperature and relative humidity probe measure the outdoor air temperature, and relative humidity using a platinum resistance temperature (PRT) detector to measure air temperature [
25] and a capacitive relative humidity sensor to measure relative humidity [
26]. The measurement specifications of HMP60 probe temperature and relative humidity sensor are given in
Table 1 [
24].
All sensors were connected to a CR1000 were they are scanned in 10 min interval and data store every 30 min. Meanwhile, a 12 Volt DC power supply was used to power the CR1000. The power supply was complemented with a 12 Volt rechargeable battery and an uninterruptable power supply system.
3.3. PV System Electrical Performance DAS
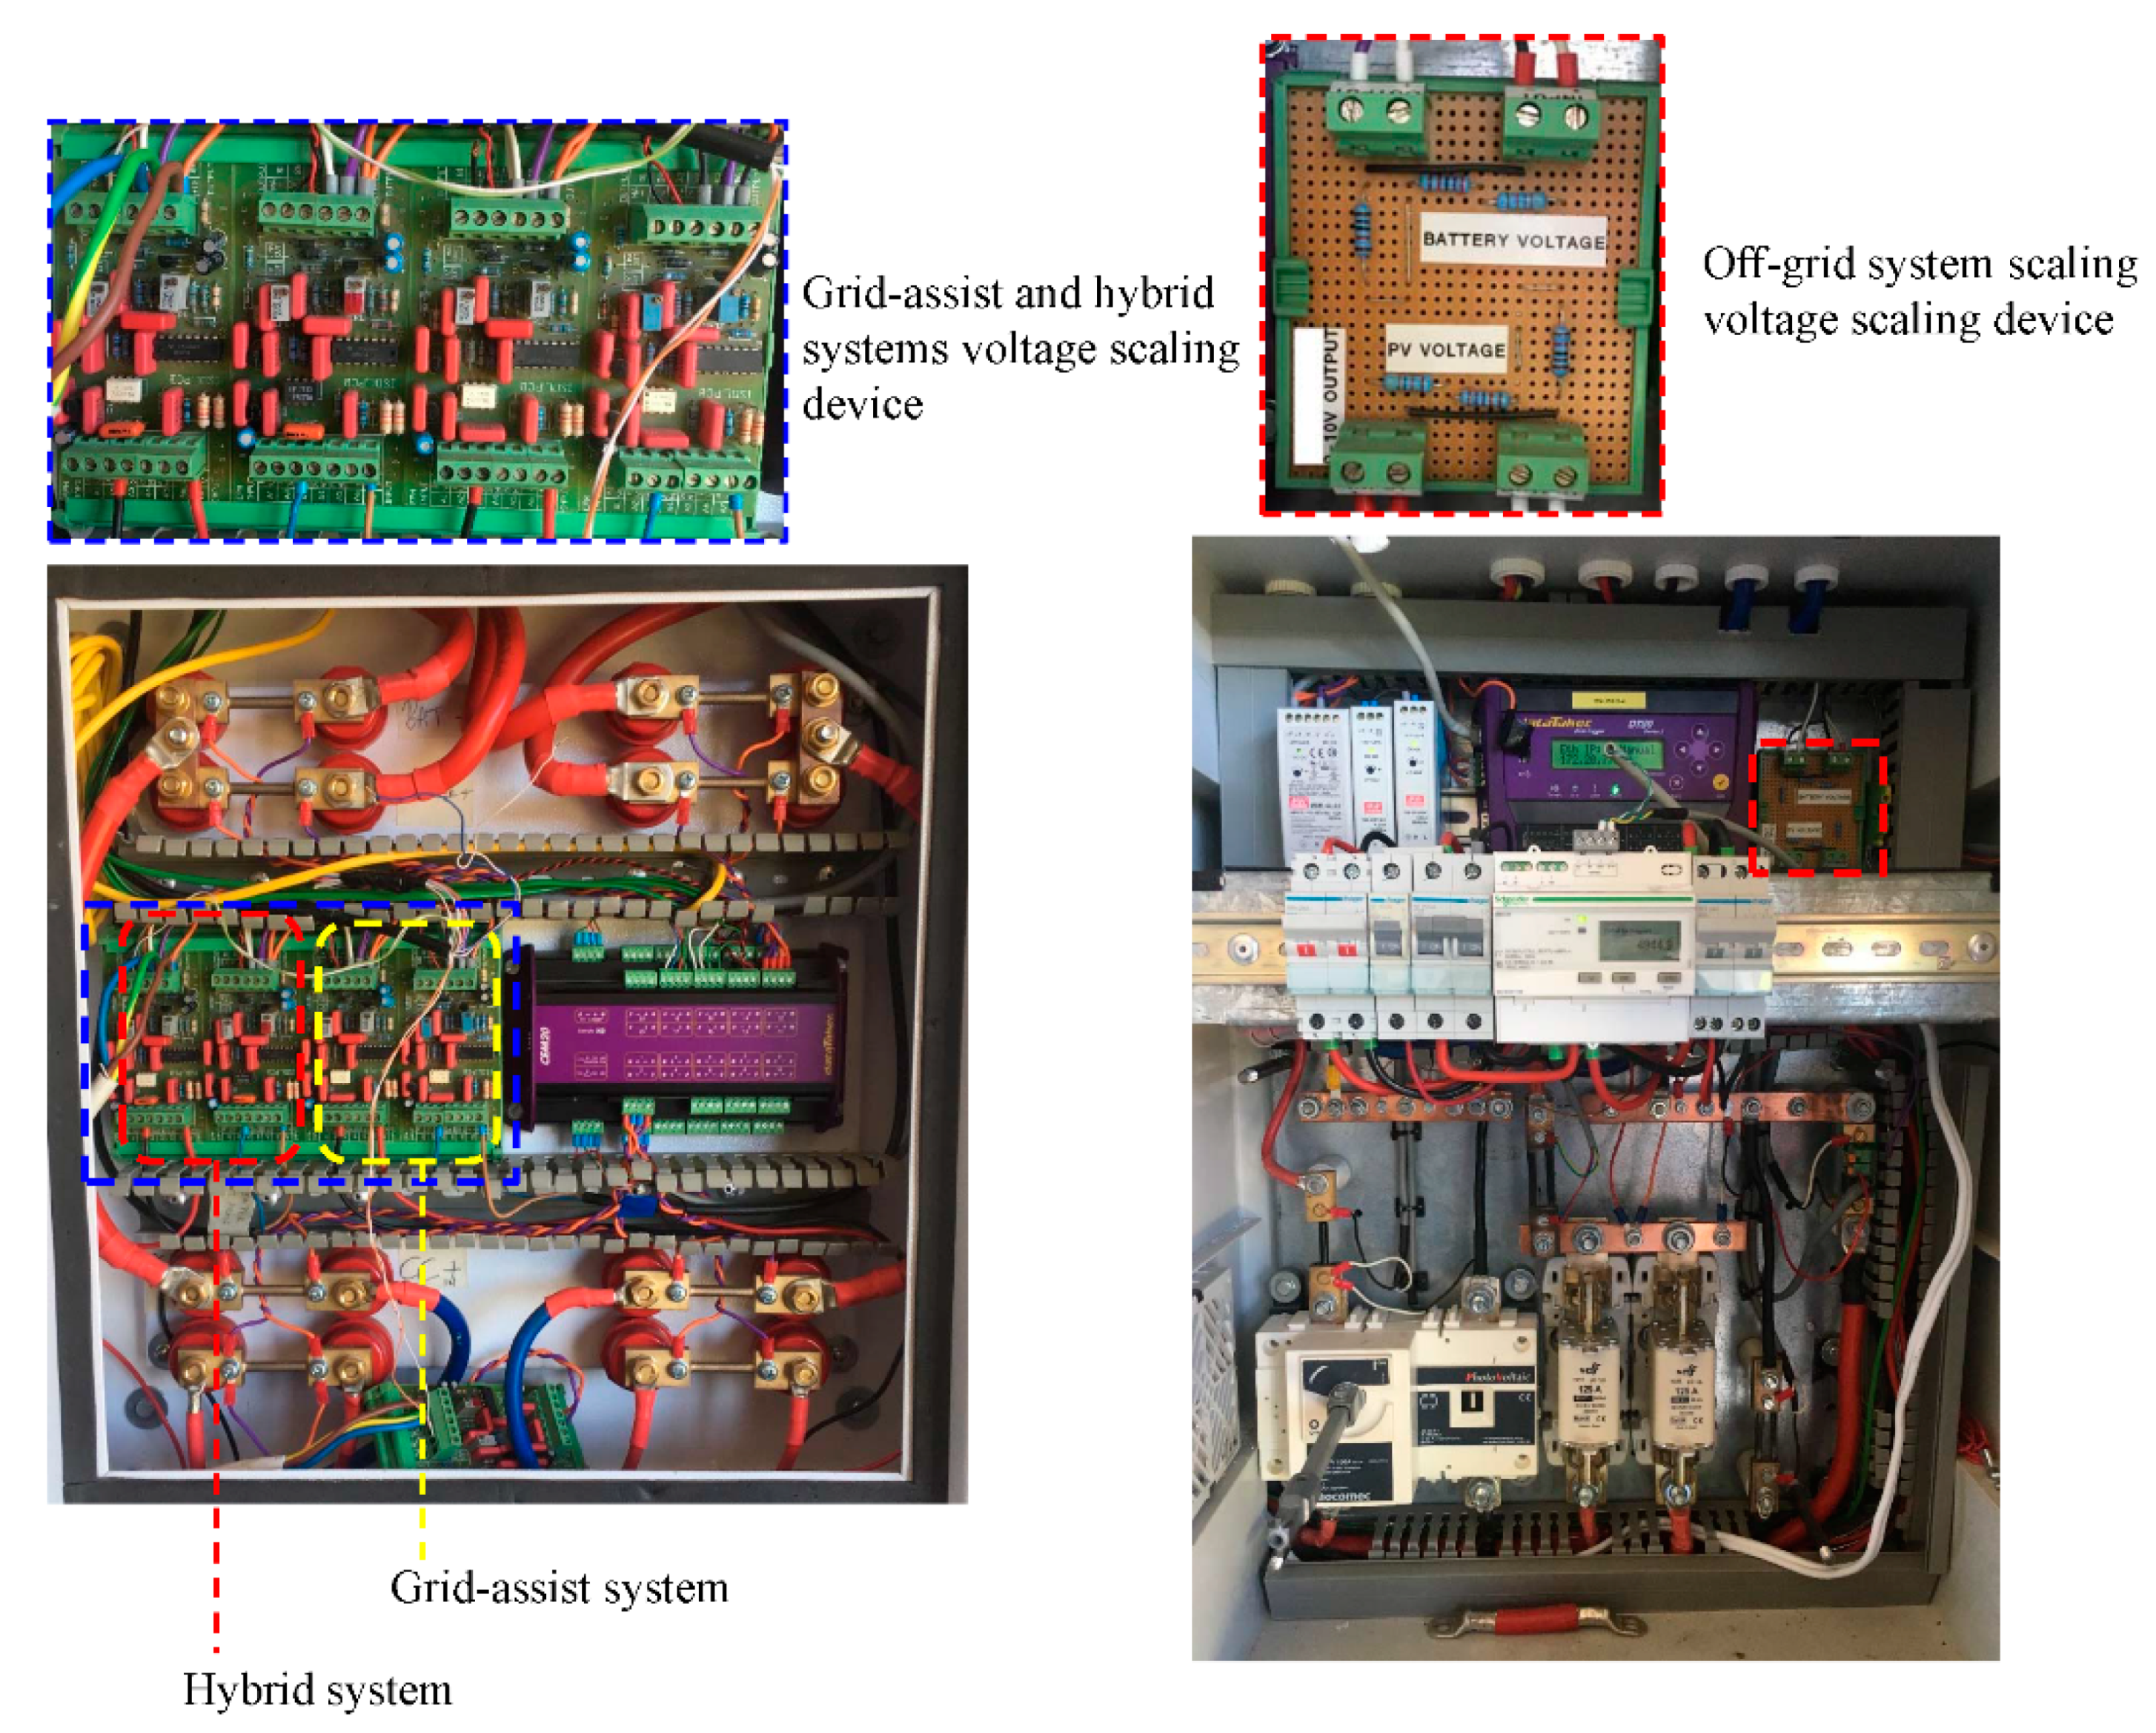
In all the three PV systems, the electrical performance measurements cover the PV, charge controller, battery and inverter current. Regarding the voltage, the PV and battery voltages were measured, where the PV voltage is in the same potential as the charge controller input voltage. Likewise, the battery voltage is equivalent to the charge controller output and inverter input voltages. In addition to the current and voltage measurements, the inverter output voltage, power and energy in all the systems were monitored. All the measuring sensors and devices were connected to a DT80 dataTaker accompanied by a CEM 20 channel expansion module, where data are stored and retrieved periodically. The PV systems electrical parameters data acquisition system are presented in
Figure 7.
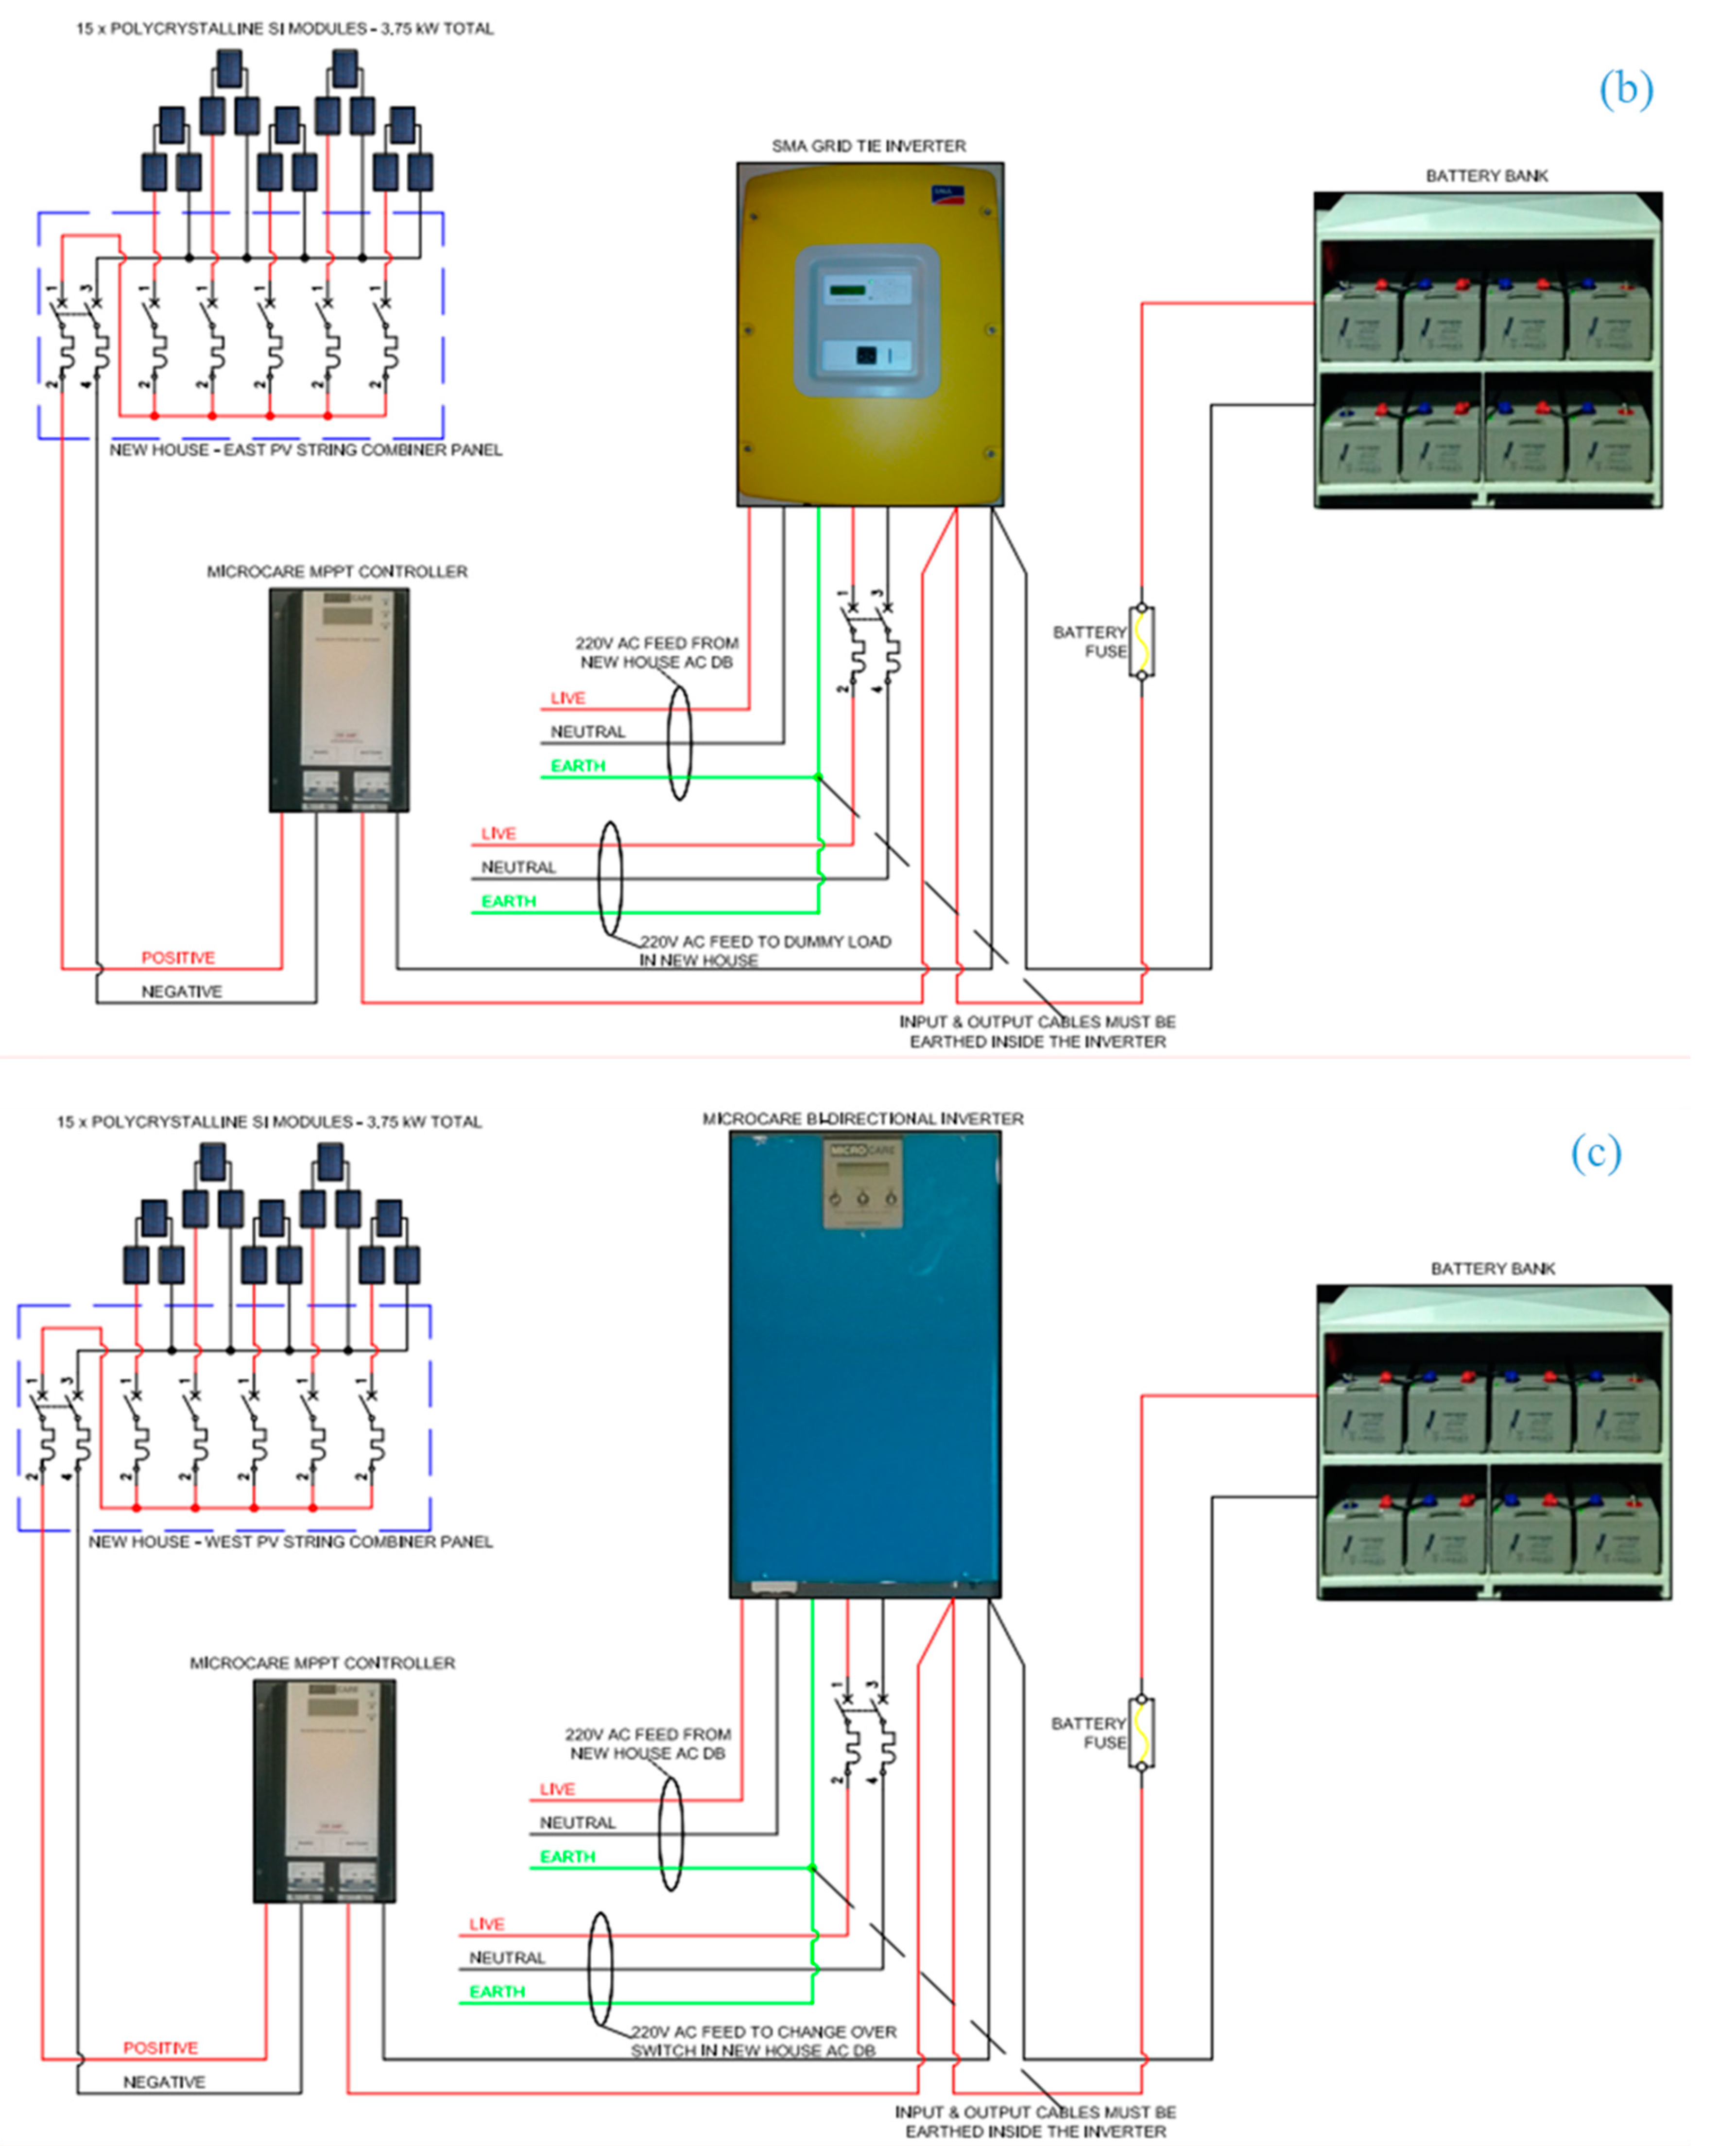
In the off-grid system, an 80 A shunt resistor with a voltage drop of 50 mV was used for the current measurements. The grid-assisted and hybrid systems both use 100 A shunt with a corresponding voltage drop of 60 mV for the same measurements. The current flowing through the shunt resistors is proportional to the drop voltage, and it is logged using a defined voltage to the current multiplier in the dataTaker.
Meanwhile, voltage measurements were not as straight forward as that of the current. The DT80 dataTaker is designed to directly measure 30 mV to 30 V DC voltage, whereas full-scale open circuit PV and battery voltages were 120 and 60 V, respectively. Therefore, a voltage scaling device was required to scale-down the PV and battery voltages. Thus, 80 kΩ potential divider network devices were used to scale-down the PV and battery voltages of the off-grid system. In the grid-assisted and hybrid systems, a signal conditioner circuitry with the ability to scale and isolate voltage was used. The voltage scaling devices in each system were configured to receive 120 V (input) and scale it down to 10 (output) VDC for the dataTaker. It is worth mentioning that the electrical isolation of the input and output voltages of the various components as stated above was not considered in the design of the voltage scaling devices since the dataTaker is equipped with mechanical relays. These relays allow the dataTaker to measure each voltage signal at any given time individually.
On the other hand, the voltage divider method can be used to measure the PV and battery voltage in the system. In this process, three resistors of resistances were connected in series: 43 kΩ, 27 kΩ and 10 kΩ. The data taker was connected across the 10 kΩ resistor. This is to allow the taker to record the minimum available voltage. The data logger has been configured to multiply this measured voltage by a channel factor of 8 to convert the voltage drop being measured by the data logger into the actual PV or battery voltage.
Figure 8 shows the arrangement of the resistors used to measure DC voltage in the system.
Hence the Equations (1) and (2) illustrate the voltage divider method on the circuit [
27].
Furthermore, a three-phase Schneider IEM 3155 energy meter was used to monitor the off-grid system’s inverter output voltage, power and energy. The same parameters in the grid-assisted and hybrid systems were measured with a single-phase Schneider IEM 2150 energy meter installed in the respective systems. Both meters are rated 63 A, whereas IEM 3155 can accommodate 100 to 480 V and IEM 2150 has a rating of 230 V. They also have the ability to sub-billing, partial metering, and tariff; with IEM 3155 offering four tariff inputs [
28,
29].
3.4. Calibration of Signal Conditioner
Signal conditioner is usually required to convert analogue voltage signals to readable signals for digital devices (DT80 dataTaker) by the linearization process [
30]. The converted signals are, however, a signal with a very low span; in other words, small output range. For this reason, the conditioning of the sense-element output begins with a gain stage which is usually prone to various sources of amplifier errors such as offset, gain and nonlinearity errors. The errors can be worsened or improved based on the way the conditioned output signal is calibrated before transmission in the monitoring system [
24,
29].
To this effect, the signal condition was calibrated to reduce errors initiated by the analogue signal non-idealities and as such improving the accuracy of the output sensor. Moreover, the input and output circuitry was isolated from the signal-conditioning circuits to scale down the input voltage (V
in) of 120 V to output voltage (V
out) of 10 V.
Figure 9 illustrates the signal conditioning process.
The power supply unit (PSU) in
Figure 9, ranges from −15 V to 15 V. The 120 V is fed directly via the input side of the isolation board to the DC to DC converter which comes out as 10 V from the isolator. To linearise the sensor, the 120 V input from the PV arrays was initially set at 80% of 120 V (full scale) reading 96 V in the multimeter and the span was gradually adjusted until it reached 8.0 V output. On the other hand, the span was set to the lowest value 20% of 120 V (full scale), reading 24 V in the multimeter, the span was equally readjusted to 2.0 V of the output. The process continued until an ideal output was obtained as expressed by a straight-line graph shown in Equation (3).
where V
out is the output voltage and V
in is the input voltage, m is the slope and C is the intercept. Equation (4) was used to test the actual value from PV with the output voltage values from the dataTaker.
where
ω is the measured voltage. However, the relation between the actual and logged values was examined and observed that they correlate quite well for all three systems.
Figure 10a–c shows the regression distribution of the input and output voltages of each of the systems.
The bar charts in
Figure 10 represent the actual differences between the actual (V
in) and dataTaker measured voltages. As observed, a relatively insignificant difference was observed between both voltages. The hybrid system was found to have the highest actual difference with 1.5% which is equivalent to 1.32 V.
To establish whether signal conditioning is worsening or improving the conversion of actual input voltage to logger output, the percentage difference between the average V
out before signal conditioning and the V
out after signal conditioning.
Table 2 lists the average percentage difference before and after signal conditioning for the three systems in question. It is clear that signal conditioning is imperative to improve the stability and accuracy of the output signal of the analogue measurement sensors and in this case, an improvement of up to 43% can be achieved through signal conditioning.
4. Results and Discussion
In this section, the performance of each PV system regarding production as captured by the DAS was covered. Knowledge of DAS is essential to allow for efficient planning and applications of the PV power plant. Besides, the optimum design and analysis require not only the information about solar irradiance but also other weather parameters that are collected for a long period. This is very important for power accessibility especially in a remote area that is far from grid connections. The monitored meteorological parameters such as solar radiation, air temperature, relative humidity, wind speed and direction as well as module temperature were also discussed. Thus, a week weather data of the premises and corresponding PV power production were presented and analysed.
4.1. Analysis of Measured Ambient Weather Parameters
The PV power plant and all the sensors in the installed DAS were tested with a week of data, starting from 1st to 7th February 2019, the summer month, to authenticate the reliability of the system. The abovementioned measured ambient weather conditions are presented in
Figure 11a,b. The module temperature is the average back-of-module surface temperatures of all PV systems.
As seen in
Figure 11, the module temperature was observed to follow the solar radiation (tilted and GHI) as well as air temperature closely. It should be noted that the overlapping tilted and horizontal surfaces’ irradiance is due to the season (summer) in the measurements were conducted. In the winter season, a different irradiance is expected on both surfaces with a higher irradiance obtained during solar noon on the tilted surface. The varying seasonal irradiance on both surfaces is attributed to the low sun angle experienced in winter as compared to summer. The air relative humidity and wind speed are decreasing factors of the module temperature. Theoretically [
31], at a fixed amount of water vapour in the air, an increase in temperature reduces air relative humidity and vice versa. The above findings tend to agree with the theory. Among some of the effects of wind speed on PV performance, it reduces the module temperature by the dissipation of convective heat transfer [
32]. Nonetheless, the decrease in the module temperature at the peak wind speed period in
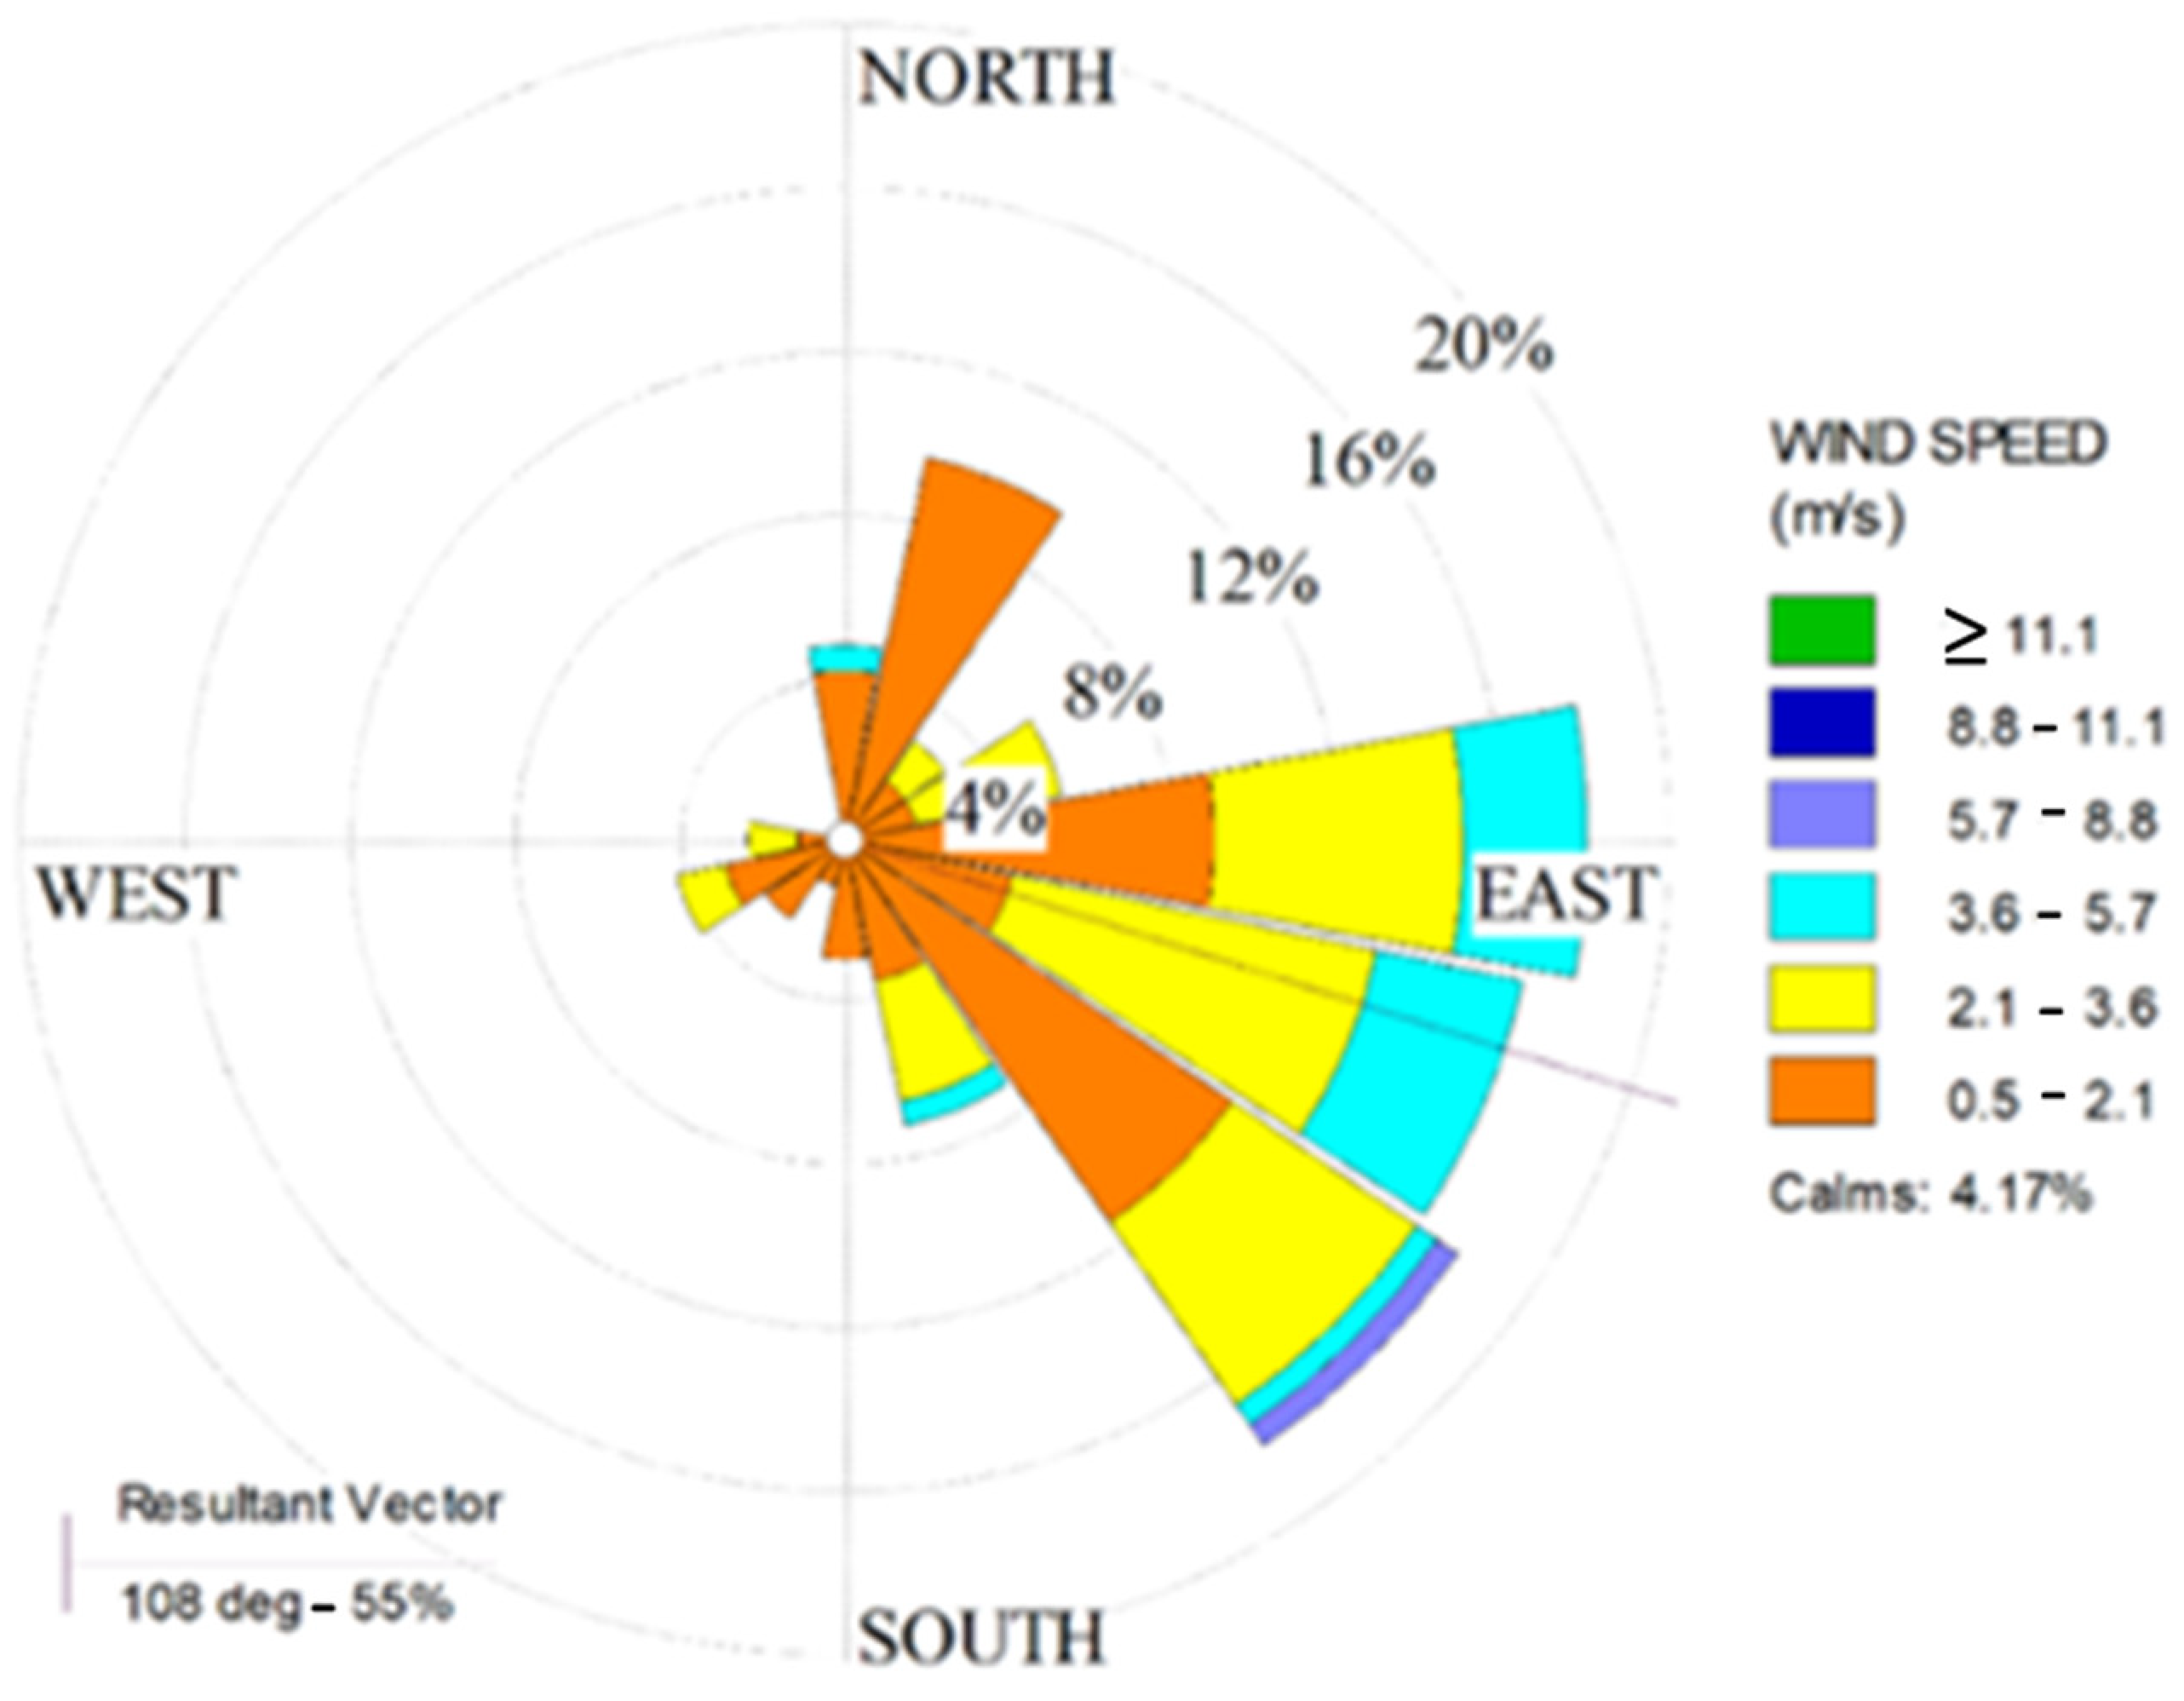
Figure 11 cannot be wholly attributed to the cooling effect of wind. As peak wind speed period coincides with sunset. The direction is a major influencing factor of the wind cooling effect. Thus, a wind rose profile was developed and given in
Figure 12.
Measured wind speed and direction data were integrated into the hourly interval and was used to develop the wind rose profile. The predominant wind showed by the resultant vector which was determined by the frequency count of the mean wind direction. As shown in
Figure 12, 55% of the wind with a mean direction of 108° was observed to blow from the southeast; serving as the prevailing wind. Therefore, the wind direction favours the PV module regarding cooling as the predominant airflow is in the opposite direction of the PV array.
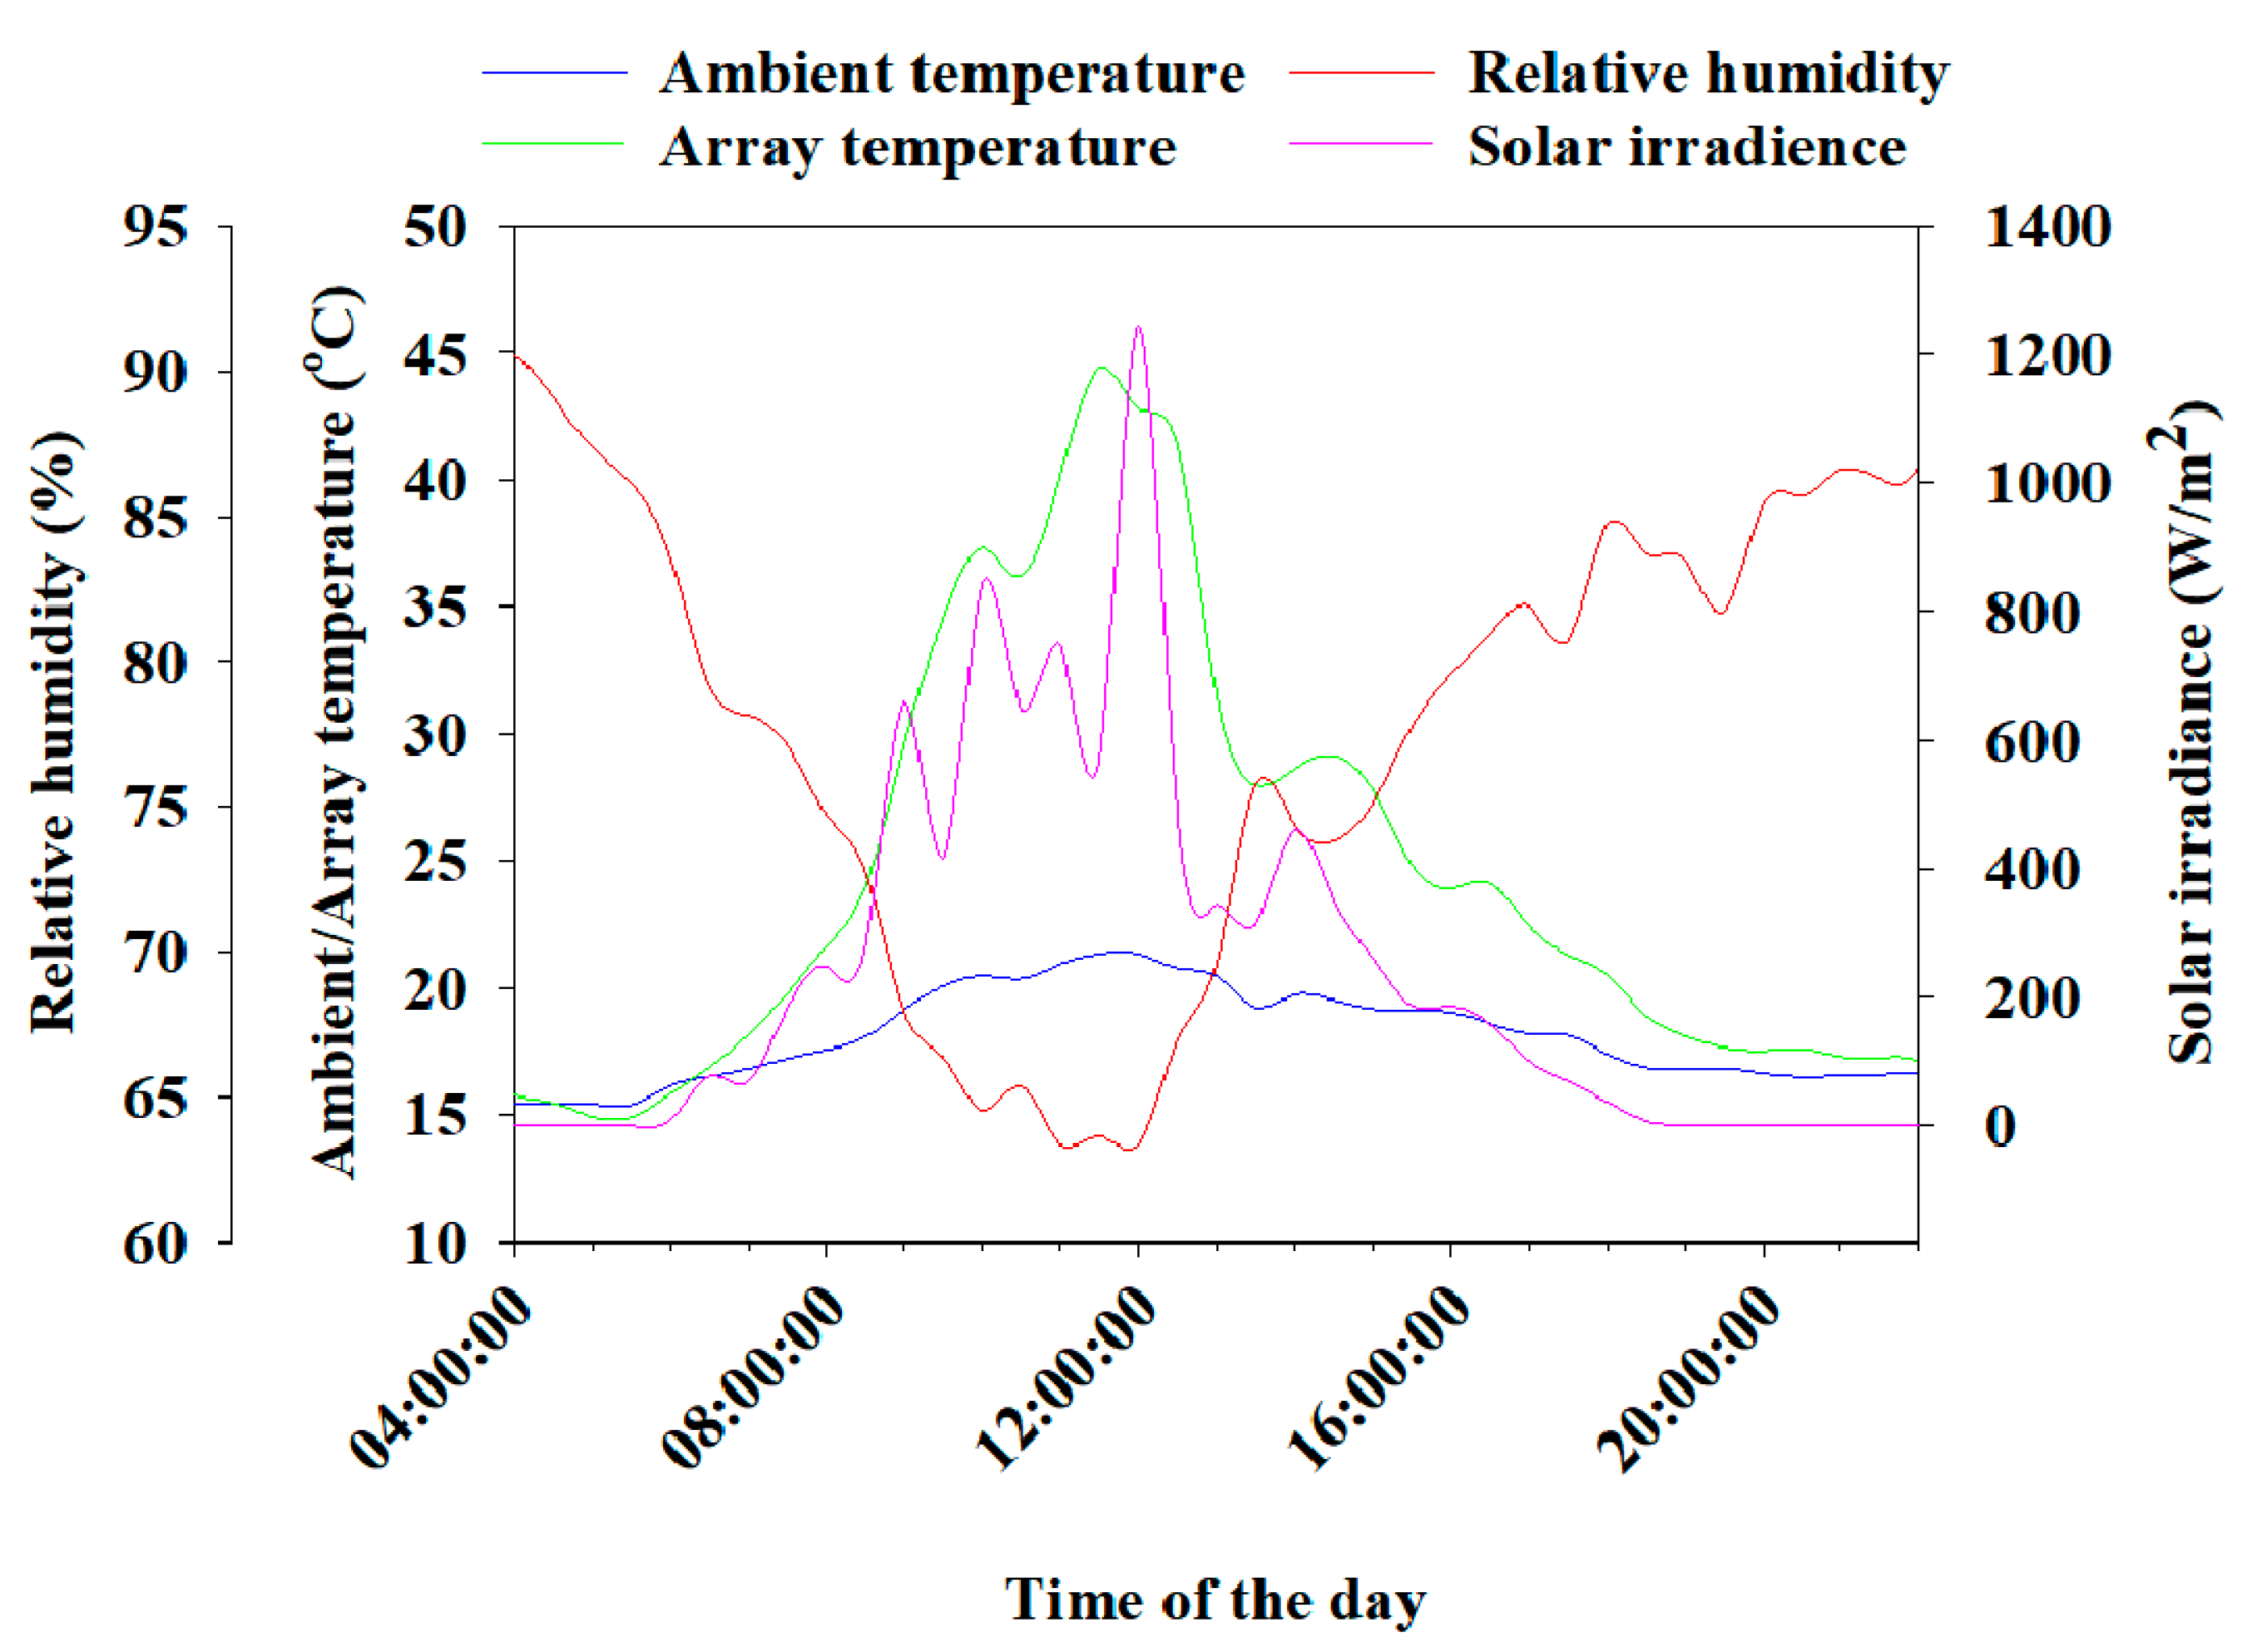
However,
Figure 13 shows a typical day profile of irradiance, relative humidity, array and ambient temperatures of a variable day with a rainstorm on 11th February 2019. The data collected by the data logger displays a nice correlation despite the variable weather conditions. The data loggers functioned properly without faults in the day of stormy weather.
The curves depict that the array temperatures are nearly similar to the ambient temperature at a zero solar irradiance. But immediately the solar irradiance rises, the array temperature increases and becomes more than the ambient temperature.
4.2. Electrical Performance of the PV Power Plant
The solar radiation and module temperature are the main influencing factors affecting PV power production [
33]. PV current curve does not always follow the irradiance curve directly throughout the day as expected since the photo-generated current is directly proportional to solar irradiance. However, the connected load also determines the amount of current released by the PV module. PV open circuit voltage tends to decrease with an increase in the module temperature [
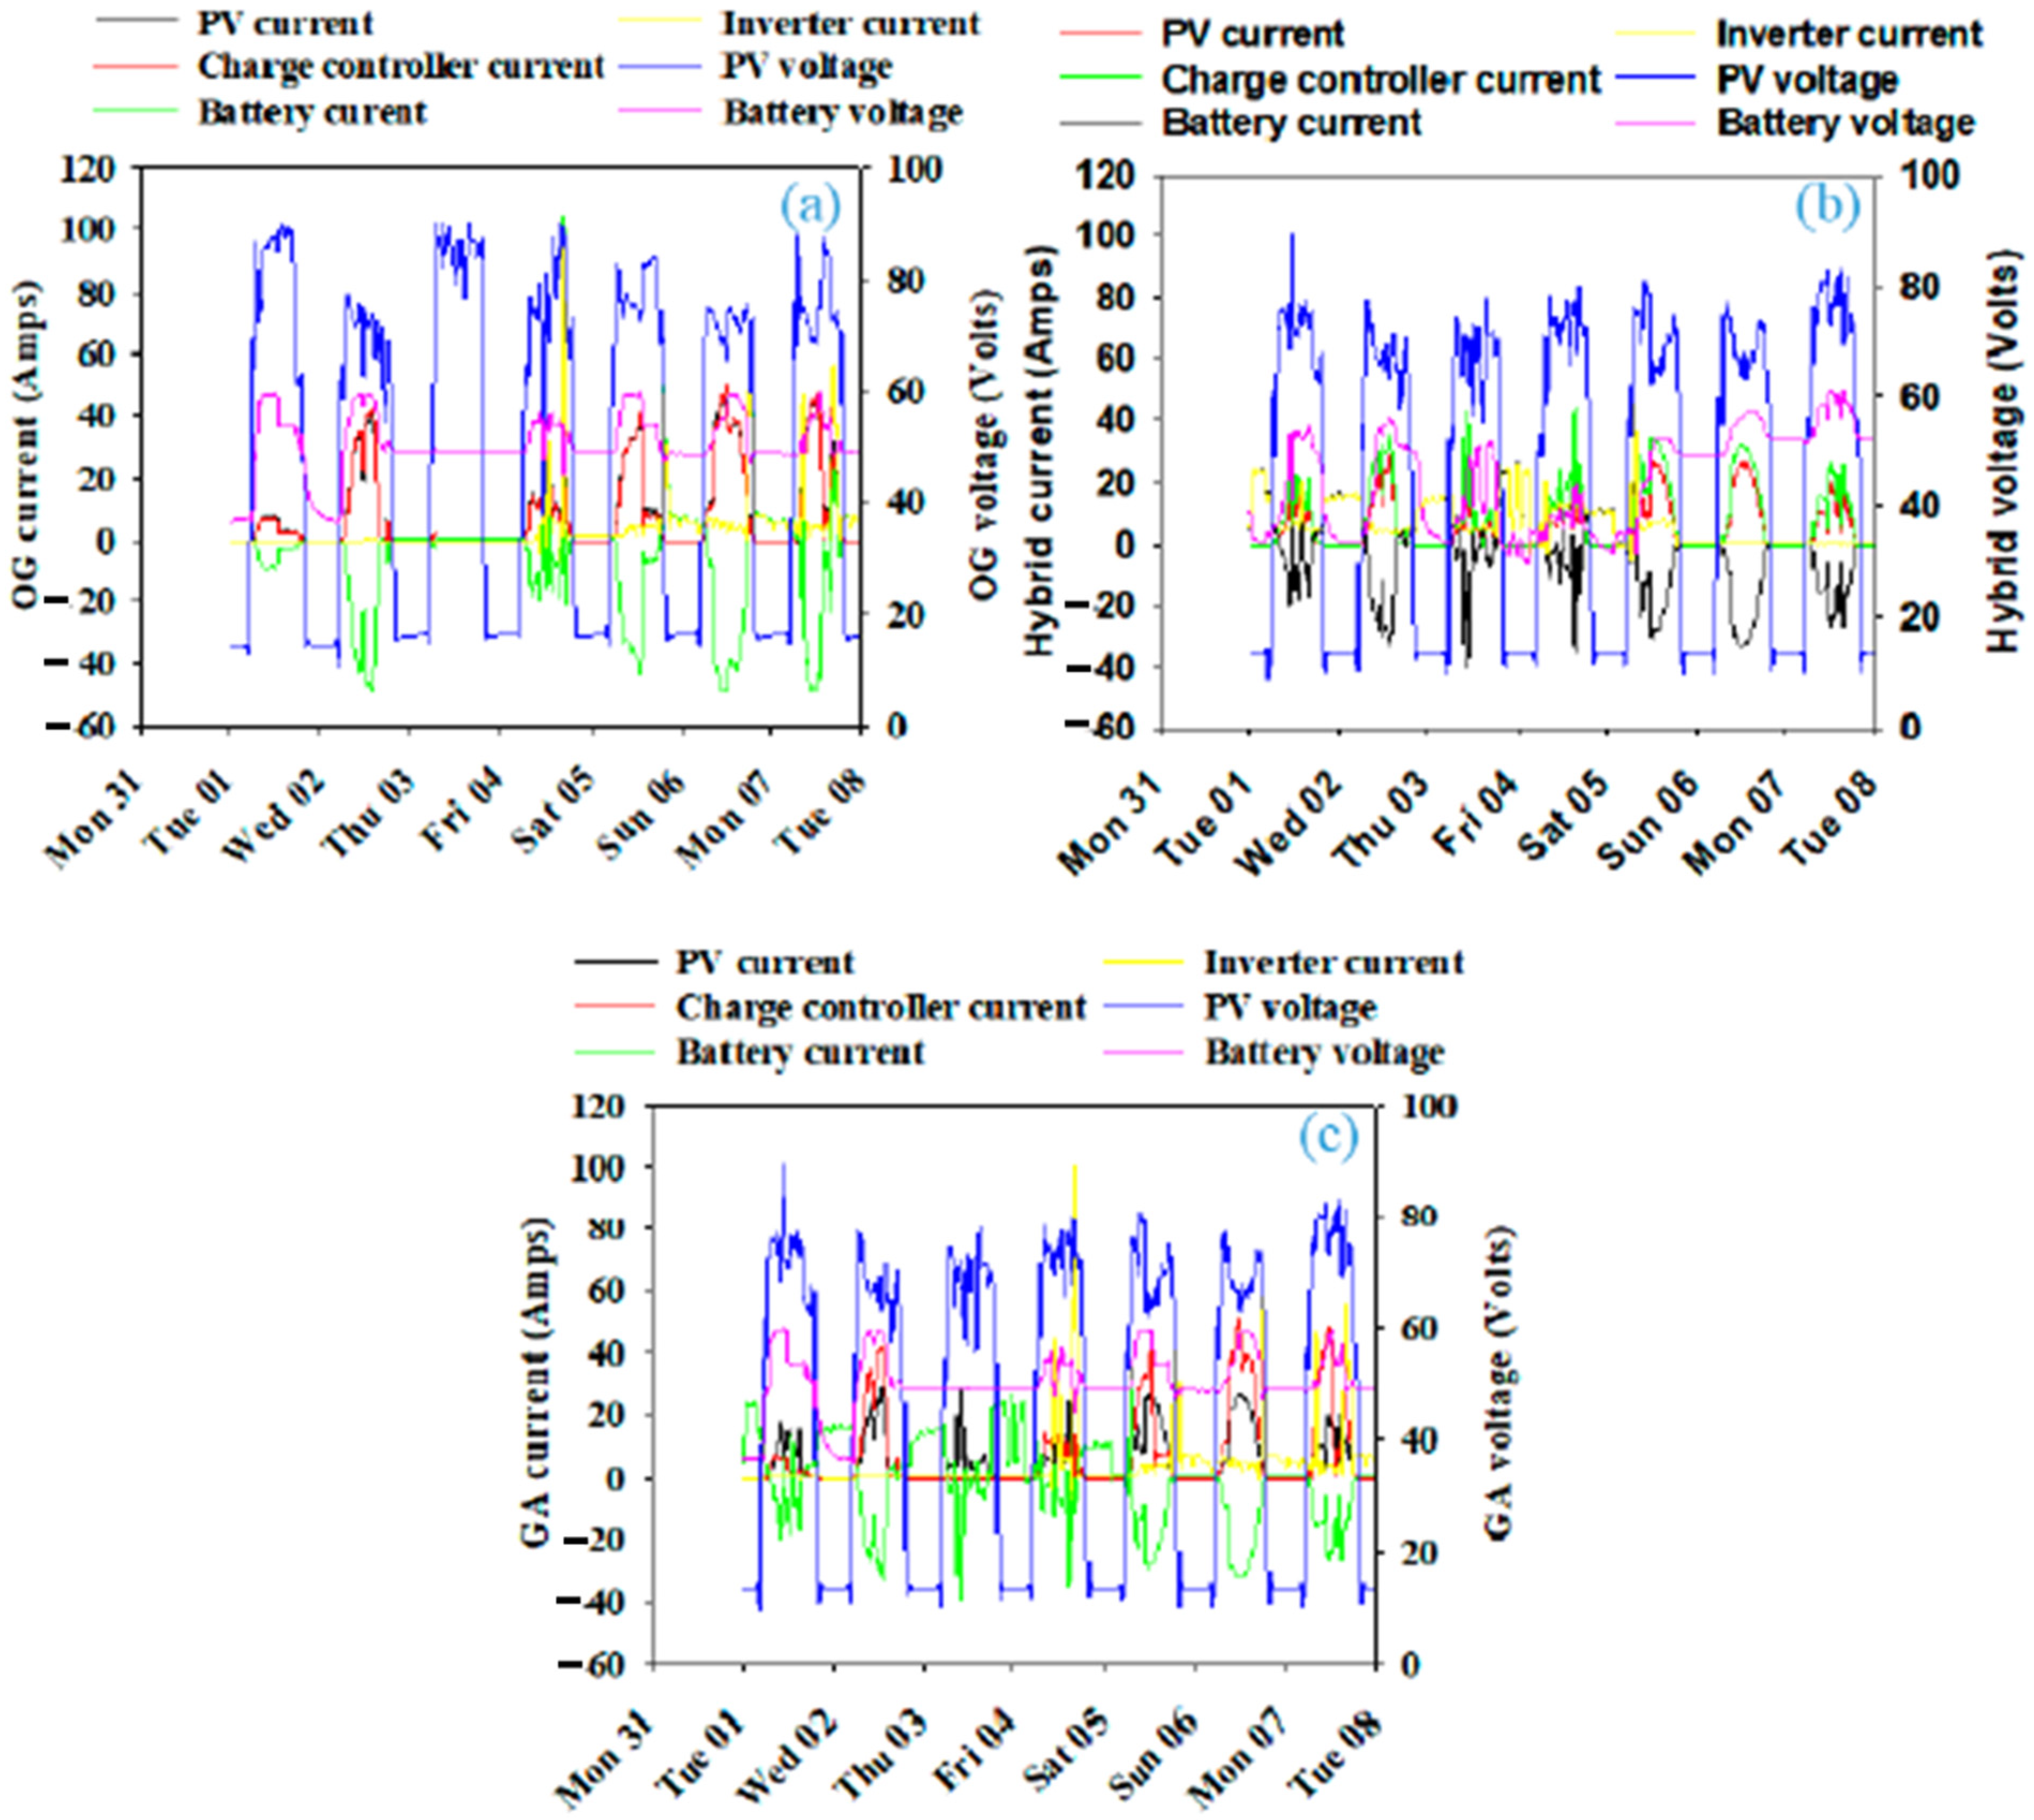
32]. The current and voltage distribution of the PV, charge controller and battery over the reporting period are presented in
Figure 14a–c.
In
Figure 14, the negative battery current depicts charging whereas load supply (discharging) was represented with a positive current. Comparison of
Figure 11 and
Figure 14 indicate that the PV voltage increases with the increase in solar irradiance in all systems. At midday which corresponds with peak module temperature, a slight dip of the systems’ voltages was also observed. Furthermore, the PV current appeared to have increased with the solar radiation but dropped by approximately half around midday. Based on the typical operation of MPPT charge controllers, the systems’ charge controllers continuously monitor the PV power level and batteries state of charge. A Boost charging mode was induced by the charge controller; having detected a low battery and available PV power at sunrise [
32]. This created a dummy load for the PV and the resulting large amount of current flow.
At midday, the charge controller sensed a fully charged battery and switches to Float or Sleep mode. At these modes, the charge controller prevents the PV with a smaller amount of load, thereby reducing the quantity of current flow. A similar phenomenon occurs in the three systems but varies according to the battery size (Ah), state of charge and connected load. The observed electrical performance of the PV systems is in line with the findings of [
34]. In summary, during this one week, the designed DAS was noticed to be consistent and was able to observe all the meteorological and electrical sensors with high precision and can resist high temperatures and severe circumstances surrounding the environment like wind and heavy rain.


