1. Introduction
Osteoporosis (OP) is a worldwide skeletal disease affecting the elderly population, with a very high incidence in post-menopausal women. OP causes the overall reduction of bone mass due to an imbalance in the remodelling process toward the resorption phase [
1]. This reduction is associated with an increased risk of bone fractures with a consequent decline of patients’ quality of life [
2].
Nowadays, worldwide, 8.9 million osteoporotic fractures occur annually, more than 1000 fractures every hour (one every 3.5 s), with a remarkable cost for society and health care systems. In the European Union (EU), an osteoporotic fracture occurs every 30 s and with the current demographic shift, the incidence is expected to double in a few decades. Although OP has been for long time considered as a women-only disease, recent data show an incidence of one out of two to three women and one out of five men above fifty years old, with a prognosis for men often being significantly worse. To date, in the EU, approximatively 22 million women and 5.5 million men aged between 50–84 years are estimated to be affected by OP [
3]. Since the total population’s age along with the life expectancy of the elderly are estimated to increase by more than two-fold over the next 25 years, osteoporotic fractures still represent an important clinical issue with a significant impact on the cost for health care systems. In fact, the economic burden of osteoporotic fractures was estimated at EUR 37 billion, distributed between incident fractures (66% of this cost), long-term fracture care (29%) and pharmacological prevention (5%). These costs are even expected to increase by 25% in 2025 [
3].
For this reason, an early OP diagnosis can represent a potent tool for the reduction of fracture occurrence and for the maintenance of a good quality of life, especially in the context of the progressive ageing of a population. To date, the gold standard technique for OP diagnosis is the bone mineral density (BMD) measurement through dual-energy X-ray absorptiometry. However, in recent years, BMD has become a less reliable predictor for bone fracture risk since fractured patients have shown a comparable value of BMD to the control ones in several studies [
4,
5]. Therefore, it is possible to hypothesise that OP is responsible for a series of bone feature modifications both at the architectural and compositional level, leading to an overall reduction of bone mechanical strength. The set of architectural and compositional features that can define the healthy or pathologic status of a bone can be gathered in the more general expression of “bone quality”. Consequently, it is possible to affirm that OP is responsible for an overall reduction of bone quality, leading to a decrease in bone strength. In recent years, numerous research studies have been dedicated to the identification of the best indicators of bone quality and, consequently, of the most accurate fracture risk predictors. In particular, significant architectural and compositional alterations have been observed between healthy and osteoporotic bones in both the trabecular and cortical compartments [
6].
In order to investigate these OP-related modifications, several imaging techniques have been adopted both at the clinical and research level. Histomorphometry has been one of the first techniques used to this aim, allowing the measurement of several bone architectural parameters through the analysis of thin histological slices extracted from a small biopsy [
7]. However, since the analyses are performed on 2D slices, the information concerning the 3D spatial distribution of bone trabeculae and their eventual modification across the entire bone cannot be assessed through this technique. Furthermore, histomorphometry is a time-consuming analysis due to the long sample preparation procedure, which requires a staining phase in order to highlight the bone structure [
8].
More recently, new imaging techniques allowing the 3D analysis of bone architecture and the assessment of its OP-related variations have been adopted, such as magnetic resonance imaging (MRI) and computed tomography (CT). MRI provides important information on bone architecture at peripheral sites of body by measuring the signal associated with the water contained in the bone marrow. However, it is characterised by a low signal-to-noise ratio, due to the relative low amount of water contained in the bone, and it is associated with high instrumental costs [
9]. On the contrary, CT systems allow for collecting information on bone architecture through the measurement of the attenuation of X-ray beams along different directions. Furthermore, comparing the X-ray attenuation coefficient of the bone sample with those of reference phantoms with a known content of inorganic phase, it is possible to evaluate the degree of bone mineralisation and its modification in the case of OP. However, bone trabecular microstructure cannot be revealed by clinical CT scans due to the insufficient spatial resolution (typically above 0.3 mm) [
10], therefore, more advanced laboratory instruments performing ex vivo measurements on small bone biopsies are needed [
11].
Over recent years, CT systems used for research purposes have experienced an evolution in terms of achievable resolution, reaching 350 nm in the most up-to-date equipment. A similar resolution can also be achieved by CT instruments equipped with a synchrotron source, thanks to the very intense and monochromatic photon flux [
9]. However, this high resolution can be achieved only by means of extended scans and, consequently, of high radiation doses, which can hinder the application of micro-CT in the clinical field.
Several works in the literature interestingly describe the most common equipment used for bone characterisation and bone strength prediction. Among them, it is worth mentioning the works of Genant and collaborators [
4,
11,
12,
13], describing the potentialities and the drawbacks of the most common instruments adopted for bone analysis both at the clinic and laboratory research level. However, in these works, the potential of the described instruments in the investigation of OP-induced variations in bone features is barely reported. To this purpose, besides a complete overview of the modifications of bone microstructure and composition due to OP occurrence, this review addresses the evolution of the most common techniques adopted for bone investigation, with a particular focus on the characteristics and potentialities of the most up-to-date CT instruments in the assessment of OP-induced variations in bone structure and material composition. A final section is dedicated to finite element method (FEM) analysis, based on bone micro-CT images, that enables the computational simulation of bone behavior under different load conditions and, consequently, represents a potential and revolutionary tool for a more precise fracture risk prediction.
2. OP-Derived Alterations of Bone Quality
For a long time, OP was associated with an overall loss of bone tissue, leading to decreased mechanical strength and consequent higher fracture risk. However, the awareness of the complex set of bone feature modifications affecting both the architectural and compositional properties and consequently reducing the overall bone quality in patients affected by OP has grown over time.
Considering that the structure of an adult bone is the result of the so-called bone remodelling process, the evident change of bone quality observed in osteoporotic patients has been ascribed to a primary alteration of the normal remodelling mechanism, where the bone resorption rate prevails over the new matrix formation with a consequent evident bone loss.
The overall result of the altered remodelling mechanism in osteoporotic bone is the modification of bone structure that involves both the trabecular and cortical tissues, significantly decreasing the bone quality. In this section, the OP-induced alterations of the bone remodelling mechanism and, consequently, the variation of the structural and compositional bone features are described.
2.1. OP-Related Variations of Bone Remodelling Mechanism
In physiological conditions, the remodelling mechanism (
Figure 1) starts with the bone resorption phase, regulated by osteoclasts (Oc). In particular, Oc precursors are activated by an increased production of receptor activator of nuclear factor-ĸΒ (RANK) ligand (RANKL) by osteocytes and osteoblasts in response to tissue microdamage or an endocrine stimulus, such as an increased parathyroid hormone concentration associated with hypocalcaemia. The newly formed RANKL binds to its receptors on Oc precursor cells, stimulating their fusion in a syncytium and, consequently, the formation of a multinucleated mature Oc [
14]. To promote the adhesion of these cells on the bone surface and the consequent implementation of their resorption action, the lining cells present at the bone surface form a raised canopy over the site to be resorbed [
1]. After the adhesion, Oc reorganise their cytoskeleton in order to create a sealed zone where the bone matrix resorption can occur. In detail, in the region facing the bone surface to be resorbed, the osteoclastic membrane forms several folds, creating the so-called ruffled border which provides an enhanced secretory region for the dissolution of the underlying bone matrix [
15]. In fact, Oc can dissolve the bone mineral phase by creating an acidic environment in the sealed zone, characterised by the coupled introduction of H
+ ions, by means of the H
+-ATPase pump and Cl
− ions, through their chloride channels, with the consequent formation of hydrochloric acid. Subsequently, the collagen-based matrix is degraded by metalloproteinases and proteases, such as cathepsin K, creating a lacuna on the bone surface. At the end of the resorption phase, Oc undergo a programmed death and the tissue present at the surface of the newly created lacuna is prepared to allow osteoblast (Ob) adhesion and the following bone formation phase [
1]. In particular, Ob synthesise and deposit the osteoid, a matrix rich in type I collagen that will be successively mineralised through a series of phosphate and calcium ion exchanges with the extracellular environment. Sometimes, during the mineralisation process, some Ob can differentiate in osteocytes and can be entrapped in the osteoid. Once the mineralisation is complete, the Ob not embedded in the osteoid can have several fates: undergo apoptosis or become bone-lining cells [
16,
17].
During the physiological remodelling process, the bone resorption rate equals the formation one, but, in the presence of OP, these two processes become unbalanced toward bone resorption, causing bone loss. The imbalance between Ob and Oc activities is the result of altered cell signalling mechanisms that derive from several factors, such as a reduced production of oestrogens in post-menopausal osteoporosis, by increased secretion of parathyroid hormone (PTH) and reactive oxygen species concentrations in age-related osteoporosis, along with excessive thinness, alcohol and corticosteroid use [
1]. In physiological conditions, oestrogens limit the production of RANKL and induce the secretion of osteoprotegerin (OPG) from Ob, a soluble decoy receptor that binds to RANKL in an antagonistic way to the RANK receptor, therefore modulating the Oc signalling downstream of RANK. On the other hand, an oestrogen deficiency is associated with an increased osteoclast differentiation and resorption activity due to the higher secretion of RANKL from Ob and with impaired mechanosensing by osteocytes [
18]. Oestrogen deficiency is the main condition leading to the onset and fast progression of osteoporosis in the trabecular compartment of women in their first 3–5 years of menopause. For this reason, the oestrogen-dependent bone loss is defined as postmenopausal osteoporosis and it can lead to a high number of fractures, especially in bones characterised by a higher trabecular fraction (e.g., vertebral bodies) [
18]. The lower incidence of fractures in age-matched men is obviously explained by the absence of this marked oestrogen reduction in men. However, after this rapid phase, a slower but longer age-related bone loss occurs, affecting both women and men and involving both the trabecular and the cortical bone compartments, as explained more in detail in the following paragraph. This age-related osteoporosis is mainly correlated to vitamin D deficiency and a consequent increased level of PTH [
19]. In fact, PTH promotes Oc activity and, consequently, bone resorption through the stimulation of RANKL expression and the reduction of OPG release by Ob [
17].
2.2. OP-Related Modifications of Bone Structure and Composition
As just introduced, the overall result of the altered remodelling process is mainly the modification of the bone structure that involves both the trabecular and the cortical tissues, consistent with the progression phase of OP. During the early stage, in fact, the trabecular bone, characterised by a high surface area, is the one most affected by the surface-dependant resorption process. With the further progression of the disease, the bone loss also involves the cortical bone, causing a reduction in the cortical thickness and an increase in its porosity [
18], as described more in detail in
Section 2.2.5.
The alteration of the tissue quality is directly responsible for the reduction of the mechanical strength of bone. Considering this strong relation, several research studies have been dedicated to the assessment of bone feature modifications due to OP, trying to find new reliable predictors of bone fracture risk. Unfortunately, the alteration of bone structure associated with OP is complex and presents peculiar features at the different sites of osteoporotic fractures (i.e., vertebra, femoral neck, distal radius). However, in this section, some of the common structural factors that can contribute to bone quality worsening and, consequently, to bone strength reduction are discussed.
2.2.1. Decrease in the Bone Volume Fraction
The reduction in the bone volume fraction (bone volume (BV)/total volume (TV)) is the principal structural alteration observed in osteoporotic bone and several researchers have reported a strong correlation between this structural parameter and the overall bone strength. In particular, Berot and collaborators [
20] found a quadratic exponential correlation factor between the bone volume fraction and the yield stress measured, through compression tests, on the trabecular structure of fractured femoral heads collected from patients after total hip replacement. Similarly, Ciarallo and co-workers [
21] reported an exponential decrease in the compressive strength and in the elastic modulus of human femoral necks dependent on the increase in the relative porosity factor, calculated as the complement of the percent bone volume (1-BV/TV%).
In turn, the modification of bone volume fraction is the overall result of several fundamental architectural changes. In fact, according to Chen and Kubo, the reduction of bone volume fraction in different osteoporotic bone sites (vertebral body, femoral neck and distal radius) can be ascribed to a reduction in the trabecular number and to an increase in trabecular separation, especially in female patients [
22]. Similarly, Barvencik and collaborators stated the existence of a correlation between the bone volume fraction value and the architectural bone features in different regions of humeral heads collected from male and female cadavers [
23]. In fact, they reported that the medial humeral region, which presented the highest BV/TV, also possessed the highest trabecular number, the highest trabecular thickness and the lowest trabecular separation.
2.2.2. Loss of Trabecular Interconnection and Increase in Anisotropy
The reduction in the trabecular number in osteoporotic patients is one of the causes of their inferior bone volume fraction and, consequently, of their reduced bone strength. In more detail, the decrease in the trabecular number can be ascribed to the loss of transversal trabeculae, causing a consequent reduction in the trabecular interconnection and an irreversible loss of bone structural integrity. As far as the reduction of bone integrity is concerned, the loss of transversal trabeculae has been reported to have a greater impact than trabecular thinning [
6]. Indeed, based on Euler’s theorem, the compressive strength of a trabecula loaded in the direction of its main axis is inversely proportional to the square power of its length. Accordingly, the loss of a transversal trabecula will double the length of the two trabeculae to which it was connected and, consequently, it will reduce their strength by a factor of four [
24].
The loss of the transversal trabeculae can also lead to an increase in the anisotropy of bone structure. In fact, Ciarelli and collaborators observed an increased degree of anisotropy in the trabecular bone of patients who experienced an osteoporotic hip fracture, as a result of the preferential loss of transversal trabeculae [
25]. Similarly, an increase in the degree of anisotropy in osteoporotic bone was also observed in a recent work by the authors, by comparing the architectural features of healthy and osteoporotic biopsies extracted from human proximal humeral heads [
26].
The mechanism underlying the loss of trabecular interconnection is still matter of debate. A potential explanation was provided by Parfitt and collaborators [
27,
28], stating that this loss can be caused by the superior rate of osteoclastic resorption in osteoporotic bone, leading initially to the perforation of the trabeculae and successively to their complete removal, as schematised in
Figure 2.
2.2.3. Variation of the Trabecular Shape
Trabecular bone is composed of numerous plate-like and rod-like trabeculae that arrange themselves according to the applied mechanical stress; their relative proportion depends on the bone site (
Figure 3). In general, plates align along the longitudinal axis of bone and sustain most of the load, while rods are disposed along the transverse plane and act as links to stabilise the structure [
29].
Chen and Kubo [
22] observed an increase in the rod-like proportion with ageing and OP due to the conversion of plate-like trabeculae into rod-like ones in several human bone sites (vertebra, femur and distal radius). Gentzsch and collaborators [
30] tried to explain this conversion mechanism by monitoring the resorption lacunae present on the trabecular compartment of various femoral heads of cadavers, concluding that the centre of trabecular plates is a preferential site for the formation of resorption lacunae. In the presence of a continuous erosion process not counterbalanced by an effective bone matrix refilling by Ob, the resorption cavities deepen and develop into plate perforations, leading to the final conversion of plates into rods. Since resorption lacunae and plate perforations represent discontinuities in the bone structure, they are preferential regions of microfracture triggering, leading to an overall reduction of bone resistance to the applied loads.
A common indicator used in bone research studies to determine the balance between rods and plates is the structure model index (SMI), exploiting the measurement of the bone surface curvature. Ideally, the SMI value is zero for a plate and three for a cylinder, therefore, the variation of bone SMI between these extremities can indicate the prevalence of one trabecular structure over another. Considering that in the osteoporotic bone a conversion of trabecular plates in rods is normally observed, superior values of SMI are usually reported compared to those registered for the healthy tissue [
31].
2.2.4. Decrease in the Trabecular Thickness and Increase in its Separation
For a long time, the reduction in the volume fraction observed in OP bone was attributed to trabecular thinning. However, in 1983, Parfitt et al. [
27] introduced the hypothesis that this volume loss was related to the removal of entire trabeculae, due to the unbalanced process of osteoclastic perforation, rather than to the variation of the trabecular thickness. Indeed, they reported that the trabecular density (number of trabeculae in a defined area) was highly reduced in old and osteoporotic iliac samples with the consequent increase in the trabecular separation, without a significant variation of the trabecular thickness. This result can be further supported by the dependence of the perforation mechanism on the trabecular thickness: thinner trabeculae can be more easily resorbed by Oc, leading to the preservation of the thicker ones.
On the contrary, Chen and Kubo observed an evident decrease in the trabecular thickness at the distal radius in old male patients, justifying the decline of trabecular bone volume [
22]. Two different mechanisms can thus coexist and the prevalence of one over the other could mostly depend on the anatomical site.
2.2.5. Cortical Bone Thinning and Increase in Its Porosity
Besides the variations in the trabecular bone tissue, OP occurrence also causes a reduction of cortical thickness due to the increased endosteal bone resorption not counterbalanced by a periosteal apposition, as shown in
Figure 4. The cortical thinning is particularly evident in females because, compared to males, the amount of deposited bone in the periosteal surface is significantly lower [
24]. With the disease progression, OP causes an increase in the cortical porosity and consequently in the cortical surface area, since the internal surface of the new pores can also be affected by the unbalanced remodelling process. The result is the acceleration of the process of cortical bone loss [
2].
In support of this assumption, Chen and Kubo [
22] observed an overall thinning and an increased porosity of the cortical compartment in different bone fracture sites. In particular, at the femoral neck and at the distal radius, a stronger alteration of the cortical features in female patients was observed, thus justifying the reduced bone strength of elderly women affected by OP.
2.2.6. Alterations in Bone Composition
Bone can be considered a composite material consisting in an organic matrix, mainly type I collagen, enriched by an inorganic phase, i.e., hydroxyapatite (HA). The organisation of these two materials in an ordered and hierarchical structure confers superior mechanical properties to bone compared to both components considered separately. In fact, thanks to the combination of the toughness of collagen with the stiffness of the mineral phase, bone shows, simultaneously, fracture resistance and load bearing ability [
32]. Besides the previously described changes in the structural features, the modification of the properties of bone components (organic and inorganic phases) can lead to an alteration of the mechanical behaviour.
In particular, OP and ageing are known to cause a decrease in the amount of collagen enzymatic crosslinking in favour of non-enzymatic crosslinking. The enzymatic crosslinks, mostly present in the healthy bone tissue in a head-to-tail fashion between the collagen fibrils, are responsible for improved mechanical properties (
Figure 5). On the contrary, the non-enzymatic crosslinks are found in any positions along the collagen fibrils and the formed bonds involve the aldehyde group of a sugar molecule (usually glucose). The latter reaction leads to the formation of advanced glycation end-products (AGEs), which accumulate in the bone tissue, causing the stiffening of the organic matrix and the alteration of Ob cellular functions through the activation of the advanced glycation end-products receptor (RAGE) present on their membrane [
2]. The RAGE activation is associated with the inhibition of Ob proliferation and differentiation and the increase in their apoptosis rate [
33]. The main consequence of the AGE accumulation is thus the decrease in collagen matrix production and, consequently, bone formation.
Furthermore, several studies have demonstrated an alteration of the collagen secondary structure in the presence of OP, leading to an increase in the random coil conformation combined with a decrease in the α-helix arrangement. The modification of collagen structure toward a less organised conformation can be considered one of the most important causes of the decrease in the mechanical properties of osteoporotic bone. In fact, while the α-helix can support larger plastic deformations thanks to its mechanism of molecular unfolding based on the reversible breaking of its hydrogen bonds, the random coil conformation has inferior mechanical resistance [
34].
In addition, as reported in the literature, the features of HA crystals are also strongly affected by the properties of the organic matrix. Therefore, alterations in the collagen conformation are expected to influence the main characteristics of the inorganic phase [
35]. This assumption has been confirmed in a recent work by the authors, who observed greater HA crystal dimensions in samples of trabecular bone derived from osteoporotic humeral heads when compared to samples of healthy tissue [
26]. Similarly, Gourion-Arsiquaud and collaborators [
36] reported that OP iliac crest biopsies extracted from low-trauma fractured patients possessed HA with larger dimensions and higher crystallinity. However, these authors ascribed this superior HA size to the increased resorption rate typical of OP, leading to the preferential resorption of smaller HA crystals due to their higher solubility.
In general, the increase in the mineral size proved to have significant consequences at the mechanical level, as larger HA crystals cannot properly align with the fibres of the collagen matrix, causing the decrease in the mechanical performances of the composite structure and, consequently, an increase in the fracture risk.
Furthermore, in relation to the surface-dependent nature of the resorption mechanisms, osteoporotic bone matrix shows an increased apparent mineralisation degree. This aspect can be explained considering the preferential resorption of the most superficial and less mineralised regions of bone trabeculae which were more recently formed during the remodelling process, and the conservation of the more mineralised trabecular core, leading to a final increase in the apparent mineralisation degree of bone [
37].
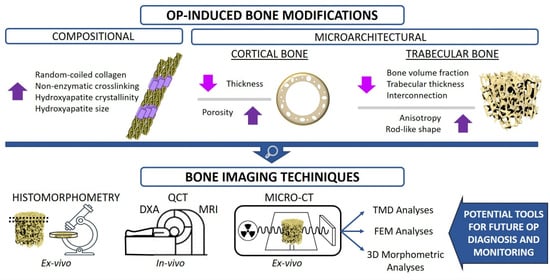
Figure 6 schematically shows the different modifications of bone tissue induced by OP that have been described in the previous sections.
3. Current Techniques for OP Study
As highlighted in the previous paragraphs, several bone features contribute to the general bone quality and can be altered with OP occurrence. Among these, bone architectural features have been widely investigated since they can be evaluated by non-invasive imaging techniques. Indeed, different instruments have been adopted over the years for the analysis of bone architecture and for the evaluation of OP-related variations, with the final aim to identify a novel reliable predictor for the assessment of bone fracture risk. In this section, the evolution from more traditional methods for bone quality investigation (Dual-energy X-ray absorptiometry and histomorphometry) to the more recent ones (magnetic resonance imaging and computed tomography) will be illustrated.
3.1. Dual-Energy X-Ray Absorptiometry
Dual-energy X-ray absorptiometry (DXA or DEXA) is an imaging technique developed in the mid-1980s and approved for bone mineral density (BMD) measurement in clinical practice by the Food and Drug Administration (FDA) in 1988. At present, it is considered the gold standard non-invasive method for OP diagnosis, for the assessment of fracture risk and for monitoring BMD changes during anti-osteoporotic drug treatment [
38]. In DXA, bone is irradiated by two X-rays with different energies in order to discriminate the contribution of two types of tissues, i.e., hydroxyapatite (representative of the bone tissue) and soft tissues. The further elaboration of the radiation transmitted by the bone sample and revealed by the detector provides a 2D greyscale image, representing a map of the BMD over the whole irradiated area. An edge detection algorithm is then used to find the bone edges. After subtracting the contribution of soft tissues, the average areal BMD (g/cm
2) is calculated by averaging the BMD values of all the pixels included in the edge contour, obtaining a measure of the apparent density of bone [
39].
3.1.1. DXA-Derived Osteoporosis Diagnosis and Fracture Risk Assessment
In 1994, the World Health Organization (WHO) chose DXA as the reference technology to measure BMD and to formulise a diagnosis of OP. OP is diagnosed if the BMD value is at least 2.5 standard deviations below the mean BMD of young adult women [
40]. Since the BMD values progressively decrease with age, the proportion of potential osteoporotic patients increases exponentially over the lifetime [
41], as visible in
Figure 7.
In 1994, the WHO also recognised the value of the areal BMD measured by DXA as a reliable parameter for the assessment of bone fracture risk [
42]. However, even if low BMD is commonly associated with lower bone strength, several studies demonstrated that factures also often occur in people reporting only a slight decrease in BMD [
41]. In fact, several other factors contribute to bone fracture risk, e.g., age, gender, body mass index, family history of fractures, use of glucocorticoids, rheumatoid arthritis, smoking or high consumption of alcohol. For this reason, different algorithms (e.g., FRAX
®, GARVAN) have been developed to combine these risk factors with the BMD assessed by DXA to more accurately calculate the individual bone fracture risk [
41,
43]. Even though these tools can provide a more complete prediction of fracture risk, they are still not used for OP screening due to their low sensitivity [
41].
3.1.2. DXA Limitations and Use of Calcaneal Quantitative Ultrasound (QUS)
Despite several assets of this technique, namely the availability, minimal radiation exposure and short scan times, some limitations are associated with the use of DXA for the assessment of BMD [
10]. In fact, the 2D nature of this imaging technique implies a lack of information about the depth of the scanned bone volume. Consequently, thinner bones will result in lower BMD due to the shorter X-ray path across the bone tissue [
44].
Moreover, since DXA does not distinguish cortical and trabecular bone contributions [
45], it cannot provide information about the morphological alterations underlying the BMD variation, causing an incorrect OP diagnosis in the case of bone density alterations deriving from other diseases (e.g., osteomalacia) [
46].
In this frame, an alternative imaging technique such as calcaneal quantitative ultrasound (QUS) can be exploited for a more specific quantification of BMD in osteoporotic patients. This technique measures the propagation of ultrasound waves at different frequencies to obtain information about the properties of bone tissue. In detail, the measured velocity (termed as speed of sound, SOS) and attenuation (termed as broadband ultrasound attenuation, BUA) are then combined to define the stiffness index (SI) or quantitative ultrasound index (QUI). In addition, due to the high accessibility and the percentage of trabecular bone, calcaneus represents the most selected skeletal site for QUS analysis [
47,
48].
The main advantages of QUS lie in the lower costs and the radiation-free assessment of bone quality, compared to DXA analysis. However, the lack of consensus of diagnostic criteria, such as the use of devices, variables and cut-offs, significantly limits the ability of QUS to replace DXA as potential pre-screening tool for osteoporosis [
48,
49].
3.2. Bone Histomorphometry
Bone histomorphometry is a histological investigation technique, developed in the late 1950s, providing quantitative information on bone microarchitecture as well as on bone remodelling and metabolism. It is used in clinics for the diagnosis of bone-related diseases and to monitor the effect of new drugs on bone [
50,
51]. The analysis is performed on a cylinder of bone (5–8 mm in diameter) harvested from the iliac crest of the patient. The biopsy is then fixed, embedded in methyl methacrylate and cut into thin 5–10 µm slices. A final staining step allows a clear identification of the bone structural components and cells under a light microscope [
8]. The bone section images are acquired through a camera and analysed manually or automatically, with specific software to perform quantitative analyses on structural and remodelling parameters. These parameters were classified for the first time by Parfitt et al. in 1987, following the request of the American Society for Bone and Mineral Research, in order to develop a unified system of terminology [
52].
The dynamic analysis of bone remodelling can also be carried out through the administration, several days before the bone biopsy, of a labelling agent (i.e., tetracycline) able to bind to hydroxyapatite at the sites of new bone formation [
8,
51]. Thanks to this procedure, histomorphometry enables the collection of information about the bone turnover through a single analysis of a bone sample. This result cannot be obtained with any of the other imaging techniques on ex vivo bone samples.
Even if bone histomorphometry remains the current gold standard for the study of bone microstructure, metabolism and remodelling, it presents some disadvantages. Firstly, it is an invasive technique with associated potential complications, such as pain and infection risk in the harvesting area. Moreover, sample processing and analysis are extremely time consuming and require a high level of specialisation [
8].
Even though histomorphometry can identify high turnover and low bone volume in osteoporotic patients [
8], as visible in
Figure 8, OP-induced alterations of the bone structure organisation are less detectable, considering that the analysis is performed on 2D samples. Information about the 3D organisation of bone can be extrapolated through the application of stereological algorithms that allows the estimation of the third dimension by interference. These formulae, however, require several assumptions hardly satisfied in bone (for example, isotropy) [
53].
Considering the limitations of this analysis, other imaging techniques have been considered to better investigate the 3D bone microstructure as well as for the diagnosis of OP, i.e., magnetic resonance and computed tomography.
3.3. Magnetic Resonance Imaging Techniques
Magnetic resonance imaging (MRI) is a non-ionising technique that provides indirect information on the 3D organisation of bone by measuring the signal coming from the hydrogen atoms contained in the water and the fat compartments of the bone marrow. Thanks to the application of a magnetic field in combination with a radio frequency (RF), the hydrogen atoms can be excited and upon the removal of the RF radiation, the hydrogen atoms relax and emit an RF signal which is detected by RF coils [
10]. These RF impulses provide information on the location and the microenvironment of hydrogen atoms [
12]. Consequently, information on bone structure can be obtained indirectly by the MRI signal after an image post-processing phase, as visible in
Figure 9.
However, the low amount of water contained in the bone and the presence of the surrounding tissues causes a low signal-to-noise ratio (SNR) in MR images. For this reason, MRI is usually employed at peripheral sites (e.g., distal radius, distal tibia and calcaneus) [
10,
12]. Furthermore, the SNR is negatively influenced by the voxel size, consequently limiting the analysis resolution to around several hundreds of micrometres [
54].
One of the potential strategies exploited to improve the SNR and thus the analysis outcomes involves the reduction of the RF detector size. For this reason, high-resolution MR imaging has been developed by using clinical MR scanners combined with specially designed coiled detectors. With this technique, it is possible to work with in-plane resolutions up to 110 µm that allow for resolving the bone trabecular structure and assessing its main architectural features (thickness, separation, number, anisotropy and connectivity degree) [
55]. However, since the resolution is close to the trabecular dimension, partial volume effects can occur (for a more detailed explanation of partial volume effects, see
Section 4.1.1) [
54].
Another new magnetic-based technique, still at the experimental stage, is solid-state MRI. By the use of custom-made coils, it detects the resonant signal of phosphorous atoms present in the mineral phase of bone, in order to determine the bone tissue mineral density. This method has shown promising results in the assessment of bone density in animal models, but presents some limitations for clinical use, due to the long imaging times (around 1 h) and strong magnetic field applied (at least 4.7 T) [
10]. In particular, longer acquisition times increase the probability of involuntary motions in vivo, leading to artefacts and image corruption [
54].
In general, MRI techniques require expensive equipment and a complicated post-processing phase, reducing their availability as routine OP diagnosis tools in clinical applications.
3.4. Computed Tomographic Imaging Techniques
Computed tomographic (CT) imaging techniques allow for assessing the 3D bone organisation by irradiating the bone with an X-ray beam along different directions and by detecting the transmitted radiation. Since the attenuation of the X-ray beam depends on the density of the material crossed, the intensity profile of the revealed radiation contains the compositional information of the bone structure along the analysed direction. Thanks to specific reconstruction algorithms, the radiation profiles along the several directions are integrated in order to generate greyscale images of the bone structure, whose grey shades depend on the bone composition. Successively, these images are elaborated to perform morphometric and densitometric analyses on the scanned bone sample.
At present, there is a large difference between the performance shown by CT instruments used on patients in clinic, and those of laboratory CTs used to analyse the 3D organisation of bone structure of ex vivo samples or small animals. Clinical CTs are in fact characterised by low resolutions, around a few hundred µm, while laboratory CTs can reach resolutions of less than 1 µm. The superior resolution of CTs designed for research purposes is related to their more up-to-date sources and detectors, as well as longer scanning durations, that cannot be performed on patients due to the high radiation doses involved. As described in the following section, in recent years, clinical CTs have experienced technological enhancements with the aim to improve the achievable resolution, even though their application is still limited to research clinical centres.
3.4.1. Quantitative Computed Tomography (QCT) and High-Resolution Peripheral QCT (HRpQCT)
Quantitative computed tomography (QCT) is a non-invasive CT technique used in clinics to assess the 3D bone geometry. In QCT, both the X-ray source and the detector rotate synchronously around the patient. By incorporating a mineral standard in the scan, as visible in
Figure 10, the volumetric BMD, expressed in g/cm
3, can be additionally calculated [
55]. Many studies have shown a correlation between BMD calculated through QCT (expressed in Hounsfield units) and the BMD obtained through DXA, making QCT a potential and alternative tool for osteoporosis screening [
56,
57]. However, a general consensus on the superiority of this technique compared to DXA in the prediction of bone fracture risk has not been reached yet [
10].
QCT can distinguish trabecular and cortical contributions, even though its in-plane low resolution (around 500 µm) does not allow the characterisation of the trabecular microarchitecture [
10,
55]. For this reason, QCT is mainly adopted in clinics for the measurement of the cortical volume and of BMD in the spine and the hip [
55].
To overcome the drawbacks associated with the low resolution obtained with conventional QCT, high-resolution peripheral computed tomography (HRpQCT) has been developed. This non-invasive technique can reach a maximum resolution of 50 µm, thus allowing the measurement of cancellous bone morphology, even though partial volume effects can still arise [
55]. However, HRpQCT has been exclusively adopted for the analysis of peripheral bones (e.g., hand, distal radius and distal tibia) and the actual working resolution depends on the dimensions of the analysed area. Although its application is currently limited to academic medical centres, this technique has shown promising results for the evaluation of the OP-related modification of trabecular and cortical bone architecture in vivo [
10]. For this reason, a technological improvement, and a reduction in the cost of HRpQCT equipment, could increase its availability in clinical centres, paving the way for promising applications in OP detection in patients.
3.4.2. Micro- and Nano-CT
Micro-CT is the most powerful instrument for bone feature assessment at the laboratory scale, enabling the achievement of high isotropic resolutions of up to 1 µm. Thanks to these high resolutions, micro-CT equipment can distinguish between cortical and trabecular bone in a very reliable way. However, these high-resolution analyses are performed exclusively on sedated small animals or on ex vivo bone biopsies since the scanning of whole bone would require extremely long durations and high radiation exposures, not applicable to patients [
12]. Furthermore, the long scan durations of micro-CT analyses would lead to a higher risk of patient movement and consequently to the generation of image artefacts. Considering the same limitations in terms of scan duration and radiation exposure, nano-CT instruments, able to reach resolutions of up to 350 nm, are only employed in the research field for ex vivo analyses of bone biopsies [
9]. It is worth mentioning that the nano-CT scanners actually work between the nano- and the microscale: the pixel size used for the scan, in fact, depends on the sample size. However, in the presence of a sample with reduced dimensions and optimal characteristics, the nano-CT instrument can work at a resolution of less than 1 µm, thus justifying the prefix nano-.
Synchrotron radiation is an alternative radiation source used in CT equipment at the laboratory scale. Thanks to its monochromatic nature, it allows for avoiding the appearance of several image artefacts deriving from the multi-chromatic nature of X-ray radiation employed in common CT scanners. The resolutions achievable with this type of source are significantly lower than 1 µm [
9]. However, the extremely high cost and complexity of synchrotron technology limits its availability to a few specialised research centres [
58].
These up-to-date CT instruments are employed at the research level for the analysis of OP-related modifications of cortical and trabecular features and of their composition. As will be described in
Section 4.3, this architectural and compositional information can be exploited for the creation of finite element models for the investigation of the mechanical behaviour of bones and for their fracture prediction. In fact, the high resolution achievable with micro- and nano-CT instruments allows for the reproduction of singular trabecula, improving the accuracy of the model and, consequently, of the fracture prediction [
4]. Moreover, micro-CT images can also be employed for the accurate replication of bone structure through rapid prototyping techniques to fabricate advanced bone scaffolds. To this aim, the bone surface is approximated through a series of triangles and the coordinates of their vertices are reported in an .stl format file. Subsequently, this file should be converted into a G-code containing the instructions required by the additive manufacturing machine to fabricate the bone replica layer-by-layer.
In
Table 1 are the principal characteristics of the imaging techniques for bone feature analysis considered in this review, highlighting their advantages and limitations.
4. Micro-CT Bone Structure Analysis in OP-Related Studies
As previously introduced, micro-CT instruments are mainly used for the assessment of bone architectural features of human biopsies or of small animals. The investigation of bone architecture is possible thanks to the differential X-ray absorption of bone compared to the soft tissues and the bone marrow, leading to the generation of images with different shades of grey.
In more detail, the X-ray radiation transmitted by the sample is revealed by a scintillator detector that converts it into visible light with an intensity proportional to the radiation energy. Successively, the light signal is revealed by a photodetector generating a 2D greyscale digital image, called a shadow image. Each pixel of the shadow image contains the information of the sample adsorption in that point along the considered irradiating direction [
59]. The 2D shadow images collected along the different directions are successively combined according to appropriate mathematical algorithms in order to reconstruct the 3D volume of the scanned bone sample. In particular, the adsorption information contained in the different shadow images is integrated and combined in order to generate a series of 2D grey-shaded images representing the transversal sections of the analysed sample [
60]. Usually, the reconstructed images have a bitmap format of 8 or 16 bits, allowing the conversion of the X-ray absorption level of the sample into 256 or 65,536 shades of grey, respectively. Thanks to this conversion, the “raw” adsorption information of the sample is bypassed, and the eventual post-elaboration operations are performed referring to the image grey levels and, consequently, allowing a faster and more reproducible image processing. Obviously, the 16-bit format allows for distinguishing finer variations of the X-ray absorption thanks to the higher number of grey shades available, but it leads to heavier files requiring more powerful instruments for their elaboration.
A schematic representation of the conversion of the X-ray absorption information into the sample transversal sections performed during a micro-CT analysis is shown in
Figure 11.
The greyscale-reconstructed images can be used for several applications, such as the digital 3D rendering of the bone sample analysed, the execution of 3D morphometric analyses to investigate bone structure organisation, the measurement of bone mineral density or the implementation of finite element method (FEM) models for the computational simulation of bone response when subjected to different loads. The various applications of micro-CT images will be described in more detail in the following sections, focusing on their benefits in the investigation of OP tissues.
4.1. 3D Morphometric Analyses
The execution of morphometric analyses is the most important tool provided by the micro-CT technique, exploitable in the investigation of OP onset and evolution. In fact, the study of the bone organisation in 3D allows for easily evaluating the OP-related alterations of bone features (described in
Section 2.2. Furthermore, micro-CT morphometric analyses can be exploited to monitor the effect of anti-osteoporotic drug therapies on the bone structure or to identify the most suitable site to position orthopaedic implants in osteoporotic patients in order to reduce the need for an implant revision [
61,
62,
63,
64,
65]. Unfortunately, all these investigations have been performed exclusively on small animals or bone biopsies harvested from patients or cadavers, due to the radiation safety constraints in clinical applications. Until now, HRpQCT represents the most up-to-date CT instrument applied on patients for the in vivo detection of OP evolution and the monitoring of anti-osteoporotic drug therapies.
From a technical point of view, in order to perform a morphometric analysis on bone architecture, the image segmentation, or rather the conversion of the greyscale-reconstructed images in black and white, is always required to univocally distinguish the bone from both soft tissues and background. It can be concluded that the choice of the correct segmentation threshold plays a key role in the definition of bone edges and, consequently, in the calculation of bone parameters, as will be described in detail in
Section 4.1.2. For the same reason, the acquisition resolution and the voxel size are important parameters to determine the quality of the morphometric results: in fact, a low resolution can lead to a mismatch between the segmented structures and the real bone features due to the partial volume effect.
The morphometric analyses are usually performed on specific portions of bone image databases through the selection of three-dimensional volumes of interest (VOIs). In particular, the trabecular and the cortical compartments are usually investigated in a separate way in order to allow the calculation of different morphometric parameters. Bouxein and collaborators have reported a complete list of these parameters for both the trabecular and the cortical compartments with their relative descriptions [
66]. In particular, bone volume fraction, trabecular thickness, trabecular separation and trabecular number are the most investigated parameters during the analysis of trabecular tissue, while cortical bone area, thickness and porosity are the most investigated ones for the cortical compartment.
Bouxein and collaborators also provided useful indications for the identification of the most suitable VOI characteristics for bone feature analysis in mice, but since human bones have different anatomical characteristics, these guidelines should be applied with care in human bone analyses. According to the authors’ knowledge, an accurate method for the analysis of human bone has not been published yet. A general rule to perform reliable comparisons among morphometric analyses on different samples is to select a VOI with the same height and adopt a repeatable method to select the bone area from the background. To this aim, the manual selection of the VOI is discouraged since remarkable differences can arise due to the irregular shape of most of the bone sections. On the contrary, the use of an automatic method, based on an automated selection of bone edges, can lead to more repeatable results.
4.1.1. Influence of Acquisition Resolution and Voxel Size
Clinical CT usually works at resolutions around several hundreds of micrometres, in order to have acceptable scanning durations and radiation exposure for the patient, but this hinders the assessment of the trabecular feature modifications deriving from OP [
9]. For this reason, micro- and nano-CT have been adopted in bone characterisation with the aim to obtain a more reliable assessment of trabecular architectural parameters thanks to their higher resolutions. According to the literature, in fact, the image resolution and consequently the voxel size play a key role in the correct quantification of trabecular feature values. Tjong and collaborators compared the results of trabecular morphometric analyses performed on cadaveric radii through micro-CT using a voxel size of 18 µm, with those obtained through HR-pQCT working at 41, 82 and 123 µm [
67]. With bigger voxel sizes, a reduction in the trabecular thickness and separation as well as in the bone volume fraction was observed due to the partial volume effect. According to this effect, when the trabecular edge is encompassed in a voxel, the grey intensity of the resulting voxel is generated by averaging the adsorption contribution of the trabecula and that of the pore. Consequently, during the following segmentation phase, the voxel can be attributed to the background, leading to a thinning of the trabecula and even to the loss of the thinner structures. Therefore, it is evident that the partial volume effect can strongly hinder the accurate evaluation of the differences in the morphometric parameters between healthy and osteoporotic bone, particularly considering the variation in the trabecular thickness and in the trabecular interconnectivity.
However, the partial volume effect and the consequent drawbacks can be reduced using smaller voxel sizes. As visible in
Figure 12, Christiansen and collaborators observed that the use of a 6 µm voxel size led to a more reliable measure of connectivity density in murine vertebral bones compared to greater voxel sizes (10, 15, 20, 30 µm), thanks to the preservation of the thinner trabeculae responsible for the interconnection of the bone structure [
68]. In general, the partial volume effect can be considered negligible when the voxel size is inferior to one-tenth of the mean dimension of the structure of interest [
69]. Therefore, in the case of human trabecular bone, which has a mean thickness of 100–200 µm depending to the anatomical site and the presence of OP [
26,
70], the maximum voxel size allowing a correct evaluation of trabecular features is in the range of 10–20 µm.
To increase the resolution of the reconstructed images in the case of low-resolution scans, Van Aarle and collaborators proposed the “discrete algebraic reconstruction technique”. This alternative iterative reconstruction technique allows for enhancing the reconstructed image resolution by imposing compositional assumptions on the material constituting the sample scanned. In particular, the grey level of bone and other materials present in the bone biopsy (e.g., air and bone marrow) are defined
a priori. However, due to the strong assumptions considered and the high computational costs, the best approach to perform reliable morphometric analyses is to scan the sample at the highest resolution available [
71].
4.1.2. Influence of the Segmentation Technique
The operation of the segmentation, essential to distinguish univocally the bone structure from the background, can be another source of error in the assessment of bone parameters, and consequently in the evaluation of eventual differences between healthy and osteoporotic bone. In fact, the choice of an incorrect segmentation threshold can lead to an erroneous definition of bone edges and, consequently, to an unreliable measurement of the trabecular thickness, the trabecular separation and the bone volume fraction.
In the experimental studies present in the literature, a wide range of methods for image segmentation has been reported. In general, the user-dependent choice of the segmentation threshold, by comparing the segmented images to the original greyscale ones, leads to the introduction of the biggest error in the calculation of bone parameters, especially at very low resolutions [
68]. A second widely applied method is the choice of the threshold from the X-ray adsorption histogram: the segmentation threshold is identified as the transition grey level between the intensity peak ascribable to the background and the intensity peak of the bone, as visible in
Figure 13. According to Palacio-Mancheno and collaborators, this method can also lead to an incorrect evaluation of bone parameters [
69]. Therefore, the use of an automatic threshold method is preferred [
72]. Among the different available algorithms, Otsu’s method remains the most used for bone morphometric analyses. Otsu’s method works well with bimodal greyscale distribution, as bone-reconstructed images are characterised by one peak generated by the background and another one by the bone. The two peaks are modelled as two Gaussian distributions or classes, possessing a mean and a variance value. Otsu’s threshold is represented by the grey value that minimises the weighted intra-class variance. The mathematical formulae at the base of Otsu’s method are not reported in this review, but can be found in detail in the work of Otsu [
73].
4.2. Bone and Tissue Mineral Density Measurement
According to Lambert–Beer’s law (
), the X-ray attenuation by an object (
Ix/
I0) is dependent on its thickness
x and on its linear attenuation coefficient
µ, which in turn depends on the source energy and the material constituting the sample [
74]. Therefore, the greyscale level of every voxel assigned during the reconstruction phase is strictly related to the material composition and, consequently, to its density. According to this, information about the sample density can be obtained from the micro-CT analysis by comparing its X-ray attenuation to those measured from two calibration phantoms with a known density. In order to have a reliable attenuation comparison, the phantoms should have dimensions similar to that of the sample analysed and should undergo the same scanning and reconstruction processes. In this way, the X-ray attenuation will depend exclusively on the sample density and not on the other parameters of the Lambert–Beer law (i.e., object thickness and source energy). Considering that the X-ray attenuation phenomenon in the bone tissue is mainly dominated by the inorganic phase, to obtain information about the sample density, phantoms of known hydroxyapatite concentration are commonly used.
In the past, BMD constituted the principal value used to estimate the bone failure risk. In micro-CT analyses, BMD represents the grey level of the entire volume of the sample, including porosity and soft tissue contributions, in addition to the bone tissue one. Therefore, BMD represents an indicator of apparent bone density. For a long time, the BMD value was used as a predictor for bone strength at the macroscopic level. However, due to its strong dependence on the volume and porosity of the sample analysed, the measure of BMD as a bone density marker presents some limitations. In fact, an inferior BMD can be the result of a decrease in real bone density (depending exclusively on bone material properties) as well as of an increase in the bone porosity fraction. Therefore, the contribution of the compositional variations of bone tissue in the BMD value cannot be distinguished from the architectural ones. In addition, the numerical value of BMD is strongly dependent on the instrument used and on the experimental conditions adopted and cannot be compared between different studies.
In recent years, thanks to the development of the up-to-date experimental CT scanners working at very high resolutions, tissue mineral density (TMD) has been introduced as a better indicator of bone density due to the exclusion of the porosity and soft tissue contributions. It is worth mentioning that the TMD value provides an indication of real bone density, expressed in mg of hydroxyapatite per cm
3. However, TMD cannot be directly compared with the material bone density obtained through the more traditional gravimetric methods (e.g., through the application of Archimedes’ principle) [
75]. Wagner and collaborators formulated an equation in order to obtain the real tissue density starting from the TMD value calculated through micro-CT measurements [
76]. However, to formulate this equation, they assumed that the bone tissue is constituted by three phases (i.e., water, organic and inorganic) and that the organic volume ratio is always equal to 36%. Since this value can change among patients and among bones of the same individual, the equation formulated by Wagner and collaborators presents some limitations and should be applied with caution.
In general, TMD is useful to make comparisons between the real density of healthy and osteoporotic bone samples subjected to the same scanning and calibration procedures, as reported by the authors of a recent work [
26].
Furthermore, the nanoscopic causes at the base of TMD variations, such as alterations of the bone inorganic and organic phase properties detected by other characterisation techniques (e.g., X-ray diffraction, Raman or Fourier transform infrared spectroscopy) [
55], need to be investigated for a more complete comprehension of OP-induced variations of bone tissue.
4.3. Finite Element Method Analyses
The finite element method (FEM) is a computational method usually applied in tissue engineering studies for the analysis of the mechanical behaviour of a tissue in a non-destructive way. In the bone field, the FEM is mainly used for the prediction of bone failure or bone damage in the case of an external load application. To this aim, the micro-CT-reconstructed bone should be modelled through a mesh constituted by a series of defined geometrical elements (e.g., triangles, tetrahedrons or hexahedrons) whose reference points represent the nodes of the mesh. The mechanical parameter of interest (e.g., the Young’s modulus or the ultimate stress) is calculated at each mesh node through a mathematical function exploiting the variation of a known measured parameter (e.g., the material density). The application of an external load is simulated by imposing defined boundary conditions on the model. All the mathematical functions of the nodes are then combined and should converge in order to obtain the overall bone behaviour [
10]. Furthermore, FEM analyses can also provide the stress distribution on the bone structure which can be visually represented by means of colour maps, as visible in
Figure 14.
It is evident that the total number of elements of the FE can be considered a key parameter to obtain precise FE models, better approximating the bone behaviour. The most common procedure foresees the conversion of each image voxel in an FE. Therefore, thanks to the very high voxel resolution of micro-CT-derived images, very precise FEM models containing a high number of elements can be obtained, allowing the modelling of bone behaviour even at the microscopic scale. For this reason, the FEM analyses based on micro-CT images are defined as micro-FEM [
4,
74].
Micro-FEM analyses can represent a useful future tool to predict bone fractures in osteoporotic patients, where the fracture occurs at atypical loads due to the altered bone microstructure, as described in the first part of this review. In the literature, several micro-FEM analyses were reported for ex vivo biopsies or rat bones to model the trabecular behaviour after load applications, by considering the density value derived from the micro-CT as the key parameter of node equations [
20,
78,
79]. Furthermore, in order to verify the reliability of the models, the real mechanical behaviour of the bone was experimentally tested by applying the same loading conditions of FEM analyses. The FEM models and the experimental tests showed a good correlation, thus confirming the reliability of the FEM simulation results.
On the other hand, in the work of Liu and collaborators, the orientation of trabecular rods has been identified as the main parameter used to predict bone failure through FEM analyses, calculated by means of the individual trabecula segmentation technique on vertebral biopsies from donors [
29]. Thanks to their model, they confirmed that the reduction in the number of transversal rods, usually associated with OP, is responsible for the most remarkable decrease in the mechanical properties of vertebral trabecular bone.
The importance of the FEM analysis in the assessment and prediction of bone features and injuries has been widely supported and reported in several studies that thoroughly describe the investigation of bone biomechanics, starting from micro-CT as well as magnetic resonance images [
80,
81].
Despite the high potentiality of FEM analyses in bone fracture prediction, their use in the clinical field is still distant due to the long computational times and the high cost of machines able to run these simulations, as well as to the lack of pre-clinical FEM studies confirming the reliability and the accuracy of FEM results in patients.
For a more detailed description of the technique and its application in the assessment of bone tissue pathologies, the authors kindly invite readers to refer to the several reviews present in the literature [
82,
83,
84].
5. Conclusions and Future Perspectives
For decades, the value of the areal BMD measured through DXA was considered the gold standard for OP diagnosis and for fracture risk prediction. However, since several studies have also reported the occurrence of osteoporotic fractures in patients with normal BMD values, the need to identify a more reliable method for the diagnosis of OP has progressively grown.
In addition, the increasing awareness about the more complex set of alterations of bone quality caused by OP requires further investigation, complementary to the standard BMD assessment.
The studies performed in recent decades, in fact, confirmed that the BMD modification due to OP is the result of a complex alteration of bone structure and composition. Focusing on the trabecular compartment, the more pronounced osteoporotic bone resorption is responsible for a reduction in the mean trabecular thickness and for the conversion of trabecular plates into rods. If the osteoporotic resorption is particularly dominant, it can lead to the complete removal of trabeculae, especially of the transversal ones, resulting in a reduction of the overall trabecular interconnection. At the cortical level, instead, OP is responsible for a decrease in the cortical thickness combined with an increase in the overall tissue porosity. Besides the structural modifications, the material components of bones, i.e., collagen and hydroxyapatite, are also altered in the case of OP. AGEs derived from an increment in the non-enzymatic collagen crosslinking accumulate in the matrix, leading to its stiffening. At the same time, hydroxyapatite crystals become bigger and more crystalline, probably due to the preferential resorption of the less mineralised and more soluble inorganic phase. The alteration of both the structure and the composition of osteoporotic bone tissue can thus be considered the cause of its decreased mechanical performances and its superior fracture risk.
To address all the different alteration mechanisms and to provide a more accurate investigation of the bone tissue, new imaging technologies have been adopted. In particular, CT instruments have been applied both at the clinical and research-oriented level thanks to their ability to investigate the bone structure in 3D conditions as well as to measure its apparent density. In recent years, these instruments have experienced several technological advancements which allowed higher resolutions, up to a few micrometres, allowing an advanced assessment of bone trabecular features. However, higher resolutions can be achieved only by adopting longer scanning times and higher radiation doses, thus hindering their applicability for patients. Furthermore, the post-elaboration of the obtained high-resolution images requires a significant computational cost and a high user specialisation that make this instrument less attractive for clinical use.
Considering the promising results obtained in micro-CT experimental studies, for the identification of OP-induced bone alterations through morphometric analyses, as well as for the creation of FEM models simulating the bone fracture, the application of these instruments in clinics would lead to significant improvements in OP diagnosis and monitoring. In particular, the application of FEM analyses on patients could allow a faster and more accurate assessment of fracture risk, thus avoiding the reduction of quality of life usually associated with a fractured patient. However, a further improvement of micro-CT technology is necessary to reduce the scanning duration and, consequently, the exposition dose. In addition, this technology should have a more affordable cost in order to guarantee its accessibility for clinical centres. Furthermore, the development of standardised CT acquisition and image elaboration protocols would be a fundamental step to guarantee reproducible and reliable results and, consequently, to allow the future application of these advanced analysis tools for OP diagnosis in patients.


 ,
, 


