1. Introduction
Systematic nondestructive inspection of safety-critical structural components of power plants, bridges, pipelines, vehicles, etc., is essential in various industrial sectors. Many techniques exist for this purpose: among them, magnetic measurements are most frequently and successfully applied in electromagnetic non-destructive evaluation [
1,
2,
3]. Usually, magnetic methods are technically simple and not expensive. They can be applied via electrical cables and coils. One of them, magneto-acoustic emission, can be used for monitoring of residual stresses [
4]. Different versions of magnetic hysteresis measurements [
5] are also useful in Non-Destructive Testing (NDT). In novel versions of magnetic hysteresis techniques, it is not the major magnetic hysteresis loop that is measured, as that is very difficult or even impossible in some situations, but rather the series of minor magnetization loops are recorded [
6]. A recently developed version of the minor magnetization loop technique is the so-called magnetic adaptive testing (MAT) [
7]. The advantages (large sensitivity, good reproducibility) of this method have been proven in the past [
8]. Another well-known and frequently used magnetic method is the Barkhausen noise (MBN) technique, which is a useful technique for investigation of defects in the surface layer, microstructure changes, and residual stresses [
9,
10,
11,
12,
13]. The principle behind Barkhausen noise is when a continuously changing electro-magnetic field (
H) is applied to a material, a response of magnetization (
M) in the form of discontinuous changes in magnetization occurs due to when the domain walls encounter pinning sites. Such pinning sites are in the form of dislocations, precipitates in the matrix, grain boundaries, or small volumes of second-phase material. During the electro-magnetic hysteresis cycle, such pinning sites prevent the movement of the domain walls within the material, which is the premise behind Barkhausen noise phenomena [
14].
Although these methods can be successfully used in NDT, there exists a serious drawback in magnetic measurements: the influence of the surface condition on the measured quantities. Usually, samples to be measured are magnetized by a magnetizing yoke, attached directly to the surface. If the surface is not sufficiently smooth, the air gap between magnetizing yoke and sample surface results in undermining the magnetic coupling between the yoke and the investigated specimen: a part of the magnetic flux, pumped into the sample is dissipated to the surrounding space. If the quality of sample surface is the same for all the measured samples, there is less concern for the comparative methods, because the relevant modification of magnetic parameters can still be determined in a reliable way. However, if the surface condition varies among the measured samples to be compared, the uncertainty of measurements increases considerably.
By applying a non-magnetic spacer, this problem can be managed, as shown in [
15]. In other work [
16], the influence of surface roughness was measured on a series of samples having the same magnetic properties. By using MAT measurement, direct influence of surface roughness on the measured magnetic permeability was studied. A well-measurable, direct quantitative correlation was found between surface roughness and the recorded magnetic parameters.
The goal of the presented work was to be able to identify the differences in surface quality based on the recorded electro-magneto response. To address the uncertainty of measurements, and specifically conditions encountered in service, it was noticed that the surface quality of the material has a considerable influence on the extracted sensor response. In order to mitigate these effects, a design of experiments should be used to study the sensor response differences based on different material surface quality (the same base material will remain constant throughout the tests).
Within the present work, (i) the results of the MAT measurement on the same sample series having different surface roughness were analyzed, (ii) the results of MBN measurement performed on the same series of samples were considered and (iii) the MAT results were compared with the MBN measurements.
2. Samples and Experimental Details
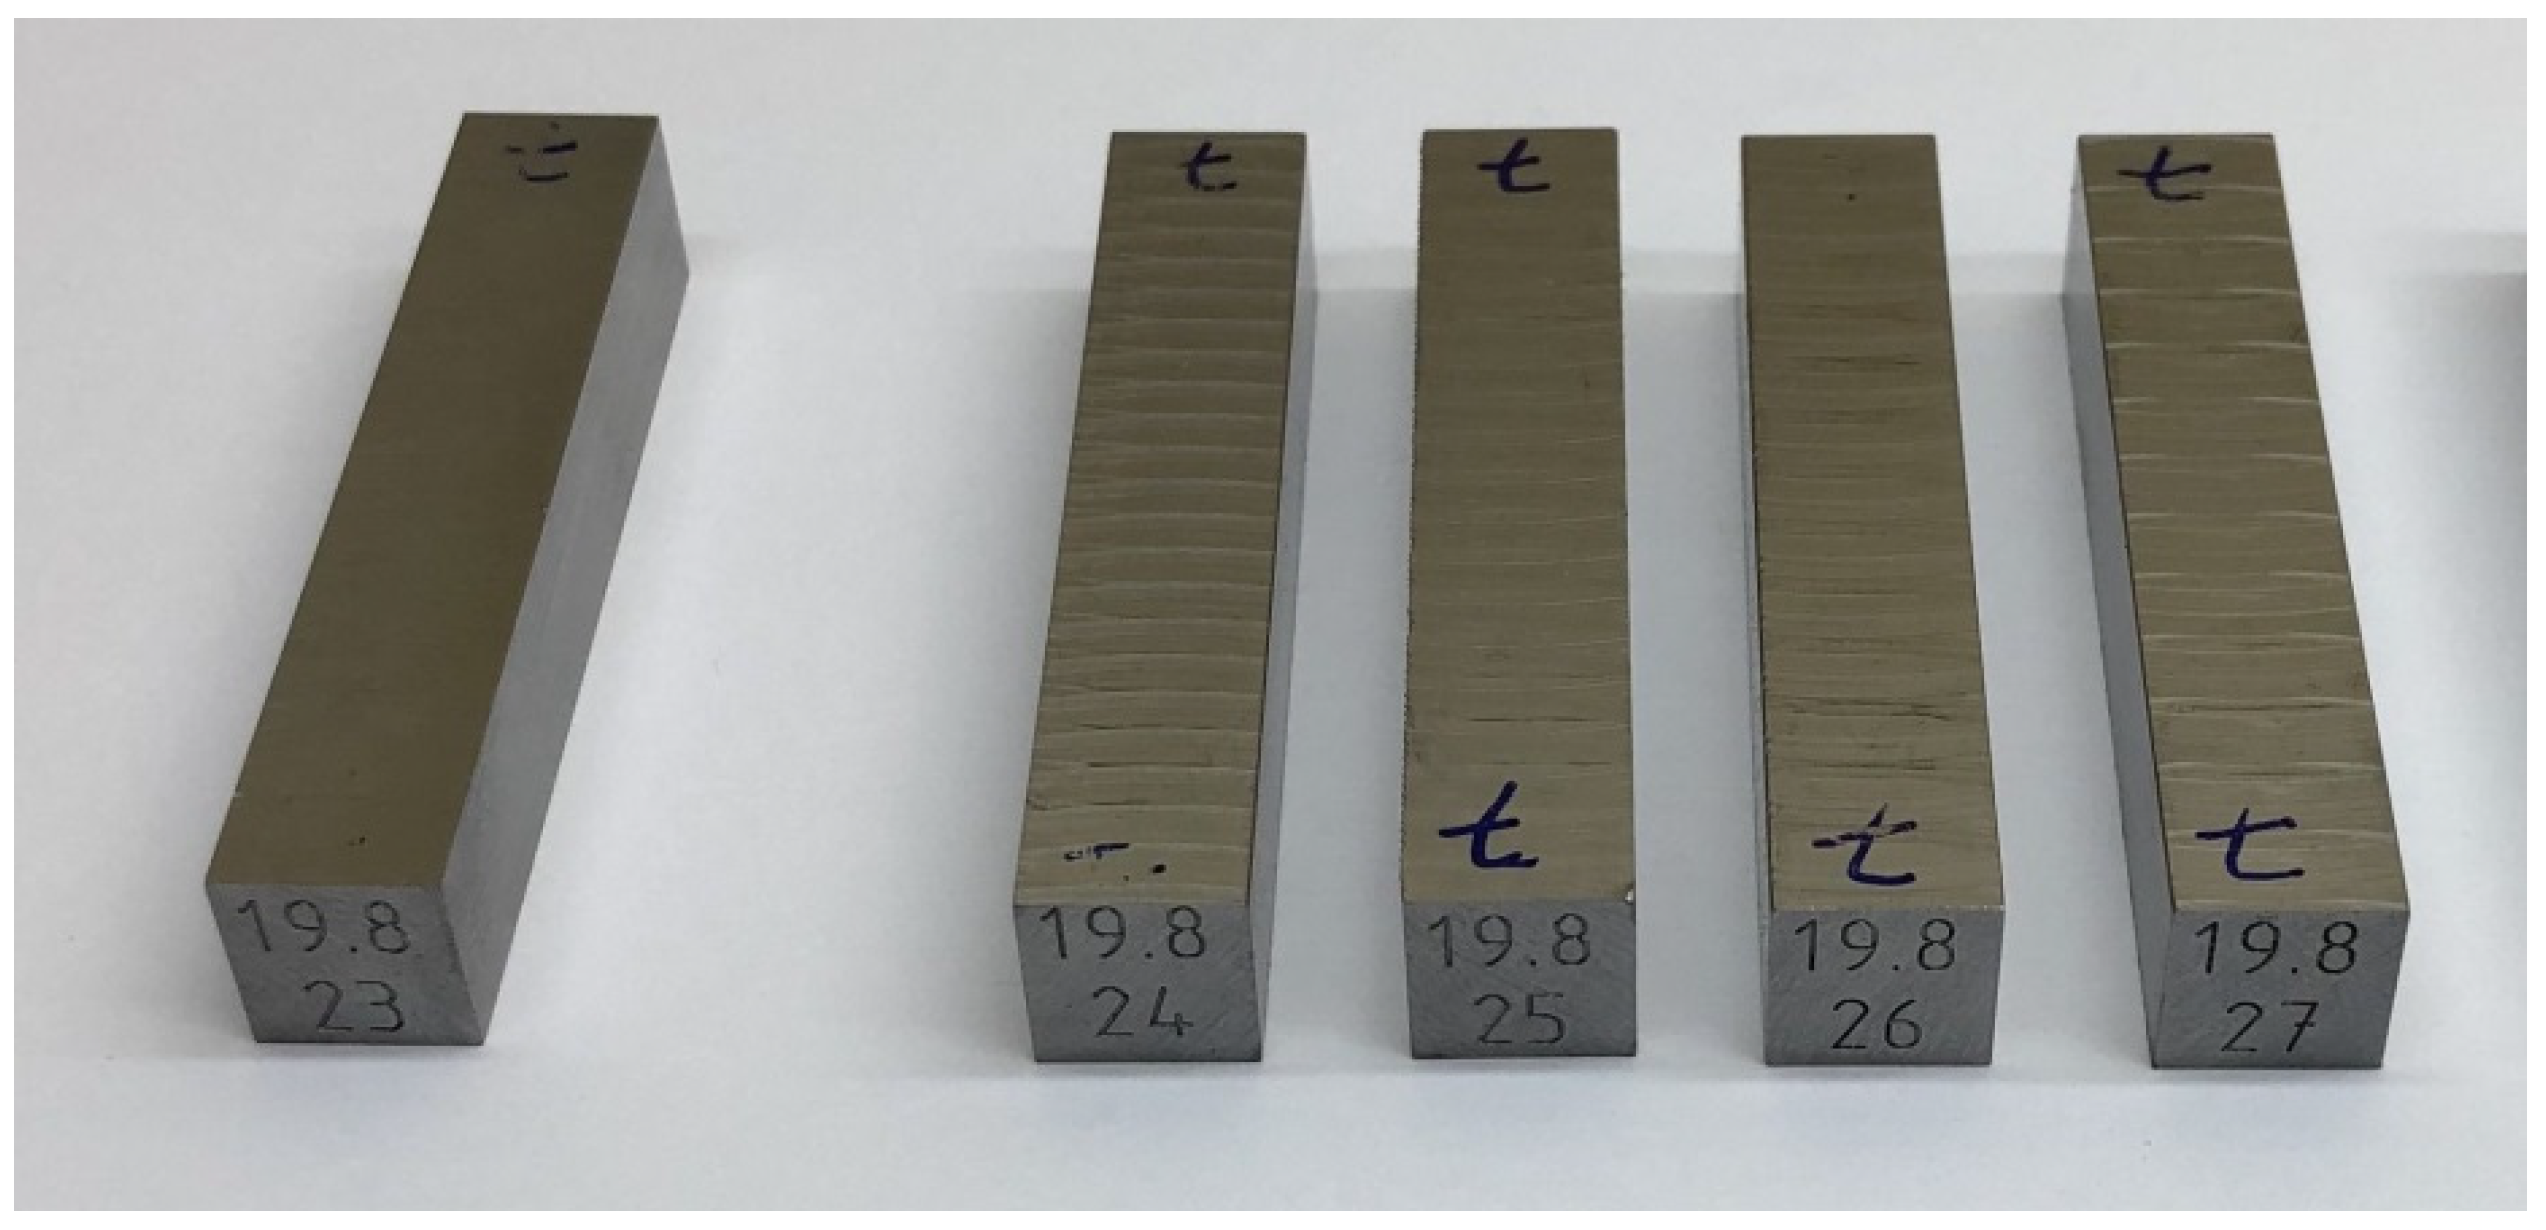
Five samples were fabricated from 22NiMoCr37 nuclear reactor pressure vessel steel material. Specimens have the standard Charpy sample dimensions (10 × 10 × 55 mm
3). Different surface roughnesses were produced by applying various manufacturing parameters such as the primary (spindle RPM) and secondary (feed rate) machine cutting forces. The obtained surface roughness was characterized where specimens had an L-T orientation. Longitudinal direction is parallel to the length of the sample. The investigated samples are shown in
Figure 1. Manufacturing parameters and surface roughness parameters of the measured samples are shown in
Table 1. A reference sample (stamped 23, on the left side of
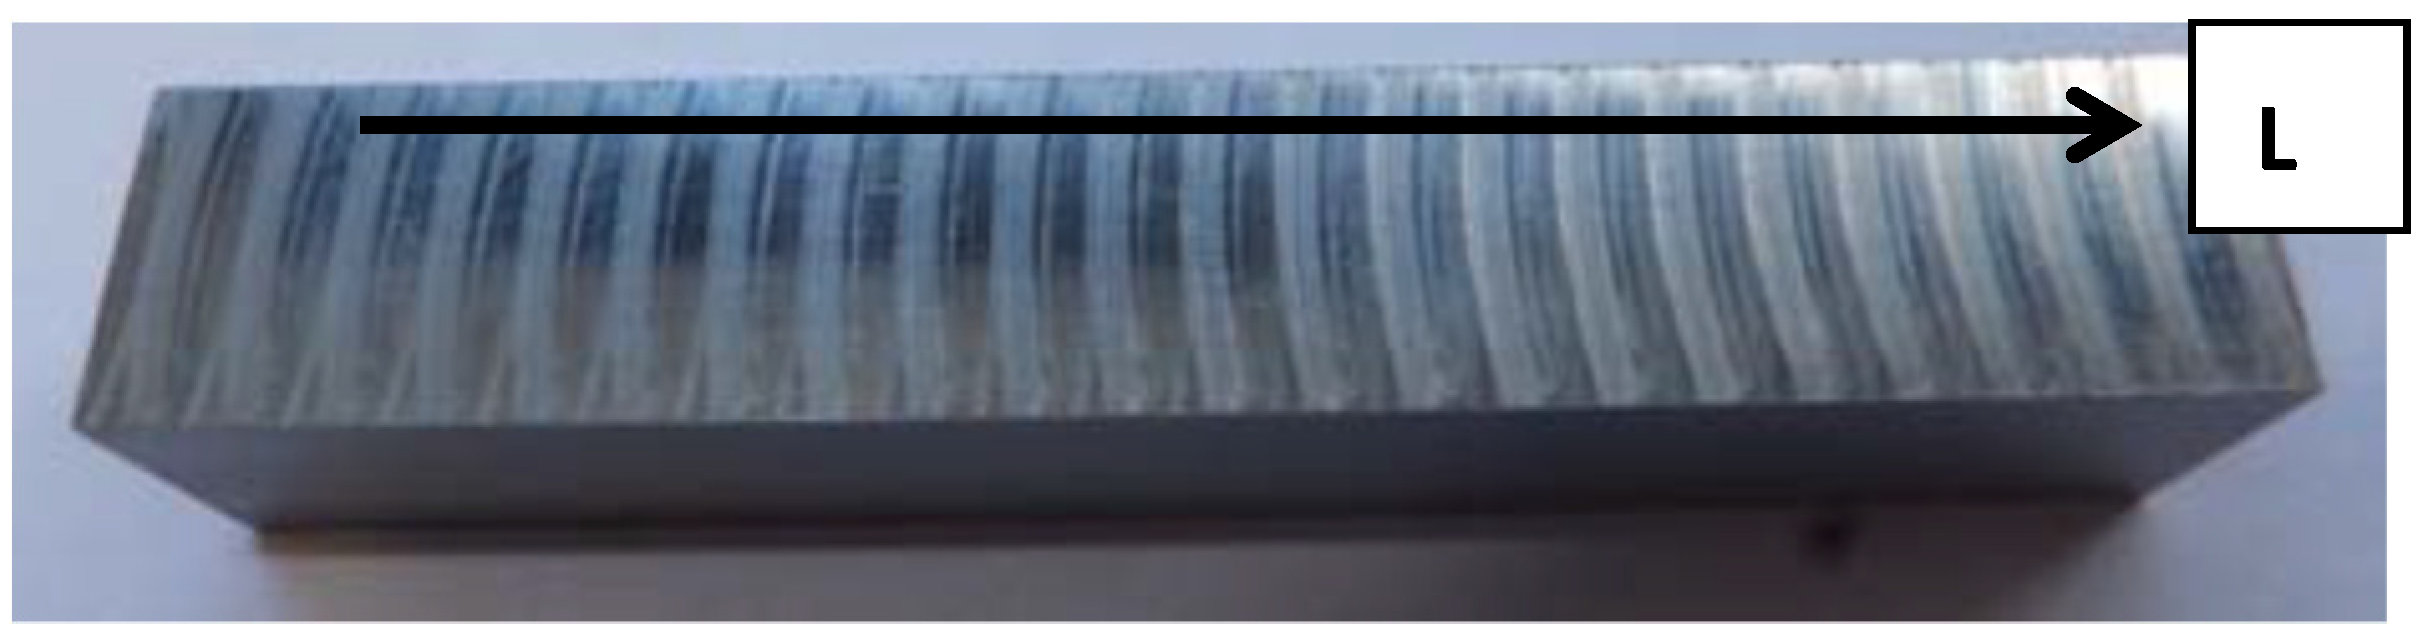
Figure 1) represents the surface manufacturing condition for normal inspection parameters of RPV (in the field conditions) steels. For the samples labelled 24–27, the surface roughness is different. The surface condition can be seen in better detail in
Figure 2 (plan view).
Surface roughness was characterized by an Accretech Handysurf Tokyo Seimistsu E-35B device. Evaluation length was 4 mm, cut-off value was 0.8 mm, and an automatic measuring range was used. The surface roughness parameter
Ra is the arithmetical mean deviation for sampling length
L:
Grooves were manufactured (with the identical settings for the given sample) on both top and bottom sides of samples, and magnetic measurements were also performed on both sides. The results of magnetic measurements were identical for these two sides for all samples. Due to this, we will deal only with the top side measurements. For checking the possible influence of mechanical treatment, measurements were performed also on the two opposite, not mechanically treated sides, as well.
2.1. Magnetic Adaptive Testing
The samples shown in
Figure 1 were measured by MAT method. For the measurement, a magnetizing yoke was put on the surface of the sample. The size of the yoke was chosen to fit the size of samples: cross-section 10 mm × 5 mm, total outside length 18 mm. A triangular waveform of magnetizing current, led into the 100 turns of the magnetizing coil, wounded on the bow of the yoke was applied with step-wise increasing amplitudes and with a fixed slope magnitude in all the triangles. Such a way a triangular time-variation of the effective field,
ha(
t), is produced in the magnetizing circuit and a signal is generated in the pick-up coil.
ha(
t) sweeps linearly with time,
t, and the voltage signal
U(
ha,
hbj), in the pick-up coil is proportional to the differential permeability, μ(
ha,
hb), of the magnetic circuit.
Output signal was measured by a 50-turn pick-up coil, wounded around a yoke leg. A specially designed permeameter [
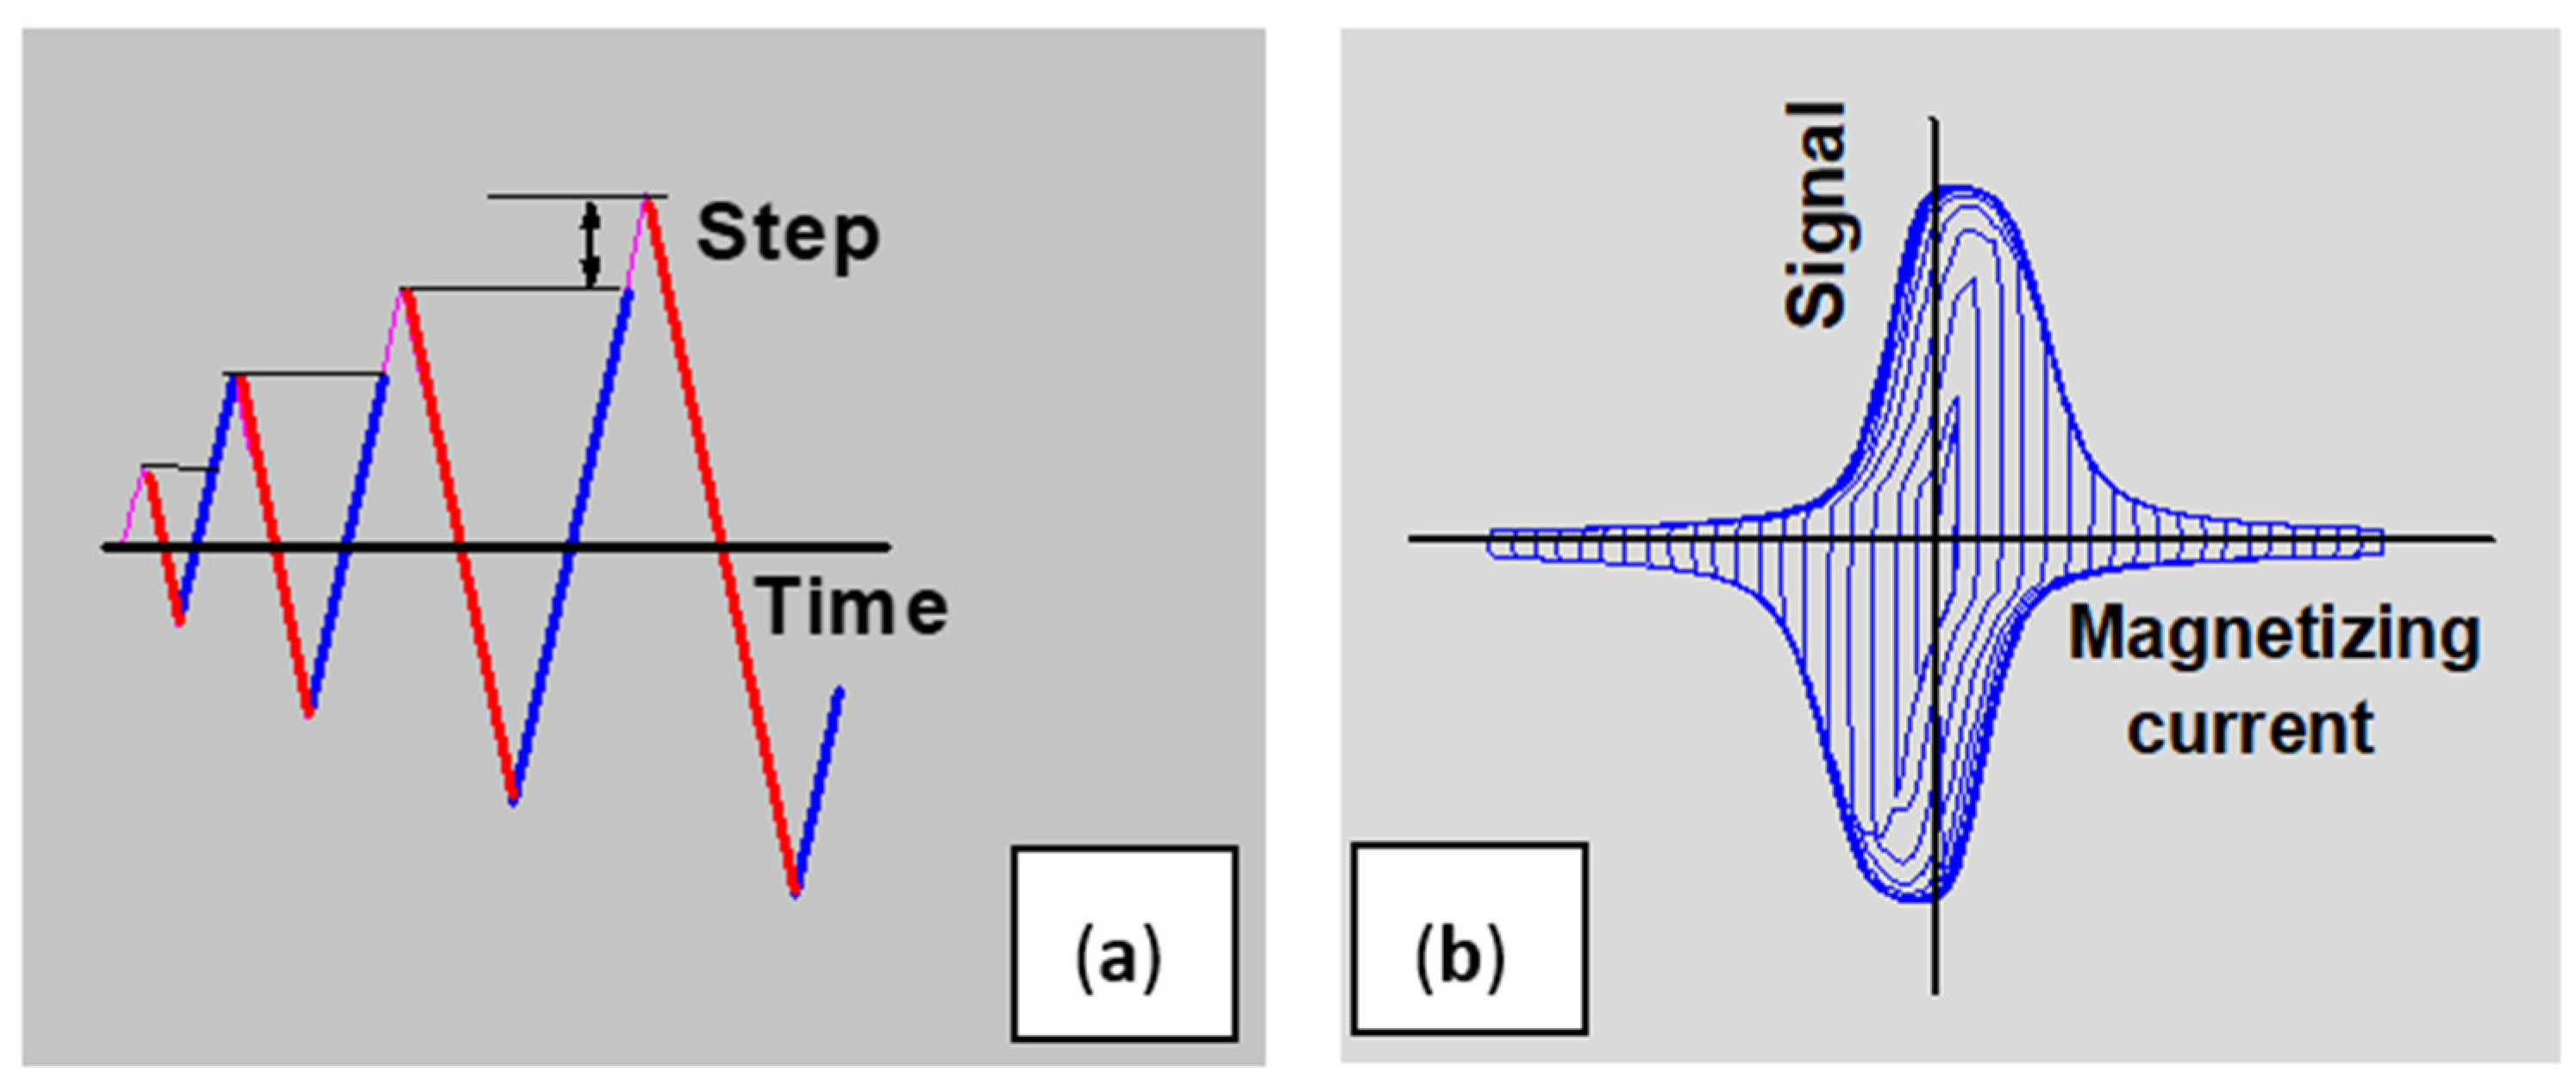
17] was used during measurement. Therefore, the obtained triangular like waveform is composed by two linear sessions having the same slew-rate but with opposite signs, considering the whole cycle of the reverse-magnetization. In addition, the final (i.e., peak) level of the reached current in each half-period increased by fixed step, where the direction of magnetization is reversed, in order to be able to record concentric minor magnetization loops. These two things in combination result in the triangular like waveform can be seen in left side of
Figure 3. Therefore, instead of describing the frequency spectrum of the exciting signal, the “speed” of magnetization can characterize the difference between the two triangular like waveforms are used for the comparison in this paper.
The output signal of pick-up coil is proportional to the differential permeability of the whole magnetic circuit if the magnetizing current increases linearly with time. Recorded permeability loops can also be seen in the right side of
Figure 3. MAT measurements were repeated by two different slopes of magnetizing current.
Permeability matrices were calculated from the minor hysteresis loops, and each matrix element was normalized by the corresponding element of the reference sample 23. In this way, a large data pool can be obtained. The optimally chosen permeability matrix elements, which characterize the best the changes in material properties due to different material degradation, were selected by correlation analysis. Details of the whole magnetic adaptive testing evaluation process is described in detail in [
8].
2.2. Barkhausen Noise Measurement
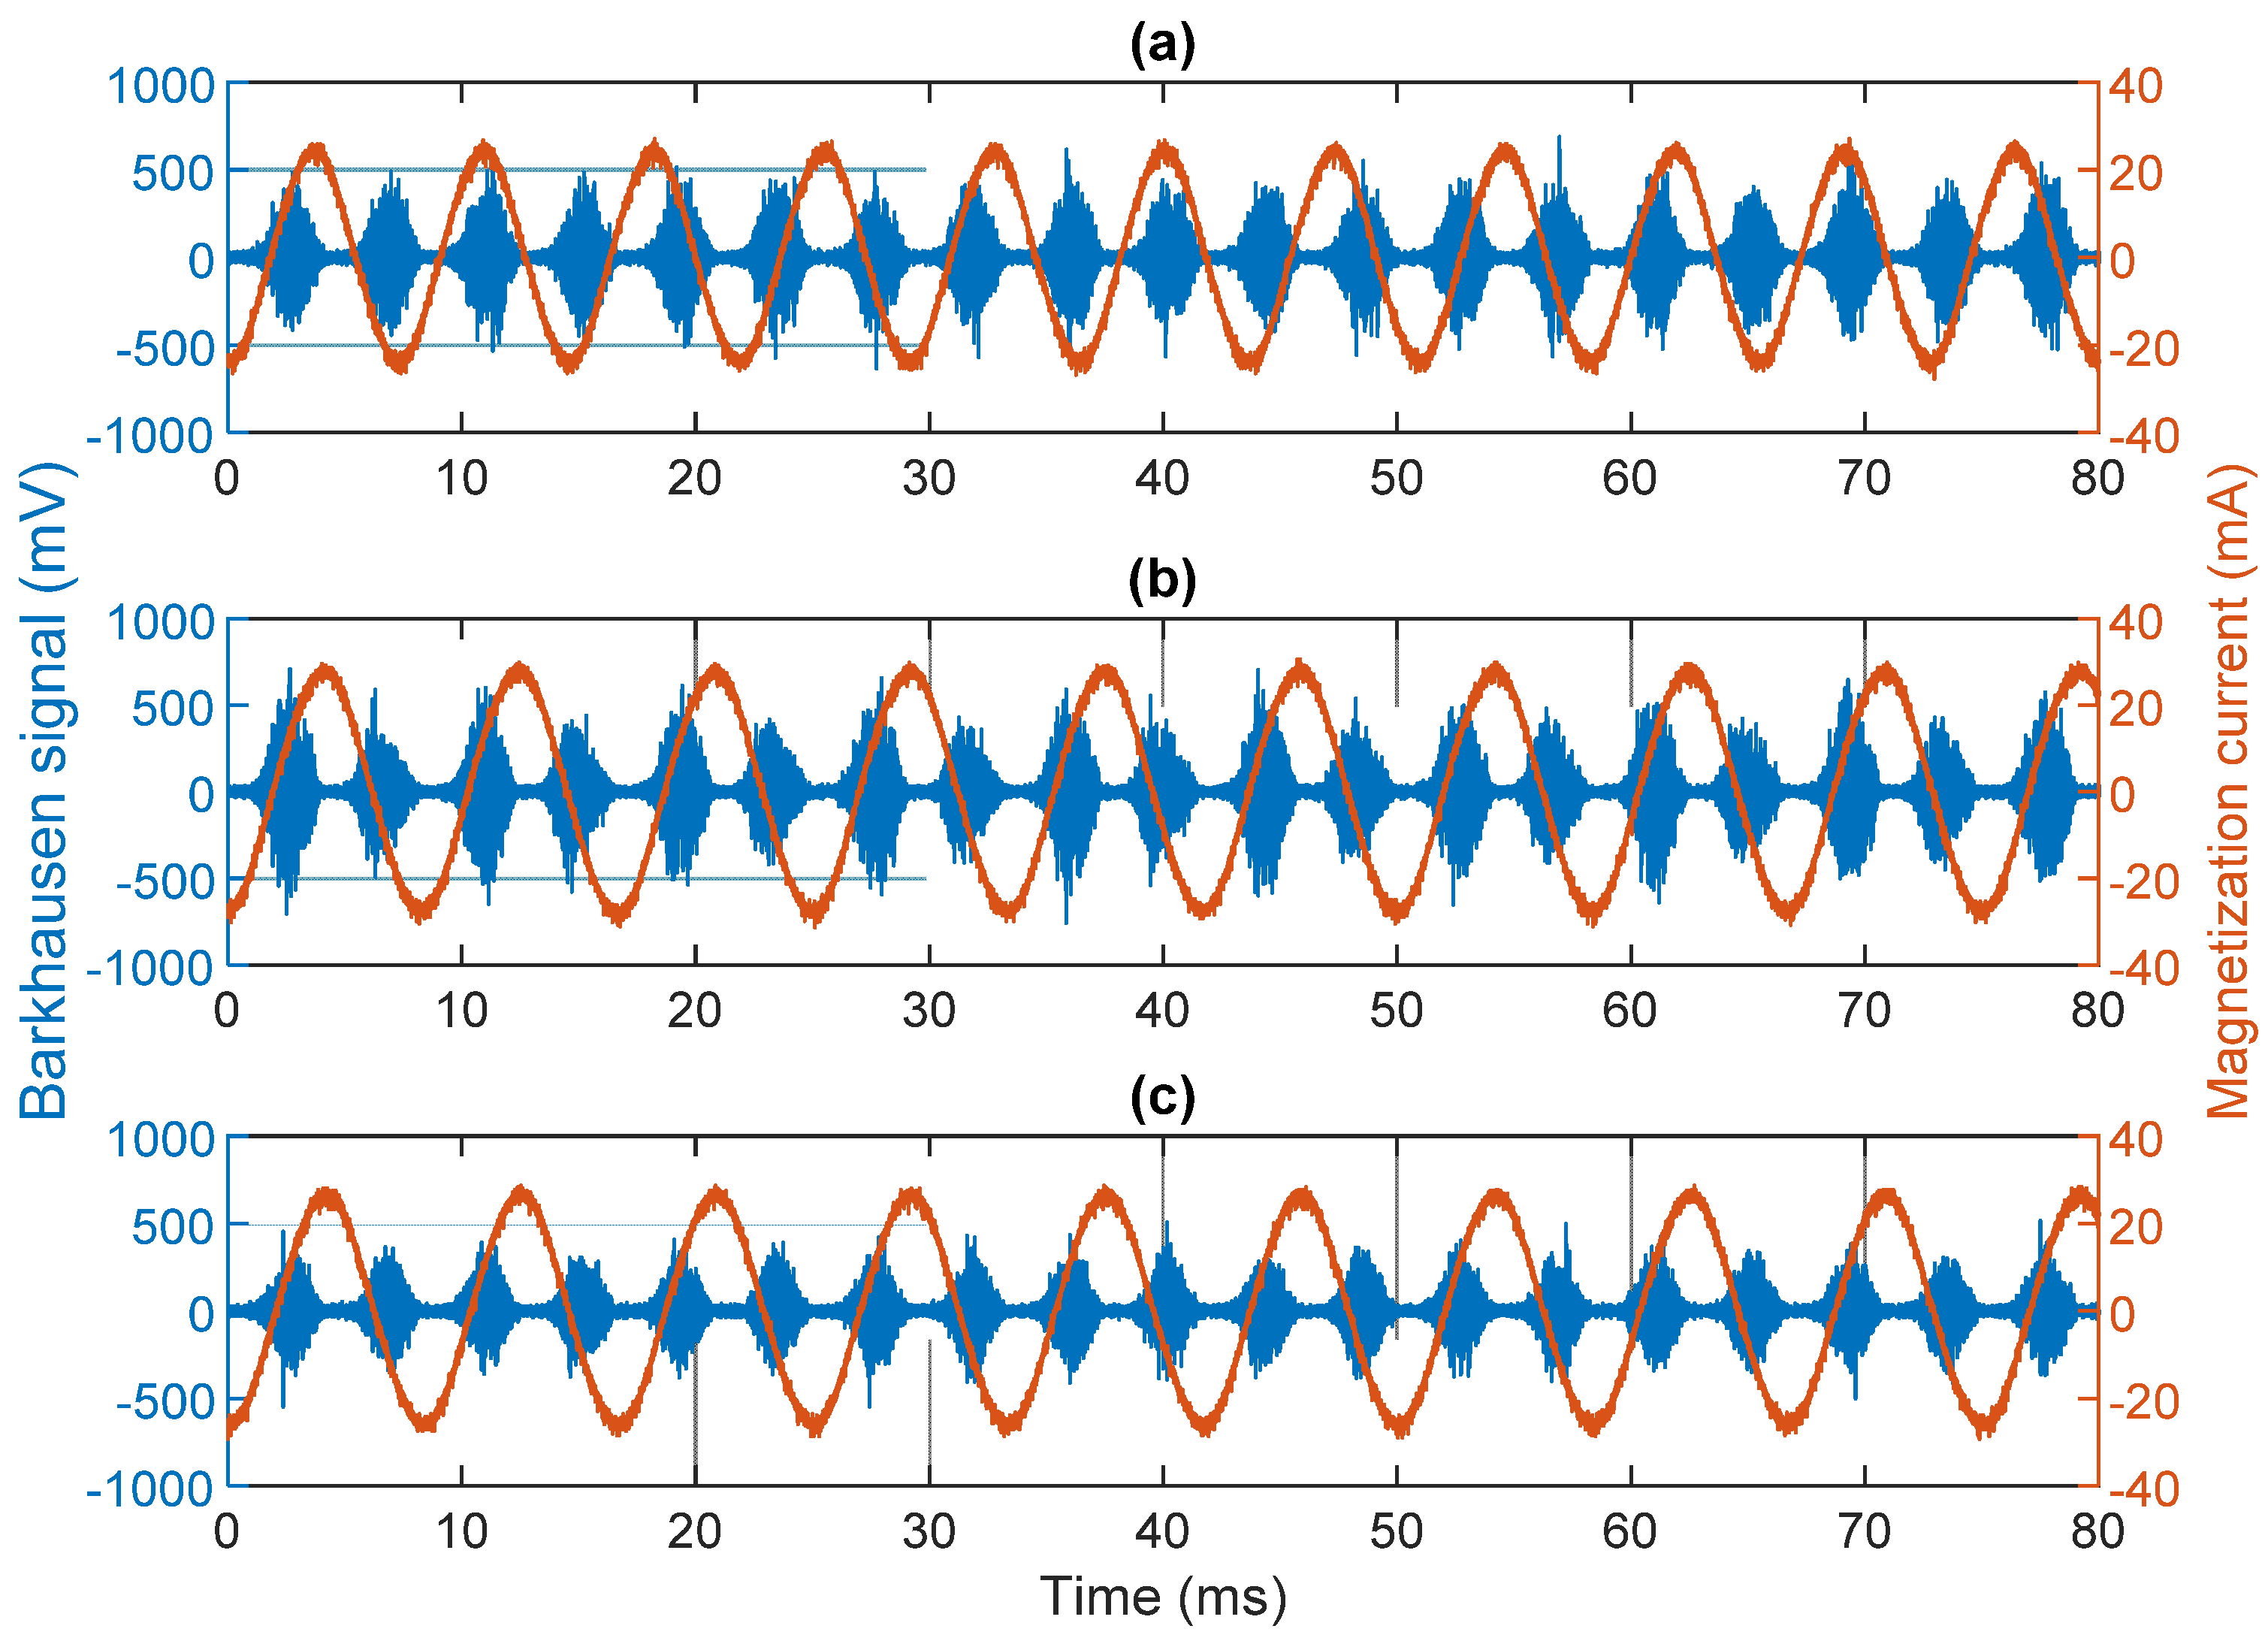
MBN measurements provide the most discriminating quantities to characterize material conditions. The MBN is an RMS (Root Mean Square) magneto-elastic parameter which is expressed as a function of magnetizing voltage, current and frequency applied to the material under test. A specified time window of several bursts (see in
Figure 4.) would indicate the general response from the feedback coil (these responses would essentially be repeats and provide trend data with high confidence). The RMS of the MBN response signal is given by (3):
where
n is the total number of MBN signal bursts captured within a specified frequency range and
yi is the amplitude of the individual burst.
Within the Rollscan 350 Analyser system used in this work. There are a number of parameters that need to be set for the stimulated electromagnetic waveform. Such parameters are the voltage, frequency as well as a high-frequency pickup response filter. Taking advantage of the skin effect equation, the lower the frequency the greater the depth of penetration into the material. Both magnetizing voltage and frequency sweeps were undertaken to identify optimum parameters based on the displayed material response. A penetration depth between 0.01 and 1 mm is achieved by using the frequency pickup filter of 70 kHz down to 200 kHz. Using the Microscan software, repeated measurements were then recorded for 5 s durations. The Barkhausen parameters are described in greater detail in [
18]. For consistency and repeatability, 2 V and 120 Hz was used as the parameters for this surface quality study. This selection was based on previous tests investigating the detection of embrittlement as well as being in good agreement with the frequency and voltage sweeps of the tested materials.
Figure 4 displays the response of MBN pickup for longitudinal (a) and transversal (b) measurements for sample material 23. Longitudinal measurement means that the direction of magnetization is parallel to the length of the sample. Longitudinal measurement for sample material 26 can be seen in
Figure 4c. Here differences can be seen in regard to the signal when applied to different surface conditions. Specifically,
Figure 4a has a greater in amplitude when compared with
Figure 4c, where both signal responses are for same sensor direction albeit different material conditions. This is expected as
Figure 4a response is correlated to a much lower surface roughness than that of
Figure 4c where the surface roughness is nearly five times coarser and therefore, less field energy penetrating the material surface.
Energizing the local material area electro-magnetically is carried out from magnetizing/sensing via a soft ferrous yoke. Ferrous yoke is in contact with the workpiece material under test. The surface quality of in-service safety-critical structures can vary from well-maintained to very coarse, high surface roughness. These differences impact on the coupling between the magnetic yoke and surface and in severe cases can influence the results to give totally misleading responses where the value obtained is based on both surface quality and different material conditions. This is a well-known problem with magnetic sensing technologies. To mitigate these effects the application of a spacer between the yoke and sample is proposed. This may reduce the effects of surface quality however the spacer decreases and distorts the measured signal substantially and thus the measurement of basic magnetic parameters of the sample material can be very difficult, or even impossible to provide discernible features.
During measurement, ferrous yokes were directly attached to the surface of the samples, similarly as done in the MAT technique.
3. Results
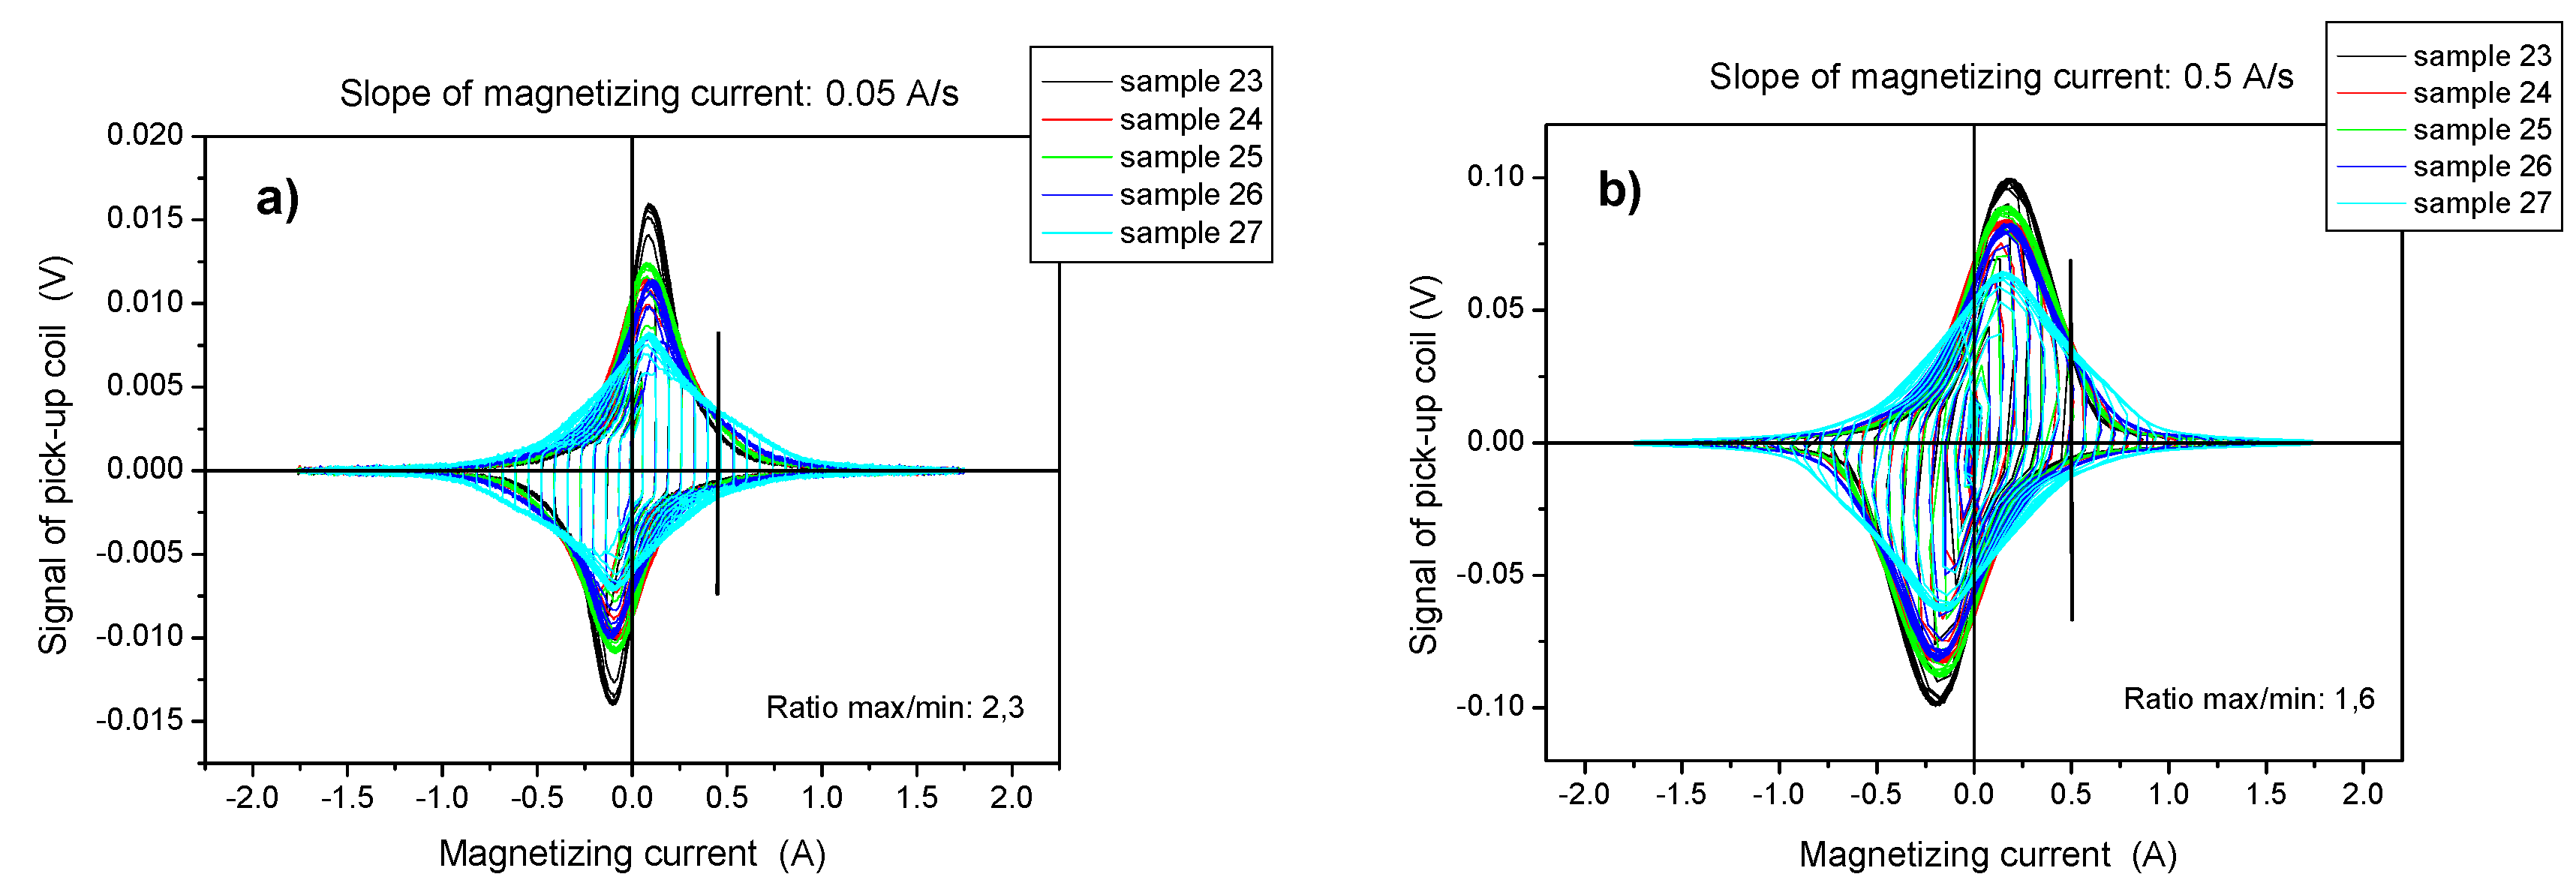
The permeability loops, measured by the MAT method on samples 23–27, are shown in
Figure 5a,b with the slope of the magnetizing current being 0.05 and 0.5 A/s, respectively. Changing the speed of the magnetization obviously has an effect on the recorded permeability loops. However, the surface roughness alters the obtained curves in different ways: the ratio of maximum permeability (reference sample/sample having largest surface roughness) is different for these two “speeds” of measurement. The maximal permeability was determined simply as the peak value of permeability loops, shown in
Figure 5a,b.
The most visible difference between the differently machined samples appears as the peak values of the permeability curves, as shown in
Figure 5. However, MAT process generates a big data pool, and those descriptors should be chosen from this, which result in the best correlation between magnetic characteristics and the investigated independent variable. In case of 0.05 A/s slew rate measurement the optimally chosen MAT descriptor is the 1/μ(
ha,
hb) descriptor, where the magnetizing field,
ha, is 450 mA and the corresponding minor loop amplitude,
hb, is 1300 mA. In case of 0.5 A/s slew rate measurement the optimally chosen MAT descriptor is the μ(
ha,
hb) descriptor, where the magnetizing field,
ha, is 500 mA and the corresponding minor loop amplitude,
hb, is 950 mA. In
Figure 6a, the optimally chosen normalized elements of permeability matrix are given as a function of
Ra for two different slopes of magnetizing current. These parameters are taken from the area, indicated by lines in
Figure 5a,b. It can be seen in
Figure 6a that the magnetic parameters are modified by about 40%, compared with the reference sample, if 0.05 A/s slope of magnetizing current is applied. In the case of the higher slope, this ratio is about 20% smaller, but is still significant.
The result of Barkhausen noise measurement (RMS BN responses) is shown in
Figure 6b, for two cases of direction of magnetizing field with respect to the sample orientation (transversal and longitudinal). For the better comparison, the values of BN signals are also normalized here by the value obtained on reference sample.
Similarly to the MAT measurement, a clear tendency of modification of magnetic parameters as a function of surface roughness characteristics is also seen. Moreover, if the MAT descriptor obtained by the faster slew rate of magnetizing current is compared with Barkhausen noise signal measured in transversal direction, a remarkably good correlation can be found between their parameters (see in
Figure 6c).
4. Discussion
As expected, the modification of surface roughness has a significant influence on the measured signal, regardless of the applied magnetic method. The first and important finding is that the two methods yield very similar correlation between magnetic parameters and roughness parameter. This is a good result, because it offers a fast and reliable electromagnetic method, for quantitative determination of the surface condition. On the contrary, this effect is harmful from point of view of magnetic NDE, because the influence of the surface suppresses the influence of material degradation.
The utility of magnetic measurements in non-destructive testing is supported by the fact that very similar result was found by applying two, very different methods.
In case of Barkhausen noise measurement a well detectable difference is observed when the magnetizing field is perpendicular or parallel to sample orientation. This result perhaps can be interpreted if we take into account the orientation of manufactured surface grooves. If the magnetizing field is perpendicular to the grooves (as in case of BNLx measurement), larger influence of surface roughness can be detected, than in parallel orientation. The reason is that MBN method is sensitive only to the surface region. By applying the MAT method, we cannot observe this difference, because in this case a larger volume of sample is magnetized and the source of different magnetic behavior is the effective air gap between magnetizing yoke and sample surface.
MAT seems to be more sensitive to the modification of surface condition than magnetic Barkhausen noise measurement if the slew rate of magnetizing current is lower. MBN method seems to be more suitable to reducing the harmful influence of surface quality condition.
It is an important observation that by increasing the speed of magnetizing current, the dependence of MAT descriptors on the surface roughness parameter can be reduced. This result is new, compared with previous measurements. In short, if we focus on the determination of the surface roughness itself, slow measurement should be applied, while if we are interested in detection of material changes due to any type of degradation, faster measurement is preferred approach. It is worth mentioning that by using fast MAT measurement up to a certain value of surface roughness (about
Ra = 0.35 μm), the influence of surface roughness on the magnetic descriptor is almost negligible, in spite of the fact that in permeability loops, especially considering their peak values, the difference is clearly seen (see
Figure 6). This fact can also be observed in the case of MBN measurements, with reference to the transversal measurements (see
Figure 7). The good correlation between MAT and MBN measurements is encouraging.
For MAT measurement, increasing the speed of magnetization by ten times results in quasi static type excitation too, since reaching above 1.75 A peak current by 0.5/s speed means 3.5 s of half-period, i.e., 7 s of reverse magnetizing cycle period. Therefore, the skin effect, i.e., the reduction of the penetration depth, can be still considered as negligible; otherwise, this skin effect could emphasize the relevance of the surface layer and could act in contrary to our presented observation.
Considering the reduced magnetic coupling (or the equivalent air gap) induced by the surface roughness is independent of the speed of reverse magnetization, the reason of our novel observation can be found in reduction of surface layer relevance for the recorded magnetic response. Magnetizing the material at elevated speed increases the magnetic and eddy current losses that results in well-known and clearly visible effect on the shape of the permeability loops (see the difference between
Figure 5a,b). Meanwhile the magnetic loss is increased in the underlying layer, the surface roughness can fade the increase of magnetic losses due to its effect on the domain dispersion and can reduce its relevance of the surface in the magnetic response this way. Since, if the domain dispersion due to material texture or degradation is not in the same order of magnitude that caused by the studied degrees of surface roughness, the magnetic domain dispersion in the surface layer will not be too much different among the measured specimens which at the same time reduces the observed differences between the permeability loops. Unfortunately, to study this idea would be far beyond the framework of this paper.
In many typical cases of everyday samples, the roughness is not higher than Ra = 0.35 μm. This a good message for future magnetic NDE application. It is possible that by some further increase of slope of magnetizing current, the influence of surface roughness can be reduced even more, but at the moment there is no possibility for performing such measurements in case of the given experimental setup.
As shown above, the surface conditions and roughness of the samples was modified by using the machine cutting forces. However, with machining not only the surface roughness changes, but also the structure of deeper layers. In principle this can also strongly affect the magnetic parameters of the samples. To analyze this problem, all sides of samples were measured by MAT, not only top and bottom. Considering that by using the magnetizing yoke with the size, comparable with the size of sample, practically the whole volume of the sample is magnetized. Such a way if the side of the samples (mechanically not modified) is measured, information is obtained about the bulk magnetic properties, while if the top of samples is measured the influence of surface roughness (increased air gap) and the possible change in bulk magnetic properties are mixed.
We can easily separate these two effects by comparing the permeability curves of virgin sample (top, bottom, sides, does not matter) with the top permeability curves of mechanically treated samples. It was found that the measured permeability loops of reference sample and permeability loops of sides of machined samples are very close to each other. A very slight difference can only be detected, which is the uncertainty of measurement. The influence of surface roughness is much more emphasized. As an illustration, the permeability curves, measured on top and bottom of reference sample are shown in
Figure 7 together with the permeability curves of sample 27, measured on left and right sides of the sample. It is seen that effect of machine cutting on magnetic properties of the deeper layers in case of our samples is practically negligible; therefore, we measure the influence of surface roughness indeed.
The next step of our efforts is oriented to the direction, how the influence of the surface roughness could be eliminated by applying non-magnetic spacer between sample surface and magnetizing yoke. For this purpose, a sample series is being prepared with different material degradations and with different surface conditions.
5. Conclusions
The influence of the surface roughness on the magnetic behaviour was studied on a series of ferromagnetic samples made from reactor pressure vessel steel, magnetized and measured by a magnetizing yoke attached onto the sample surface. As a result, a direct quantitative, monotonic correlation between the magnetic behavior and the surface roughness was obtained by applying two different types of magnetic measurements. The two measurements gave similar results.
The outcomes of MAT method, applying a faster slew rate of magnetizing current, resulted in a remarkably good correlation with the BNM method using the signal measured in the transversal direction. The MAT method seems to be more sensitive to the modification of surface condition than magnetic BNM as the slew rate of magnetizing current is lowered.
Our purpose was to investigate the influence of surface roughness on the magnetic parameters, but in the light of our result—considering the unambiguous monotonic correlation between these quantities—it would also be possible to derive the surface roughness from magnetic parameters and to substitute the measurements of Ra.
Usually, if any magnetic measurement is applied, the question is how the degradation of material (due to many possible reasons, such as fatigue, thermal treatment, plastic or elastic deformation, neutron irradiation, etc.) is reflected in magnetic parameters. In the present investigation, the case is just the opposite: material parameters are the same in all pieces of sample series and we study only the influence of surface roughness. In practical cases, these two circumstances cannot be separated, our attempt is the first step into this direction. If this is realized in our results, then this should be helpful for the future application of non-destructive magnetic testing.

 ,
, 


