1. Introduction
Spudcan foundations are widely used to support jack-up barges, which are widely used for offshore construction. For the design and operation of jack-up barges, the estimation of the peak bearing capacity (qpeak) during spudcan installation is essential. A major concern is the installation into sand overlying clayey soil, which may produce large differential settlements and potentially lead to a punch through failure.
Because of the evident similarities between a spudcan and a shallow foundation, bearing capacity equations developed for shallow foundations have been used by SNAME [
1]. One of the earliest models to estimate the bearing capacity of shallow foundation in sand over clay profile was proposed by Meyerhof [
2] and Hanna and Meyerhof [
3]. The procedure, termed as the punching shear method, assumes that a sand block with vertical failure surfaces is pushed into the clay layer. Modifications were proposed to the punching shear method to improve the prediction accuracy. In the projection method, the failure surface is assumed to be inclined at an angle of
β [
4,
5,
6]. A range of values have been used for
β. Okamura et al. [
7,
8] performed the centrifuge experiments to measure the bearing capacity of shallow foundations on dense sand overlying clay. Based on the model test measurements, a limit equilibrium-based model that combines the concepts of the punching shear and projection models was presented. Park and Park [
9] proposed a new model for bucket foundations on sand over clays profiles based on the outputs of non-linear finite element analyses.
Although there are similarities between two types of foundation, the clear difference is that whereas the shallow foundation can be considered to be wished-into place, the spudcan is pushed into the ground from the surface. Centrifuge model tests have been extensively performed to investigate the peak penetration resistance (
qpeak) of spudcan foundations. Teh et al. [
10] performed centrifuge model experiments to examine the failure mechanism of spudcan foundations at
qpeak in sand overlying normally consolidated (NC) clay using the particle image velocimetry technique. It was revealed that at
qpeak, a sand wedge forms between the base of the spudcan and sand–clay interface. The results of the centrifuge model tests were utilized to develop predictive models for
qpeak. Lee et al. [
11] presented a stress dependent model based on the observations of Teh et al. [
10]. The model was calibrated against experimental data for limited dense sand overlying clay profiles. Hu et al. [
12] modified the model of Lee et al. [
11] to account for the embedment depth. The model was validated against centrifuge model tests.
Alternatively, advanced numerical modelling techniques capable of simulating large-deformation penetration have been used to calculate the penetration resistance of spudcan foundations. Tho et al. [
13] utilized the coupled Eulerian–Lagrangian (CEL) approach to simulate the penetration of spudcan for both homogenous and layered soil profiles. The parameters which influence the results of penetration resistance of spudcan were identified. Qiu and Henke [
14] performed finite element (FE) analyses using the CEL approach on loose sand overlying soft clay. The influences of sand thickness and bottom clay strength on the bearing capacity of spudcan foundations were evaluated. Qiu and Grabe [
15] conducted the CEL analyses using the hypo-plastic model for sand and a visco-plastic model for clay. An equation for
qpeak was not presented. Hu et al. [
16] performed FE analyses using the CEL approach to simulate penetration of a spudcan into medium dense sand over NC clay.
qpeak results from the numerical simulations were compared with the simplified model proposed by Hu et al. [
12]. Hu et al. [
17] further extended the CEL approach accounting for the strain-softening behavior of dense sand. The simplified model of Hu et al. [
12] was again demonstrated to provide reasonable estimate of
qpeak.
In addition to deterministic analyses, probabilistic assessments were performed to evaluate the capacity of shallow and spudcan foundations. Chwała and Puła [
18] conducted analyses for probabilistic prediction of bearing capacity of shallow foundations on homogenous sand overlying spatially variable clay soil. Shu et al. [
19] performed random field FE analyses for probabilistic evaluation of bearing capacity of spudcan foundations embedded at various depths. The undrained strength of the soil was spatially varied with depth. Based on numerical outcomes, it was concluded that the non-stationary random field may generate lower values of mean probabilistic bearing capacity. Li et al. [
20] adopted the probabilistic investigation approach to evaluate failure envelops of spudcan foundation under combined vertical, horizontal and moment loading space (VHM). It was concluded that presence of spatially variable soils reduces both the bearing capacity and failure envelopes.
The literature review reveals that the previous studies focus on the penetration characteristics of sand overlying soft clay, because of the potential for a punch-through failure. However, there is a need to estimate the penetration resistance also in sand over stiff clay for operation of jack-up barges supported by spudcan foundations. Hu and Cassidy [
21] performed CEL analyses to determine the penetration resistance in sand overlying stiff clay. However, the study focused on the resistance in the clay layer and an equation for
qpeak was not presented. Based on a limited comparison with available centrifuge test results for
su = 32.6 and 43.9 kPa, it was reported that the Hu et al. [
12] model provides favorable predictions of
qpeak. It should be noted that
su values even for this validation do not cover the range encountered in the field.
In this study, qpeak of spudcan foundations in sand overlying a soft to stiff clay layer was calculated using three-dimensional (3D) finite element analyses incorporating the CEL approach. A wide range of strength parameters were used, which include the effective friction angle of the sand layer () and undrained shear strength of the clay layer (su). The calculated bearing capacity results are compared with the analytical model. A new empirical correlation for one of the parameters of the conceptual model is proposed to improve the fit for not only soft clays, but also stiff clays. The enhancement in the prediction accuracy is thoroughly investigated through comparisons with the baseline simulations.
2. Peak Penetration Resistance Prediction Models in Sand Overlying Clay
Among various penetration resistance models developed specifically for spudcans, two
qpeak models widely used in practice are introduced in this section. Lee et al. [
11] proposed an equation to predict
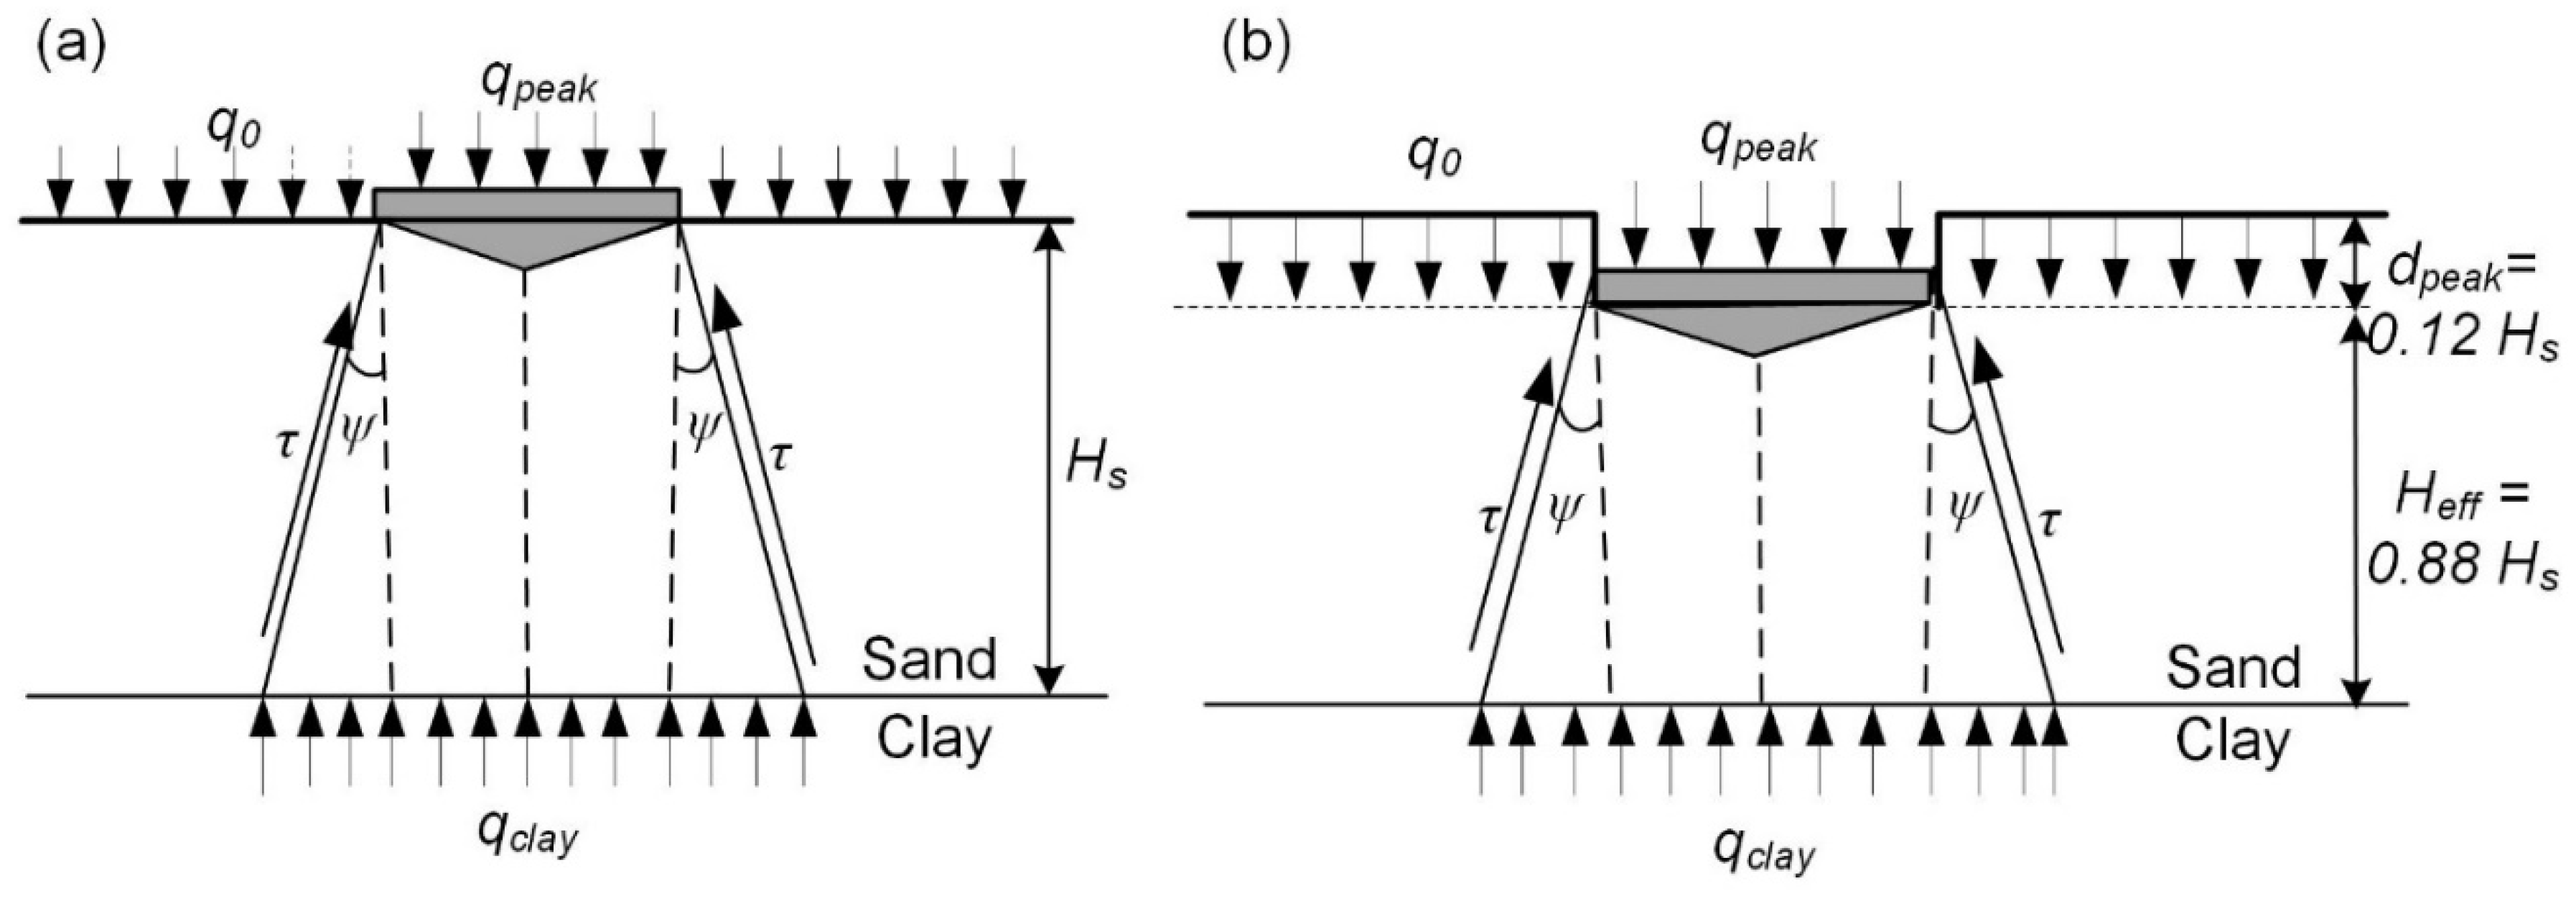
qpeak of spudcan foundation in dense sand over NC clay using a simplified conceptual model, illustrated in
Figure 1a. An inverted truncated cone of sand is assumed to be pushed into the underlying clay.
qpeak is mobilized by the shearing resistance along the sliding surface and the bearing capacity of the clay layer. It was assumed
qpeak is mobilized at the surface, based on the centrifuge tests of Lee et al. [
22]. The predictive equation is as follows:
where
Nc0 is the bearing capacity factor for clay at the base of a circular foundation,
su is the undrained strength of clay at the sand–clay interface,
q0 is the overburden pressure,
Hs is the height of the sand layer,
D is the diameter of spudcan,
ψ is the dilation angle of sand, and
E* is an empirical parameter, and
γ′s is the unit weight of sand. The following equation proposed by Houlsby and Martin [
23] for isotropic clays was used for
Nc0:
where
k is the strength gradient of NC clay.
E* is defined as follows:
where
tanϕ* is calculated as:
DF is defined as:
where
is the normal stress along the failure surface and
is the average of the vertical stress within the failure surface (frustrum). Because of difficulties in determining the failure surface and normal stress acting on it, the following empirical correlation for
DF was presented from a linear regression to fit the centrifuge measurements as follows:
The operative friction and dilation angle were recommended to be selected through an iterative process, because they are dependent on the stress level Bolton [
24]. The following equation was presented to determine
qpeak dependent operative friction and dilation angles:
where
ID = relative density,
Q is the particle crushing strength of sand, and
ϕcv is the critical state friction angle of sand. It was reported that
Q = 10 for silica sand.
Hu et al. [
12] performed spudcan penetration tests on medium-loose sand overlying clay and compared
qpeak. It was reported that
qpeak is not mobilized at the surface, but at a depth of
dpeak. To account for
dpeak, the model of Lee et al. [
11] was modified as illustrated in
Figure 1b. The following modified equation was proposed:
Additionally, the relationship of
DF was recalibrated and optimized for a wide range of spudcan geometries and sand stiffness. It was reported that a non-linear correlation was found between
DF and
Hs/D, resulting in the following empirical equation:
Both models were developed from centrifuge experiments with a narrow range of
su ranging from 11 to 19.1 kPa (
Table 1), because the focus of both studies was punch-through failure.
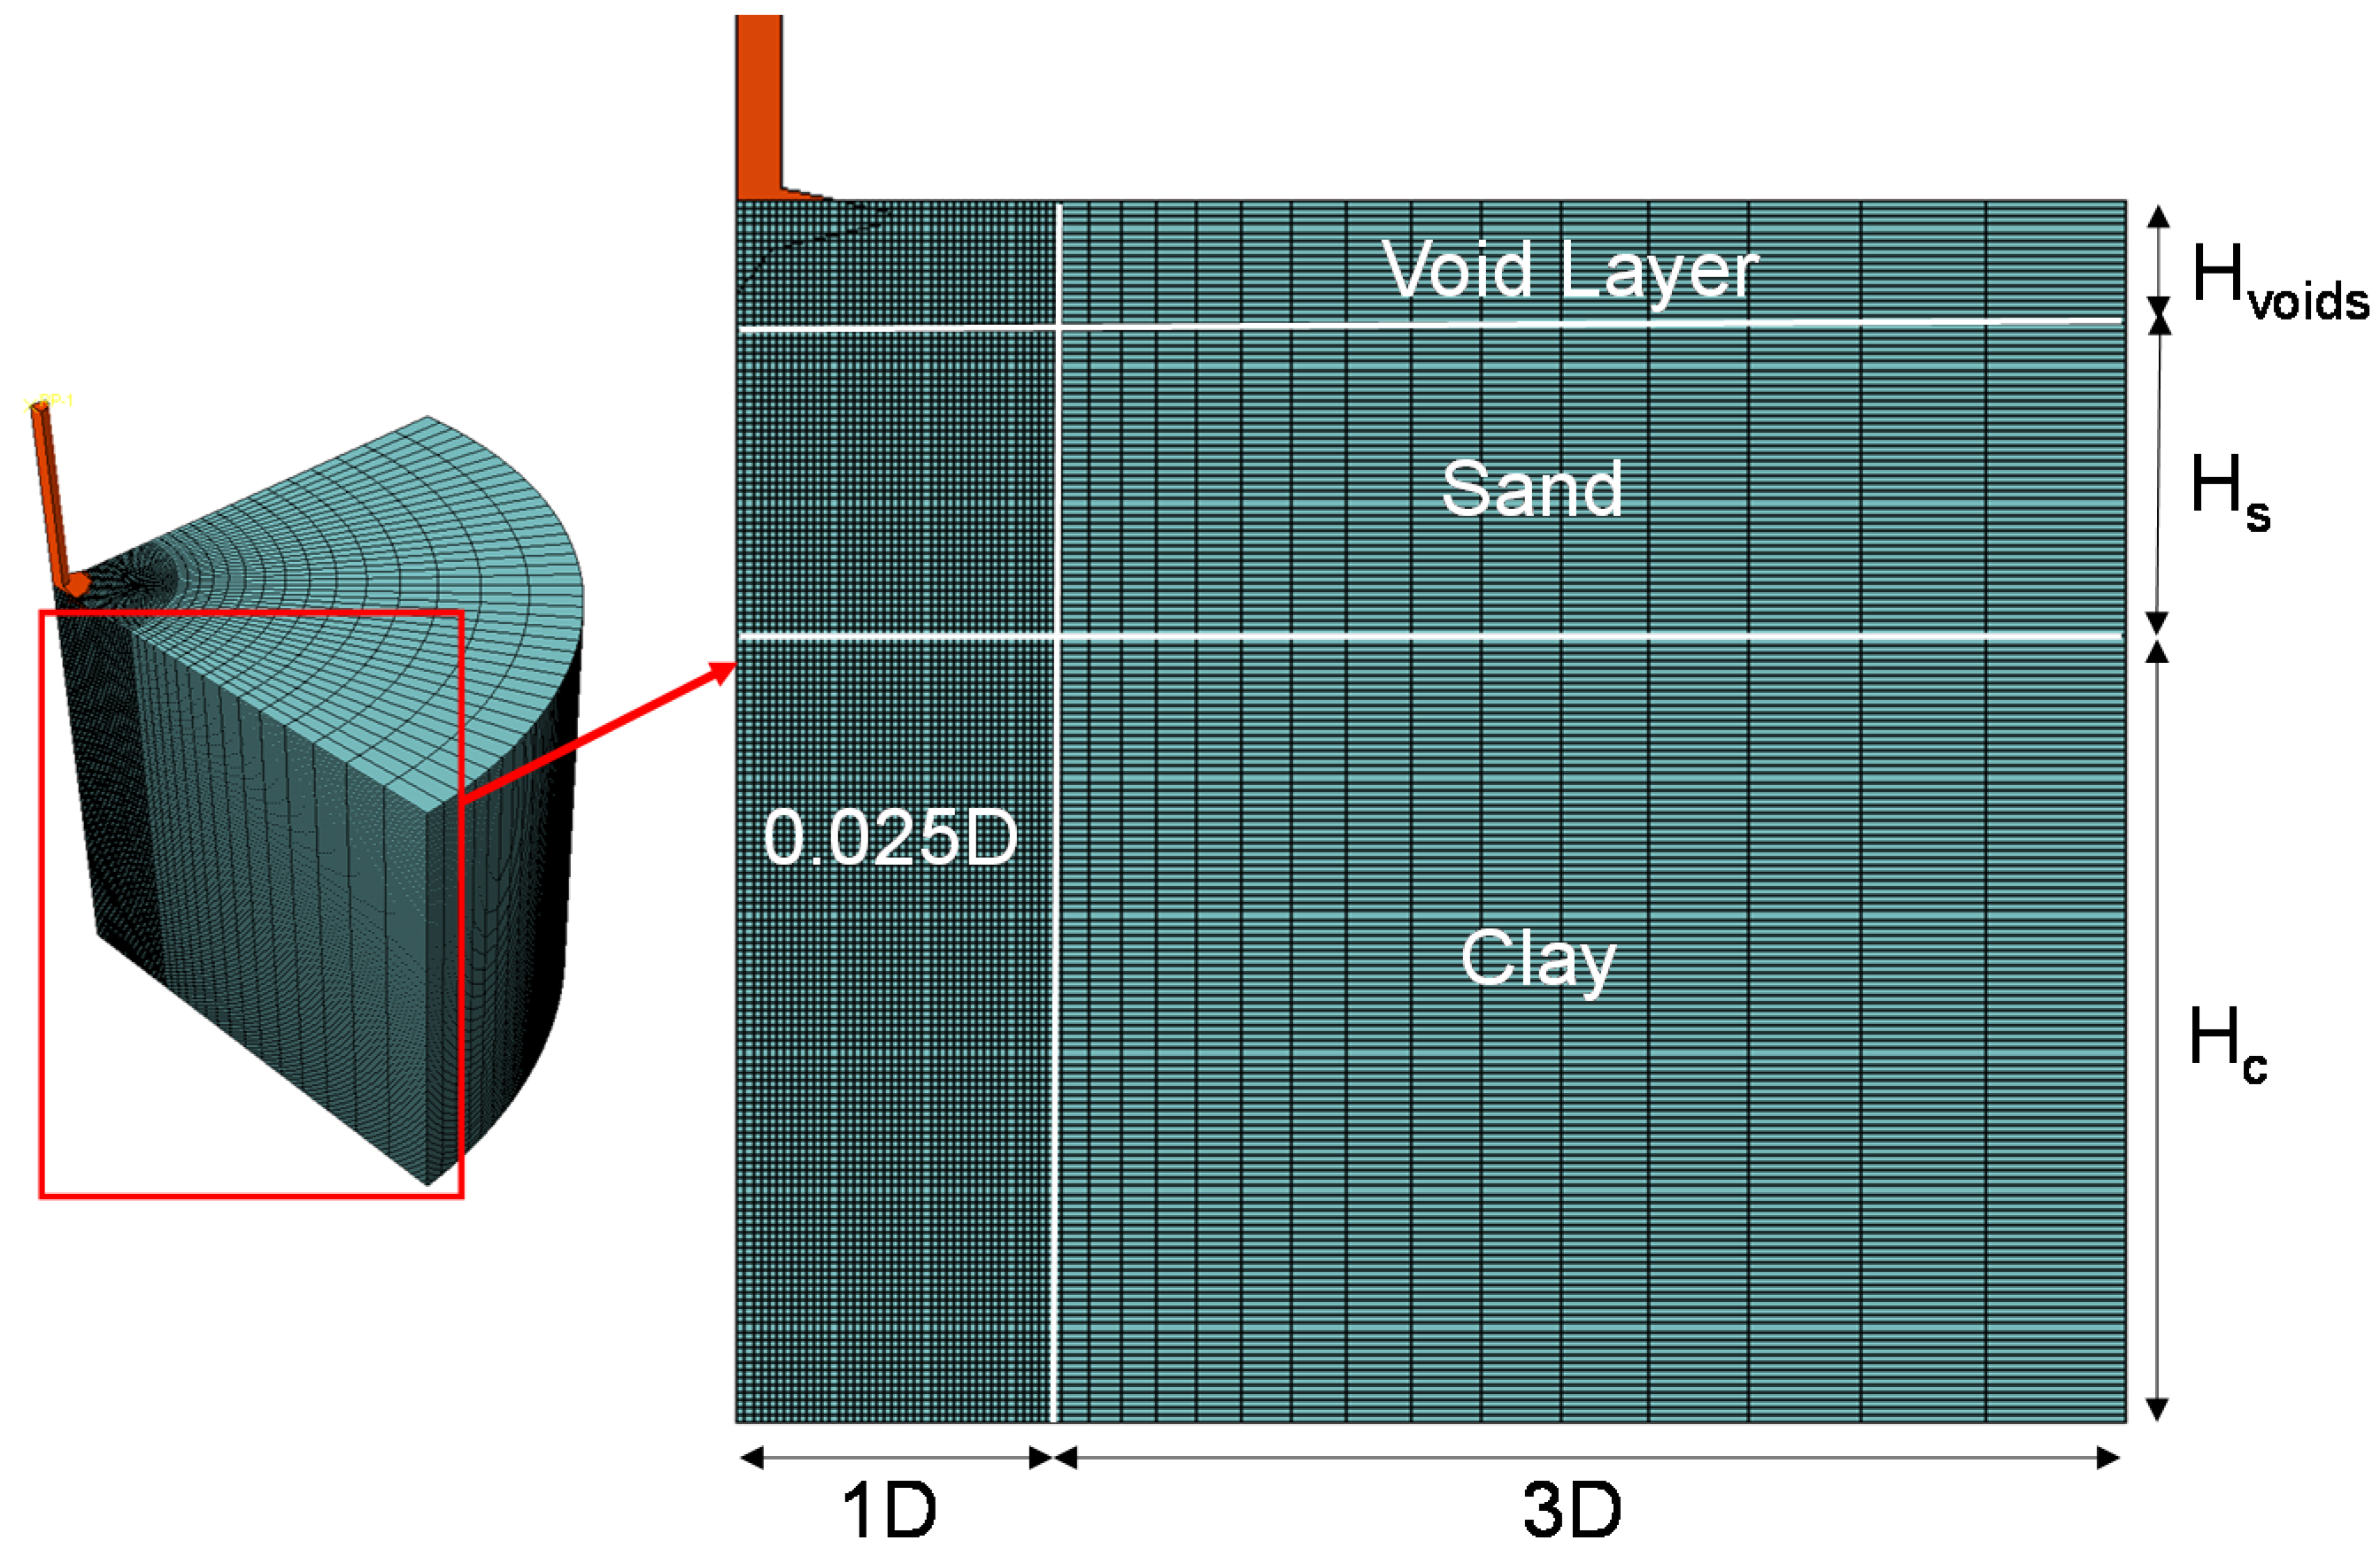
4. Peak Penetration Resistance in Sand Overlying Clay
A parametric study was performed to investigate the influence of various factors on the bearing capacity of spudcan. A total of 120 FE simulations were performed, the matrix of which is summarized in
Table 2. The unit weights of sand and clay were set to 11 kN/m
3 and 7.5 kN/m
3, respectively. For the sand layer,
E and
ν were set to 25 MPa and 0.3, respectively. For the clay layer,
ν = 0.49 and
E was set to 500
su [
16].
ϕ′ of sand assigned were = 31° and 35°. The dilation angle was calculated from the following empirical formulation [
9,
27,
28]:
The undrained strength of clay at the interface of sand–clay were set to 10, 20, 30, 40, and 60 kPa. The strength gradient
k was set to 2 kPa/m. Four sizes were used for the spudcan foundation, where
D was varied from 6 to 14 m. The protruded spigot and conical angles of spudcan were fixed to 76° and 13°, respectively. The sand layer height was varied from 4 to 14 m.
Hs/D ranges from 1.0 to 0.28.
qpeak were defined as the peak penetration resistance calculated within the sand layer regardless of penetration depth, because the results demonstrated that in stiff clays, the peak resistance does not always develop at a depth of 0.12
Hs as reported in Hu et al. [
12].
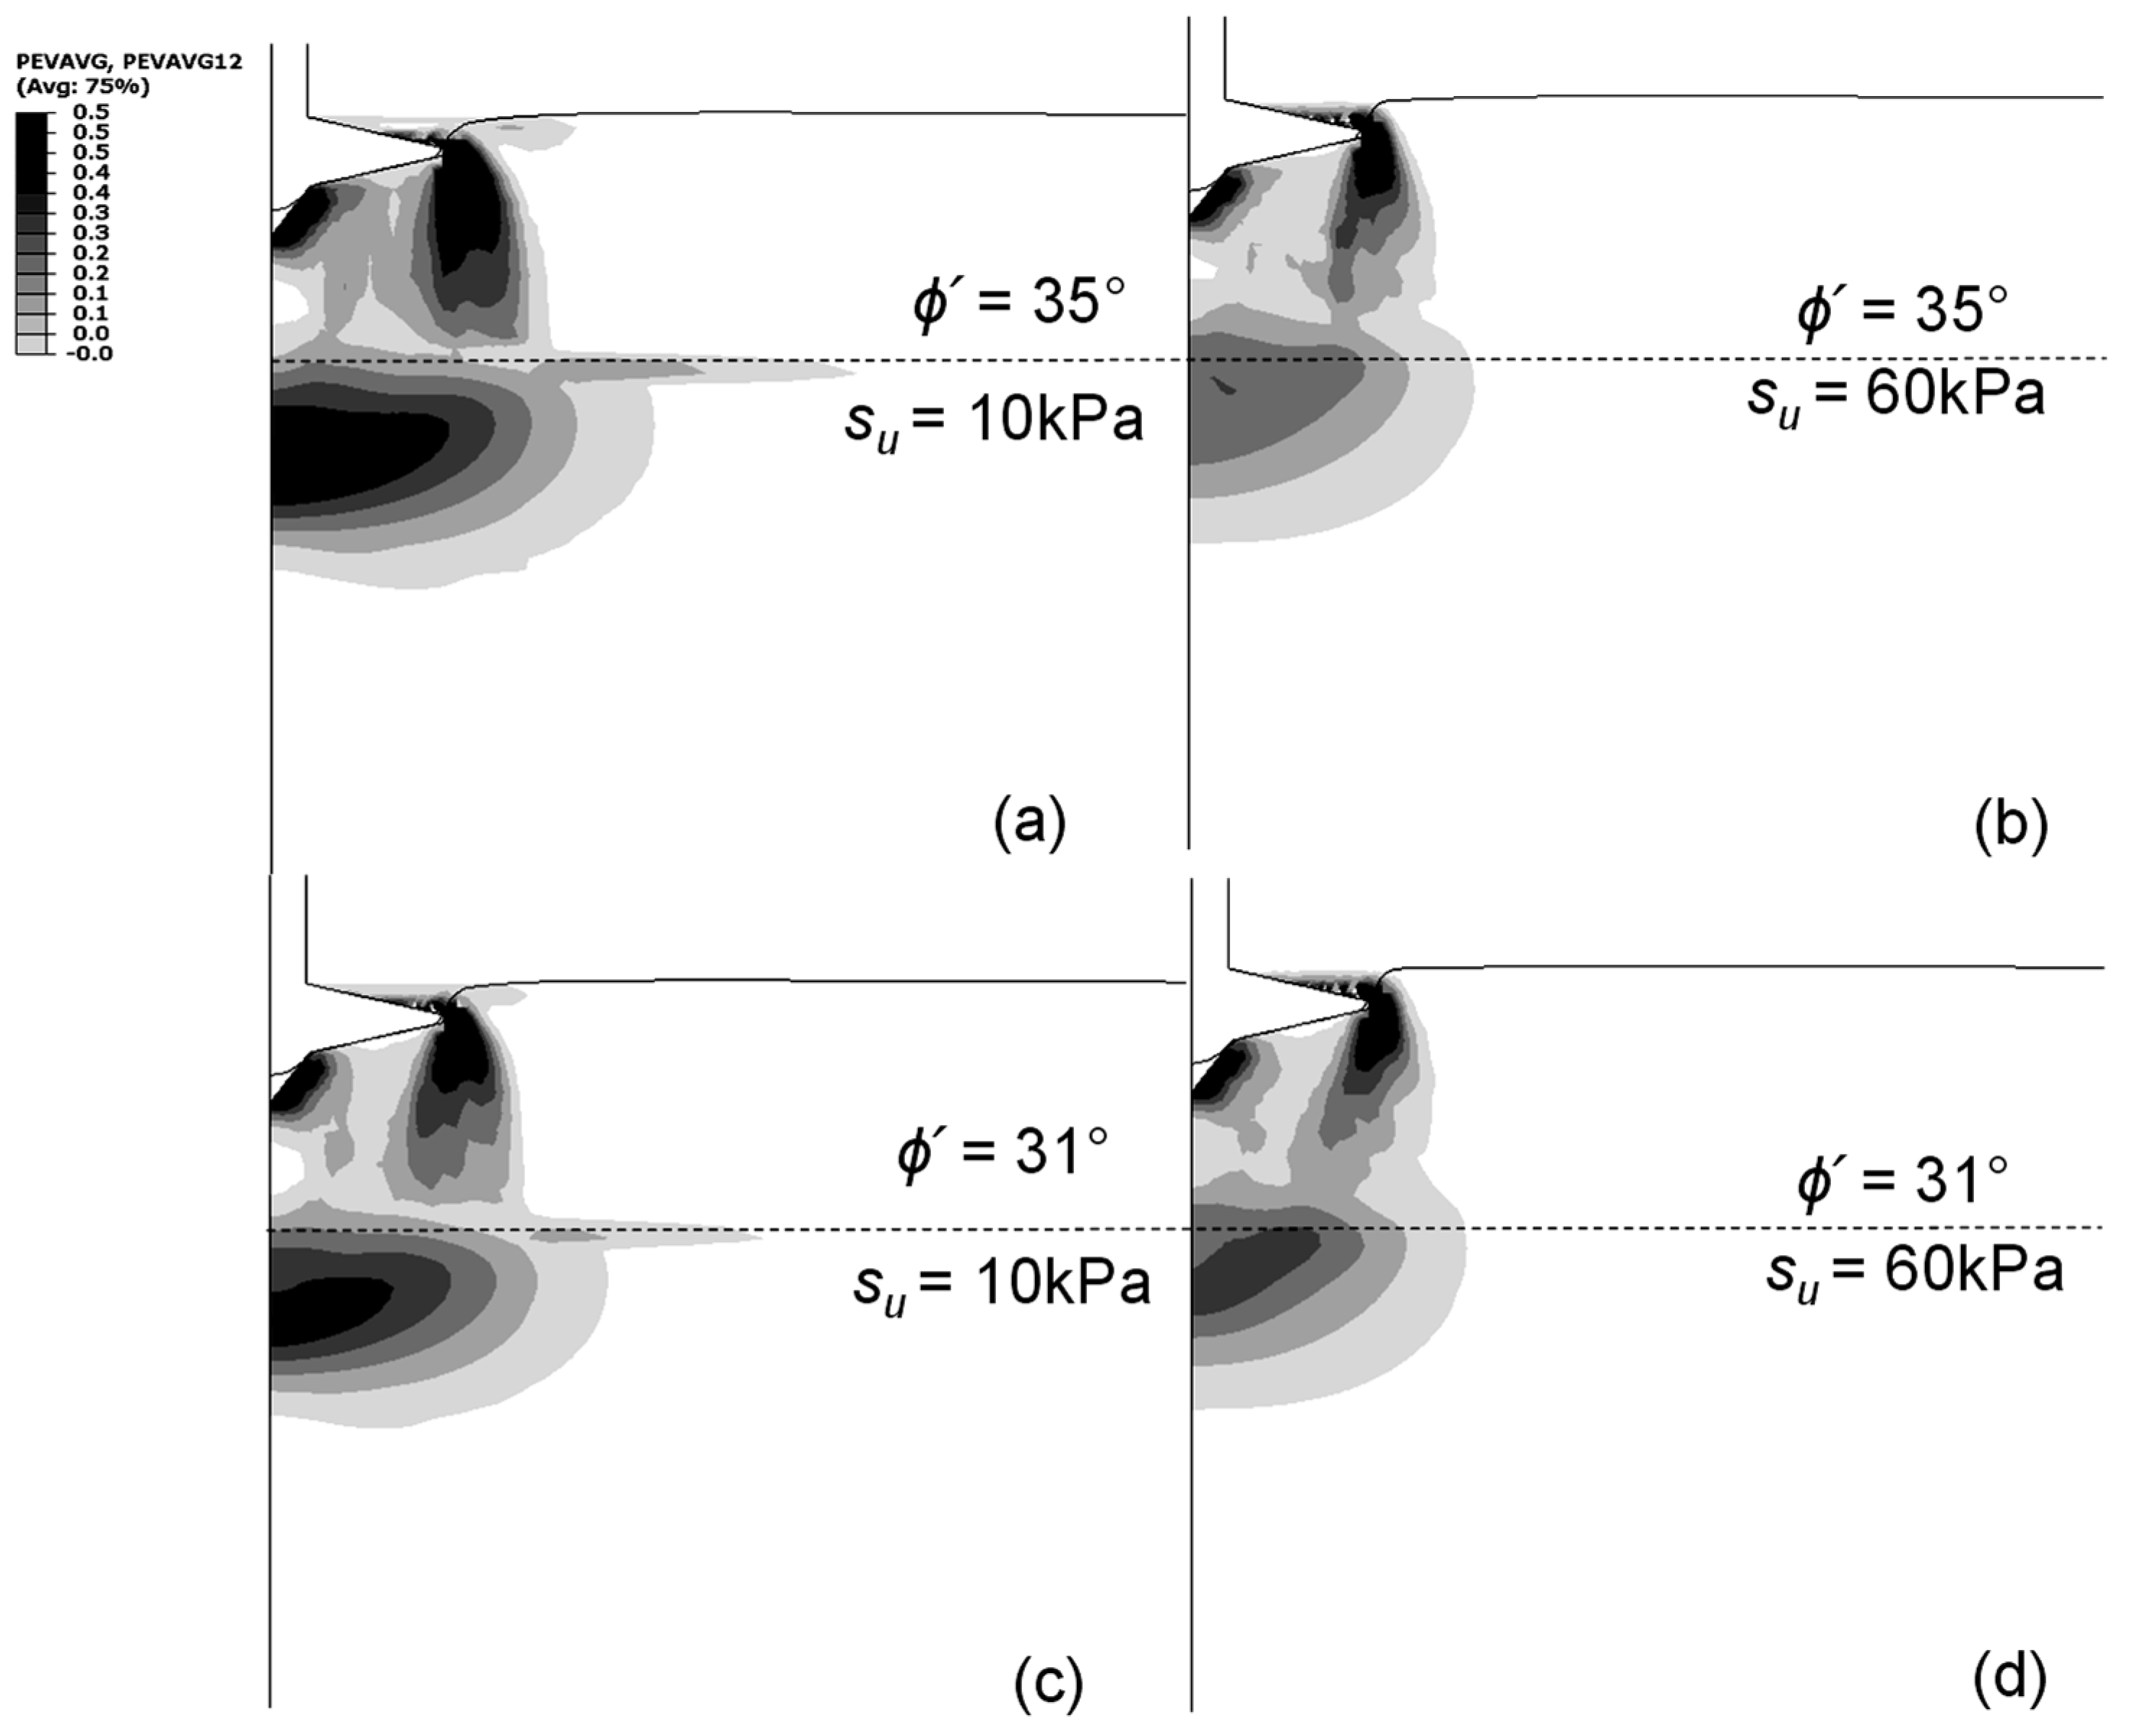
Figure 6 displays the plastic shear strain increment contours calculated at
qpeak for
Hs/D = 0.7 and various combinations of
ϕ′ and
su. Comparisons show that an increase in
su produces corresponding change in the slope of the failure surface for both
ϕ′ = 31° and 35° cases. Whereas the failure surface are tilted outwards with respect to the centerline for
su = 10 kPa, they are inclined inwards for the case of
su = 60 kPa. This shift produces the area of influence for the clay to be smaller for stiff clay relative to the soft clay. For
su = 10 kPa, the lateral spreading of the soft clay can also be observed. It is shown to influence the trace of the plastic strain within the sand layer. Profiles with larger
ϕ′ produce higher levels of shear strain in the sand layer, displaying that the mobilized resistance in the sand layer increases with an increase its shear strength.
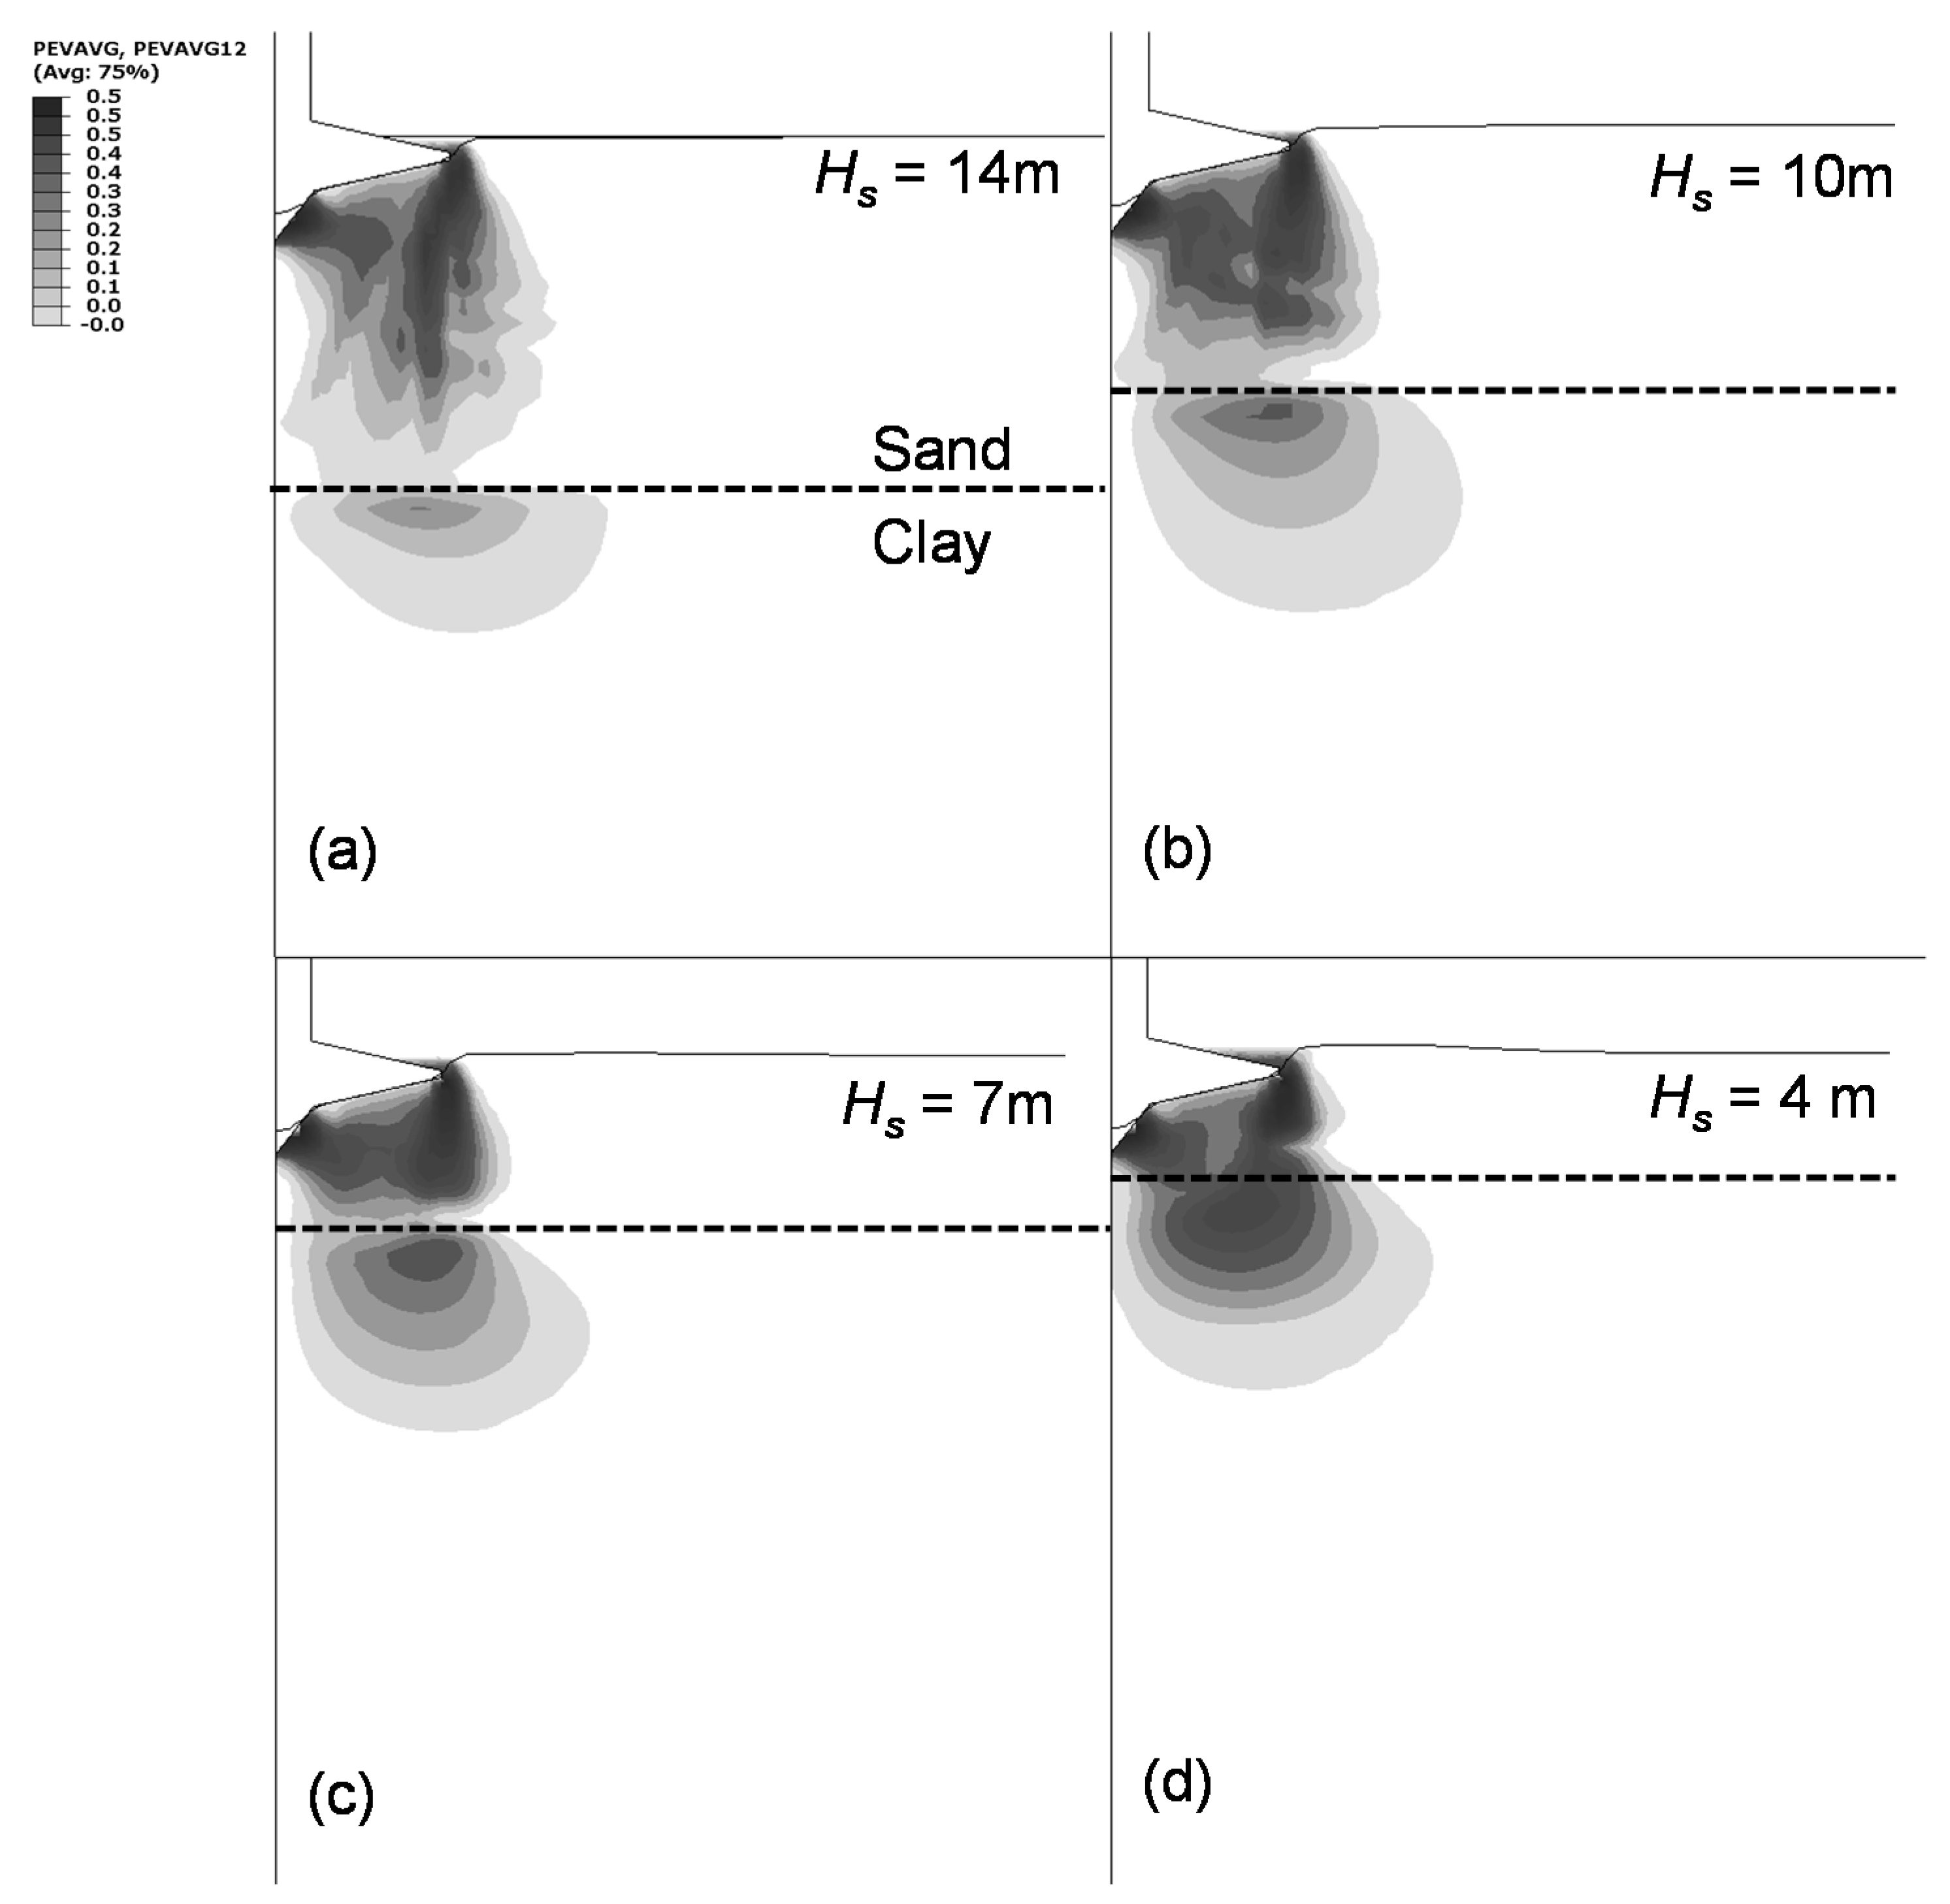
Figure 7 plots the variation of plastic shear strain traces with change in
Hs/D. For
Hs/D = 1, limited shear strain develops at the clay layer. The plastic shear strain and also the area of influence of the clay layer increase with a decrease in
Hs/D ratio.
Figure 6 and
Figure 7 demonstrate that
qpeak is influenced by
Hs/D,
ϕ′, and
su. As for
ϕ′, the influence is not as significant compared with the parameters
Hs/D and
su, because only loose to medium dense sand with
ϕ′ ranging from 31 to 35° is considered in this study.
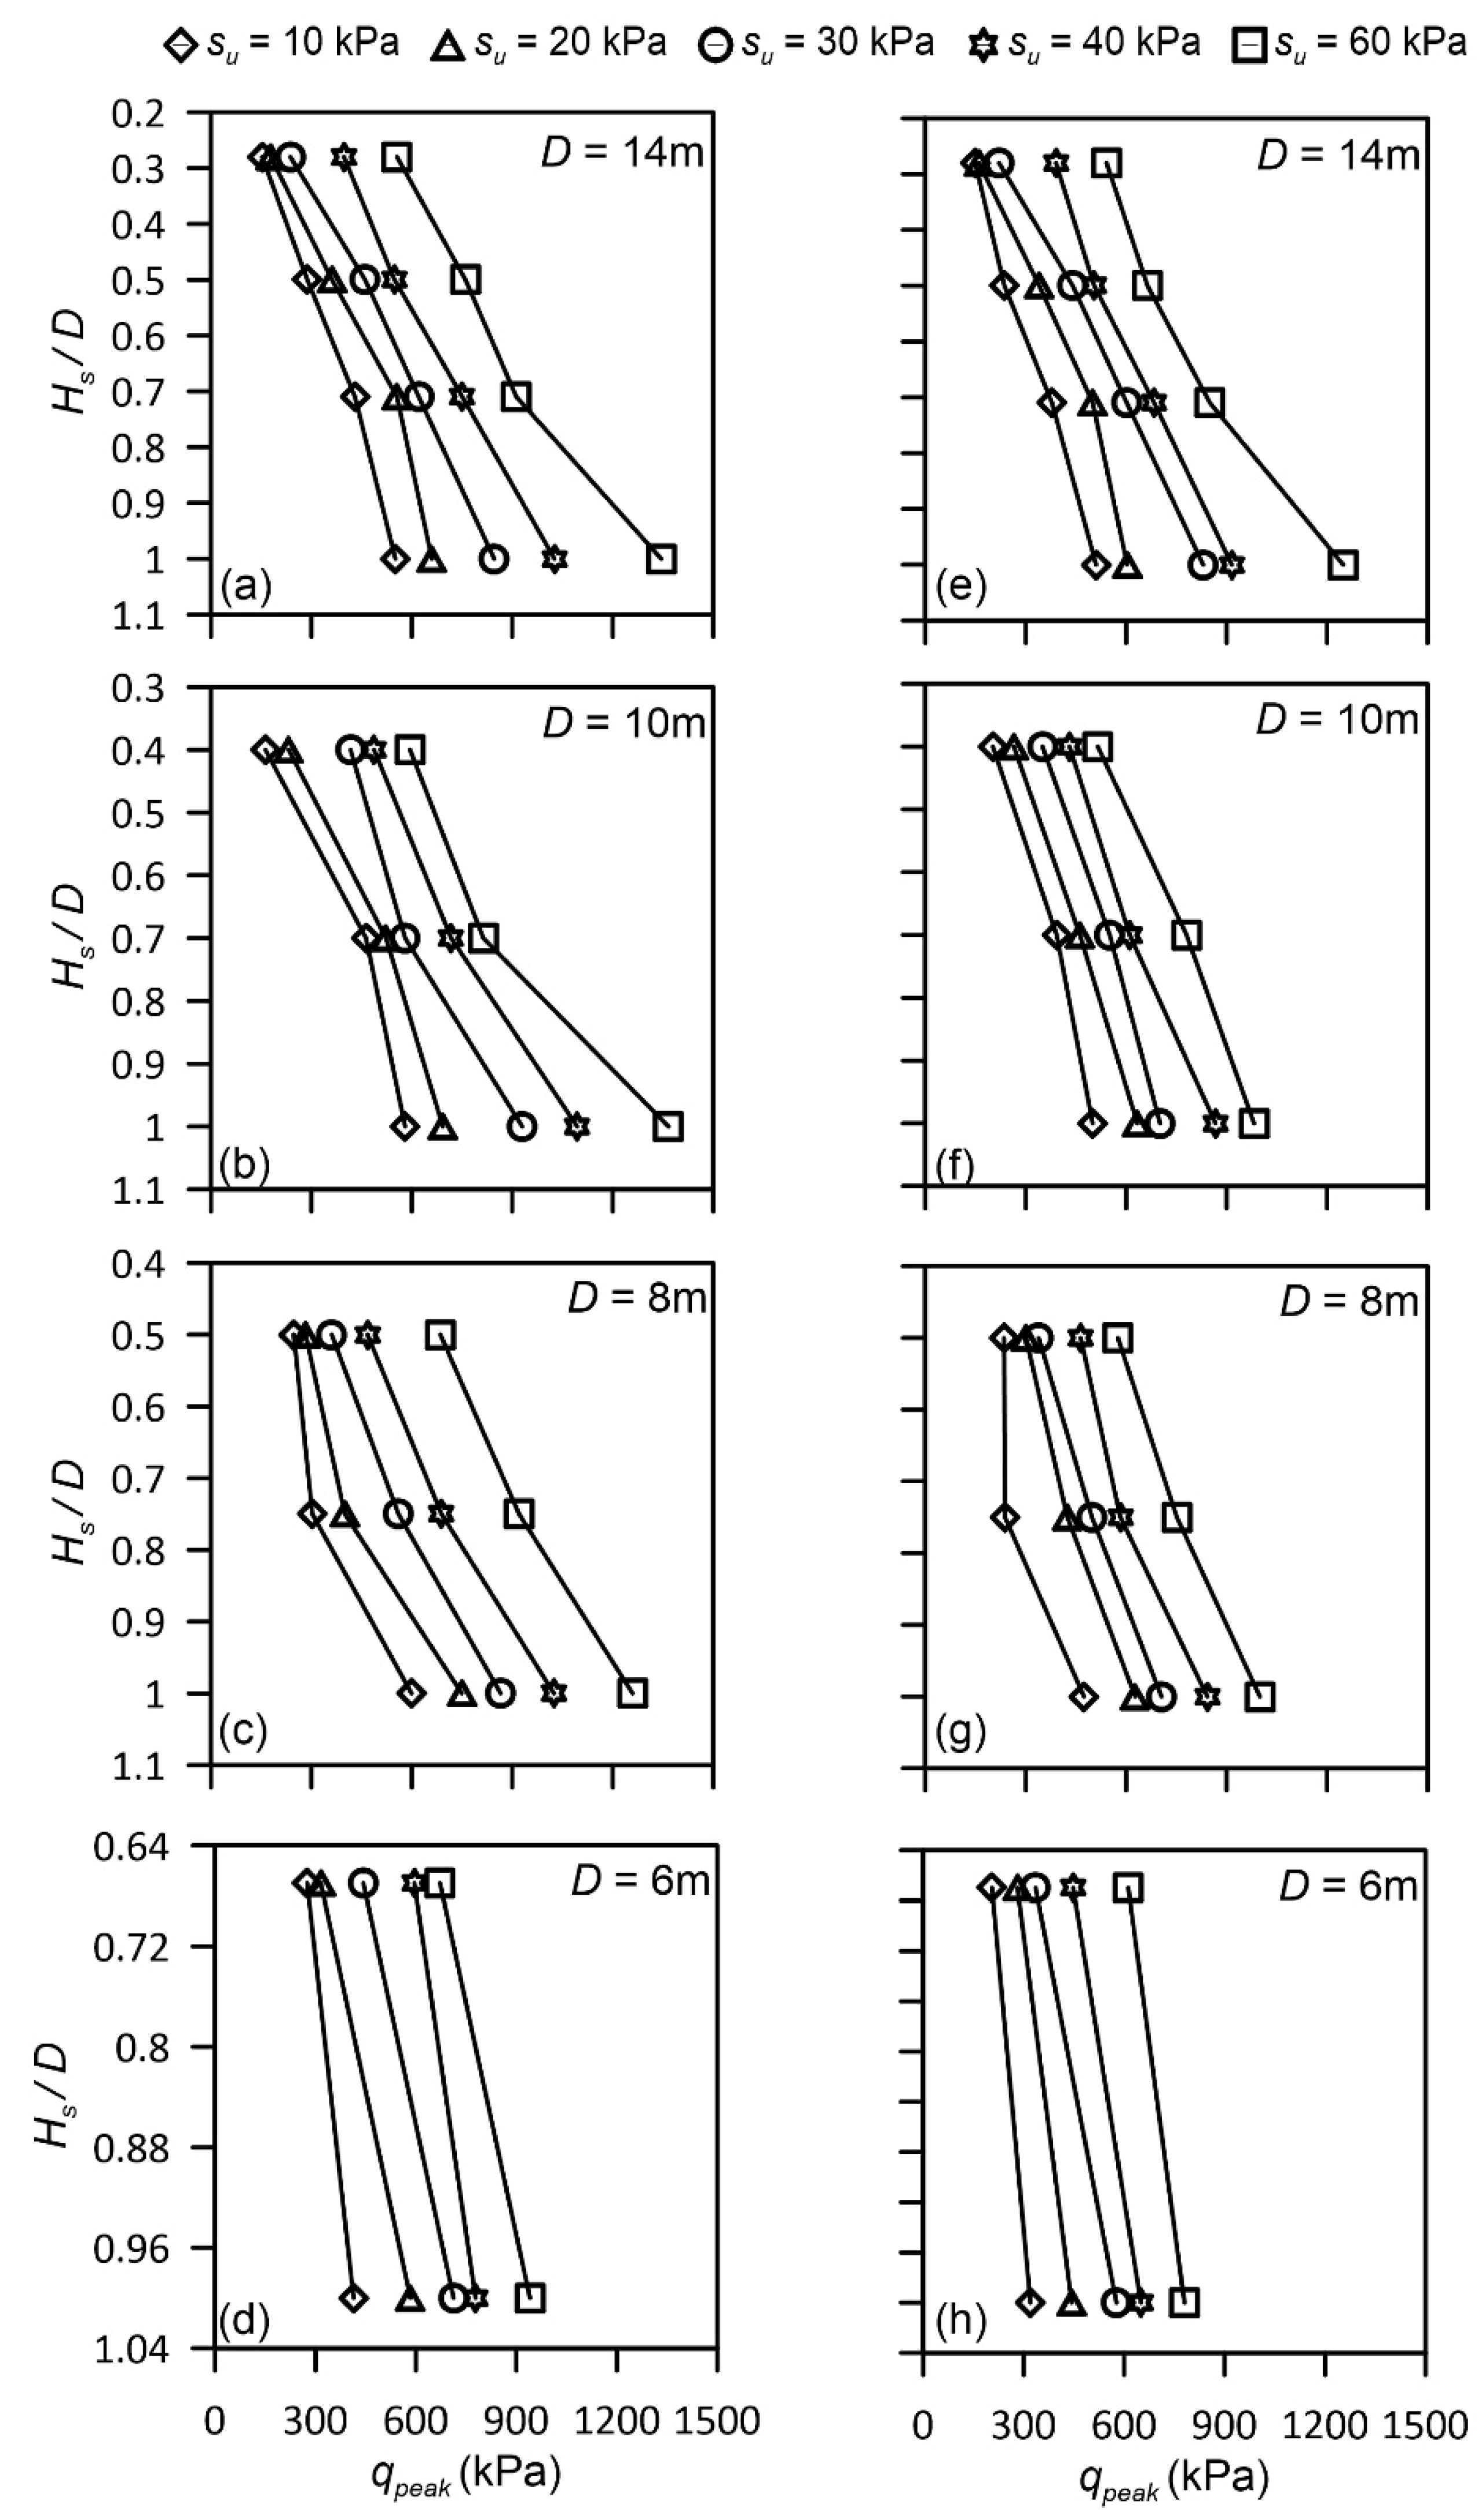
Figure 8 shows the results of all calculated
qpeak.
qpeak is revealed to be positively correlated with
Hs/D,
D, ϕ′, and
su. The calculated
qpeak are compared with those estimated by theoretical models of Lee et al. [
11] and Hu et al. [
12] in
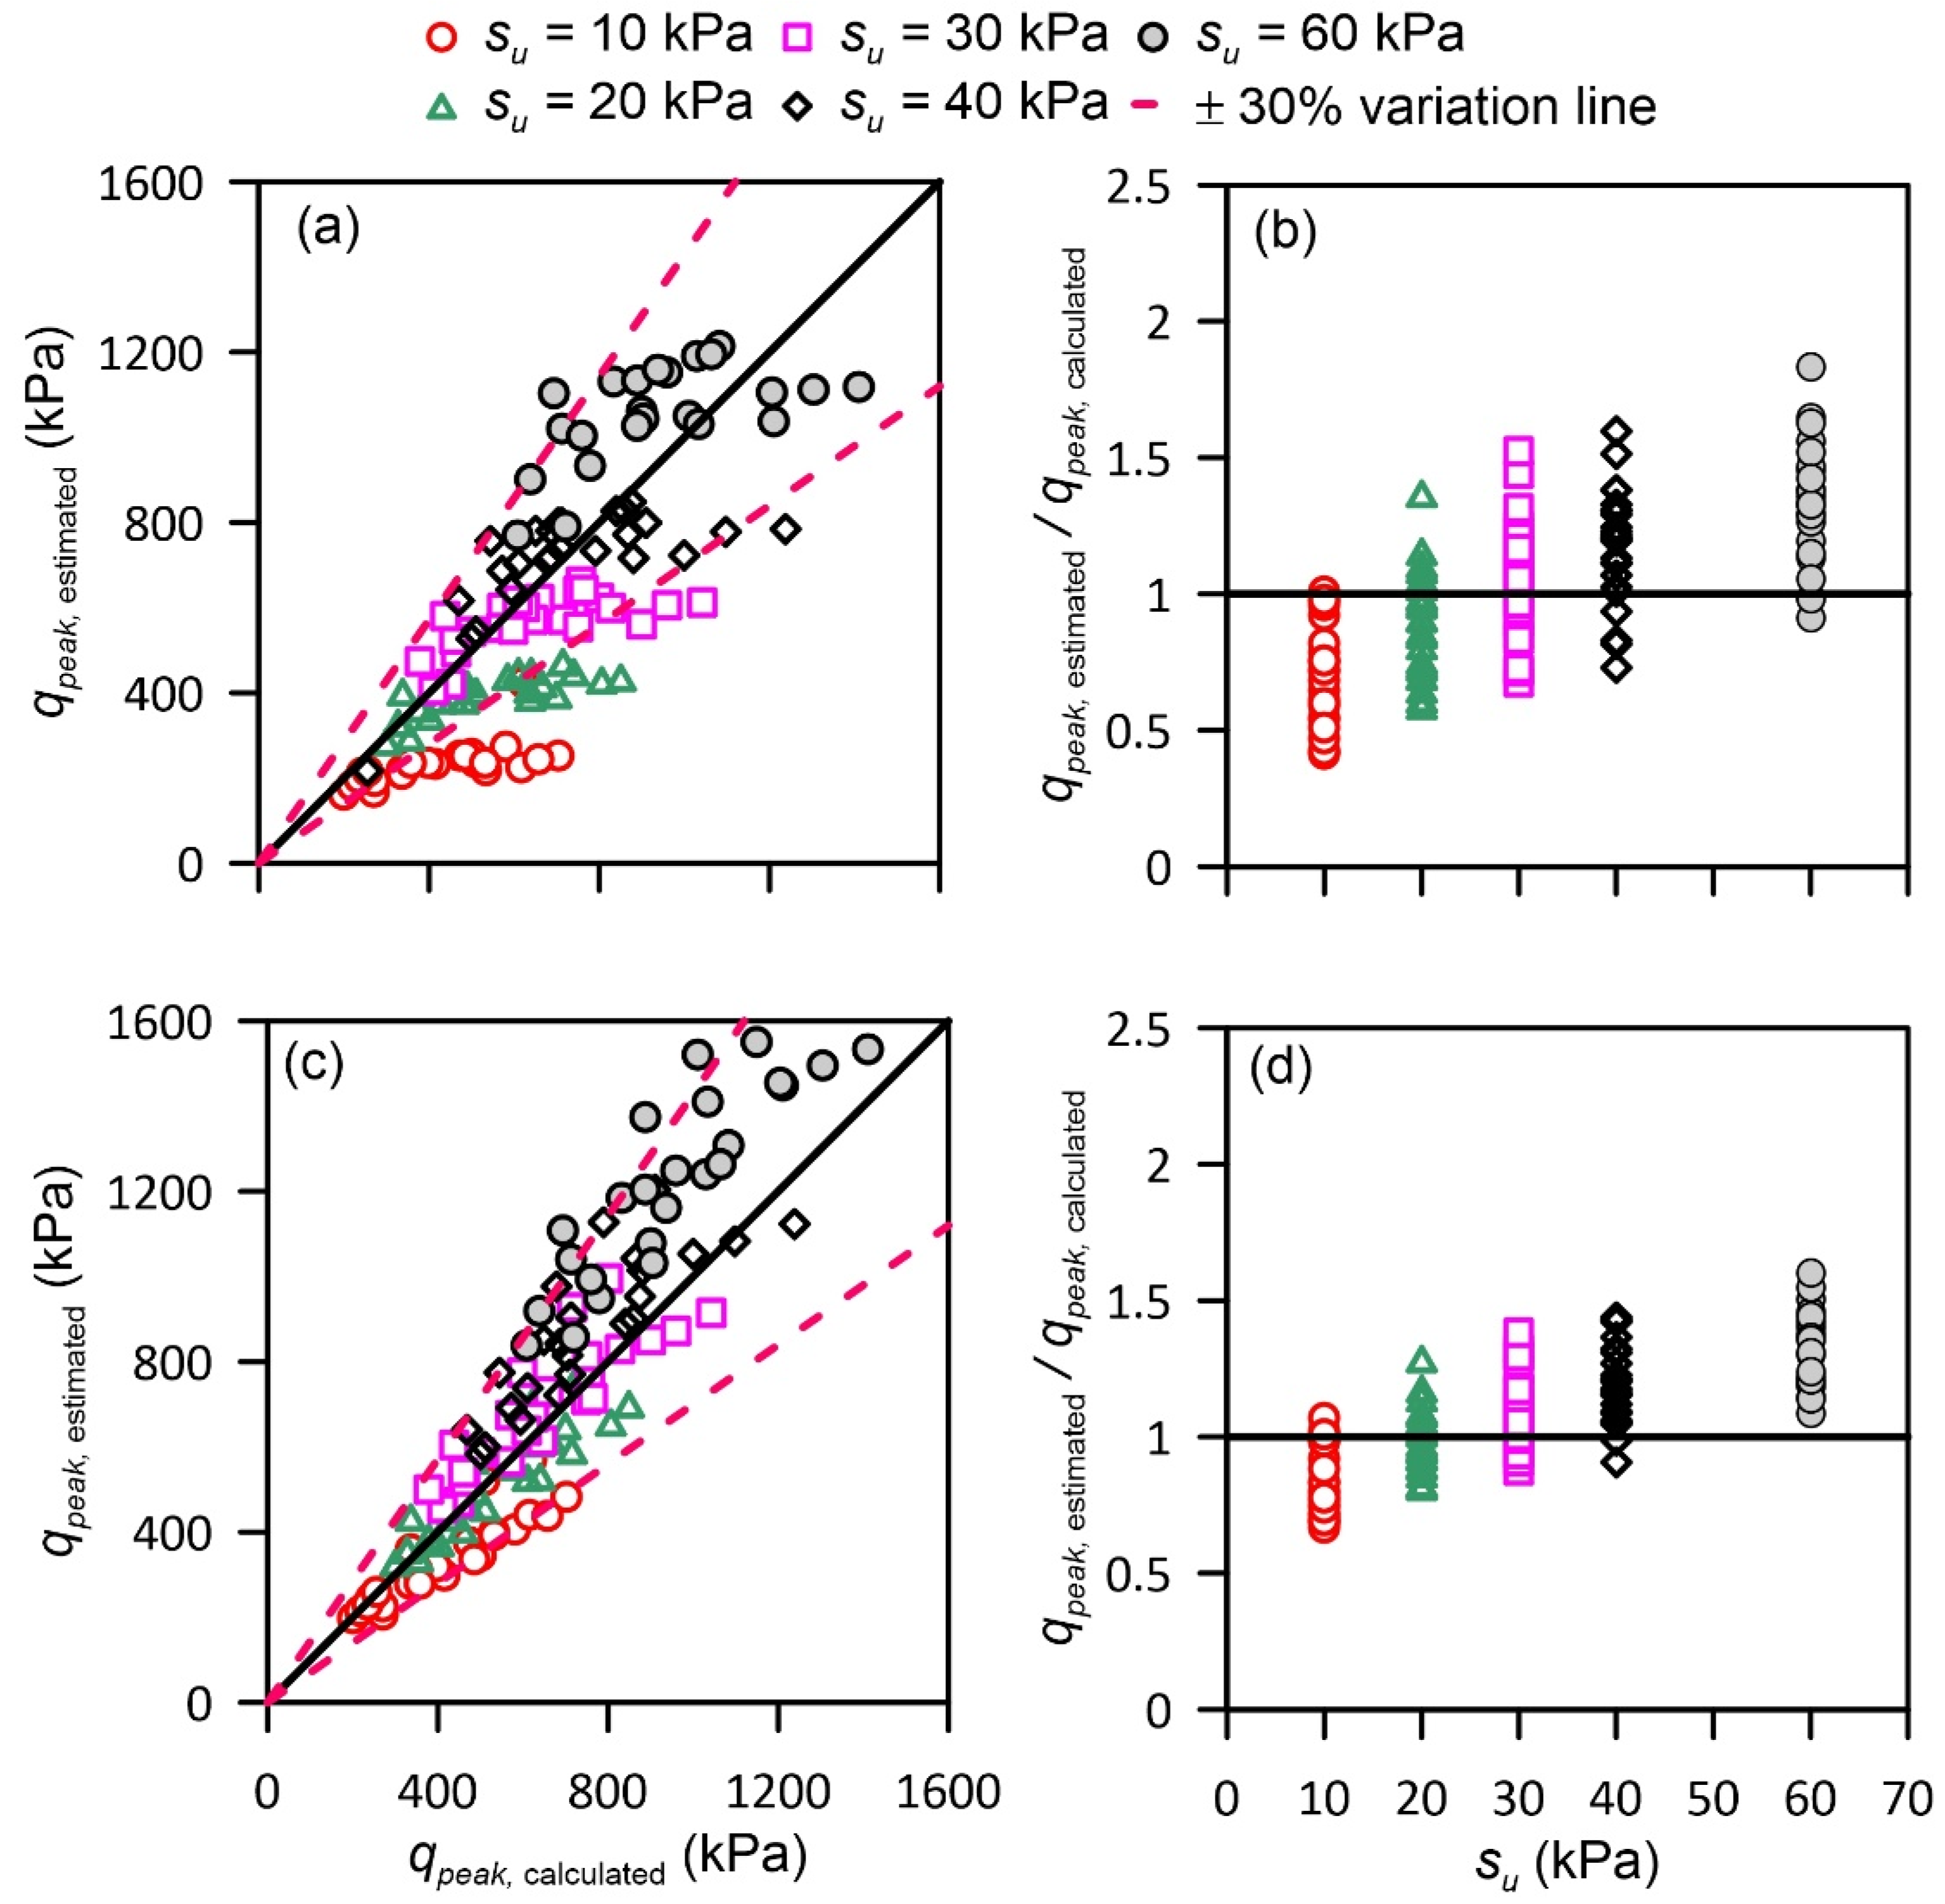
Figure 9.
It should be noted that both the models of Lee et al. [
11] and Hu et al. [
12] require an iterative procedure to determine the operative friction and dilation angles, as summarized in the previous section. Additionally, the relative density of the sand layer needs to be defined. In this evaluation, the relative densities for
ϕ′ = 31° and 35° were defined as 44% and 60%, respectively, based on the empirical correlation of Mujtaba et al. [
29]. The operative friction angles determined from this iterative procedure vary from 33.5° to 36.1° and 32.1° to 34.1° for
ϕ′ = 31° and 35° cases, respectively.
The comparisons show that su has an important influence on the predicted qpeak. It is also demonstrated that the theoretical models provide a reasonable estimate up to su = 20 kPa, which fall within the range of data from which the models were developed. This overestimation is caused by the empirical correlations for DF, which are only dependent on Hs/D. qpeak increases linearly with su, thus not capturing the reduction in the mobilized area of the bottom clay layer which produces a lower capacity.
Following the approaches of [
11,
12], an empirical correlation for
DF was developed through a trial-and-error process.
DF was varied until
qpeak predicted by the theoretical model of Hu et al. [
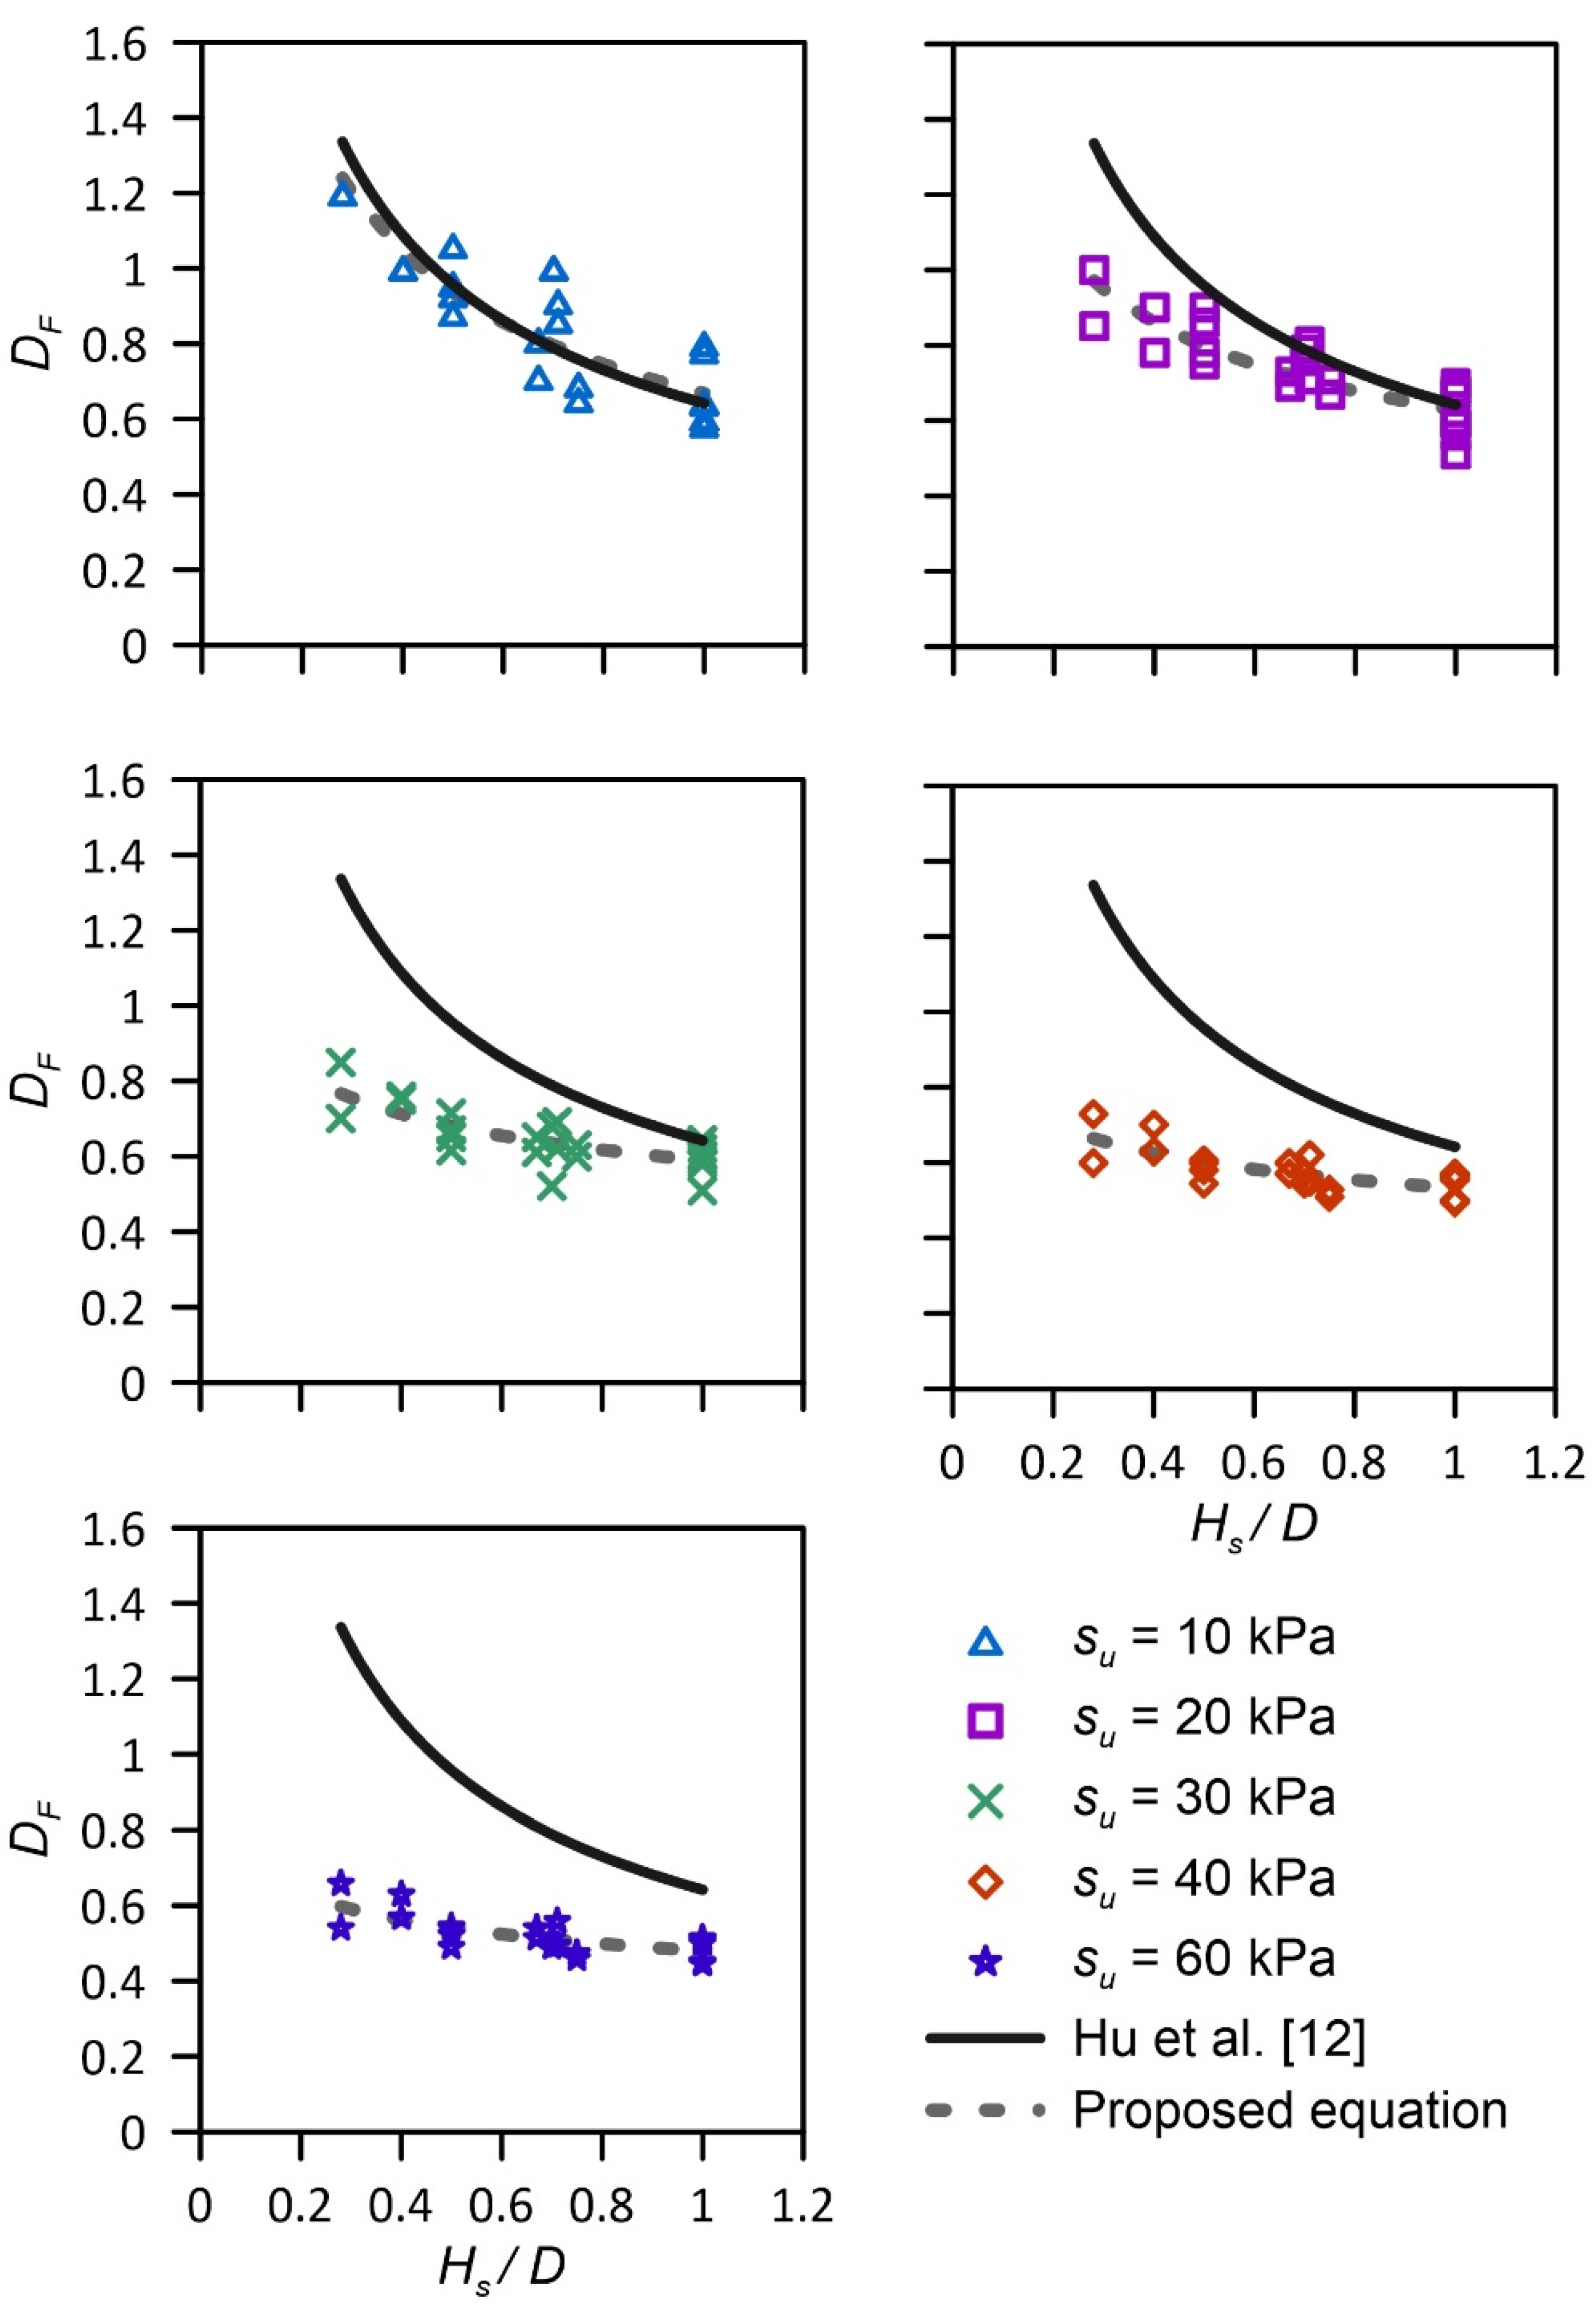
12] most favorably fit the calculated output. It should be noted that the iterative procedure to determine the operative friction and dilation angles were not used, because it requires an additional assumption for the relative density, which is most often not provided. Instead, the friction and dilation angles used in the simulations were applied as operative angles, because comparisons demonstrate that this additional step has marginal influence on the calculated response for the cases used in this study. The back-calculated
DF values are plotted against
Hs/D for the range of selected
su in
Figure 10. The
DF relationship proposed by Hu et al. [
12] is also plotted in
Figure 10 for comparison purposes. It is demonstrated that
DF is strongly dependent on both
Hs/D and
su.
DF is shown to be negatively correlated to both
Hs/D and
su. For all
su values, the variation in
DF is more significant for
Hs/D < 0.5. It is also illustrated that the relationships are non-linear. A new relationship for
DF accounting for the influence of
su in addition to
Hs/D is as follows:
where
pa is the atmospheric pressure. The equation is applicable for the range applied in this study, which is 0.28 ≤
Hs/D ≤ 1.0
.The proposed equation is compatible with the
qpeak model of Hu et al. [
12].
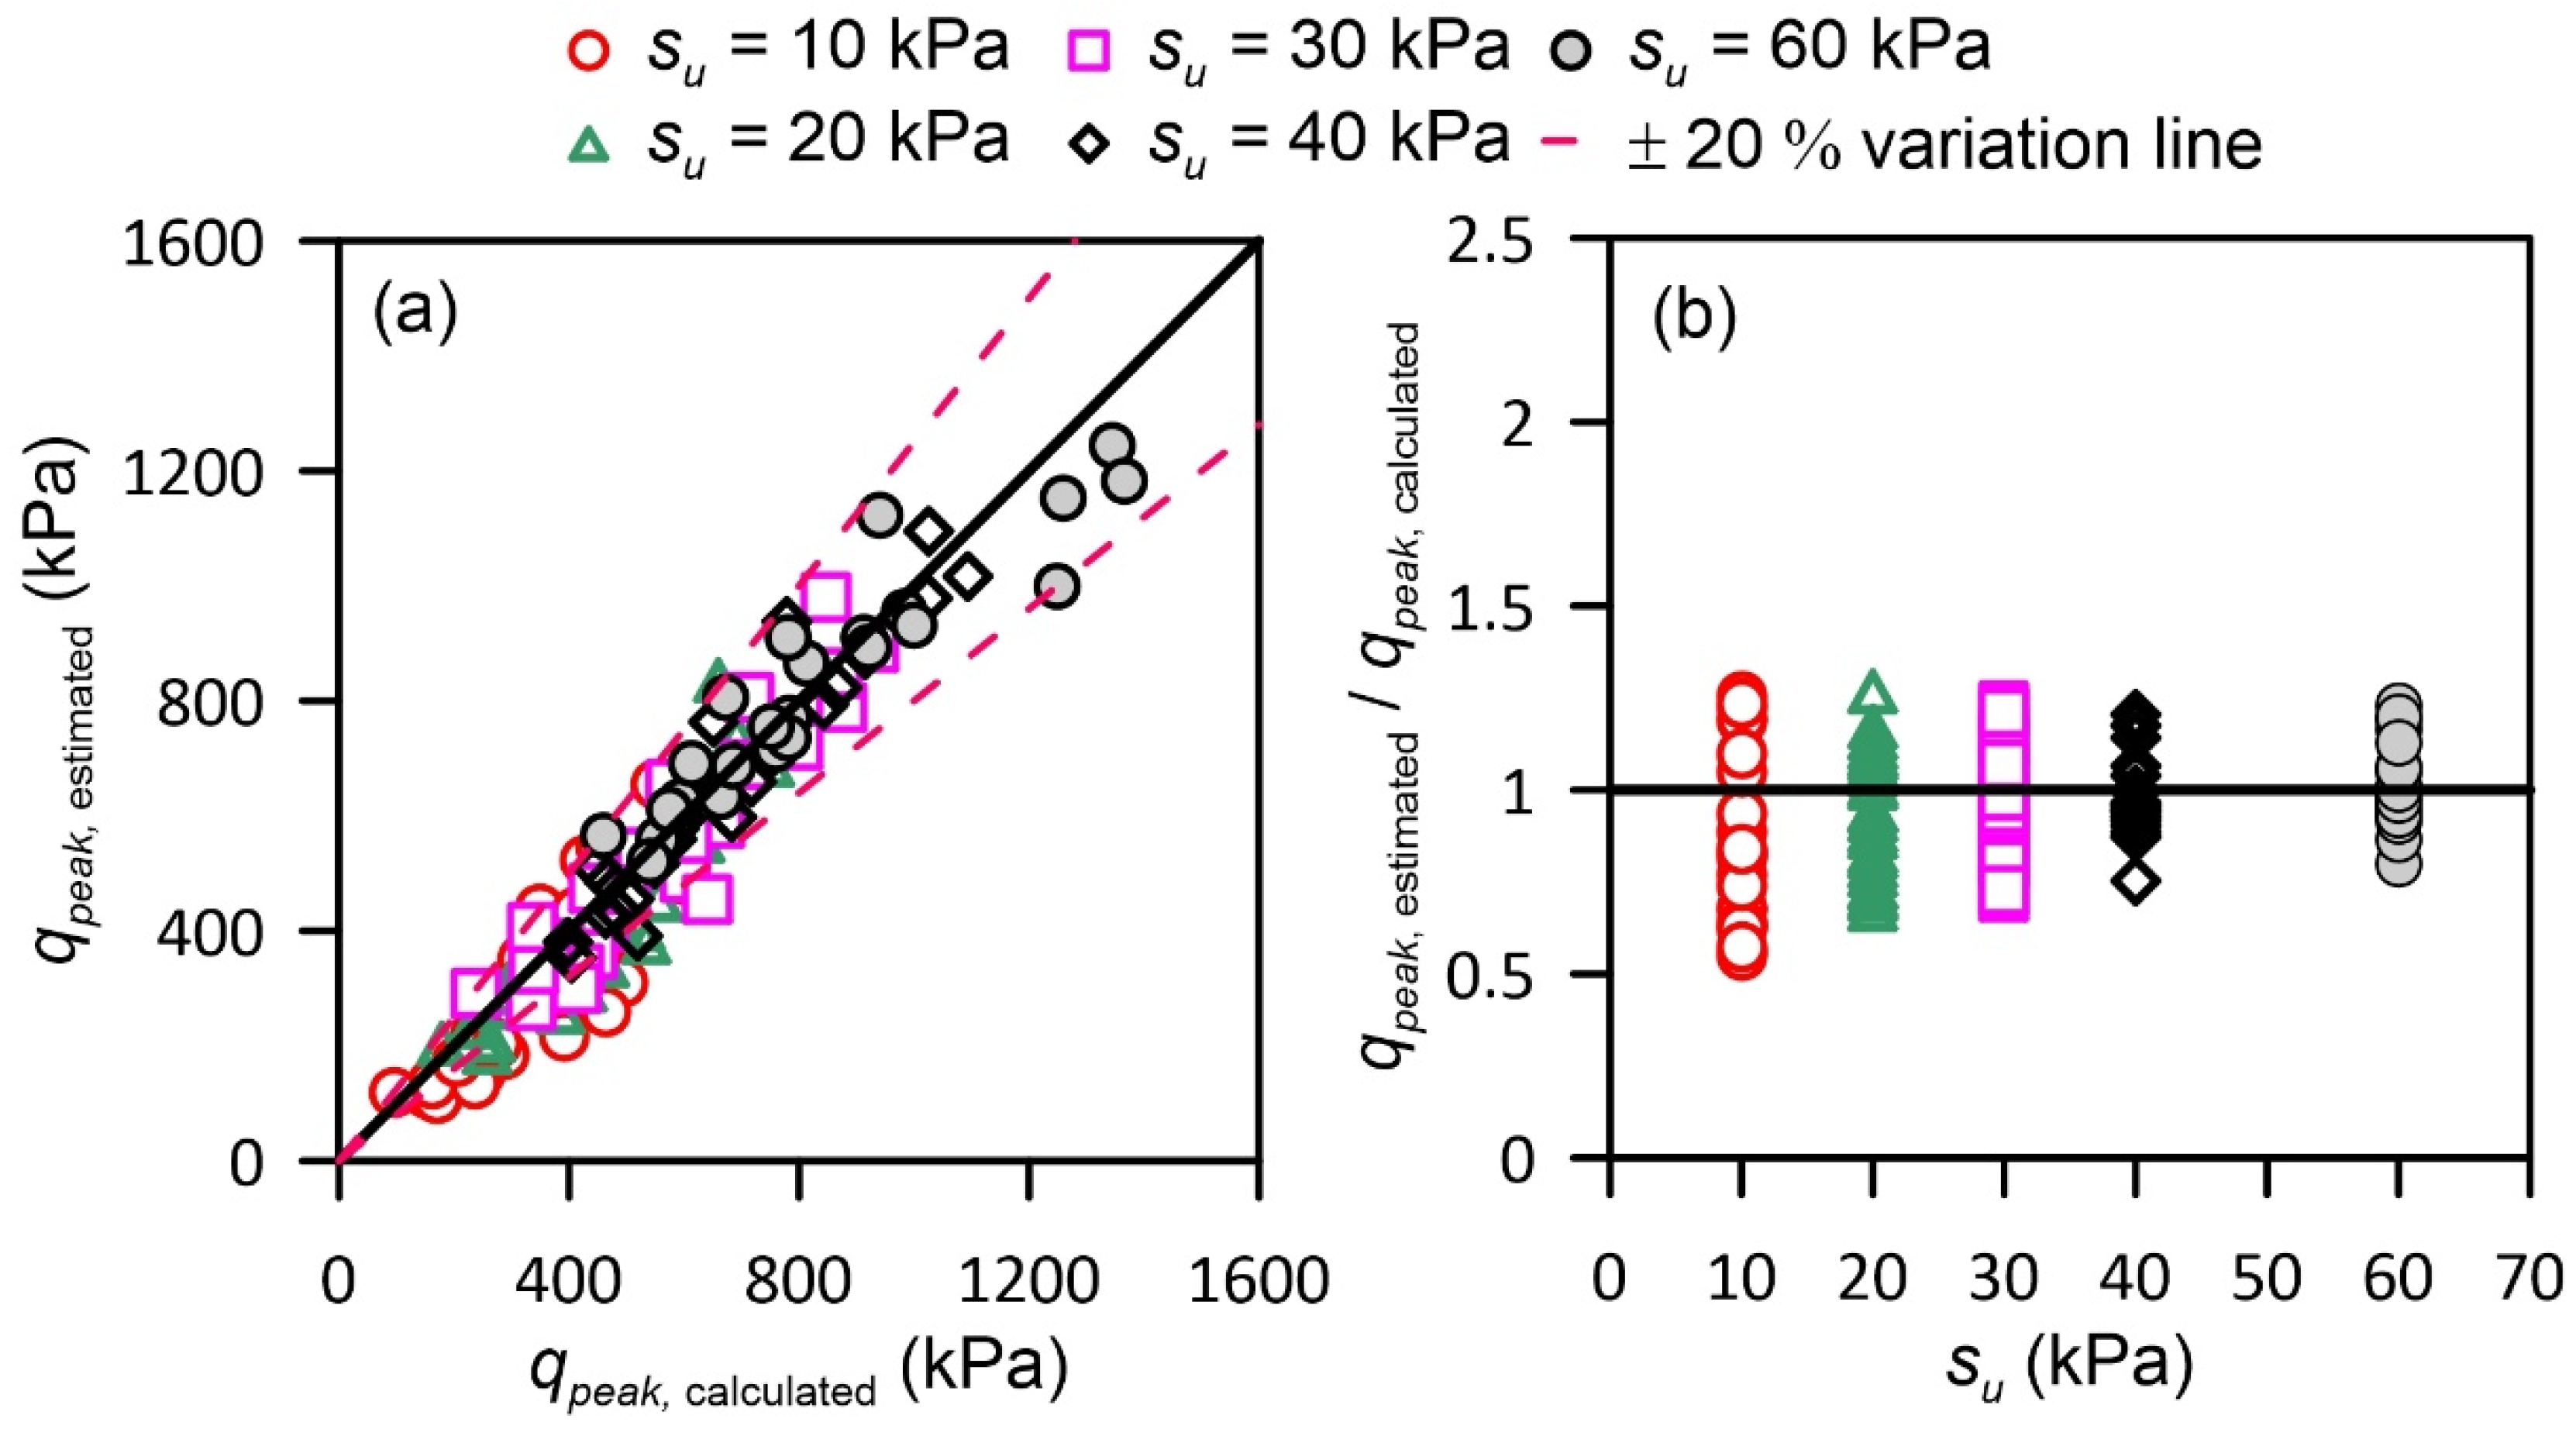
Figure 11 compares the predicted peak penetration resistances with the numerically calculated outputs. The residuals between the numerically calculated and the predicted peak resistances are within 20%. The comparisons highlight that the proposed equation provides reliable estimates of peak penetration resistance even for stiff clays with
su up to 60 kPa.
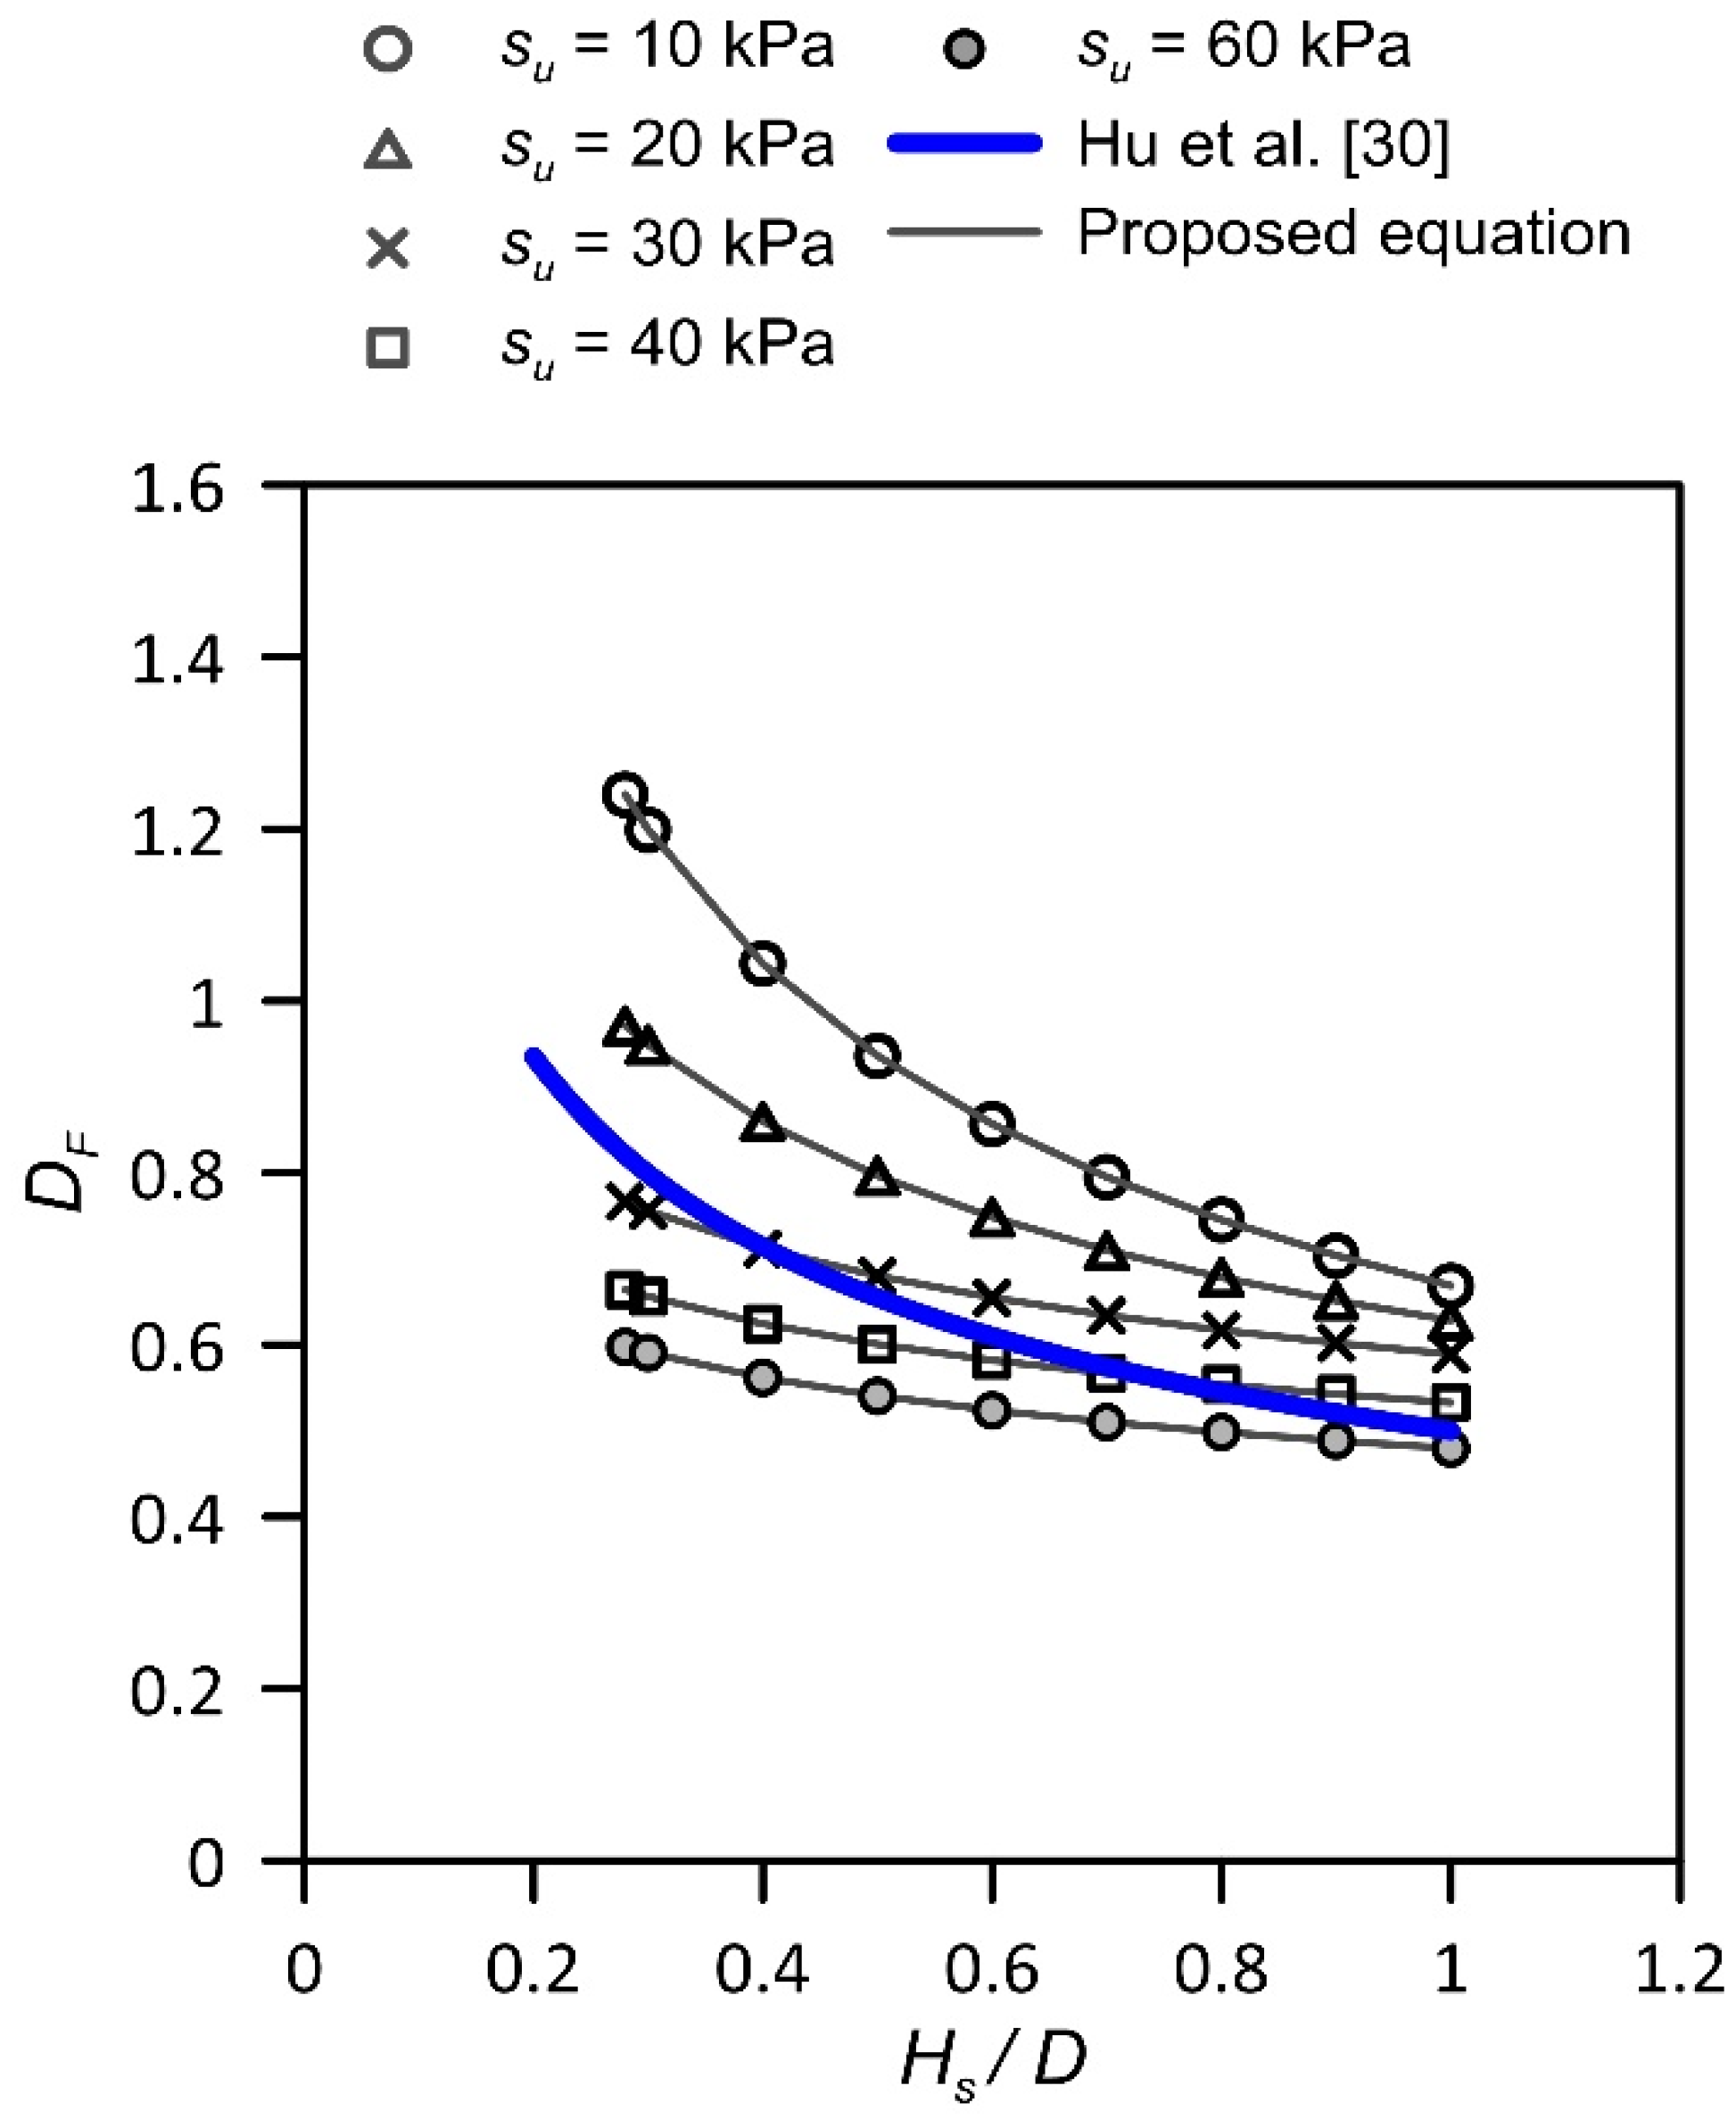
The proposed equation is also compared with the Hu et al. [
30]
DF relationship. Hu et al. [
30] proposed an analytical model for calculation of the post-peak penetration resistance in sand over clay soils using measurements from centrifuge tests. The post-peak failure was reported to occur at a depth of
dpost-peak = 0.3
Hs. A database of 66 centrifuge tests was used to calibrate a new
DF relationship dependent on
Hs/D:
where
d is the penetration depth. The applicable range of
d is from
0.3Hs to
Hs. The reported equation is not dependent on
su.
Figure 12 compares the calculated values of
DF using Equation (12) and the empirical equation of Hu et al. [
30]. The equation of Hu et al. [
30] approximately falls between the calculated values for
su = 30 and 40 kPa. Because the equation is not dependent on
su, it does not capture the range of factors from soft to stiff clays well.


