Article

The Assisted Positioning Technology for High Speed Train Based on Deep Learning

1
Institute of Electromagnetic Compatibility, Beijing Jiaotong University, Beijing 100044, China
2
Beijing Engineering Research Center of EMC and GNSS Technology for Rail Transportation, Beijing 100044, China
*
Author to whom correspondence should be addressed.
Appl. Sci. 2020, 10(23), 8625; https://doi.org/10.3390/app10238625
Submission received: 1 November 2020 / Revised: 25 November 2020 / Accepted: 1 December 2020 / Published: 2 December 2020

Abstract

:
In the positioning process of a high-speed train, cumulative error may result in a reduction in the positioning accuracy. The assisted positioning technology based on kilometer posts can be used as an effective method to correct the cumulative error. However, the traditional detection method of kilometer posts is time-consuming and complex, which greatly affects the correction efficiency. Therefore, in this paper, a kilometer post detection model based on deep learning is proposed. Firstly, the Deep Convolutional Generative Adversarial Networks (DCGAN) algorithm is introduced to construct an effective kilometer post data set. This greatly reduces the cost of real data acquisition and provides a prerequisite for the construction of the detection model. Then, by using the existing optimization as a reference and further simplifying the design of the Single Shot multibox Detector (SSD) model according to the specific application scenario of this paper, the kilometer post detection model based on an improved SSD algorithm is established. Finally, from the analysis of the experimental results, we know that the detection model established in this paper ensures both detection accuracy and efficiency. The accuracy of our model reached 98.92%, while the detection time was only 35.43 ms. Thus, our model realizes the rapid and accurate detection of kilometer posts and improves the assisted positioning technology based on kilometer posts by optimizing the detection method.

1. Introduction

A train operation control system is the basis of a safe and efficient operation of a railway, and train positioning technology is a key factor in operation control. Accurate and reliable positioning information is the premise of ensuring safety, efficiency and providing the best service [1,2]. Traditional train positioning technology mainly includes track circuit, query/balise, and speed measurement positioning, as well as positioning based on odometer cumulative ranging. These positioning methods often have the problems of single structure, low positioning accuracy and error accumulation, which can not meet the increasingly complex system structure and high-speed running of trains [3,4,5]. With the continuous development of GPS, GLONASS and the Beidou satellite, navigation technology is applied to the field of train positioning to achieve high precision, real-time and strong continuous self-positioning of the train, which can greatly reduce the use of ground equipment, cost of construction and operation, and improve the efficiency of train operation [6]. However, positioning technology based on satellite navigation is inevitably affected by potential multipath errors in urban or sub-urban environments, such as ephemeris, satellite clock, ionosphere, tropospheric, and propagation delay errors, as well as inherent errors generated during the positioning process by receiver internal noise, which will affect the position estimation result [7]. In recent years, many scholars have proposed integrated positioning technology which combines the positioning method based on satellite navigation with other positioning methods, and greatly improves the positioning accuracy [8,9,10]. However, in the commonly used integrated positioning system, the problem of cumulative error still exists [11]. Therefore, after referring to the laying rules of the kilometer posts, some scholars propose the use of image recognition technology to correct the positioning system at a specific position, and use the absolute position information of the kilometer posts to eliminate the accumulated error, so as to achieve fixed-point correction [12,13,14]. The premise of using the absolute position information of kilometer posts is to detect and locate the kilometer post quickly and accurately. Then, the kilometer post can be identified to obtain the absolute position information. At present, the detection and location methods of kilometer posts mainly include the location method based on image edge, morphology, textural features and color division [15,16,17], as well as the combination method based on color and projection [12]. To sum up, the general kilometer post detection is implemented by using traditional methods. These methods are complex, time-consuming and inefficient, and they do not fully consider the influence of interference in the real environment such as different weather or trackside objects.
The aim of this work is to optimize the kilometer post detection method, so as to improve the assisted positioning technology based on kilometer posts. In recent years, deep learning has achieved good application results in many research fields [18,19], especially for license plate and road sign detection and recognition in the field of autonomous driving [20,21]. At present, the deep learning algorithms that are commonly used in object detection can be divided into two categories—region- and regression-based detection algorithms. The region-based detection algorithm typically includes the pre-processing step of the candidate boxes hypothesis, and the whole detection process includes two stages. The potential object candidate boxes are assumed in the first stage, and then the convolutional features of the candidate regions are extracted. Finally, the candidate boxes are cetegorized by the classifier, and the locations are regressed [22]. The detection process of the regression-based detection algorithm is simple and fast [23]. It does not contain the candidate boxes hypothesis and the feature re-sampling stage. All the computation is encapsulated in a unified network, and the results of object detection and location regression can be obtained directly by the forward operation. The optimization training can be carried out in an end-to-end manner. The commonly used region-based detection algorithms are Region-Based Convolutional Neural Network (R-CNN), Fast R-CNN, Faster R-CNN [24] and so on. Although the detection speed of this kind of algorithm is grealty increased, it is still slow and cannot meet the real-time requirements. The regression-based detection algorithm mainly includes a series of You Only Look Once (YOLO) [25] algorithms and an SSD [26] algorithm. The YOLO algorithm is a further improvement on R-CNN, with a faster detection speed; however, the detection accuracy is reduced. The SSD algorithm places multiple default boxes with different aspect ratios in each pixel position of the feature map with different resolutions, and uses the same regression as that of YOLO to regress the feature maps with different receptive fields. Therefore, SSD not only ensures the detection speed, but also achieves a detection accuracy comparable to that of Faster R-CNN [27]. Therefore, among all the algorithms, the SSD algorithm achieves a good balance between detection speed and accuracy, making it more suitable for practical application [28]. Furthermore, many scholars have optimized SSD algorithms and proposed a more general object detection network [29,30,31]. In reference [31], an improved SSD detection model named ZRNet was proposed. The experimental results show that it is better than other commonly used deep learning detection networks. Both the detection accuracy and efficiency are improved. Therefore, in this paper, a kilometer post detection model based on an improved SSD algorithm is established. First of all, the superiority of the model was ensured by inheriting the optimization ideas of reference [31]. Then, because the detection object in this paper is only the kilometer post, that is, compared with [31], the detection object was single and there was no overlapping phenomenon. Therefore, in order to improve the detection efficiency, the model was further simplified. We deleted the complex Z-style structure and residual network, and only extracted the backbone network of ZRNet for modeling. In addition, we also reduced the number of anchor boxes from 4 to 2.
Furthermore, the establishment of a detection model based on an improved SSD algorithm needs a large number of kilometer post data for training and validation, but the data are not easy to obtain. There are many methods for sample expansion, which are mainly divided into the traditional method and Generative Adversarial Networks (GAN) [32]. The traditional methods mainly include rotation transform, flip transform, scale transform, gray-scale transform, noise disturbance and combination transform [33]. Although these methods can achieve sample expansion, the number of generated samples is limited, and the generated samples contain fewer features. As an improved model of GAN, DCGAN [34,35,36] has strong feature extraction ability and the generated samples are closer to the real samples. Therefore, this paper first introduces the DCGAN generation algorithm for sample expansion, and then realizes the data set.
As a summary, the key contributions and innovations of our study can be summarized as follows. Firstly, by introducing the DCGAN generation algorithm, the effective data set of kilometer posts was constructed based on a small amount of real data. This not only greatly reduced the cost of real data acquisition, but also provided a prerequisite for the construction of a kilometer post detection model. Secondly, the superiority of the model was ensured by using the optimization methods in reference [31]. Furthermore, through the analysis of specific application scenarios, the model was further simplified. This not only ensured the detection accuracy, but also improved the detection efficiency of the model, and realized the optimization of the kilometer post detection method.
The remainder of this paper consists of five parts. In Section 2, the works related to our study are introduced. In Section 3, the principle of the DCGAN algorithm and the construction process of a data set based on DCGAN are presented. In Section 4, the basic principle and structure of the SSD algorithm are explained, and the setting of the detection model based on the improved SSD algorithm is elaborated. The experimental results are analyzed in Section 5. Finally, the conclusions are given in Section 6.

2. Related Works

This section provides a brief review of key methods in our kilometer post detection task. Firstly, in order to optimize the traditional kilometer post detection method, this paper proposes an object detection algorithm based on deep learning. In addition, because there are fewer actual kilometer post data and they are difficult to collect, the sample expansion method based on DCGAN is introduced.

2.1. Object Detection

The main purpose of this paper is to establish a detection model that can detect and locate the kilometer post quickly and accurately. The existing studies on the detection and location of kilometer posts are all based on traditional methods. For example, reference [12] used a combination method based on color and projection to detect and locate kilometer posts. The concept of visual balise is proposed in [13], and the interference effect of other white garbage is considered in the process of detecting kilometer posts. In addition, the RDS company in Europe has developed a train positioning method based on image sequence [14]. They corrected cumulative errors using an image recognition technology to identify kilometer posts, and considered the experimental results in different environments, such as rainy, snowy, nighttime and sunny conditions. However, the kilometer post pictures used in the experiment were processed, which did not detect the actual kilometer post. To sum up, these methods are complex, time-consuming and inefficient, and they do not fully consider the influence of interference such as different weather or trackside objects in the real environment. Therefore, in order to optimize the traditional detection methods, this paper proposes an object detection algorithm based on deep learning.
The object detection algorithm based on deep learning has been successfully applied to many object detection scenarios. Such as, reference [20], which proposed a detection network based on an improved SSD algorithm to realize the real-time detection of traffic signs. Reference [29] proposed a multi-scale object detection network by improving the deep learning algorithm. Reference [30] studied real-time detection and motion recognition based on deep learning and multi-scale feature fusion. In short, there are many kinds of object detection networks based on deep learning, and their performance is better than those of traditional detection methods. Furthermore, among the most common detection algorithms, the SSD algorithm achieves a good balance between detection speed and accuracy, making it more suitable for practical application. Therefore, in this paper, we chose the optimized SSD algorithm for modeling and the model was simplified according to the specific application scenarios. The analysis of the experimental results shows that our design is effective.

2.2. Sample Expansion

Because there are fewer actual kilometer post data and they are difficult to collect, we need to select the appropriate sample expansion method to build the dataset. The sample expansion methods are divided into the traditional method and GANs. The traditional methods mainly include rotation transform, flip transform, scale transform, gray-scale transform, noise disturbance and combination transform. Although these methods can achieve sample expansion, the number of generated samples is limited, and the generated samples contain fewer features. Furthermore, DCGAN—the combination of GAN and CNN—enhances the effect of GAN qualitatively, and it has strong feature extraction ability. Reference [33] first analyzed the drawbacks of traditional sample expansion methods, and then further highlighted that compared with GAN, the speed and accuracy of the DCGAN network have been greatly improved. Reference [34] combined the advantages of DCGAN and conditional GAN, and proposed a conditional DCGAN network, which led to a further enhancement in the feature extraction ability. Reference [35] compared and analyzed many kinds of generation networks obtained by improving GAN, and pointed out that DCGAN has high research value in these networks. To sum up, among many sample expansion methods, DCGAN performs best. Therefore, this paper introduces the DCGAN generation algorithm for sample expansion, and then contructs the data set.

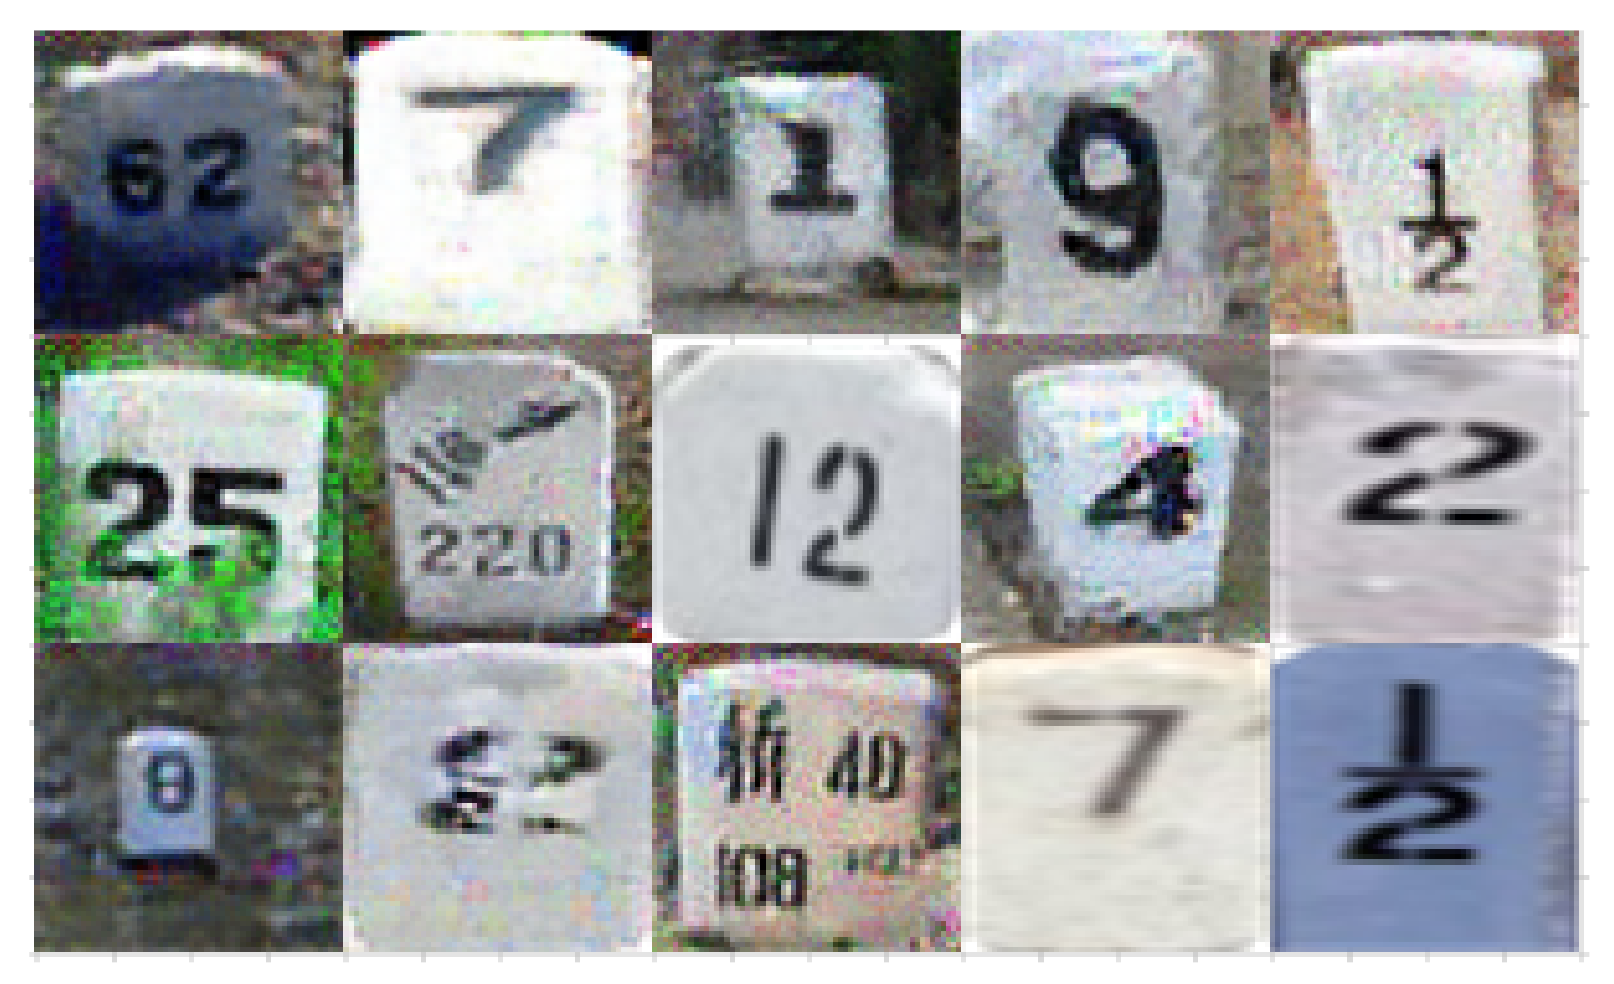
3. The Construction of Data Set Based on DCGAN

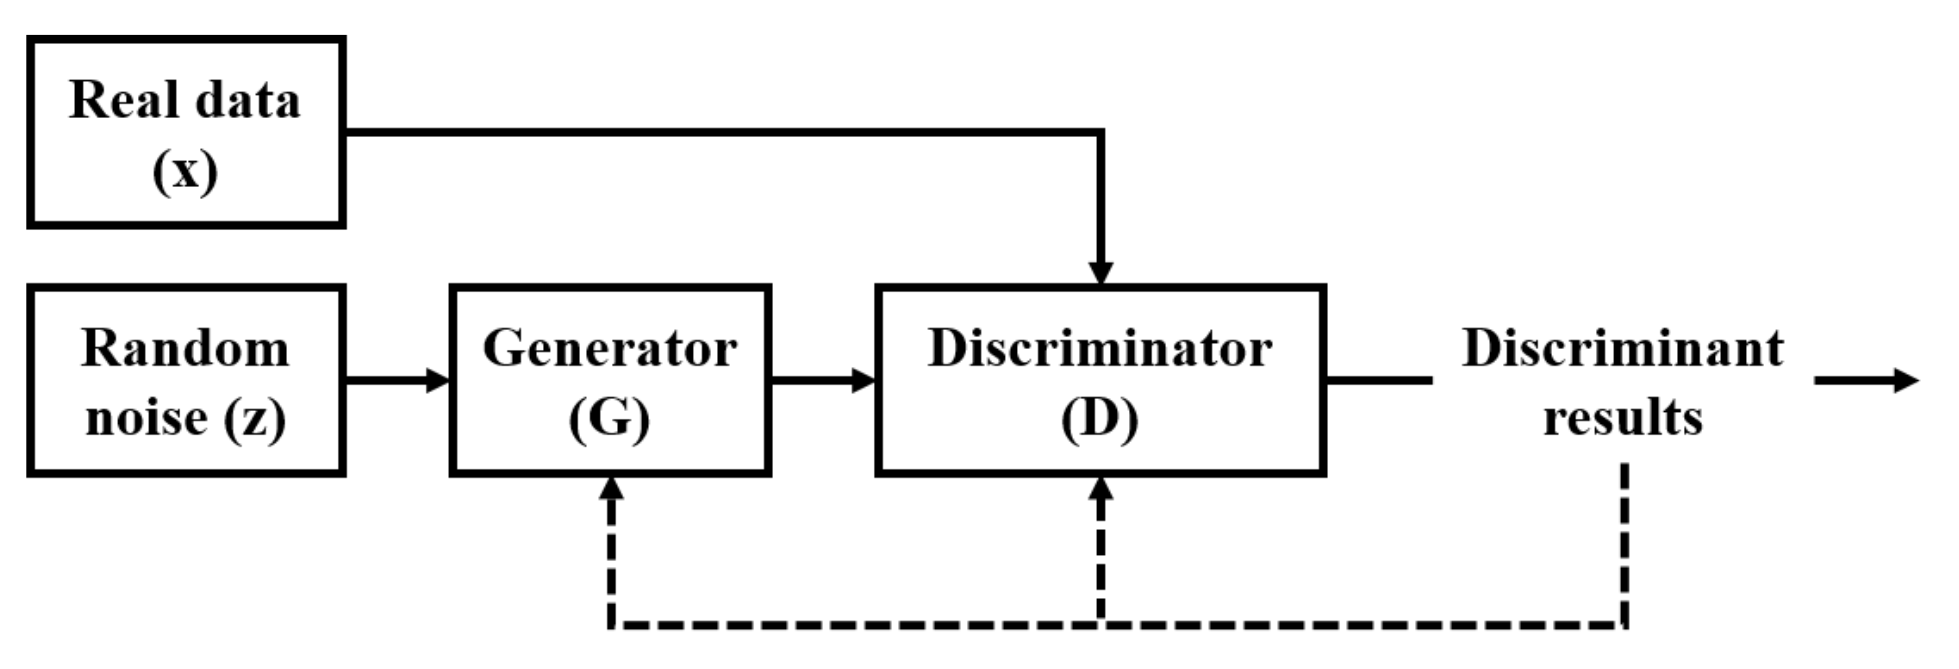
3.1. DCGAN Algorithm

DCGAN introduces the idea of a convolution operation into the generative model to perform unsupervised training, and uses the powerful feature extraction ability of the convolutional network to improve the learning ability of the generative network [36]. It adopts the idea of game theory and is mainly composed of two parts—Generator (G) and Discriminator (D). The D is a typical convolutional neural network twoclassifier. It is a full convolution neural network. It ensures maximum retention of the clarity of feature information and avoids the fuzziness of feature information caused by a pooling layer. The G is also a convolutional neural network in essence, but it requires image features to be restored, so the convolution layer is replaced by the transpose convolution layer. In this paper, the D is designed as a five-layer structure, including four convolution layers and one output layer. The first four layers are convolution layers. Their convolution kernel size is 5 × 5, and the activation function is a leaky-relu function. The last layer is the output layer, and its activation function is the sigmoid function. In order to achieve Nash equilibrium between D and G in the model, it is usually necessary to make their performance consistent, otherwise the model cannot converge easily. Therefore, the setting of G is basically consistent with D, which is also a total of five layers. In addition, because the input of G is a random noise, the data dimension needs to be adjusted to fit the operation, so a full connection layer is added to adjust the data dimension before the transpose convolution layers. The last four layers are transpose convolution layers, and the convolution kernel size is also 5 × 5. The last layer uses tanh as the activation function, and the other layers use relu as the activation function. The basic structure of DCGAN is shown in Figure 1. Compared with GAN, the generator and discriminator of DCGAN use a convolutional layer instead of the fully connected layer, which can generate a higher quality image. As DCGAN is the combination of GAN and CNN, this results in a qualitative enhancement in the effect of GAN, and most of the commonly used generative adversarial networks are improved [34].
In Figure 1, the D is mainly used to discriminate the authenticity of the input data, and the G aims to generate fake data that is very similar to the real data. In the training process, the input of D represents the real data and the fake data generated by G.The task of D is to discriminate whether the input data are real or fake. According to the discriminant results of D, the parameters of D and G are optimized simultaneously. If the discriminant of D is correct, it is necessary to optimize the parameters of G to generate more realistic fake data. On the contrary, if the discriminant of D is wrong, it is necessary to optimize the parameters of D to obtain a more accurate discriminant. A balanced continuous confrontation optimization is needed until the data generated by G are highly simialr to the real data. The detailed training steps and criteria are as follows [35]:
(a)
The input of G is random noise z and the output of it is the generated image G ( z ) . The input of D is real data x and the generated image G ( z ) , and the output of it is D ( x ) and D ( G ( z ) ) .
(b)
The loss function of D is calculated as follows:
D loss = 1 m i = 1 m log D ( x ( i ) ) + log ( 1 D ( G ( z ( i ) ) ) )
where m is the number of samples taken each time. The cross entropy of real samples and generated samples is calculated, and the average value of cross entropy of all samples is calculated as the loss function of D to optimize D.
(c)
The loss function of G is calculated as follows:
G loss = 1 m i = 1 m log ( 1 D ( G ( z ( i ) ) ) )
Formula (2) shows that the cross entropy of the generated samples after D is calculated as the loss function of G to optimize G.
(d)
In the training process, G tries to generate fake data that are as similar as possible to the real data to cheat D, and D tries its best to distinguish between the generated fake data and real data. Finally, they form a game process.
(e)
Repeat the above steps until the network reaches Nash equilibrium [37], that is D ( G ( z ) ) = 0.5 .

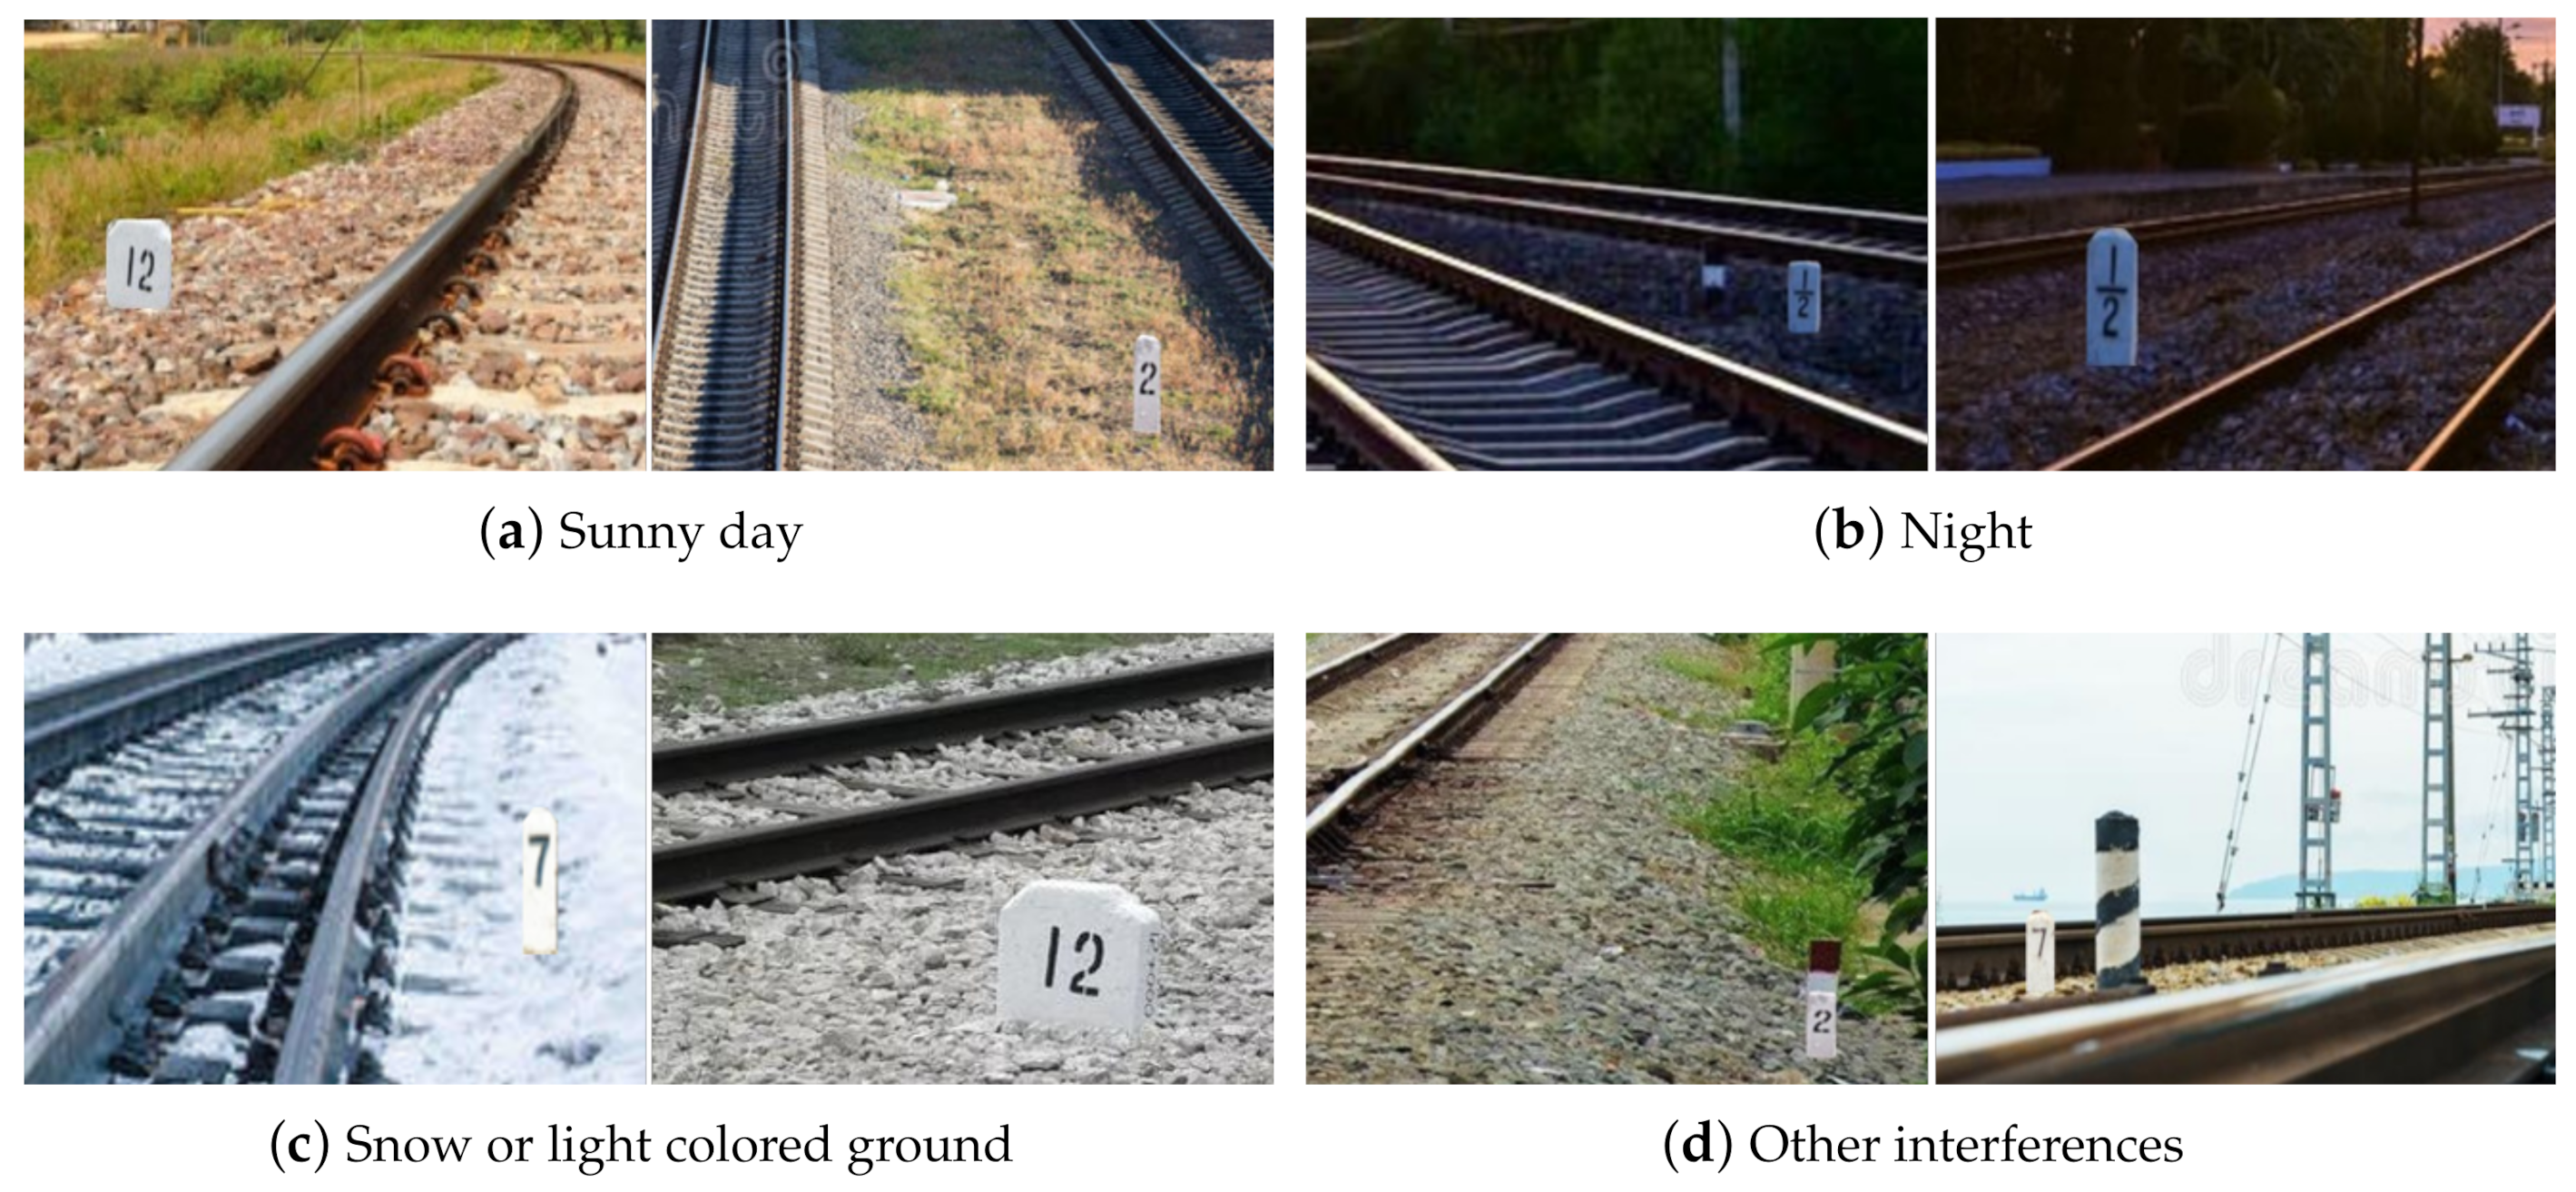
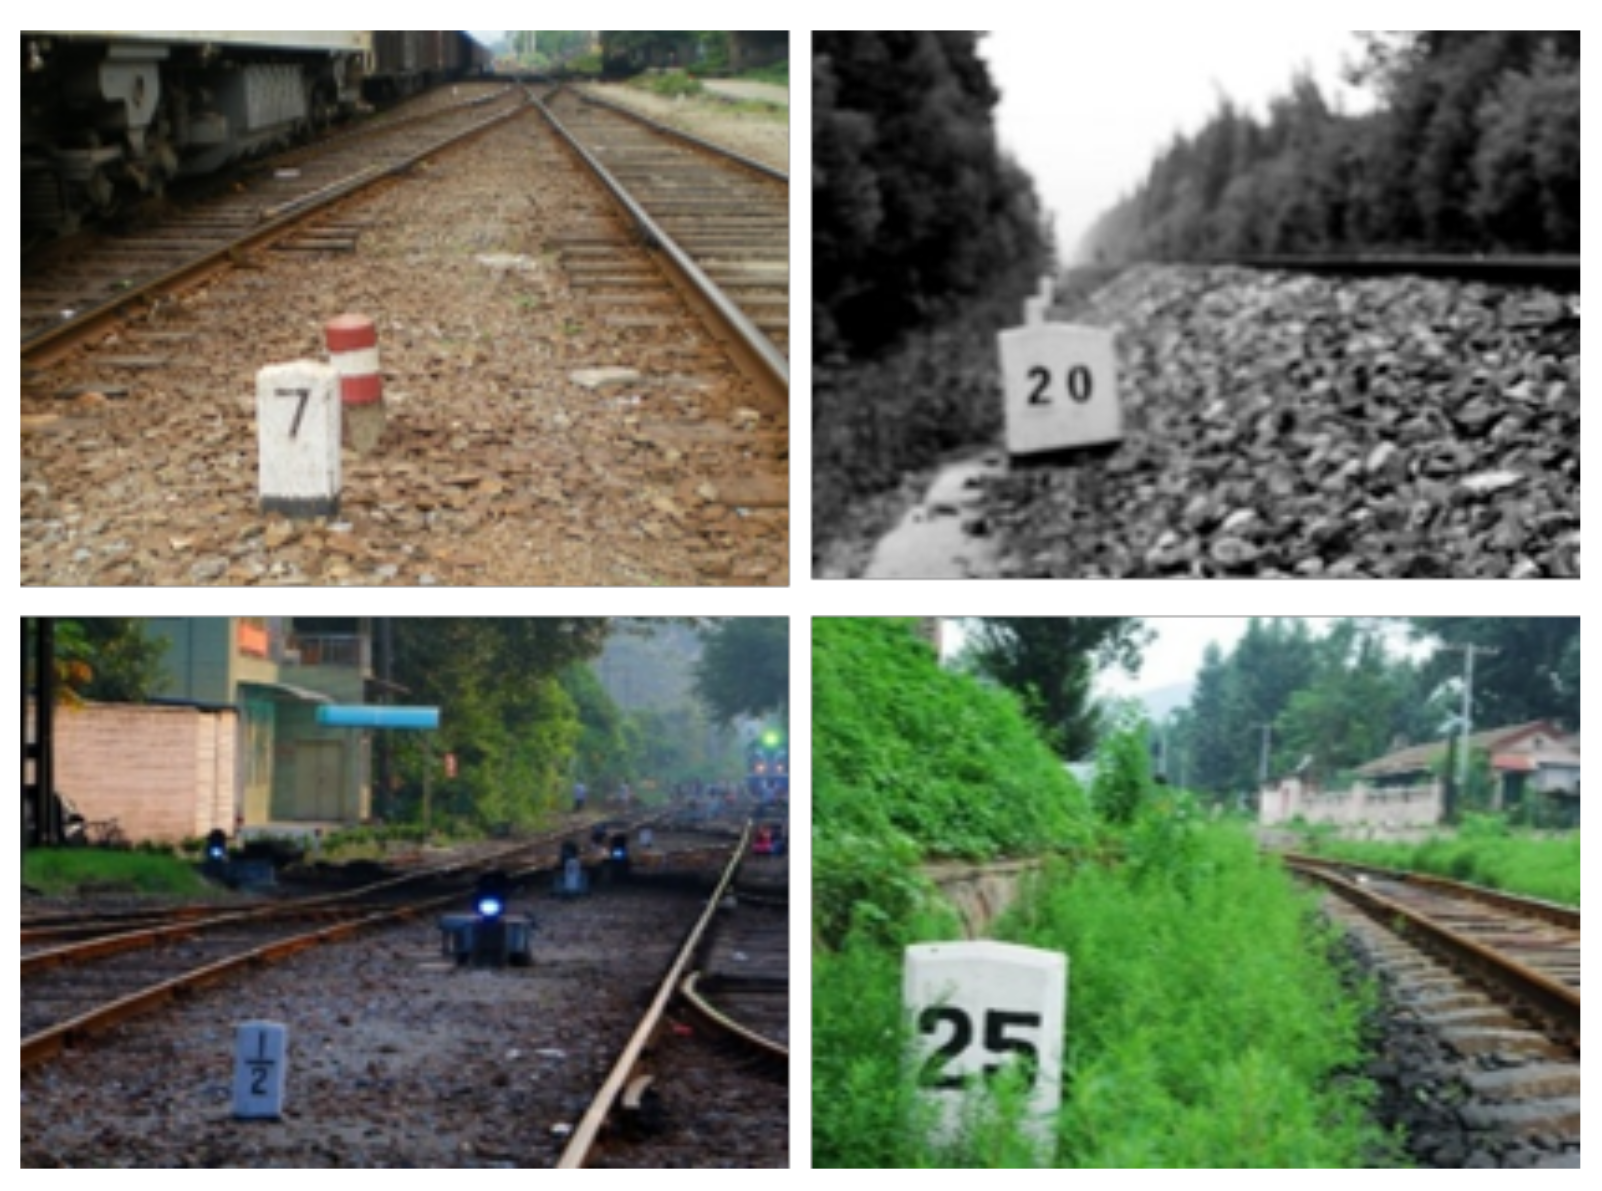
3.2. The Construction of Data Set

A small amount of real kilometer post data is obtained by downloading and filtering from the literature and the Internet, and some of them are shown in Figure 2. Because the kilometer post data that can be found are limited, and it is not easy to obtain in the actual environment, to build an effective kilometer post detection model, this paper uses the DCGAN generation algorithm to construct kilometer post data sets. First, kilometer posts are extracted from the image with a track background. Then, the DCGAN algorithm is used for learning and training. Finally, the kilometer posts generated by the DCGAN model are obtained, as shown in Figure 3.
As can be seen from Figure 3, the features of kilometer posts generated by DCGAN are rich and real. Therefore, they can be used to construct new kilometer post data. Furthermore, we collected a large number of images that contained railway track, and embedded the generated kilometer posts into the appropriate positions of the images. Finally, the construction of kilometer post data is complete. On the basis of the data from the original 60 images that were obtained by downloading and filtering from literature and the Internet, a data set containing 500 kilometer post images was finally obtained and the original 60 images were included. Some of them are shown in Figure 4. In the data set, the kilometer post data of sunny, nighttime, snow and different interference scenarios are approximately evenly distributed. This is achieved by selecting generated kilometer posts and the appropriate images with a railway background, and then embedding the generated kilometer posts into the appropriate positions of the images. As a result, the generated kilometer post data set has high authenticity and further improves the effectiveness of the data set.

4. The Detection Model of Kilometer Post Based on an Improved SSD Algorithm
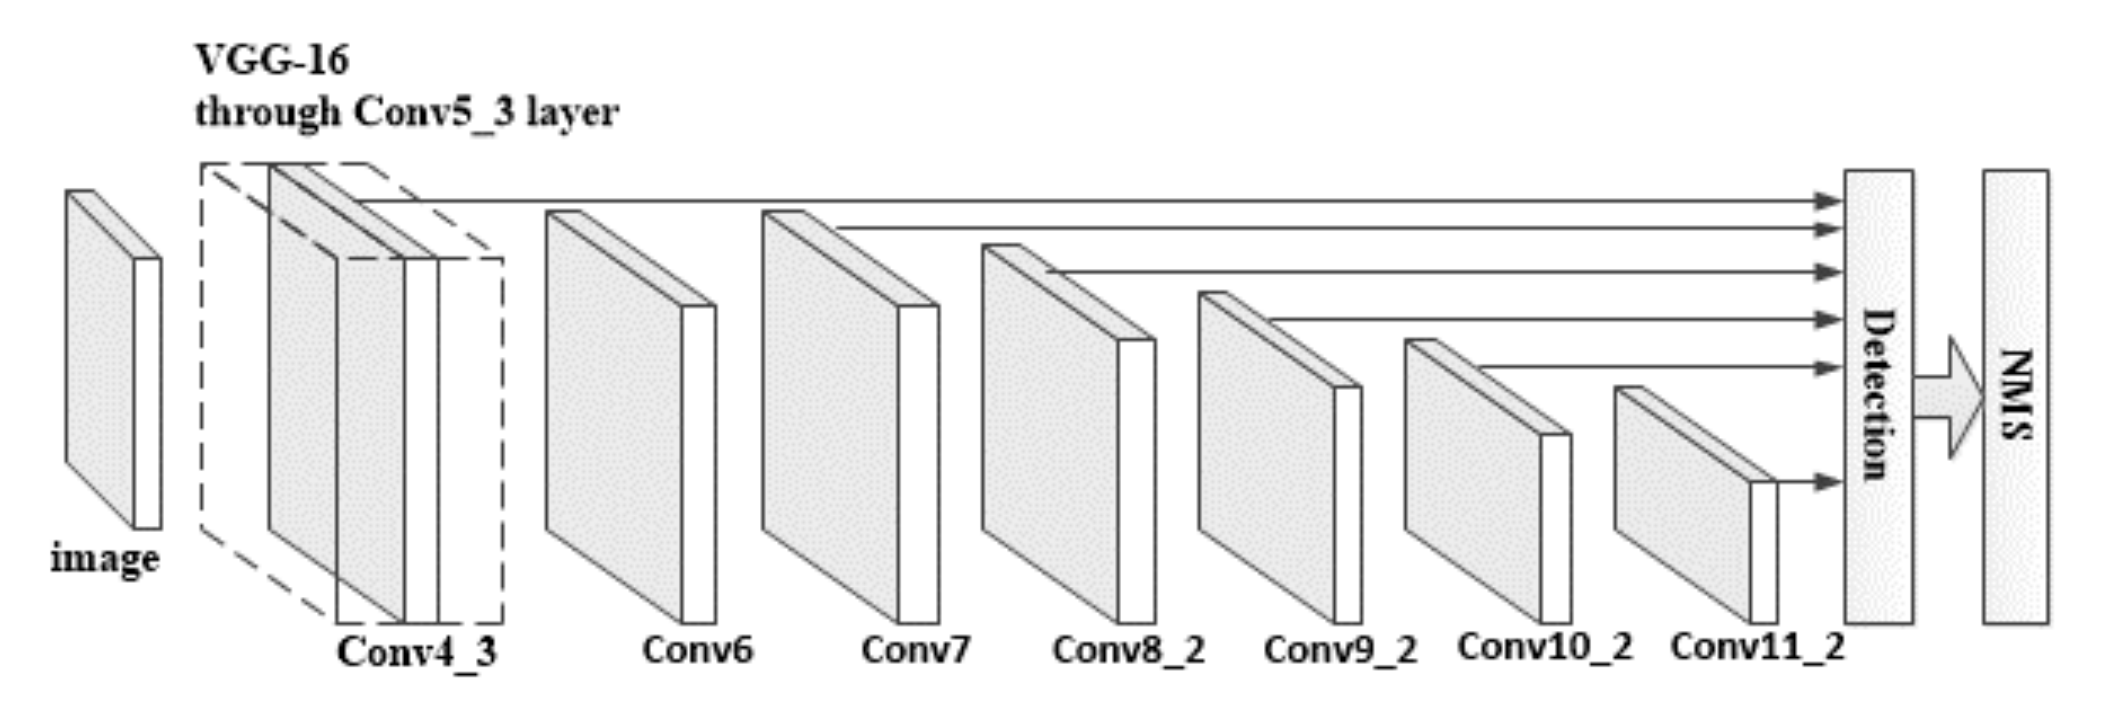
4.1. SSD Algorithm

SSD is an end-to-end detection model for object detection and recognition proposed by Wei Liu et al. On one hand, it is similar to the YOLO algorithm. The input data are processed by a convolutional neural network, and finally, the object coordinates and category information can be output. On the other hand, in order to improve the detection accuracy, the SSD model adds the anchor mechanism used by R-CNN algorithm, which is the equivalent to combining the region proposal network (RPN) function with the regression mechanism. SSD uses deep features around each object for detection and recognition, and extracts object features from different feature maps of the deep neural network, which adds more scale information and improves the detection accuracy without affecting the speed. SSD uses a Visual Geometry Group 16 (VGG-16) [38] convolutional neural network as the basic network. A number of auxiliary convolutional layers whose sizes decrease in turn are connected. Finally, a multi-scale pyramid structure feature map is generated to detect the objects of different sizes, as shown in Figure 5. The basic network is mainly used for image classification, and the multi-scale convolutional layer is mainly used to extract and detect object features. For a single input image, SSD will generate multiple bounding boxes and score the object categories. Then, non-maximum suppression (NMS) operation is performed to obtain the final prediction results, which significantly improves the detection accuracy and speed.

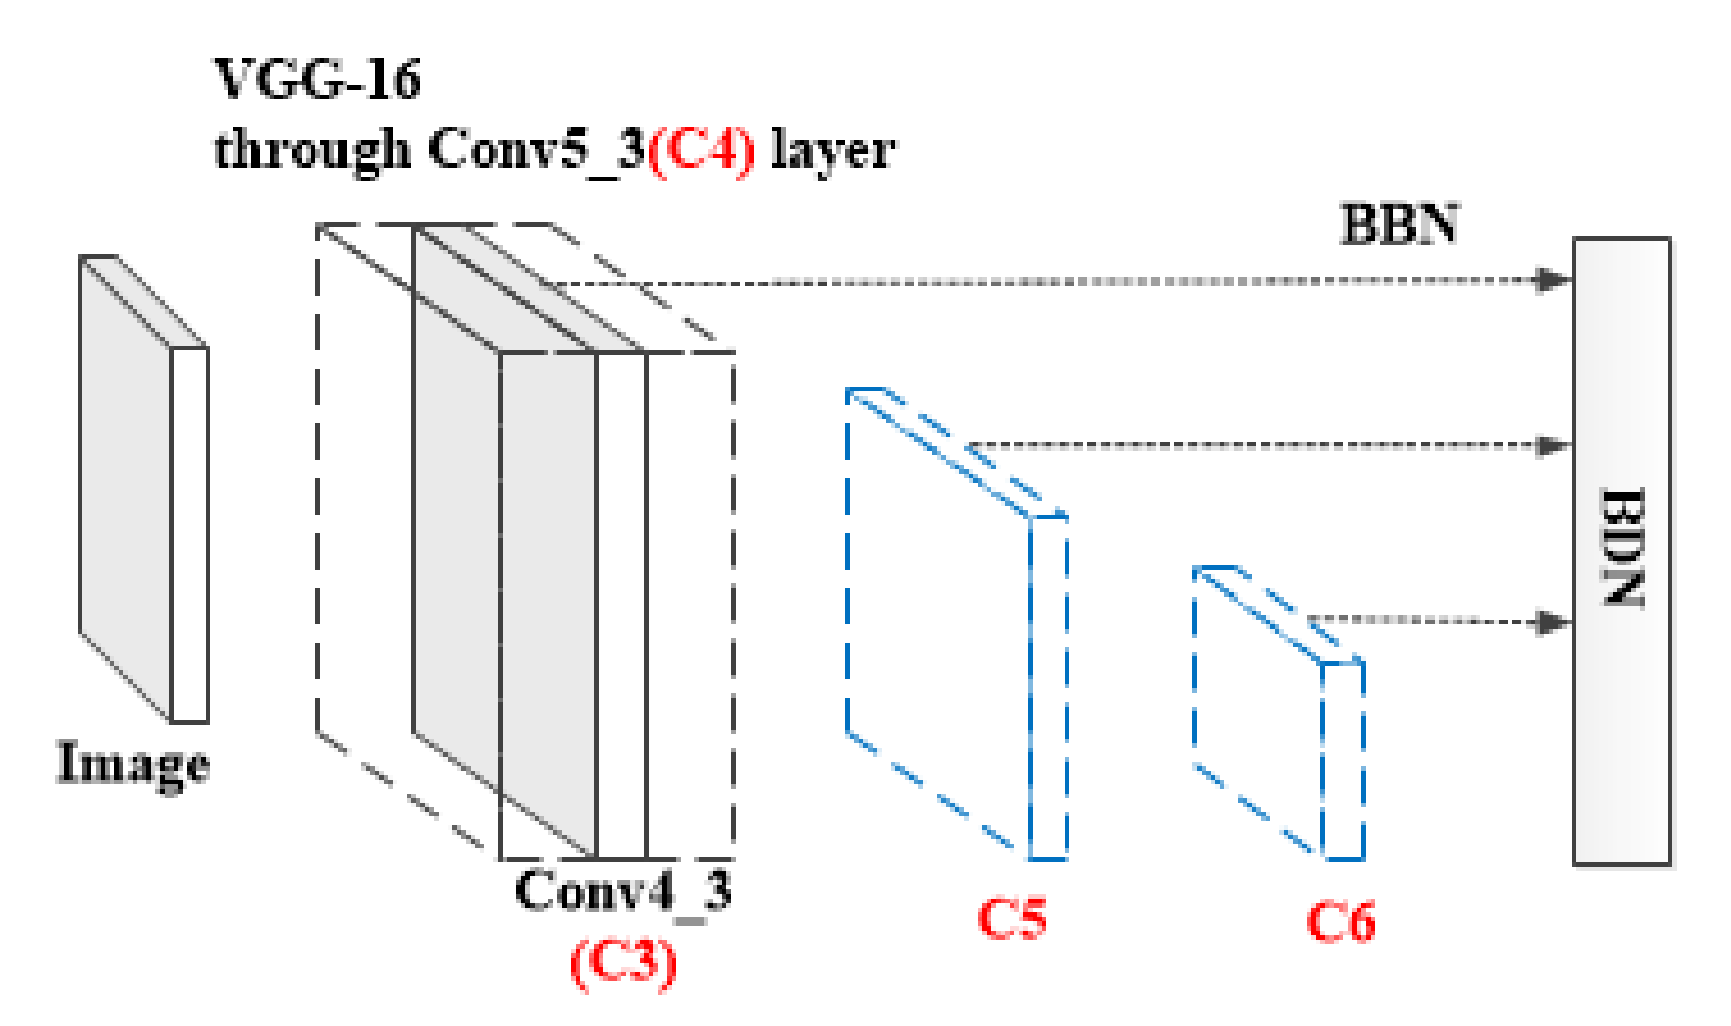
4.2. The Detection Model of Kilometer Posts Based on an Improved SSD Algorithm

To optimize the detection method of kilometer posts, we used the optimization methods described in reference [31] to maintain the superiority of the detection model. By analyzing specific application scenarios, the model was further simplified. The complex Z-style structure and residual network in [31] were deleted, and only the backbone network was extracted for modeling. In addition, in this study, the number of anchor boxes was reduced from 4 to 2 to further improve the detection efficiency. Finally, the kilometer post detection model based on an improved SSD algorithm was established, as shown in Figure 6.
The detection model mainly includes a backbone network (BBN) and backbone detection network (BDN). BBN includes the optimized VGG-16 basic network and the designed auxiliary convolutional layer. The optimization of the VGG-16 basic network is mainly reflected in the last two fully connected layers, which are replaced by a convolutional layer with different settings. According to the analysis of reference [31], this not only reduces the number of parameters and the network running time, but also enhances the network discrimination ability. Compared with the input image, the resolution of C3, C4 and C5 layers is reduced by 8, 16 and 32 times, respectively. In addition, in order to further enlarge the receptive field, capture more deep semantic information, and carry out effective multi-scale detection, two additional convolutional layers were added to the end of the reduced VGG-16, named C6, which forms multi-scale feature maps with C3, C4 and C5. The detection mode of BDN is similar to SSD. Multiple feature layers (C3, C4, C5 and C6) are used for generating bounding box offsets and scores. A fixed number of detection results can be produced by applying convolutional layers. For the stability of the training process and robustness of detection results, a set of anchor boxes are introduced on each location of the grid cell. Based on the analysis of application scenarios, in this paper, the model design was simplified and the number of anchor boxes was reduced from 4 to 2, which ensures the detection accuracy, and further improves the efficiency. The specific detection process can refer to the detailed description in [31], which is not repeated here. The specific experimental results are analyzed in Section 5.

5. Analysis of the Experimental Results

5.1. The Influence of Data Set

In this paper, all the experiments are carried out on a computer with Core I7700K CPU and GTX 1080Ti GPU. First, the influence of data set size on the model is considered, as shown in Table 1. From this, we can see that when only 60 kilometer post images obtained from the Internet and the literature were used as a data set, we randomly selected 80% of them to train the model, and the remaining 20% were used for validation. The accuracy of the obtained model was only 75.65%. However, when the kilometer post data generated by the DCGAN algorithm were mixed with the original 60 images, and 500 images were obtained as the data set to train and verify the model, the accuracy of the model was significantly improved, reaching 98.92%. Therefore, it can be seen that the size of the data set has a direct impact on the accuracy of the model and that the method of generating kilometer post data using the DCGAN algorithm proposed in this paper is effective.

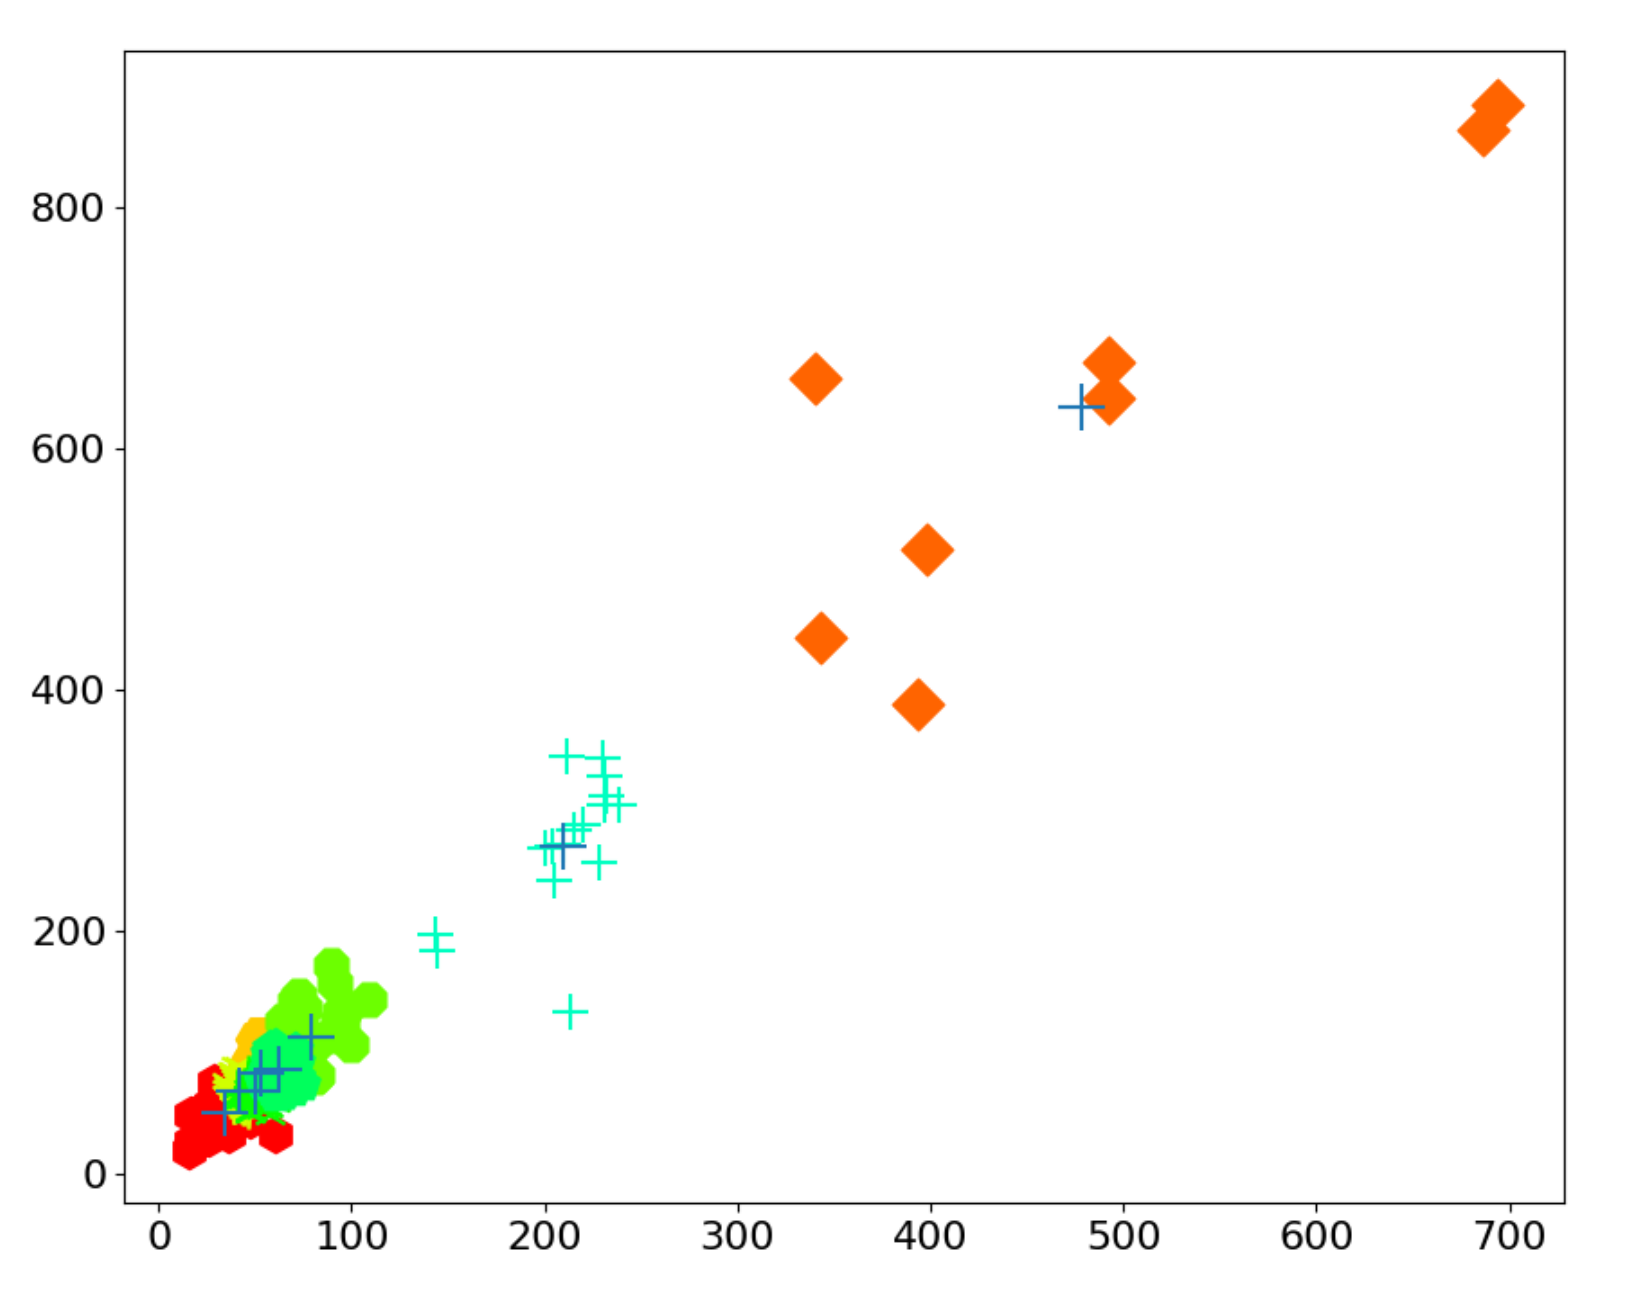
5.2. The Influence of Model Structure and Anchor Boxes

In this paper, the improvement in the SSD algorithm is mainly reflected in two aspects. Firstly, it inherited the optimization method in [31]. Secondly, through the analysis of the application scenario, the network was simplified, only its backbone network was extracted for modeling, and the number of anchor boxes was reduced from 4 to 2. In order to prove that this is effective, the effects of using different model structures and anchor boxes were compared and analyzed. Here, the data set is the same, containing 500 images, with the resolution of each image being 960 × 480 pixels. Firstly, the detection accuracy and time corresponding to different model structures were compared, as shown in Table 2. Here, the number of anchor boxes is set as 4 and the time is the detection time of a kilometer post image in the verification stage after the model training was completed. From Table 2, it can be seen that the method used to extract the backbone network in [31] for modeling was effective. It not only ensured the detection accuracy, but also reduced the detection time to 13.57 ms. That is to say, the detection efficiency was improved.
In addition, to be scale-insensitive, multi-scale feature maps that have resolutions of 1/8, 1/16, 1/32, 1/64 of the original image were used for object detection. We associated two anchor boxes with each level. In this paper, we used k-means to generate eight anchor boxes, and then assigned the clustered anchor boxes to each level of the feature maps based on the areas. At the beginning of clustering, the width and height of the largest and smallest samples were divided into eight parts, and they were set as the center of each cluster. Then, after many iterations, the cluster center coordinates and sample distribution were obtained, as shown in Figure 7. Different colors and shapes represent different clusters, and cluster centers are represented by +. Furthermore, according to the area size of all cluster centers, the width and height of anchor boxes corresponding to different resolution layers can be obtained, as shown in Table 3.
Furthermore, Table 4 shows the detection accuracy and the time corresponding to different anchor boxes. From this, we can see that it also simultaneously ensures the accuracy and improves the detection efficiency. This proves that a design with a reduced number of anchor boxes, such as that proposed in this paper, is effective.

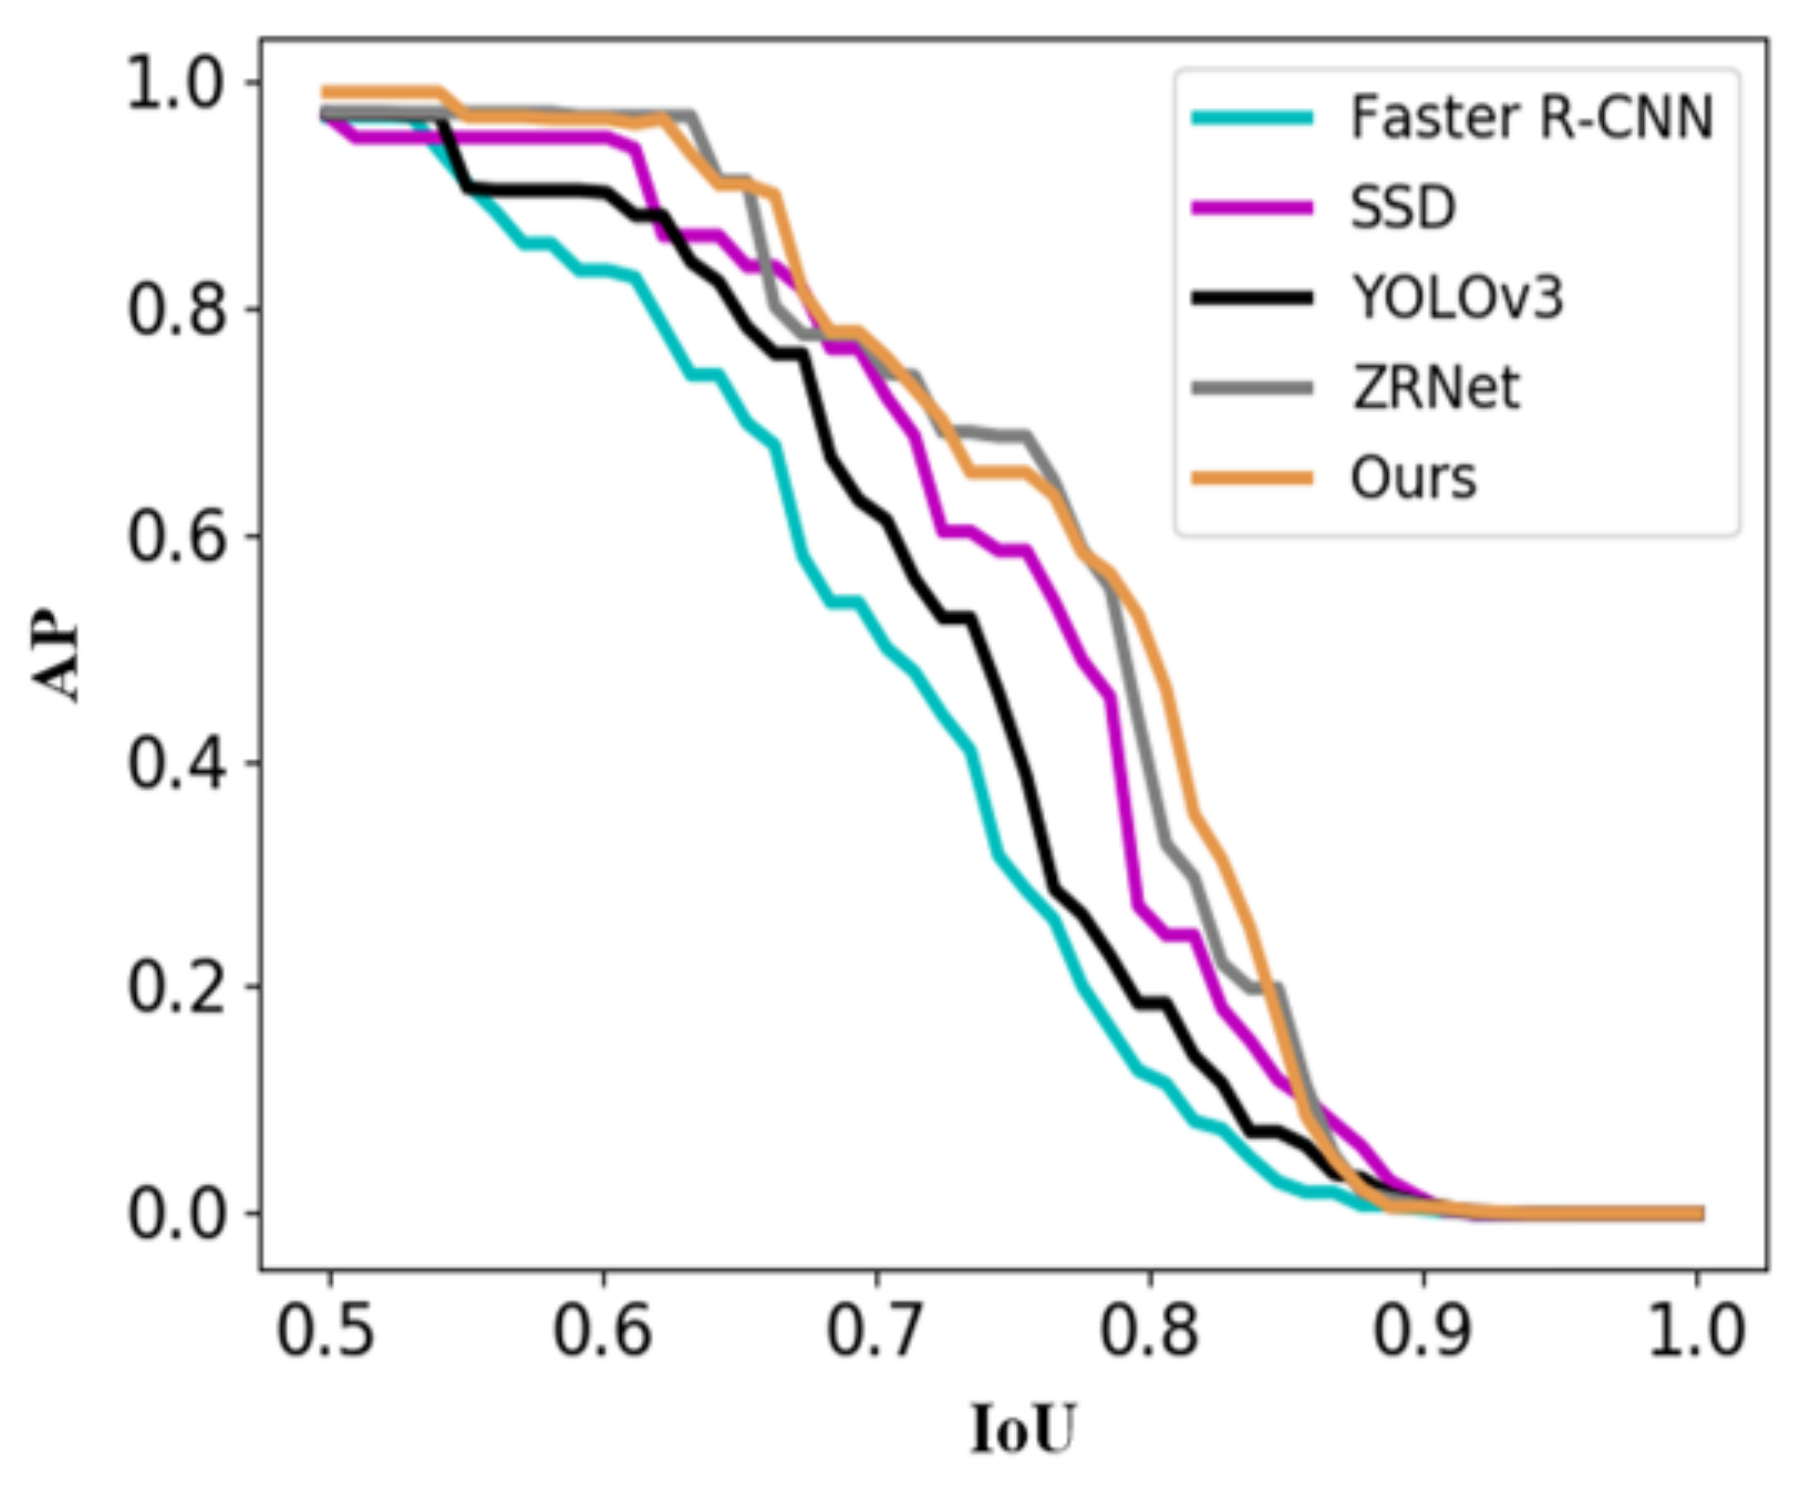
5.3. The Analysis of Comparative Experiment and Model Stability

In order to further prove the superiority of the kilometer post detection model established in this paper, in this section, we compare it with other commonly used detection networks based on deep learning, as shown in Figure 8. The abscissa represents the Intersection over Union (IoU) [39] and the ordinate represents Average Precision (AP). The IoU parameter indicates the coincidence degree of the target box and the label box, which is generally set as 0.5. The relationship between AP and IoU is usually used to determine the model stability of object detection algorithms.
As can be seen from Figure 8, our model has obvious advantages over Faster R-CNN [24], SSD [26] and YOLOv3 [40]. When IoU was 0.5, the AP of our model was 2.12% and 2.04% higher than that of Faster R-CNN and SSD, respectively. The AP of our model was 13.35% higher than that of Faster R-CNN (IoU = 0.6). Moreover, with higher IoU (0.7), the AP of our model was 26.09% and 16.6% higher than that of Faster R-CNN and YOLOv3, respectively. As the model in this paper was obtained by simplifying the design of reference [31], the overall accuracy does not have obvious advantages compared with the ZRNet model. However, because of the simplification of the model setting, the detection efficiency is improved, i.e., the detection time is reduced, as shown in Table 5.
In Table 5, IoU is taken as 0.5. From the results of the comparison, it can be seen that our model has the highest detection accuracy and efficiency. For example, compared with Faster R-CNN and ZRNet models, the accuracy of our model was 2.12% and 1.79% higher, and the detection time was 169.89 ms and 14.26 ms less, respectively. To sum up, our model is superior to other models in terms of detection accuracy and efficiency. This further proves the superiority of the kilometer post detection model established in this paper.
Furthermore, the model stability was analyzed. From Figure 8, we can see that when the IoU parameter was 0.5, the AP of our model reached 98.92%. When the IoU parameter was 0.7, the AP still reached 77.78%. This shows that the model stability is good. Even if the higher IoU parameter was used as the criterion to determine whether the detection was correct or not, the detection accuracy of our model remained high.

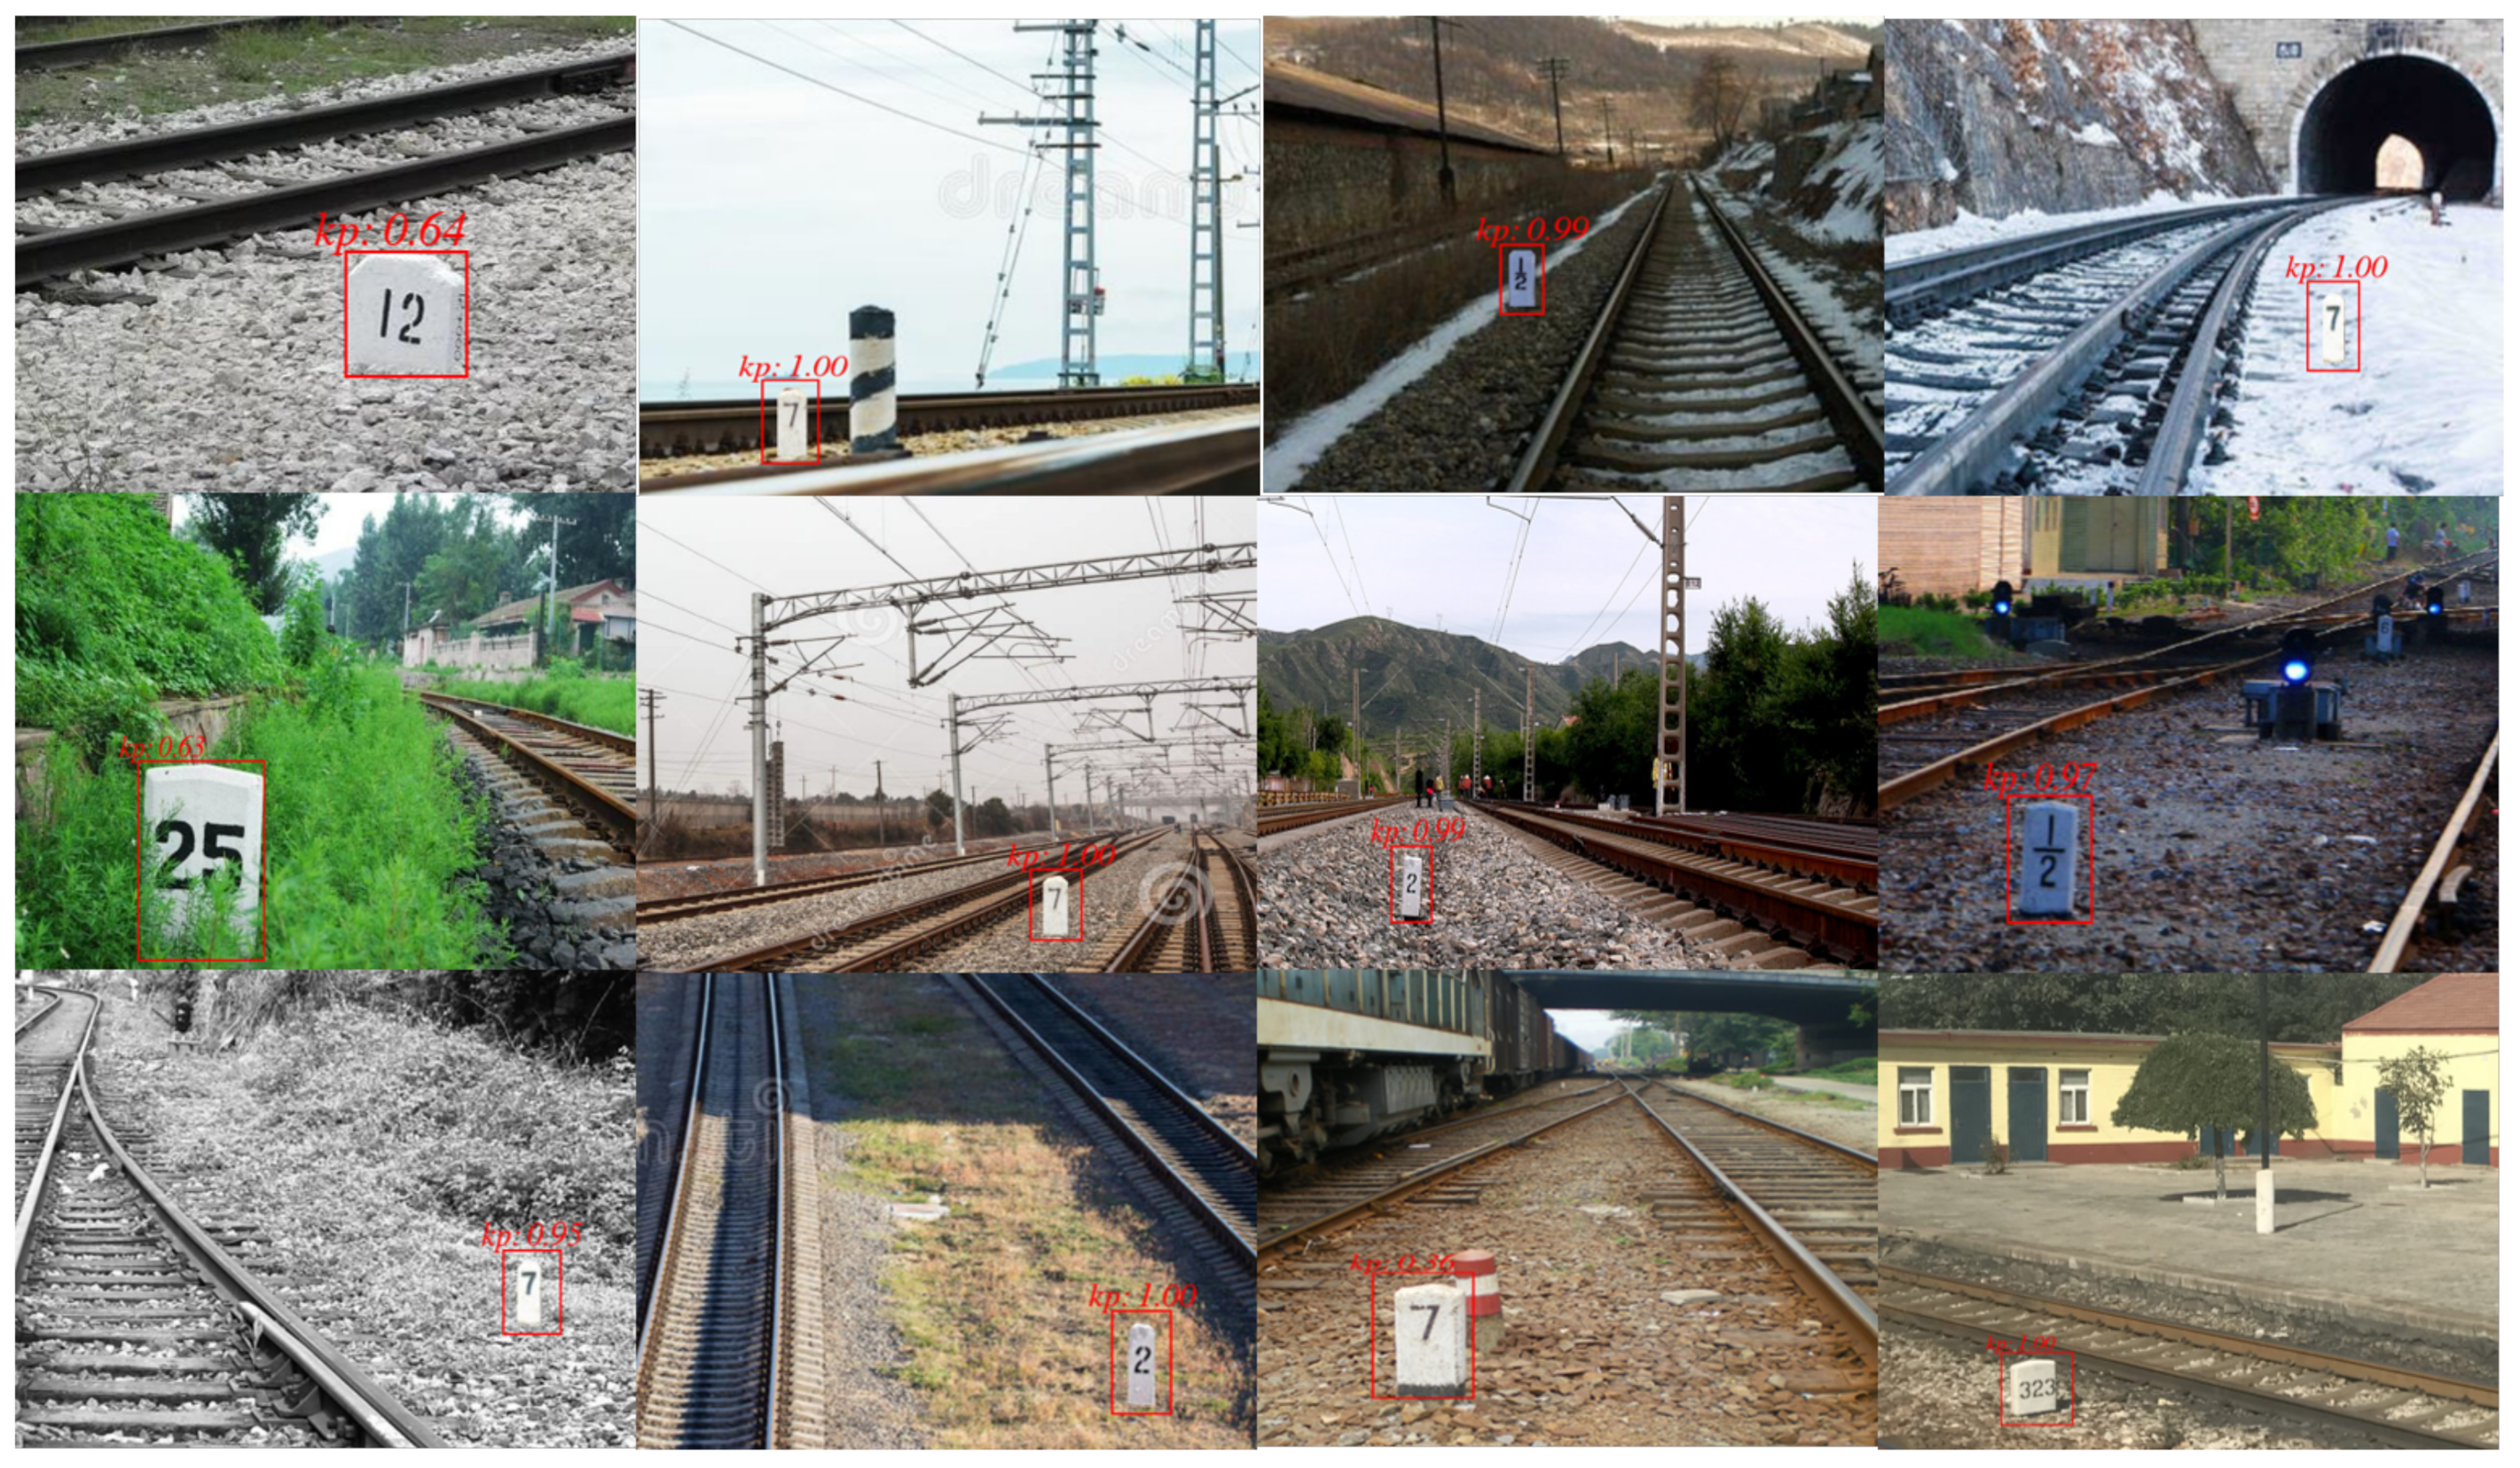
5.4. The Detection Result of Kilometer Posts

This section analyzes the detection results of kilometer posts, as shown in Figure 9. It can be seen that the model proposed in this paper can effectively detect and locate kilometer posts under different weather conditions or in cases where there are trackside interferences. Moreover, from the previous analysis, we know that the accuracy of the detection results reached 98.92%, and the detection time was only 35.43 ms. Therefore, it ensures both the detection accuracy and efficiency.

6. Conclusions

In this paper, the DCGAN and an improved SSD algorithm were combined to establish a kilometer post detection model. Firstly, the effective data set of kilometer posts was established by introducing the DCGAN algorithm. This provided a prerequisite for the construction of the detection model. Secondly, by inheriting the existing optimization methods in reference and further simplifying the design of the SSD network according to the specific application scenario in this paper, the kilometer post detection model based on an improved SSD algorithm was established. From the analysis of the experimental results, we can see that our model has a higher detection accuracy and efficiency. The accuracy of our model reached 98.92%, while the detection time was only 35.43 ms. When IoU was 0.7, the AP of our model was 26.09% and 16.6% higher than that of Faster R-CNN and YOLOv3, respectively. When IoU was 0.5, compared with Faster R-CNN and ZRNet models, the detection time of our model was 169.2 ms and 13.57 ms less, respectively. A series of comparative data show that the detection model established in this paper is better than other commonly used deep learning detection models. Moreover, under the influence of different weather conditions and trackside interferences, the model can also achieve accurate detection of kilometer posts.
To sum up, this paper presents an optimized kilometer post detection method. However, the optimization of the kilometer post recognition method is not considered in this paper. In future work, we will propose a kilometer post recognition algorithm, so as to form a complete kilometer post detection and recognition system, and then carry out a feasibility experiment on a high-speed train.

Author Contributions

Conceptualization, Y.W.; methodology, Y.W. and Y.S.; validation, Y.W. and Y.S.; investigation, Y.W.; writing—original draft preparation, Y.S.; writing—review and editing, Y.W. All authors have read and agreed to the published version of the manuscript.

Funding

This research was funded by the National Natural Science Foundation of China (No.U1734203) and Beijing Municipal Science & Technology Commission (No.Z181100001018032)

Acknowledgments

The authors wish to thank the reviewers for their valuable comments and suggestions concerning this manuscript.

Conflicts of Interest

The authors declare no conflict of interest.

References

  1. Cai, B. Train Integrated Positioning Methods for Low-cost Train Control System. Ph.D. Thesis, Beijing Jiaotong University, Beijing, China, 2010. [Google Scholar]
  2. Yue, C.; Cui, J. Chinese High Speed Railway Train Positioning Technology and Application Requirements for Beidou Satellite Positioning. RSCE 2019, 16, 1–4. [Google Scholar]
  3. Zhang, A.; Zheng, P.; Li, H.; Cai, L. Design of Railway Positioning and Auxiliary Driving Safety System Based on Beidou Satellite Navigation Technology. Jiangxi Sci. 2017, 35, 805–809. [Google Scholar]
  4. Gao, J. Research on Train Positioning Technology Based on Bei Dou Navigation System. RSCE 2020, 17, 71–73. [Google Scholar]
  5. Ng, K.; Zhou, J.; Chu, M.; Leung, K. A Train-Once Approach for Positioning Estimation Using the Directional Propagation Model. IEEE Trans. Veh. Technol. 2008, 57, 2242–2256. [Google Scholar] [CrossRef]
  6. Li, W.; Hou, L. Research on High-speed Train Positioning Technology Based on Satellite Navigation System. Inf. Control 2016, 45, 479–486. [Google Scholar]
  7. Zhu, L. Antenna Modeling and Optimization Research of Rail Traffic Balise Transmission System. Ph.D. Thesis, Beijing Jiaotong University, Beijing, China, 2018. [Google Scholar]
  8. Jiang, W.; Chen, S.; Cai, B.; Wang, J.; ShangGuan, W.; Rizos, C. A Multi-Sensor Positioning Method-Based Train Localization System for Low Density Line. IEEE Trans. Veh. Technol. 2018, 67, 10425–10437. [Google Scholar] [CrossRef]
  9. Liu, S.; Chen, G.; Wang, D.; Xu, C. Train integrated positioning method based on GPS/DR/MM. J. Railw. Sci. Eng. 2018, 15, 474–482. [Google Scholar]
  10. Yang, Y.; Guang, C.; Jing, W.; Li, D. Research on train integrated positioning based on grey neural network. J. Meas. Sci. Instrum. 2019, 10, 143–149. [Google Scholar]
  11. Shangguan, W.; Xie, C.; Jiang, W. Optimization Method for Integrated Train Positioning Accuracy Based on IMU Calibration Compensation. J. China Railw. Soc. 2020, 42, 57–64. [Google Scholar]
  12. Liu, S. Research on Train Location Algorithm Based on GNSS and Image Feature Recognition. Master’s Thesis, Lanzhou Jiaotong University, Lanzhou, China, 2018. [Google Scholar]
  13. Guo, B. Research on Autonomous Train Location Method Based on Image Features. Ph.D. Thesis, Beijing Jiaotong University, Beijing, China, 2008. [Google Scholar]
  14. Reliable Data Systems International Ltd. Available online: http://www.rdsintl.com (accessed on 1 November 2020).
  15. Tan, S.; Hu, Z. An effective Integration method for license plate location based on HSV color space. Comput. Appl. Chem. 2011, 28, 105–108. [Google Scholar]
  16. Liu, B. Research on Edge and Region Information Extraction for Polarimetric SAR Images. Ph.D. Thesis, Shanghai Jiaotong University, Shanghai, China, 2015. [Google Scholar]
  17. Dong, J. Study on Fast and Reliable Pattern Match. Ph.D. Thesis, National University of Defense Technology, Hunan, China, 2015. [Google Scholar]
  18. Zhou, F.; Jin, L.; Dong, J. Review of convolutional neural network. Chin. J. Comput. 2017, 40, 1229–1251. [Google Scholar]
  19. Zhang, J.; Wang, H.; Guo, Y.; Hu, X. Review of deep learning. Appl. Res. Comput. 2018, 35, 1921–1928. [Google Scholar]
  20. Zhang, W.; Yang, P. Real time traffic sign detection based on improved SSD algorithm. Mod. Electron. Tech. 2020, 43, 90–92. [Google Scholar]
  21. Castro-Zunti, R.D.; Yépez, J.; Ko, S.-B. License plate segmentation and recognition system using deep learning and OpenVINO. IET Intell. Transp. Syst. 2020, 14, 119–126. [Google Scholar] [CrossRef]
  22. Krizhevsky, A.; Sutskever, I.; Hinton, G. ImageNet Classification with Deep Convolutional Neural Networks. Adv. Neural Inf. Process. Syst. 2012, 25, 84–90. [Google Scholar] [CrossRef]
  23. Redmon, J.; Divvala, S.; Girshick, R.; Farhadi, A. You Only Look Once: Unified, Real-Time Object Detection. In Proceedings of the Computer Vision & Pattern Recognition, Las Vegas, NV, USA, 12 December 2016. [Google Scholar]
  24. Ren, S.; He, K.; Girshick, R.; Sun, J. Faster R-CNN: Towards realtime object detection with region proposal networks. In Proceedings of the Neural Information Processing Systems, Guangzhou, China, 12 June 2017; pp. 1137–1149. [Google Scholar]
  25. Redmon, J.; Farhadi, A. YOLO9000: Better, faster, stronger. In Proceedings of the IEEE Conference on Computer Vision and Pattern Recognition, Honolulu, HI, USA, 21–26 July 2017; pp. 7263–7271. [Google Scholar]
  26. Liu, W.; Anguelov, D.; Erhan, D.; Szegedy, C.; Reed, S.; Fu, C.Y.; Berg, A.C. SSD: Single Shot MultiBox Detector. In Proceedings of the European Conference on Computer Vision 8, Amsterdam, The Netherlands, 11–14 October 2016; pp. 21–37. [Google Scholar]
  27. Zhang, X. SSD Algorithm and Its Application in the Abnormal Object Detection of Railway Scenes. Master’s Thesis, North China University of Technology, Beijing, China, 2019. [Google Scholar]
  28. Xie, B.; Zhu, B.; Fan, X. Object detection method based on SSD convolution network in aerial images. J. Optoelectron. Laser 2019, 30, 407–414. [Google Scholar]
  29. Chen, Z.; Wu, K.; Li, Y.; Wang, M.; Li, W. SSD-MSN: An Improved Multi-Scale Object Detection Network Based on SSD. IEEE Access 2019, 7, 80622–80632. [Google Scholar] [CrossRef]
  30. Gong, M.; Shu, Y. Real-time Detection and Motion Recognition of Human Moving Objects Based on Deep Learning and Multi-scale Feature Fusion in Video. IEEE Access 2020, 99, 25811–25822. [Google Scholar] [CrossRef]
  31. Dai, X.; Yuan, X.; Pei, L.; Wei, X. Deeply Supervised Z-Style Residual Network Devotes to Real-Time Environment Perception for Autonomous Driving. IEEE Intell. Transp. 2020, 21, 2396–2408. [Google Scholar] [CrossRef]
  32. Zhang, Y. A survey on generative adversarial networks. Electron. Des. Eng. 2018, 26, 34–37. [Google Scholar]
  33. Sun, D. Small Sample Visual Defect Detection Based on DCGAN. Master’s Thesis, Jilin University, Jilin, China, 2019. [Google Scholar]
  34. Du, Y. Study and Application on The Structure Improved Deep Convolutional Generative Adversarial Networks. Master’s Thesis, Chongqing University of Posts and Telecommunications, Chongqing, China, 2019. [Google Scholar]
  35. He, C. Image Generation Oriented Deep Convolution Generation Adversarial Network. Master’s Thesis, Yunnan University, Yunnan, China, 2019. [Google Scholar]
  36. Radford, A.; Metz, L.; Chintala, S. Unsupervised Representation Learning with Deep Convolutional Generative Adversarial Networks. arXiv 2015, arXiv:1511.06434. [Google Scholar]
  37. Xie, S. Nash Equilibrium Theory; Shanghai University of Finance and Economics Press: Shanghai, China, 1999. [Google Scholar]
  38. Simonyan, K.; Zisserman, A. Very Deep Convolutional Networks for Large-ScaleImage Recognition. arXiv 2014, arXiv:1409.1556. [Google Scholar]
  39. Sheng, H.; Huang, M.; Yang, J. Laboratory personnel statistics and management system based on Faster R-CNN and IoU optimization. J. Comput. Appl. 2019, 39, 1669–1674. [Google Scholar]
  40. Redmon, J.; Farhadi, A. Yolov3: An Incremental Improvement. arXiv 2018, arXiv:1804.02767. [Google Scholar]
Figure 1. The basic structure of DCGAN.
Applsci 10 08625 g001
Figure 2. Real kilometer post data.
Applsci 10 08625 g002
Figure 3. The kilometer posts generated by the DCGAN model.
Applsci 10 08625 g003
Figure 4. The generated kilometer post data.
Applsci 10 08625 g004
Figure 5. Network framework of SSD.
Applsci 10 08625 g005
Figure 6. The kilometer post detection model based on an improved SSD algorithm.
Applsci 10 08625 g006
Figure 7. Cluster.
Figure 7. Cluster.
Applsci 10 08625 g007
Figure 8. AP curves of different detection algorithms and our approach.
Applsci 10 08625 g008
Figure 9. Detection and location results of kilometer post (kp).
Applsci 10 08625 g009
Table 1. The influence of the data set.
Different Data Set SizeAccuracy
60 images75.65%
500 images98.92%
Table 2. The influence of model structure.
Different Model StructureAccuracyTime
ZRNet model in [31]97.13%49.69 ms
Our model in this paper97.81%36.12 ms
Table 3. The width and height of anchor boxes.
Anchor Boxes
1/8(33.93, 50.06) (41.95, 67.44)
1/16(49.94, 67.79) (53.30, 83.19)
1/32(62.35, 85.61) (79.12, 113.04)
1/64(209.48, 270.44) (478.66, 633.95)
Table 4. The influence of anchor boxes.
Different Anchor BoxesAccuracyTime
497.81%36.12 ms
298.92%35.43 ms
Table 5. Results of comparative experiment.
Different Model StructureAccuracyTime
SSD [26]96.88%43.89 ms
Faster R-CNN [24]96.80%205.32 ms
YOLOv3 [40]97.04%56.88 ms
ZRNet model in [31]97.13%49.69 ms
Our model in this paper98.92%35.43 ms
Publisher’s Note: MDPI stays neutral with regard to jurisdictional claims in published maps and institutional affiliations.

