Article

Phytochemical Analysis of Twelve Marker Analytes in Sogunjung-tang Using a High-Performance Liquid Chromatography Method

Herbal Medicine Research Division, Korea Institute of Oriental Medicine, Daejeon 34054, Korea
*
Author to whom correspondence should be addressed.
Appl. Sci. 2020, 10(23), 8561; https://doi.org/10.3390/app10238561
Submission received: 16 November 2020 / Revised: 27 November 2020 / Accepted: 27 November 2020 / Published: 30 November 2020
(This article belongs to the Section Chemical and Molecular Sciences)

Abstract

:
Sogunjung-tang (SGJT) is a traditional herbal prescription that has been used in Korea for the treatment of abdominal pain since ancient times. In this study, an analytical method for the simultaneous quantification of 12 marker analytes (gallic acid (GA), albiflorin (ALB), paeoniflorin (PAE), liquiritin apioside (LIAP), liquiritin (PIQ), benzoic acid (BA), coumarin (COU), liquiritigenin (LIQG), cinnamic acid (CINA), benzoylpaeoniflorin (BPAE), cinnamaldehyde (CINAD), and glycyrrhizinic acid (GLYA)) for quality evaluation of SGJT was developed based on high-performance liquid chromatography (HPLC) combined with a photodiode array detector. A Waters SunFire reverse-phased C18 column was used for the chromatographic separation of the 12 marker analytes in SGJT using a two-mobile phases system consisting of 0.1% (v/v) aqueous formic acid and 0.1% (v/v) formic acid in acetonitrile. The developed analytical method was validated by assessment of linearity, limit of detection, limit of quantification, recovery, and precision. Using the developed and validated HPLC method, the 12 marker analytes were determined to be present in 0.10–32.83 mg/g in SGJT.

1. Introduction

Traditional herbal prescriptions consist of two or more medicinal herbs; they are very diverse and contain many ingredients. Therefore, standardization is required for efficient quality control.
Sogunjung-tang (SGJT), also known as Xiaojianzhong-tang in Chinese and Shokenchu-to in Japanese, is an oriental medical prescription. According to Donguibogam (the Principles and Practices of Eastern Medicine), it is recorded that SGJT has been used to treat symptoms such as abdominal pain, wet dreams, and melalgia. SGJT consists of a combination of six herbal medicines: Paeoniae Radix, Cinnamomi Ramulus, Glycyrrhizae Radix et Rhizoma, Zingiberis Rhizoma Recens, Zizyphi Fructus, and Oryzae Gluten [1].
In studies on the biological activity of SGJT, Jung et al. [2] reported its inhibitory effects on Type I hypersensitivity and inflammatory reactions, and Kim et al. [3] reported its effects on cell proliferation and immune activity. In addition, Katami et al. [4] reported the results of genotoxicity studies such as bacterial reverse mutation and micronucleus tests.
The major components contained in the six herbal medicines that make up SGJT include monoterpenoids (e.g., albiflorin, ALB; paeoniflorin, PAE; and benzoylpaeoniflorin, BPAE) and phenolic compounds (e.g., gallic acid, GA; and benzoic acid, BA) from Paeonia lactiflora [5,6], coumarins (e.g., coumarin, COU) and phenylpropanoids (e.g., cinnamic acid, CINA; and cinnamaldehyde, CINAD) from Cinnamomum cassia [7], triterpenoid saponins (e.g., glycyrrhizinic acid, GLYA) and flavonoids (e.g., liquiritin apioside, LIAP; liquiritin, LIQ; and liquiritigenin, LIQG) from Glycyrrhiza uralensis [8,9], phenols (e.g., 6-gingerol, 6-GIN) from Zingiber officinale [10], flavonoids (e.g., spinosin, SPI) from Zizyphus jujube [11], and saccharides (e.g., maltose) from Oryzae Gluten [12].
Thus, a range of biological activities of SGJT and of many of the individual herbal medicine components constituting SGJT have been reported, and analytical methods for quality control based on high-performance liquid chromatography (HPLC) or liquid chromatography-mass spectrometry have also been reported [2,3,4,5,6,7,8,9,10,11]. However, no standardization study for quality control of SGJT composed of combinations of these herbs has been reported.
In this study, five of the constituent medicinal herbs of SGJT, excluding saccharide-containing Oryzae Gluten, were mixed, extracted, and used for HPLC analysis. These extracts were used to develop and verify a method for the simultaneous analysis of 12 marker compounds for quality assessment of SGJT using HPLC separation combined with photodiode array detection for the simultaneous detection of the marker analytes. For the quality assessment of SGJT using the developed analysis, the following 12 marker analytes were assayed: GA, ALB, PAE, BA, and BPAE (Paeoniae Radix); COU, CINA, and CINAD (Cinnamomi Ramulus); and LIAP, LIQ, LIQG, and GLYA (Glycyrrhizae Radix et Rhizoma).

2. Materials and Methods

2.1. Plant Materials

Five of the raw medicines that constitute SGJT are shown in Table S1, and were purchased from a pharmaceutical manufacturer of herbal medicine, Kwangmyungdang Medicinal Herbs (KMH; Ulsan, Korea) in November 2017. Based on guidelines (“The Dispensatory on the Visual and Organoleptic Examination of Herbal Medicine”), the origins of these herbs were confirmed by Dr. Seung-Yeol Oh, president of KMH [13]. Voucher specimens (2017KE63–1 to 2017KE63–5) for each material have been deposited at the Herbal Medicine Research Division, Korea Institute of Oriental Medicine.

2.2. Chemicals and Reagents

Standard analytes for qualitative/quantitative analysis of SGJT were purchased from commercial suppliers: GA (CAS No.: 149-91-7, 100.0%), BA (CAS No.: 65-85-0, 99.9%), and COU (CAS No.: 91-64-5, 99.0%) from Merck KGaA (Darmstadt, Germany); ALB (CAS No.: 39011-90-0, 99.8%), LIQ (CAS No.: 551-15-5, 99.6%), CINA (CAS No.: 140-10-3, 99.5%), CINAD (CAS No.: 104-55-2, 98.0%), GLYA (CAS No.: 1405-86-3, 99.4%), and 6-GIN (CAS No.: 23513-14-6, 98.3%) from Wako Chemicals (Osaka, Japan); PAE (CAS No.: 23180-57-6, 99.4%), LIAP (CAS No.: 74639-14-8, 98.0%), and BPAE (CAS No.: 38642-49-8, 98.0%), and SPI (CAS No.: 72063-39-9, 99.5%) from Shanghai Sunny Biotech (Shanghai, China); and LIQG (CAS No.: 578-86-9, 99.8%) from Biopurify Phytochemicals (Chengdu, China). Methanol, acetonitrile, and water (HPLC-grade solvents) were purchased from JT Baker (Phillipsburg, NJ, USA), and ACS reagent-grade formic acid (100.0%) was purchased from Merck KGaA (Darmstadt, Germany).

2.3. Preparation of SGJT Water Extract

SGJT extract was prepared from a combination of the five herbal medicines as follows: Paeoniae Radix (2329.2 g), Cinnamomi Ramulus (1397.5 g), Glycyrrhizae Radix et Rhizoma (465.8 g), Zingiberis Rhizoma Recens (310.6 g), and Zizyphi Fructus (496.9 g). The mixed sample was extracted and freeze-dried according to the previously reported protocol [14,15] using 50 L of distilled water to obtain 887.1 g (17.74% yield) of aqueous extract.

2.4. Preparation of Samples and Standard Solutions for Simultaneous Analysis by HPLC

To prepare sample solutions from the SGJT preparations for simultaneous quantification of the 12 marker analytes (GA, ALB, PAE, LIAP, LIQ, BA, COU, LIQG, CINA, BPAE, CINAD, and GLYA) by HPLC, each 10 mL of 70% methanol and distilled water was added to 100 mg of a lyophilized SGJT sample, and the mixture was extracted under ultrasonic conditions at room temperature for 60 min. Samples that were used for analysis of ALB, PAE, and GLYA were diluted tenfold with 70% methanol and distilled water before analysis.
A standard solution of each marker analyte was prepared in methanol at a concentration of 1.0 mg/mL and stored in a refrigerator (ca. 4 °C) until use. The sample and standard solutions were filtered through a 0.2 μm GHP membrane (Pall Life Sciences, Ann Arbor, MI, USA) before HPLC analysis.

2.5. HPLC Equipment and Operating Conditions for Simultaneous Quantification of the 12 Marker Analystes

For quality control assessments of SGJT by simultaneous analysis of major marker analytes, the analysis method used previously [16,17] was modified and applied. Briefly, the HPLC system used for quantitative analysis was a Shimadzu Prominence LC-20A series HPLC (Kyoto, Japan), coupled to two solvent delivery units (LC-20AT), online degasser (DGU-20A3), a forced air circulation type column oven (CTO-20A), automatic sample injector (SIL-20A), and a photodiode array detector PDA (SPD-M20A); the system was controlled by LabSolution software (Version 5.53, SP3). Other detailed analysis parameters are shown in Table S2.

2.6. Validation of the HPLC Analytical Method

According to the International Conference on Harmonisation guidance for Q2B validation of analytical procedures [18], the developed HPLC analytical method was verified by testing parameters such as linearity, range, limit of detection (LOD), limit of quantification (LOQ), accuracy (recovery), and precision. The linearity was assessed by the coefficient of determination (r2) in the calibration curve of each marker analyte, and LOD and LOQ were calculated using the equations
LOD = 3.3 × σ S ,
LOQ = 10 × σ S ,
where σ is the standard deviation of the y-intercept and S is the slope of the calibration curve.
Accuracy verification was performed through extraction recovery tests using the standard addition method, and was calculated using the equation
Recovery   ( % ) = founded   amount spiked   amount × 100 .
The precision was assessed by determining the relative standard deviation (RSD) values of repeatability, and intraday and interday precisions. Repeatability was evaluated based on the RSD values of the retention time and peak area of each marker analyte measured repeatedly six times. Furthermore, intraday and interday precisions were evaluated as RSD values of results measured for samples on the same day and on three consecutive days, respectively.
RSD   ( % ) = standard   deviation   ( SD ) mean × 100
The suitability of the system for the simultaneous analysis was confirmed by assessing parameters such as capacity factor (k′), selectivity factor (α), resolution (Rs), number of theoretical plates (N), and tailing factor (Tf) values [19].

3. Results and Discussion

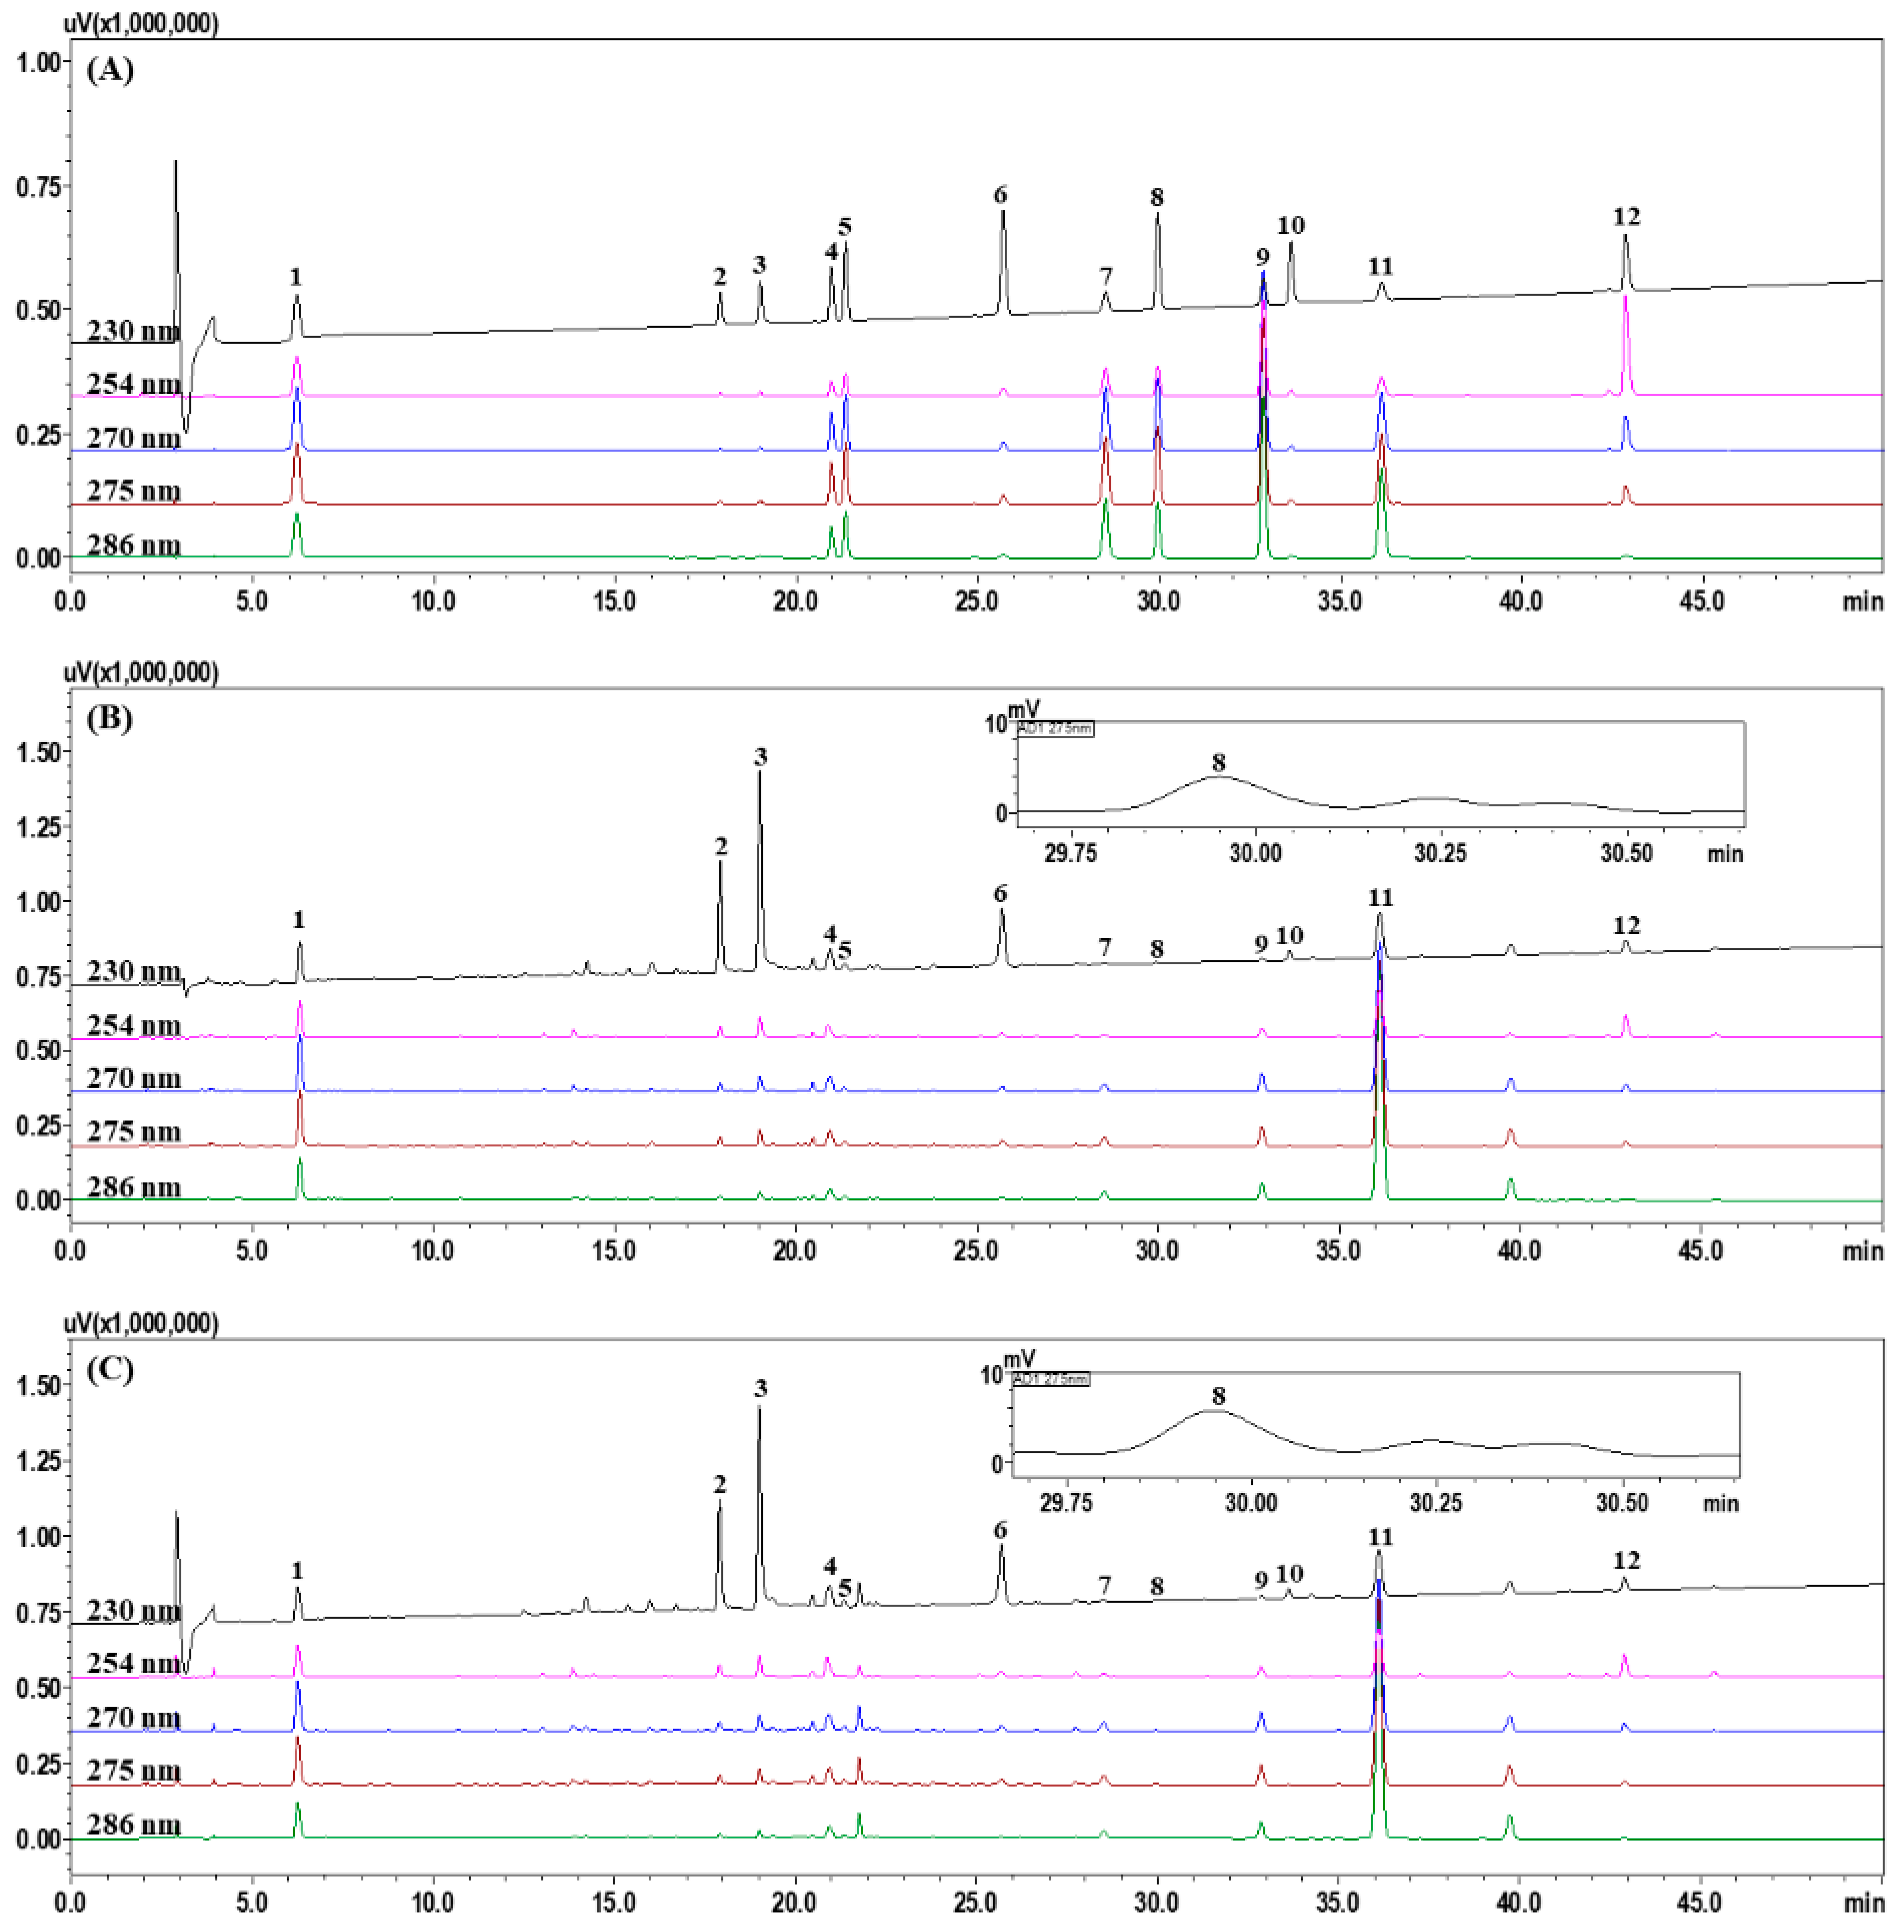
3.1. Determination of Marker Components of SGJT

To identify the marker components of SGJT, we investigated the major components of the constituent herbal medicine (GA, ALB, PAE, BA, and BPAE from P. lactiflora; COU, CINA, and CINAD from C. cassia; LIAP, LIQ, LIQG, and GLYA from G. uralensis; 6-GIN from Z. officinale; and SPI from Z. jujube) using the described HPLC system together with a distilled water–acetonitrile mobile-phase system containing formic acid (Figure S1). As a result, 12 analytes were selected as marker components for quality control of SGJT. The chemical structures of the selected marker analytes are shown in Figure S2.

3.2. Optimization of HPLC Chromatographic Conditions

A range of analysis parameters, including types of reversed-phase C18 column according to the manufacturer (SunFire (Waters, Milford, MA, USA), Gemini (Phenomenex, Torrance, CA, USA), Capcellpak UG120 (Shiseido, Japan), OptimaPak (RStech Corp., Korea)) and column temperature (30, 35, 40, and 45 °C) were varied to achieve efficient separation of the 12 marker analytes that were extracted from the SGJT sample. The optimal analysis was achieved with a SunFire C18 column (4.6 × 250 mm, 5 μm), a column temperature of 40 °C, and two mobile-phase systems of distilled water–acetonitrile, both containing 0.1% (v/v) formic acid. Under the optimized analysis conditions, 12 marker analytes were baseline separated and eluted within 45 min with Rs values ≥ 3.45 (Figure 1 and Table S3).

3.3. Validation of Developed HPLC Analytical Method

In the developed HPLC analytical assay, system suitability factors for the 12 marker analytes, namely, k′, α, N, Rs, and Tf, were calculated to be 1.18–14.07, 1.02–4.46, 17782–1488677, 3.45–79.88, and 0.96–1.29, respectively (Table S3). As shown in Table 1, the calibration curve for each marker component used for quantitative analysis was calculated as the peak area (y) versus the concentration (x) in six different concentration ranges using mixed standard solutions. The r2 values were 0.9991–1.0000, which indicated good linearity of the calibration curves. The LOD and LOQ concentration ranges calculated by the equations given in Section 2.6 were 0.04–0.73 μg/mL and 0.12–2.22 μg/mL, respectively. These results are summarized in Table 1. The extraction recovery for each component, which was used to evaluate the accuracy of the analytical method, was 95.74–103.30%, and the RSD (%) values were <3.00 (Table 2). The RSD values for the repeatability, and intraday and interday precisions of each marker analyte, were all within 1.59%, showing good precision results (Table 3). The above validation results confirm that the simultaneous analysis assay developed for quality control of SGJT is appropriate.

3.4. Quantification of the 12 Marker Analytes in SGJT Samples

Simultaneous quantification was performed for the 12 marker analytes (GA, ALB, PAE, LIAP, LIQ, BA, COU, LIQG, CINA, BPAE, CINAD, and GLYA) selected for quality control of SGJT using the verified HPLC analytical assay. As shown in Table 1, simultaneous determinations of these analytes were conducted at 230 nm (ALB, PAE, BA, and BPAE), 254 nm (GLYA), 270 nm (GA), 275 nm (LIAP, LIQ, COU, LIQG, and CINA), and 286 nm (CINAD), based on the λmax of UV spectra of each component. The peak of each component was confirmed by comparison with the UV spectrum and retention time of the corresponding reference standard compound. The amounts of the 12 marker analytes in the lyophilized SGJT sample were measured to be 0.10–32.83 mg/g by using the developed and validated assay; among these components, PAE, the main component of Paeoniae Radix, was found in the highest concentration (32.83 mg/g) (Table 4).

4. Conclusions

In the present study, 12 marker analytes were selected for quality control of SGJT using a simple and common HPLC system, with a simultaneous quantitative analysis method. The developed analysis assay was verified by assessing several parameters, including linearity, LOD, LOQ, accuracy, and precision, and was successfully applied to sample analysis. The developed and validated HPLC analysis assay is expected to be used to obtain data for the quality control and evaluation of SGJT and to form the basis for the analysis of other traditional Korea medicines in the future.

Supplementary Materials

The following are available online at https://www.mdpi.com/2076-3417/10/23/8561/s1. Figure S1: HPLC chromatogram of constituent herbal medicine and its major components. A: P. lactiflora; B: C. cassia; D: G. uralensis; D: Z. officinale; and E: Z. jujube, Figure S2: Chemical structures of the 12 marker analytes in SGJT, Table S1: Composition of SGJT, Table S2: Chromatographic conditions for simultaneous quantification of the 12 marker analytes in SGJT, Table S3: System suitability for the 12 marker analytes.

Author Contributions

Conceptualization, C.-S.S. and H.-K.S.; performing experiments and analyzing data, C.-S.S.; writing—original draft preparation, C.-S.S.; funding acquisition, H.-K.S. All authors have read and agreed to the published version of the manuscript.

Funding

This research was supported by a grant from the Korea Institute of Oriental Medicine (No. KSN2013310).

Conflicts of Interest

The authors declare no conflict of interest.

References

  1. Heo, J. Donguibogam; Namsandang: Seoul, Korean, 2007; p. 452. [Google Scholar]
  2. Jung, I.H.; Kim, J.Y.; Kam, C.W.; Park, D.I. Inhibitory effects on the type I hypersensitivity and inflammatory reaction of Sogunjung-tang. Korean J. Orient Physiol. Pathol. 2003, 17, 1188–1193. [Google Scholar]
  3. Kim, K.J.; Bae, M.J.; Suh, Y. Comparison study on activated degree of immunity and anti-cancer effect in extracted liquid of Shogunjung-tang and it’s distilled liquid. Korean J. Orient Physiol. Pathol. 2004, 18, 179–186. [Google Scholar]
  4. Katami, M.; Kuboniwa, H.; Maemura, S.; Yanagisawa, T. Genotoxicity of extracts of Japanese traditional herbal medicines (Kampo). Environ. Mutagen Res. 2002, 24, 1–15. [Google Scholar]
  5. Xu, S.; Yang, L.; Tian, R.; Wang, Z.; Liu, Z.; Xie, P.; Feng, Q. Species differentiation and quality assessment of Radix Paeoniae Rubra (Chi-shao) by means of high-performance liquid chromatographic fingerprint. J. Chromatrogr. A 2009, 1216, 2163–2168. [Google Scholar] [CrossRef] [PubMed]
  6. Bae, J.Y.; Kim, C.Y.; Kim, H.J.; Park, J.H.; Ahn, M.J. Differences in the chemical profiles and biological activities of Paeonia lactiflora and Paeonia obovata. J. Med. Food 2015, 18, 224–232. [Google Scholar] [CrossRef] [PubMed] [Green Version]
  7. Jeong, S.Y.; Zhao, B.T.; Moo, D.C.; Kang, J.S.; Lee, J.H.; Min, B.S.; Son, J.K.; Woo, M.H. Quantitative analysis of bioactive marker compounds from Cinnamomi ramulus and Cinnamomi cortex by HPLC-UV. Nat. Prod. Sci. 2013, 19, 28–35. [Google Scholar]
  8. Wu, Y.P.; Meng, X.S.; Bao, Y.R.; Wang, S.; Kang, T.G. Simultaneous quantitative determination of nine active chemical compositions in traditional Chinese medicine Glycyrrhiza by RP-HPLC with full-time five-wavelength fusion method. Am. J. Chin. Med. 2013, 41, 211–219. [Google Scholar] [CrossRef] [PubMed]
  9. Zhou, S.; Cao, J.; Qiu, F.; Kong, W.; Yang, S.; Yang, M. Simultaneous determination of five bioactive components in Radix Glycyrrhizae by pressurized liquid extraction combined with UPLC-PDA and UPLC/ESI-QTOF-MS confirmation. Phytochem. Anal. 2013, 24, 527–533. [Google Scholar] [CrossRef] [PubMed]
  10. Wang, W.; Li, C.Y.; Wen, X.D.; Li, P.; Qi, L.W. Simultaneous determination of 6-gingerol, 8-gingerol, 10-gingerol and 6-shogaol in rat plasma by liquid chromatography-mass spectrometry: Application to pharmacokinetics. J. Chromtogr. B 2009, 877, 671–679. [Google Scholar] [CrossRef] [PubMed]
  11. Liu, J.; Chen, B.; Yao, S. Simultaneous analysis and identification of main bioactive constituents in extract of Zizyphus jujube var. saponosa (Zizyphi spinose semen) by high-performance liquid chromatography–photodiode array detection–electrospray mass spectrometry. Talanta 2007, 71, 668–675. [Google Scholar] [CrossRef] [PubMed]
  12. Shinilbooks Committee. The Korean Herbal Pharmacopoeia, 5th ed.; Shinilbooks: Seoul, Korean, 2016; p. 28. [Google Scholar]
  13. Lee, K.H. The Dispensatory on the Visual and Organoleptic Examination of Herbal Medicine; National Institute of Food and Drug Safety Evaluation: Seoul, Korean, 2013; pp. 24–529.
  14. Seo, C.S.; Yoo, S.R.; Jeong, S.J.; Ha, H. Quantification of the constituents of the traditional Korea medicine, Samryeongbaekchul-san, and assessment of its antiadipogenic effect. Saudi Pharm. J. 2019, 27, 145–153. [Google Scholar] [CrossRef]
  15. Seo, C.S.; Shin, H.K. Simultaneous determination of 12 marker components in Yeonkyopaedok-san using HPLC-PDA and LC-MS/MS. Appl. Sci. 2020, 10, 1713. [Google Scholar] [CrossRef] [Green Version]
  16. Jung, M.Y.; Seo, C.S.; Baek, S.E.; Lee, J.; Shin, M.S.; Kang, K.S.; Lee, S.; Yoo, J.E. Analysis and identification of active compounds from Gami-Soyosan toxic to MCF-7 human breast adenocarcinoma cells. Biomolecules 2019, 9, 272. [Google Scholar] [CrossRef] [PubMed] [Green Version]
  17. Seo, C.S.; Shin, H.K. Quality assessment of traditional herbal formula, Hyeonggaeyeongyo-tang through simultaneous determination of twenty marker components by HPLC-PDA and LC-MS/MS. Saudi Pharm. J. 2020, 28, 427–439. [Google Scholar] [CrossRef] [PubMed]
  18. International Conference on Harmonisation (ICH), Q2B, Validation of Analytical Procedures: Methodology. November 1996. Available online: https://www.fda.gov/media/71725/download (accessed on 20 October 2020).
  19. U.S. Food and Drug Administration. Reviewer Guidance, Validation of Chromatographic Methods; Center for Drug Evaluation and Research: Rockville, MD, USA, November 1994.
Figure 1. High-performance liquid chromatography (HPLC) chromatograms of mixtures of the 12 marker analytes (A), distilled water extract of the freeze-dried Sogunjung-tang (SGJT) sample (B), and 70% methanol extract of the freeze-dried SGJT sample (C). Gallic acid (GA) (1), albiflorin (ALB) (2), paeoniflorin (PAE) (3), liquiritin apioside (LIAP) (4), liquiritin (PIQ) (5), benzoic acid (BA) (6), coumarin (COU) (7), liquiritigenin (LIQG) (8), cinnamic acid (CINA) (9), benzoylpaeoniflorin (BPAE) (10), cinnamaldehyde (CINDA) (11), and glycyrrhizinic acid (GLYA) (12).
Applsci 10 08561 g001
Table 1. Linear range, regression equation, coefficient of determination (r2), limit of detection (LOD), and limit of quantification (LOQ) for marker analytes (n = 3).
AnalyteDetection (nm)Linear Range (μg/mL)Regression Equation a y = ax + br2LOD (μg/mL)LOQ (μg/mL)
GA2702.34–150.00y = 36029x + 34891.00000.481.45
ALB2301.56–100.00y = 12082x + 36880.99990.090.28
PAE2301.56–100.00y = 16689x − 39571.00000.361.10
LIAP2752.34–150.00y = 14590x + 149650.99980.732.22
LIQ2750.78–50.00y = 20076x + 67420.99980.240.74
BA2301.56–100.00y = 58651x + 471230.99920.140.42
COU2750.47–30.00y = 54905x + 110610.99980.140.43
LIQG2750.31–20.00y = 32274x + 42600.99980.090.27
CINA2750.47–30.00y = 98151x + 195210.99980.140.42
BPAE2300.78–50.00y = 18991x + 31900.99990.040.12
CINAD2862.34–150.00y = 140874.41x + 213313.780.99910.571.72
GLYA2540.78–50.00y = 8373.26x + 14782.350.99990.220.66
ay: peak area (mAU) of compounds; x: concentration (μg/mL) of compounds.
Table 2. Extract recovery tests for the 12 marker analytes in SGJT.
AnalyteSpiked Amount (μg/mL)Found Amount (μg/mL)Recovery (%)SDRSD (%)
GA8.007.9399.091.211.23
20.0020.66103.302.192.12
40.0039.3898.460.410.42
ALB4.004.02100.500.950.95
10.009.7597.451.021.04
20.0019.2996.460.400.41
PAE6.006.01100.180.600.59
15.0014.3695.740.330.35
30.0029.0496.790.270.28
LIAP8.007.8698.291.741.77
20.0020.26101.321.131.11
40.0039.4698.660.580.58
LIQ2.002.04102.051.751.72
5.005.05100.920.740.73
10.0010.14101.361.711.68
BA6.005.7996.470.780.81
15.0015.10100.681.021.01
30.0029.7299.060.820.83
COU1.001.00100.141.101.10
2.002.03101.341.641.61
4.003.8897.090.850.88
LIQG1.001.02101.692.062.03
2.001.9698.071.231.25
4.003.9999.690.980.98
CINA1.001.01101.141.291.28
2.002.01100.402.262.25
4.004.08101.940.970.95
BPAE2.002.01100.461.121.11
5.004.9398.701.601.62
10.0010.06100.651.461.45
CINAD12.0011.5195.920.750.78
30.0032.68108.922.011.84
60.0058.0196.681.171.21
GLYA2.002.02101.151.511.49
5.004.9598.971.321.33
10.005.1199.292.492.51
Table 3. Precision of the analytical method for the 12 marker analytes in SGJT.
AnalyteConc. (μg/mL)Intraday (n = 5)Interday (n = 5)Repeatability (n = 6)
Observed Conc. (μg/mL)Precision (%) aAccuracy (%)Observed Conc. (μg/mL)Precision (%)Accuracy (%)RSD (%) of Retention TimeRSD (%) of Peak Area
GA37.537.280.9199.4137.090.8798.900.040.58
75.074.460.6299.2975.021.20100.02
150.0151.780.52101.19152.240.90101.50
ALB25.025.451.07101.8125.510.98102.060.030.68
50.050.480.46100.9751.141.32102.28
100.0100.740.50100.74101.400.91101.40
PAE25.024.950.7999.7924.990.7099.970.030.39
50.050.140.73100.2850.511.14101.02
100.0101.480.40101.48102.150.88102.15
LIAP37.538.530.67102.7538.640.72103.030.030.54
75.076.531.15102.0477.081.15102.77
150.0151.770.48101.18152.550.83101.70
LIQ12.512.840.79102.7212.880.79103.070.030.57
25.025.521.22102.0725.701.18102.81
50.050.580.41101.1550.850.82101.70
BA25.026.020.74104.0825.840.92103.340.020.55
50.051.160.44102.3251.540.89103.07
100.0100.380.42100.38100.840.76100.84
COU7.57.690.67102.597.720.66102.940.020.54
15.015.301.08102.0015.411.07102.72
30.030.290.40100.9730.440.76101.46
LIQG5.05.140.81102.805.150.72103.040.020.57
10.010.201.20102.0510.281.18102.80
20.020.230.44101.1520.330.82101.66
CINA7.57.700.75102.647.720.70102.880.020.57
15.015.281.13101.8815.391.14102.60
30.030.330.40101.0930.490.81101.62
BPAE12.512.780.68102.2512.741.04101.950.020.84
25.025.390.73101.5725.560.96102.25
50.050.610.30101.2250.910.82101.83
CINAD37.538.380.63102.3538.560.65102.840.010.55
75.076.831.01102.4477.441.02103.25
150.0150.290.34100.19150.940.61100.63
GLYA12.512.621.59100.9512.511.20100.100.010.57
25.025.550.56102.2025.331.07101.31
50.049.820.2799.6449.720.6599.43
a Precision is expressed as RSD (%) = (SD/mean) × 100.
Table 4. Amounts of the 12 marker analytes in SGJT according to extraction solvents (n = 3).
AnalyteExtraction Solvent
Distilled Water70% Methanol
Mean (mg/g)SD (×10−1)RSD (%)Mean (mg/g)SD (×10−1)RSD (%)
GA4.020.230.564.340.100.23
ALB22.100.720.3321.601.080.50
PAE32.830.140.0432.521.000.31
LIAP3.810.441.164.550.731.61
LIQ0.650.040.650.840.010.09
BA3.380.030.083.450.040.12
COU0.580.010.150.700.010.08
LIQG0.100.010.580.190.021.07
CINA0.600.030.460.630.010.14
BPAE1.250.110.911.320.040.32
CINAD6.340.250.396.390.290.45
GLYA7.500.971.307.580.911.20
Publisher’s Note: MDPI stays neutral with regard to jurisdictional claims in published maps and institutional affiliations.

